On Wednesday, the United States reported over 52,000 new cases, the highest single-day total since the pandemic reached American shores. Addressing Congress on Tuesday, Dr. Anthony Fauci, the nation’s leading infectious disease expert, suggested that the number of new cases could rise as high as 100,000 per day.
This latest surge in cases has not been even across the country, as many states and cities have reported encouraging declines in daily new cases in recent weeks. Other states, however, primarily those that had relatively few cases during the early days of the pandemic, now are being overwhelmed with a spike in new cases.
Using data from state and local health departments, 24/7 Wall St. compiled and reviewed the average of new daily confirmed COVID-19 cases for the week ending June 29 and compared it to the average of new daily cases from the previous week to determine the 30 counties or county equivalents where the virus is growing the fastest. We excluded counties with populations of fewer than 5,000 people, as well as those with fewer than 20 reported new cases in the past 14 days.
In the United States, the average number of new daily cases per capita has increased from 7.6 per 100,000 during the week ending June 22 to 10.5 per 100,000 in the week ending June 29, an increase of 2.9 daily new cases per 100,000 people. In the counties on this list the average number of daily new cases increased by at least 20 per 100,000 people week over week — more than seven times the national increase. One county on this list reported an increase of 129 daily new cases per 100,000 residents over the last week.
These 30 counties and county equivalents are concentrated in 13 states. By far, the state with the most counties with alarming COVID-19 growth is Mississippi, which has 10 counties on this list, followed by Texas with four, and Florida and Georgia with three each. All of these counties are in states where the virus is also spreading the fastest.
Click here to see the counties where COVID-19 is growing the fastest

30. Lavaca County, Texas
> Change in daily avg. new COVID-19 cases week over week: +23.5 per 100,000 people
> Avg. new daily cases in Lavaca County in 7 days ending June 29: 44.1 per 100,000
> Avg. new daily cases in Lavaca County in 7 days ending June 22: 20.6 per 100,000
> Avg. new daily cases in Texas in 7 days ending June 29: 16.6 per 100,000 — 6th most
> Confirmed COVID-19 cases in Lavaca County as of June 29: 617 per 100,000 people (total: 123)
> Population: 19,941
> Largest place in Lavaca County: Yoakum
[in-text-ad]
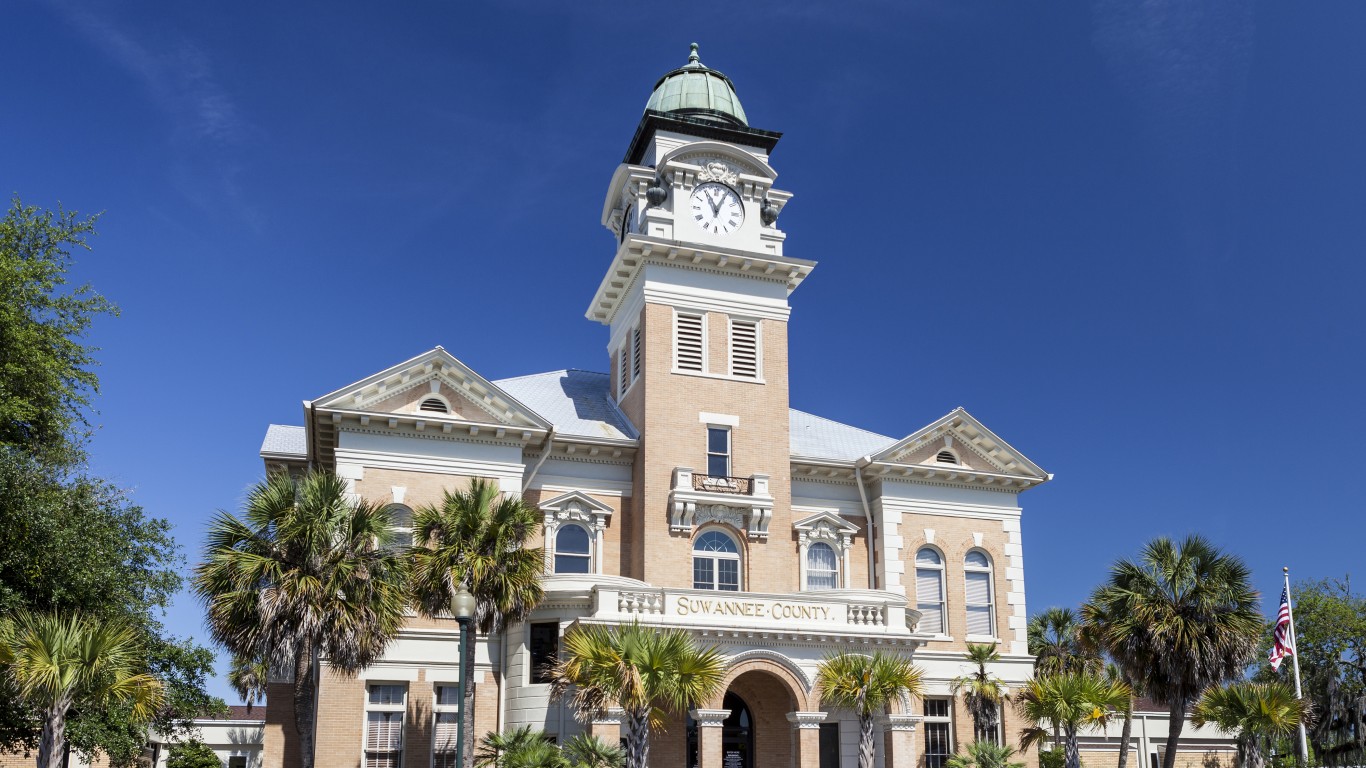
29. Suwannee County, Florida
> Change in daily avg. new COVID-19 cases week over week: +24.6 per 100,000 people
> Avg. new daily cases in Suwannee County in 7 days ending June 29: 44.4 per 100,000
> Avg. new daily cases in Suwannee County in 7 days ending June 22: 19.8 per 100,000
> Avg. new daily cases in Florida in 7 days ending June 29: 23.0 per 100,000 — 2nd most
> Confirmed COVID-19 cases in Suwannee County as of June 29: 999 per 100,000 people (total: 439)
> Population: 43,924
> Largest place in Suwannee County: Live Oak
[recirclink id=716251]

28. Copiah County, Mississippi
> Change in daily avg. new COVID-19 cases week over week: +24.6 per 100,000 people
> Avg. new daily cases in Copiah County in 7 days ending June 29: 47.7 per 100,000
> Avg. new daily cases in Copiah County in 7 days ending June 22: 23.1 per 100,000
> Avg. new daily cases in Mississippi in 7 days ending June 29: 19.3 per 100,000 — 4th most
> Confirmed COVID-19 cases in Copiah County as of June 29: 1,943 per 100,000 people (total: 558)
> Population: 28,721
> Largest place in Copiah County: Crystal Springs

27. Atkinson County, Georgia
> Change in daily avg. new COVID-19 cases week over week: +24.7 per 100,000 people
> Avg. new daily cases in Atkinson County in 7 days ending June 29: 54.6 per 100,000
> Avg. new daily cases in Atkinson County in 7 days ending June 22: 29.9 per 100,000
> Avg. new daily cases in Georgia in 7 days ending June 29: 15.0 per 100,000 — 9th most
> Confirmed COVID-19 cases in Atkinson County as of June 29: 1,682 per 100,000 people (total: 139)
> Population: 8,265
> Largest place in Atkinson County: Pearson
[in-text-ad-2]
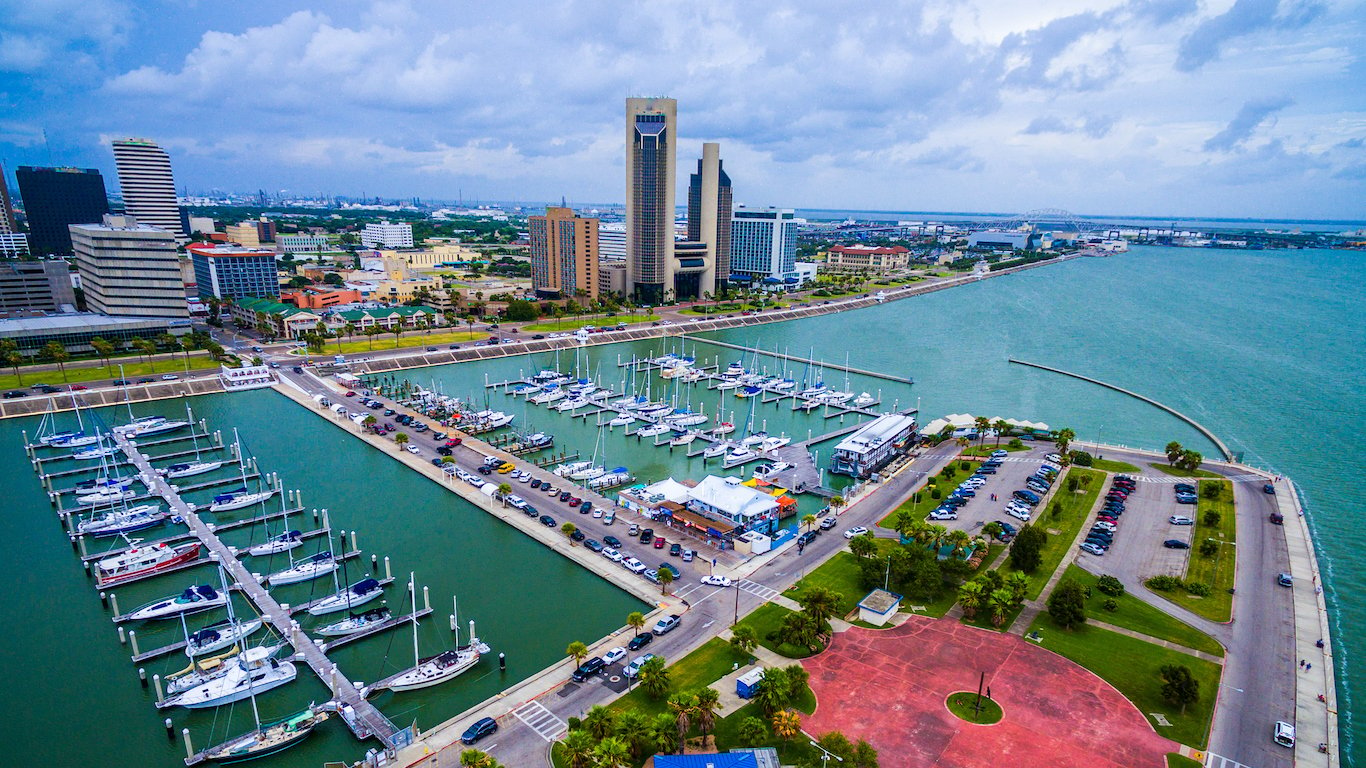
26. Nueces County, Texas
> Change in daily avg. new COVID-19 cases week over week: +24.8 per 100,000 people
> Avg. new daily cases in Nueces County in 7 days ending June 29: 31.6 per 100,000
> Avg. new daily cases in Nueces County in 7 days ending June 22: 6.8 per 100,000
> Avg. new daily cases in Texas in 7 days ending June 29: 16.6 per 100,000 — 6th most
> Confirmed COVID-19 cases in Nueces County as of June 29: 531 per 100,000 people (total: 1,915)
> Population: 360,486
> Largest place in Nueces County: Corpus Christi

25. Pocahontas County, Iowa
> Change in daily avg. new COVID-19 cases week over week: +25.1 per 100,000 people
> Avg. new daily cases in Pocahontas County in 7 days ending June 29: 37.6 per 100,000
> Avg. new daily cases in Pocahontas County in 7 days ending June 22: 12.4 per 100,000
> Avg. new daily cases in Iowa in 7 days ending June 29: 11.0 per 100,000 — 15th most
> Confirmed COVID-19 cases in Pocahontas County as of June 29: 1,015 per 100,000 people (total: 70)
> Population: 6,898
> Largest place in Pocahontas County: Pocahontas
[in-text-ad]
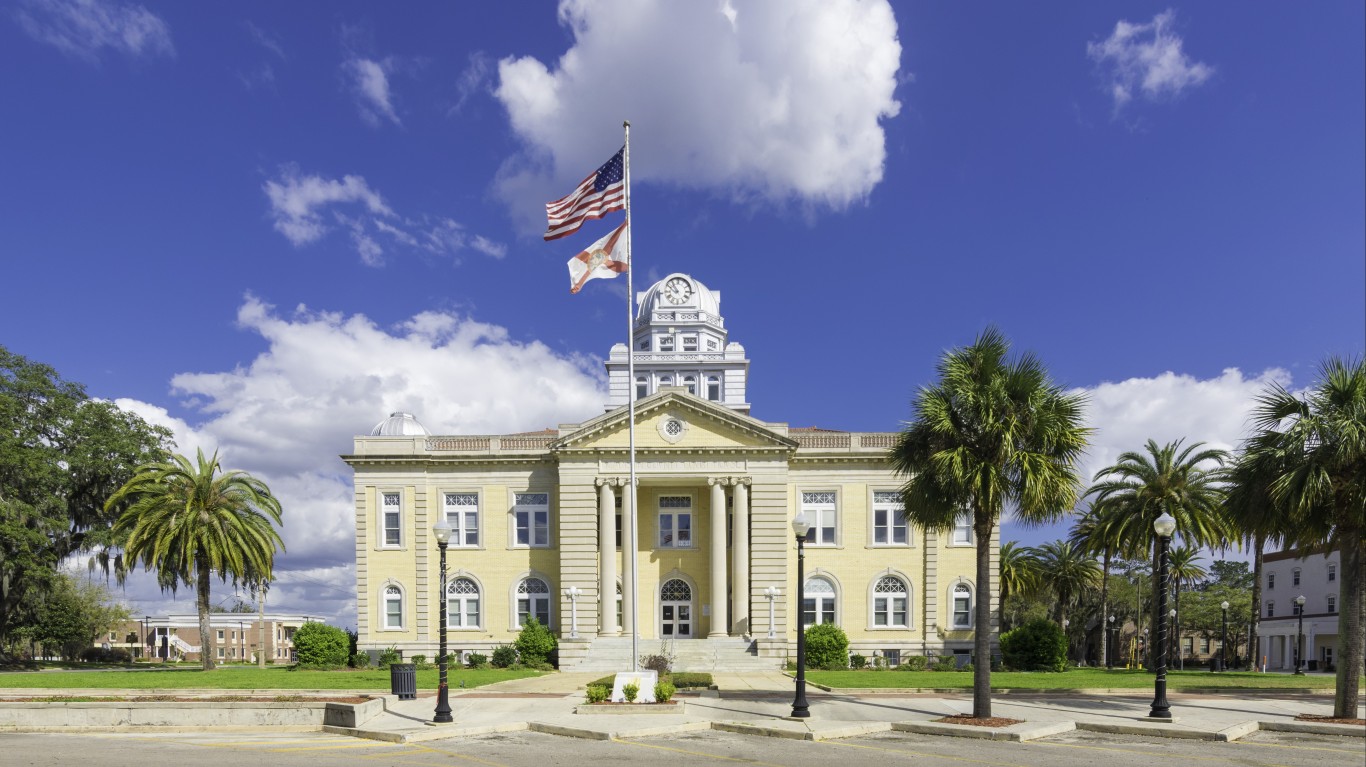
24. Madison County, Florida
> Change in daily avg. new COVID-19 cases week over week: +25.2 per 100,000 people
> Avg. new daily cases in Madison County in 7 days ending June 29: 47.9 per 100,000
> Avg. new daily cases in Madison County in 7 days ending June 22: 22.8 per 100,000
> Avg. new daily cases in Florida in 7 days ending June 29: 23.0 per 100,000 — 2nd most
> Confirmed COVID-19 cases in Madison County as of June 29: 1,034 per 100,000 people (total: 191)
> Population: 18,474
> Largest place in Madison County: Madison
[recirclink id=716181]

23. Walthall County, Mississippi
> Change in daily avg. new COVID-19 cases week over week: +25.3 per 100,000 people
> Avg. new daily cases in Walthall County in 7 days ending June 29: 44.6 per 100,000
> Avg. new daily cases in Walthall County in 7 days ending June 22: 19.3 per 100,000
> Avg. new daily cases in Mississippi in 7 days ending June 29: 19.3 per 100,000 — 4th most
> Confirmed COVID-19 cases in Walthall County as of June 29: 1,151 per 100,000 people (total: 168)
> Population: 14,601
> Largest place in Walthall County: Tylertown

22. Carroll County, Mississippi
> Change in daily avg. new COVID-19 cases week over week: +25.4 per 100,000 people
> Avg. new daily cases in Carroll County in 7 days ending June 29: 27.4 per 100,000
> Avg. new daily cases in Carroll County in 7 days ending June 22: 2.0 per 100,000
> Avg. new daily cases in Mississippi in 7 days ending June 29: 19.3 per 100,000 — 4th most
> Confirmed COVID-19 cases in Carroll County as of June 29: 1,471 per 100,000 people (total: 149)
> Population: 10,129
> Largest place in Carroll County: Vaiden
[in-text-ad-2]

21. Yazoo County, Mississippi
> Change in daily avg. new COVID-19 cases week over week: +26.1 per 100,000 people
> Avg. new daily cases in Yazoo County in 7 days ending June 29: 37.5 per 100,000
> Avg. new daily cases in Yazoo County in 7 days ending June 22: 11.4 per 100,000
> Avg. new daily cases in Mississippi in 7 days ending June 29: 19.3 per 100,000 — 4th most
> Confirmed COVID-19 cases in Yazoo County as of June 29: 1,623 per 100,000 people (total: 454)
> Population: 27,974
> Largest place in Yazoo County: Yazoo City

20. Charleston County, South Carolina
> Change in daily avg. new COVID-19 cases week over week: +26.2 per 100,000 people
> Avg. new daily cases in Charleston County in 7 days ending June 29: 48.0 per 100,000
> Avg. new daily cases in Charleston County in 7 days ending June 22: 21.8 per 100,000
> Avg. new daily cases in South Carolina in 7 days ending June 29: 22.0 per 100,000 — 3rd most
> Confirmed COVID-19 cases in Charleston County as of June 29: 926 per 100,000 people (total: 3,654)
> Population: 394,708
> Largest place in Charleston County: Charleston
[in-text-ad]

19. Pontotoc County, Mississippi
> Change in daily avg. new COVID-19 cases week over week: +26.3 per 100,000 people
> Avg. new daily cases in Pontotoc County in 7 days ending June 29: 38.6 per 100,000
> Avg. new daily cases in Pontotoc County in 7 days ending June 22: 12.4 per 100,000
> Avg. new daily cases in Mississippi in 7 days ending June 29: 19.3 per 100,000 — 4th most
> Confirmed COVID-19 cases in Pontotoc County as of June 29: 648 per 100,000 people (total: 203)
> Population: 31,315
> Largest place in Pontotoc County: Pontotoc
[recirclink id=715818]

18. Stewart County, Georgia
> Change in daily avg. new COVID-19 cases week over week: +27.4 per 100,000 people
> Avg. new daily cases in Stewart County in 7 days ending June 29: 66.2 per 100,000
> Avg. new daily cases in Stewart County in 7 days ending June 22: 38.8 per 100,000
> Avg. new daily cases in Georgia in 7 days ending June 29: 15.0 per 100,000 — 9th most
> Confirmed COVID-19 cases in Stewart County as of June 29: 1,870 per 100,000 people (total: 113)
> Population: 6,042
> Largest place in Stewart County: Richland

17. Glynn County, Georgia
> Change in daily avg. new COVID-19 cases week over week: +28.1 per 100,000 people
> Avg. new daily cases in Glynn County in 7 days ending June 29: 40.3 per 100,000
> Avg. new daily cases in Glynn County in 7 days ending June 22: 12.3 per 100,000
> Avg. new daily cases in Georgia in 7 days ending June 29: 15.0 per 100,000 — 9th most
> Confirmed COVID-19 cases in Glynn County as of June 29: 651 per 100,000 people (total: 547)
> Population: 83,974
> Largest place in Glynn County: Brunswick
[in-text-ad-2]

16. Humphreys County, Mississippi
> Change in daily avg. new COVID-19 cases week over week: +28.7 per 100,000 people
> Avg. new daily cases in Humphreys County in 7 days ending June 29: 37.8 per 100,000
> Avg. new daily cases in Humphreys County in 7 days ending June 22: 9.1 per 100,000
> Avg. new daily cases in Mississippi in 7 days ending June 29: 19.3 per 100,000 — 4th most
> Confirmed COVID-19 cases in Humphreys County as of June 29: 1,347 per 100,000 people (total: 115)
> Population: 8,539
> Largest place in Humphreys County: Belzoni

15. Watonwan County, Minnesota
> Change in daily avg. new COVID-19 cases week over week: +29.0 per 100,000 people
> Avg. new daily cases in Watonwan County in 7 days ending June 29: 74.0 per 100,000
> Avg. new daily cases in Watonwan County in 7 days ending June 22: 45.0 per 100,000
> Avg. new daily cases in Minnesota in 7 days ending June 29: 6.5 per 100,000 — 21st most
> Confirmed COVID-19 cases in Watonwan County as of June 29: 1,823 per 100,000 people (total: 200)
> Population: 10,973
> Largest place in Watonwan County: St. James
[in-text-ad]

14. Winston County, Mississippi
> Change in daily avg. new COVID-19 cases week over week: +30.3 per 100,000 people
> Avg. new daily cases in Winston County in 7 days ending June 29: 43.6 per 100,000
> Avg. new daily cases in Winston County in 7 days ending June 22: 13.2 per 100,000
> Avg. new daily cases in Mississippi in 7 days ending June 29: 19.3 per 100,000 — 4th most
> Confirmed COVID-19 cases in Winston County as of June 29: 1,253 per 100,000 people (total: 230)
> Population: 18,358
> Largest place in Winston County: Louisville
[recirclink id=715663]

13. McCurtain County, Oklahoma
> Change in daily avg. new COVID-19 cases week over week: +30.9 per 100,000 people
> Avg. new daily cases in McCurtain County in 7 days ending June 29: 72.0 per 100,000
> Avg. new daily cases in McCurtain County in 7 days ending June 22: 41.1 per 100,000
> Avg. new daily cases in Oklahoma in 7 days ending June 29: 9.3 per 100,000 — 16th most
> Confirmed COVID-19 cases in McCurtain County as of June 29: 1,323 per 100,000 people (total: 436)
> Population: 32,966
> Largest place in McCurtain County: Idabel

12. Sunflower County, Mississippi
> Change in daily avg. new COVID-19 cases week over week: +35.1 per 100,000 people
> Avg. new daily cases in Sunflower County in 7 days ending June 29: 45.1 per 100,000
> Avg. new daily cases in Sunflower County in 7 days ending June 22: 10.0 per 100,000
> Avg. new daily cases in Mississippi in 7 days ending June 29: 19.3 per 100,000 — 4th most
> Confirmed COVID-19 cases in Sunflower County as of June 29: 931 per 100,000 people (total: 247)
> Population: 26,532
> Largest place in Sunflower County: Indianola
[in-text-ad-2]

11. Yell County, Arkansas
> Change in daily avg. new COVID-19 cases week over week: +35.9 per 100,000 people
> Avg. new daily cases in Yell County in 7 days ending June 29: 97.6 per 100,000
> Avg. new daily cases in Yell County in 7 days ending June 22: 61.8 per 100,000
> Avg. new daily cases in Arkansas in 7 days ending June 29: 19.0 per 100,000 — 5th most
> Confirmed COVID-19 cases in Yell County as of June 29: 2,740 per 100,000 people (total: 591)
> Population: 21,573
> Largest place in Yell County: Dardanelle

10. Dallam County, Texas
> Change in daily avg. new COVID-19 cases week over week: +36.1 per 100,000 people
> Avg. new daily cases in Dallam County in 7 days ending June 29: 61.7 per 100,000
> Avg. new daily cases in Dallam County in 7 days ending June 22: 25.6 per 100,000
> Avg. new daily cases in Texas in 7 days ending June 29: 16.6 per 100,000 — 6th most
> Confirmed COVID-19 cases in Dallam County as of June 29: 1,160 per 100,000 people (total: 84)
> Population: 7,243
> Largest place in Dallam County: Dalhart
[in-text-ad]
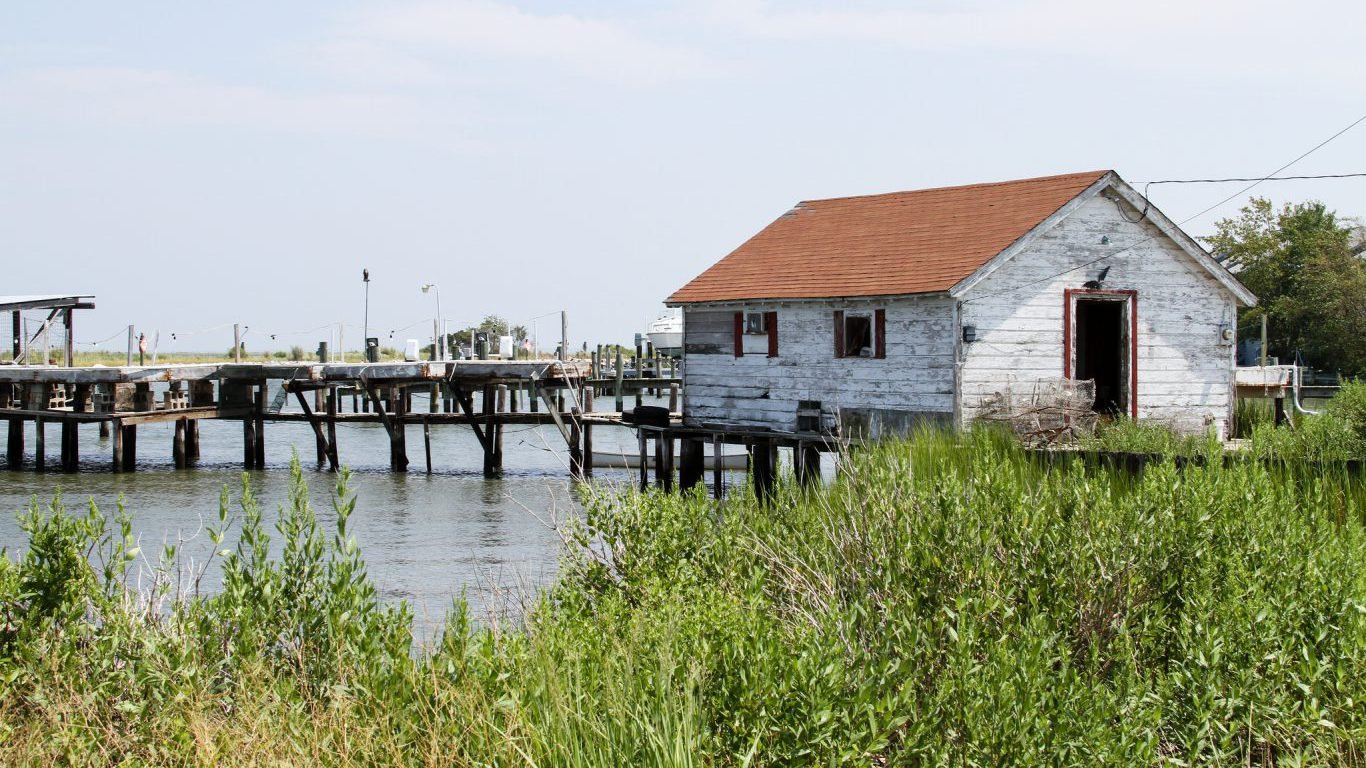
9. Somerset County, Maryland
> Change in daily avg. new COVID-19 cases week over week: +41.4 per 100,000 people
> Avg. new daily cases in Somerset County in 7 days ending June 29: 43.9 per 100,000
> Avg. new daily cases in Somerset County in 7 days ending June 22: 2.5 per 100,000
> Avg. new daily cases in Maryland in 7 days ending June 29: 6.0 per 100,000 — 25th fewest
> Confirmed COVID-19 cases in Somerset County as of June 29: 338 per 100,000 people (total: 87)
> Population: 25,737
> Largest place in Somerset County: Princess Anne
[recirclink id=715584]

8. Grenada County, Mississippi
> Change in daily avg. new COVID-19 cases week over week: +48.3 per 100,000 people
> Avg. new daily cases in Grenada County in 7 days ending June 29: 64.5 per 100,000
> Avg. new daily cases in Grenada County in 7 days ending June 22: 16.2 per 100,000
> Avg. new daily cases in Mississippi in 7 days ending June 29: 19.3 per 100,000 — 4th most
> Confirmed COVID-19 cases in Grenada County as of June 29: 1,668 per 100,000 people (total: 355)
> Population: 21,278
> Largest place in Grenada County: Grenada

7. Brewster County, Texas
> Change in daily avg. new COVID-19 cases week over week: +48.7 per 100,000 people
> Avg. new daily cases in Brewster County in 7 days ending June 29: 79.3 per 100,000
> Avg. new daily cases in Brewster County in 7 days ending June 22: 30.6 per 100,000
> Avg. new daily cases in Texas in 7 days ending June 29: 16.6 per 100,000 — 6th most
> Confirmed COVID-19 cases in Brewster County as of June 29: 922 per 100,000 people (total: 85)
> Population: 9,216
> Largest place in Brewster County: Alpine
[in-text-ad-2]

6. Kings County, California
> Change in daily avg. new COVID-19 cases week over week: +57.4 per 100,000 people
> Avg. new daily cases in Kings County in 7 days ending June 29: 82.5 per 100,000
> Avg. new daily cases in Kings County in 7 days ending June 22: 25.0 per 100,000
> Avg. new daily cases in California in 7 days ending June 29: 12.7 per 100,000 — 12th most
> Confirmed COVID-19 cases in Kings County as of June 29: 1,519 per 100,000 people (total: 2,280)
> Population: 150,075
> Largest place in Kings County: Hanford

5. Claiborne County, Mississippi
> Change in daily avg. new COVID-19 cases week over week: +63.1 per 100,000 people
> Avg. new daily cases in Claiborne County in 7 days ending June 29: 82.1 per 100,000
> Avg. new daily cases in Claiborne County in 7 days ending June 22: 19.0 per 100,000
> Avg. new daily cases in Mississippi in 7 days ending June 29: 19.3 per 100,000 — 4th most
> Confirmed COVID-19 cases in Claiborne County as of June 29: 2,412 per 100,000 people (total: 220)
> Population: 9,120
> Largest place in Claiborne County: Port Gibson
[in-text-ad]

4. Holmes County, Florida
> Change in daily avg. new COVID-19 cases week over week: +70.2 per 100,000 people
> Avg. new daily cases in Holmes County in 7 days ending June 29: 78.3 per 100,000
> Avg. new daily cases in Holmes County in 7 days ending June 22: 8.1 per 100,000
> Avg. new daily cases in Florida in 7 days ending June 29: 23.0 per 100,000 — 2nd most
> Confirmed COVID-19 cases in Holmes County as of June 29: 829 per 100,000 people (total: 161)
> Population: 19,430
> Largest place in Holmes County: Bonifay
[recirclink id=716251]

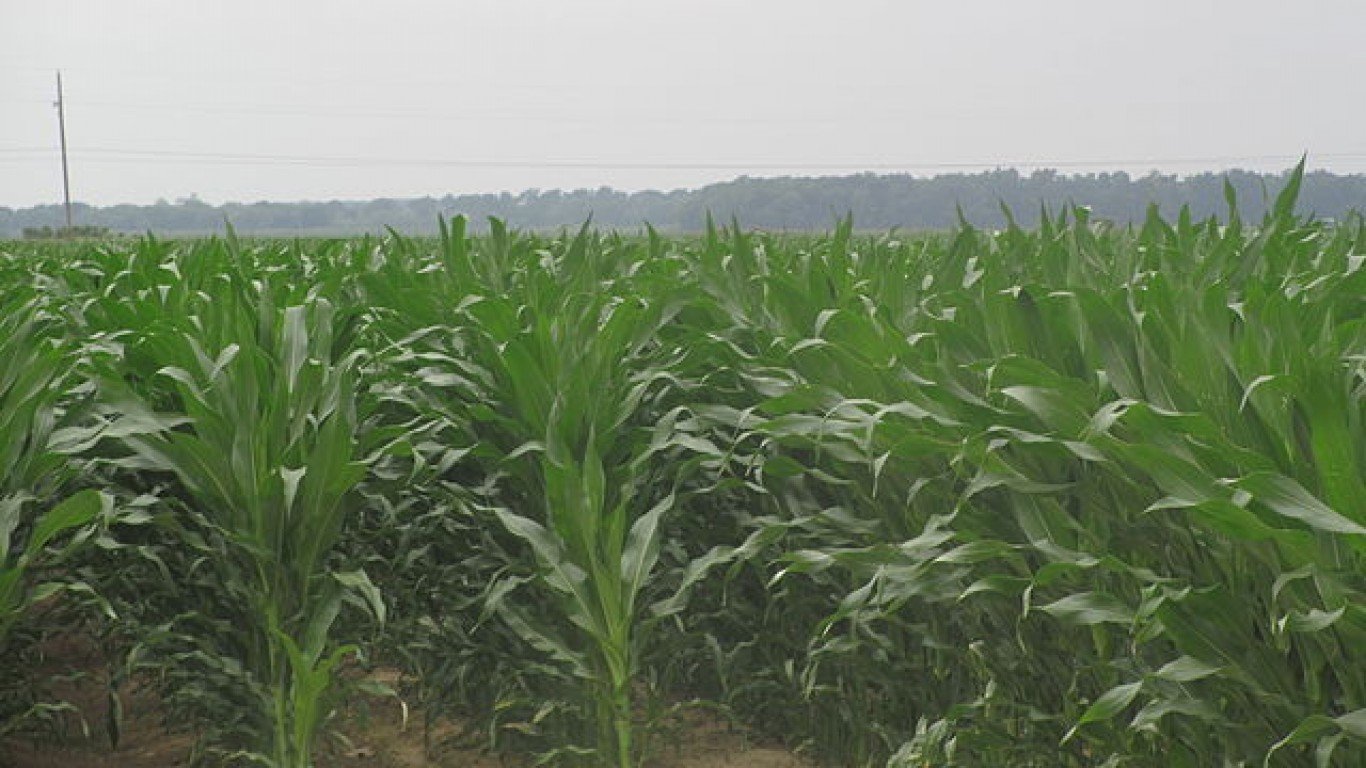
3. McDonald County, Missouri
> Change in daily avg. new COVID-19 cases week over week: +80.3 per 100,000 people
> Avg. new daily cases in McDonald County in 7 days ending June 29: 166.8 per 100,000
> Avg. new daily cases in McDonald County in 7 days ending June 22: 86.5 per 100,000
> Avg. new daily cases in Missouri in 7 days ending June 29: 5.6 per 100,000 — 22nd fewest
> Confirmed COVID-19 cases in McDonald County as of June 29: 2,182 per 100,000 people (total: 498)
> Population: 22,827
> Largest place in McDonald County: Anderson
2. East Carroll Parish, Louisiana
> Change in daily avg. new COVID-19 cases week over week: +122.3 per 100,000 people
> Avg. new daily cases in East Carroll Parish in 7 days ending June 29: 243.5 per 100,000
> Avg. new daily cases in East Carroll Parish in 7 days ending June 22: 121.2 per 100,000
> Avg. new daily cases in Louisiana in 7 days ending June 29: 16.4 per 100,000 — 7th most
> Confirmed COVID-19 cases in East Carroll Parish as of June 29: 5,979 per 100,000 people (total: 432)
> Population: 7,225
> Largest place in East Carroll Parish: Lake Providence
[in-text-ad-2]

1. Hot Spring County, Arkansas
> Change in daily avg. new COVID-19 cases week over week: +129.2 per 100,000 people
> Avg. new daily cases in Hot Spring County in 7 days ending June 29: 138.9 per 100,000
> Avg. new daily cases in Hot Spring County in 7 days ending June 22: 9.7 per 100,000
> Avg. new daily cases in Arkansas in 7 days ending June 29: 19.0 per 100,000 — 5th most
> Confirmed COVID-19 cases in Hot Spring County as of June 29: 1,277 per 100,000 people (total: 428)
> Population: 33,520
> Largest place in Hot Spring County: Malvern
Contact [email protected] for any questions or corrections.