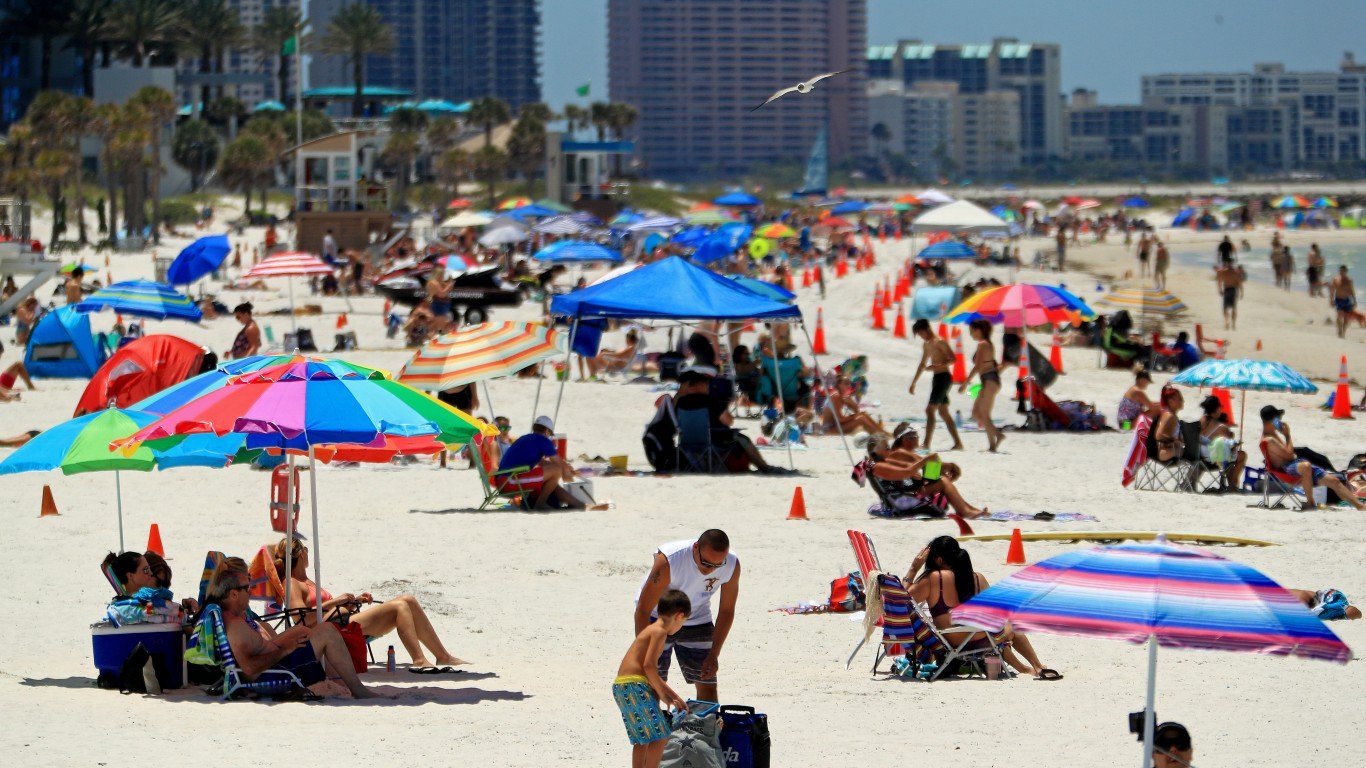
On Tuesday, the United States reported 60,000 new COVID-19 cases, the highest single-day total since the pandemic reached American shores. Addressing Congress last week, Dr. Anthony Fauci, the nation’s leading infectious disease expert, suggested that the number of new cases could rise as high as 100,000 per day.
This latest surge in cases has not been even across the country, as many states and cities have reported encouraging declines in daily new cases in recent weeks. Other states, however, primarily those that had relatively few cases during the early days of the pandemic, now are being overwhelmed with spikes in new cases.
Using data from state and local health departments, 24/7 Wall St. compiled and reviewed the average of new daily confirmed COVID-19 cases for the week ending July 7 and compared it to the average of new daily cases from the previous week to determine the 35 counties or county equivalents nationwide where the virus is growing the fastest. We excluded counties with populations of fewer than 5,000 people, as well as those with fewer than 20 reported new cases in the past 14 days.
In the United States, the average number of new daily cases per capita has increased from 11.1 per 100,000 during the week ending June 30 to 14.8 per 100,000 in the week ending July 7, an increase of 3.7 daily new cases per 100,000 people. In the counties on this list, the average number of daily new cases increased by at least 22 per 100,000 people week over week — more than seven times the national increase. One county on this list reported an increase of 148.5 daily new cases per 100,000 residents over the last week.
These 35 counties and county equivalents are concentrated in 14 states, the majority of which are in the South. The state with the most counties with alarming COVID-19 growth is Texas, which has nine counties on this list, followed by Florida with six, and Georgia with five. Almost all the counties on this list are in states where the virus is also spreading the fastest.
Click here to see the counties where COVID-19 is growing the fastest

35. Jefferson County, Georgia
> Change in daily avg. new COVID-19 cases week over week: +22.5 per 100,000 people
> Avg. new daily cases in Jefferson County in 7 days ending July 7: 41 per 100,000
> Avg. new daily cases in Jefferson County in 7 days ending June 30: 18 per 100,000
> Avg. new daily cases in Georgia in 7 days ending July 7: 23 per 100,000 (5th most)
> Cumulative confirmed COVID-19 cases in Jefferson County as of July 7: 983 per 100,000 people (total: 155)
> COVID-19 related deaths as of July 7: 2
> Population: 15,772
> Largest place in Jefferson County: Louisville
[in-text-ad]

34. Pointe Coupee Parish, Louisiana
> Change in daily avg. new COVID-19 cases week over week: +22.7 per 100,000 people
> Avg. new daily cases in Pointe Coupee Parish in 7 days ending July 7: 30 per 100,000
> Avg. new daily cases in Pointe Coupee Parish in 7 days ending June 30: 7 per 100,000
> Avg. new daily cases in Louisiana in 7 days ending July 7: 26 per 100,000 (4th most)
> Cumulative confirmed COVID-19 cases in Pointe Coupee Parish as of July 7: 1,390 per 100,000 people (total: 308)
> COVID-19 related deaths as of July 7: 28
> Population: 22,158
> Largest place in Pointe Coupee Parish: New Roads
[recirclink id=717363]
33. Hamilton County, Florida
> Change in daily avg. new COVID-19 cases week over week: +23.0 per 100,000 people
> Avg. new daily cases in Hamilton County in 7 days ending July 7: 56 per 100,000
> Avg. new daily cases in Hamilton County in 7 days ending June 30: 33 per 100,000
> Avg. new daily cases in Florida in 7 days ending July 7: 38 per 100,000 (2nd most)
> Cumulative confirmed COVID-19 cases in Hamilton County as of July 7: 2,747 per 100,000 people (total: 392)
> COVID-19 related deaths as of July 7: 2
> Population: 14,269
> Largest place in Hamilton County: Jasper

32. Morrow County, Oregon
> Change in daily avg. new COVID-19 cases week over week: +23.5 per 100,000 people
> Avg. new daily cases in Morrow County in 7 days ending July 7: 51 per 100,000
> Avg. new daily cases in Morrow County in 7 days ending June 30: 27 per 100,000
> Avg. new daily cases in Oregon in 7 days ending July 7: 6 per 100,000 (20th fewest)
> Cumulative confirmed COVID-19 cases in Morrow County as of July 7: 972 per 100,000 people (total: 109)
> COVID-19 related deaths as of July 7: 1
> Population: 11,215
> Largest place in Morrow County: Boardman
[in-text-ad-2]

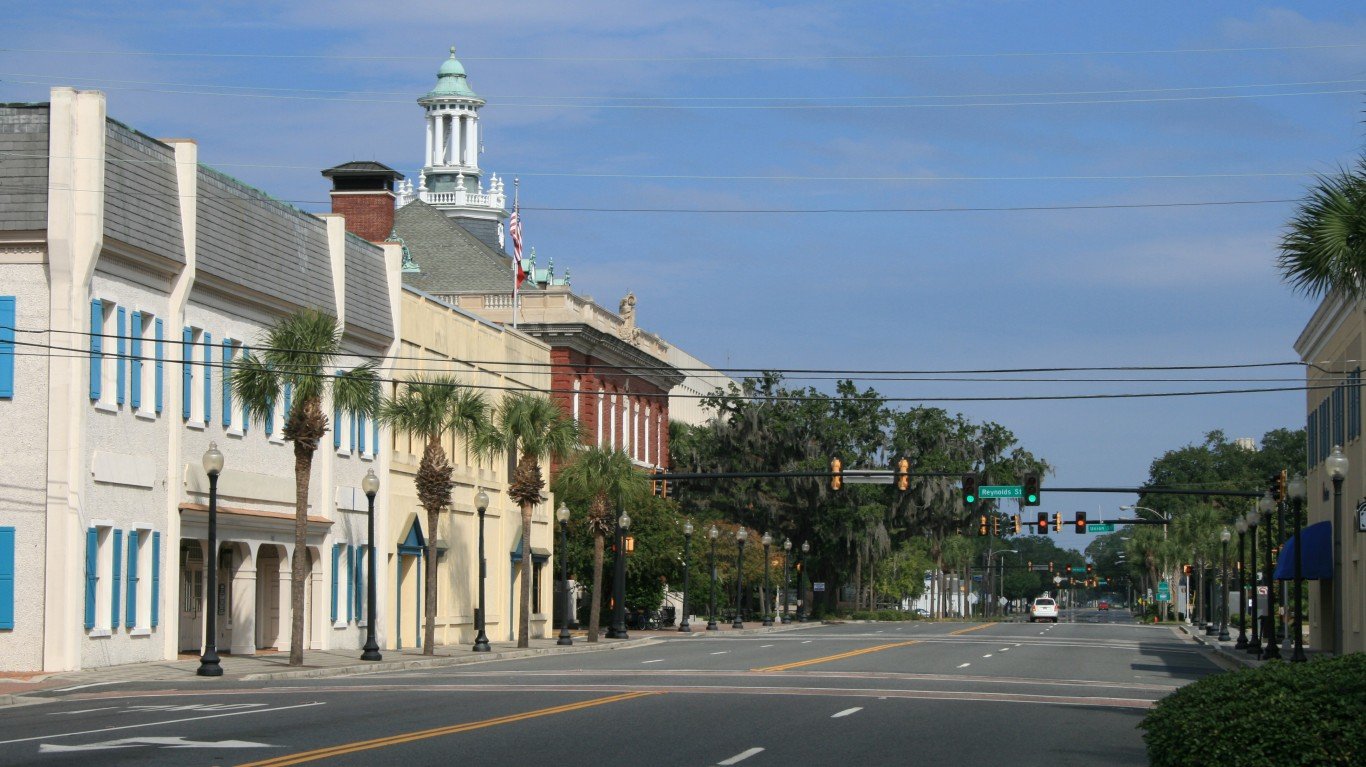
31. Charleston County, South Carolina
> Change in daily avg. new COVID-19 cases week over week: +23.5 per 100,000 people
> Avg. new daily cases in Charleston County in 7 days ending July 7: 75 per 100,000
> Avg. new daily cases in Charleston County in 7 days ending June 30: 52 per 100,000
> Avg. new daily cases in South Carolina in 7 days ending July 7: 31 per 100,000 (3rd most)
> Cumulative confirmed COVID-19 cases in Charleston County as of July 7: 1,539 per 100,000 people (total: 6,073)
> COVID-19 related deaths as of July 7: 41
> Population: 394,708
> Largest place in Charleston County: Charleston
30. Putnam County, Florida
> Change in daily avg. new COVID-19 cases week over week: +23.7 per 100,000 people
> Avg. new daily cases in Putnam County in 7 days ending July 7: 39 per 100,000
> Avg. new daily cases in Putnam County in 7 days ending June 30: 15 per 100,000
> Avg. new daily cases in Florida in 7 days ending July 7: 38 per 100,000 (2nd most)
> Cumulative confirmed COVID-19 cases in Putnam County as of July 7: 778 per 100,000 people (total: 566)
> COVID-19 related deaths as of July 7: 6
> Population: 72,766
> Largest place in Putnam County: Palatka
[in-text-ad]

29. Bibb County, Georgia
> Change in daily avg. new COVID-19 cases week over week: +24.0 per 100,000 people
> Avg. new daily cases in Bibb County in 7 days ending July 7: 36 per 100,000
> Avg. new daily cases in Bibb County in 7 days ending June 30: 12 per 100,000
> Avg. new daily cases in Georgia in 7 days ending July 7: 23 per 100,000 (5th most)
> Cumulative confirmed COVID-19 cases in Bibb County as of July 7: 877 per 100,000 people (total: 1,346)
> COVID-19 related deaths as of July 7: 41
> Population: 153,490
> Largest place in Bibb County: Macon
[recirclink id=717313]

28. Leon County, Florida
> Change in daily avg. new COVID-19 cases week over week: +24.3 per 100,000 people
> Avg. new daily cases in Leon County in 7 days ending July 7: 38 per 100,000
> Avg. new daily cases in Leon County in 7 days ending June 30: 14 per 100,000
> Avg. new daily cases in Florida in 7 days ending July 7: 38 per 100,000 (2nd most)
> Cumulative confirmed COVID-19 cases in Leon County as of July 7: 663 per 100,000 people (total: 1,911)
> COVID-19 related deaths as of July 7: 8
> Population: 288,102
> Largest place in Leon County: Tallahassee

27. Escambia County, Florida
> Change in daily avg. new COVID-19 cases week over week: +24.7 per 100,000 people
> Avg. new daily cases in Escambia County in 7 days ending July 7: 45 per 100,000
> Avg. new daily cases in Escambia County in 7 days ending June 30: 20 per 100,000
> Avg. new daily cases in Florida in 7 days ending July 7: 38 per 100,000 (2nd most)
> Cumulative confirmed COVID-19 cases in Escambia County as of July 7: 982 per 100,000 people (total: 3,059)
> COVID-19 related deaths as of July 7: 48
> Population: 311,522
> Largest place in Escambia County: Pensacola
[in-text-ad-2]

26. Matagorda County, Texas
> Change in daily avg. new COVID-19 cases week over week: +25.1 per 100,000 people
> Avg. new daily cases in Matagorda County in 7 days ending July 7: 41 per 100,000
> Avg. new daily cases in Matagorda County in 7 days ending June 30: 16 per 100,000
> Avg. new daily cases in Texas in 7 days ending July 7: 23 per 100,000 (6th most)
> Cumulative confirmed COVID-19 cases in Matagorda County as of July 7: 746 per 100,000 people (total: 274)
> COVID-19 related deaths as of July 7: 5
> Population: 36,743
> Largest place in Matagorda County: Bay City

25. Covington County, Mississippi
> Change in daily avg. new COVID-19 cases week over week: +25.7 per 100,000 people
> Avg. new daily cases in Covington County in 7 days ending July 7: 58 per 100,000
> Avg. new daily cases in Covington County in 7 days ending June 30: 32 per 100,000
> Avg. new daily cases in Mississippi in 7 days ending July 7: 22 per 100,000 (8th most)
> Cumulative confirmed COVID-19 cases in Covington County as of July 7: 1,964 per 100,000 people (total: 375)
> COVID-19 related deaths as of July 7: 5
> Population: 19,091
> Largest place in Covington County: Collins
[in-text-ad]
24. Bacon County, Georgia
> Change in daily avg. new COVID-19 cases week over week: +26.4 per 100,000 people
> Avg. new daily cases in Bacon County in 7 days ending July 7: 62 per 100,000
> Avg. new daily cases in Bacon County in 7 days ending June 30: 36 per 100,000
> Avg. new daily cases in Georgia in 7 days ending July 7: 23 per 100,000 (5th most)
> Cumulative confirmed COVID-19 cases in Bacon County as of July 7: 2,520 per 100,000 people (total: 283)
> COVID-19 related deaths as of July 7: 4
> Population: 11,228
> Largest place in Bacon County: Alma
[recirclink id=717253]

23. Maverick County, Texas
> Change in daily avg. new COVID-19 cases week over week: +26.7 per 100,000 people
> Avg. new daily cases in Maverick County in 7 days ending July 7: 48 per 100,000
> Avg. new daily cases in Maverick County in 7 days ending June 30: 21 per 100,000
> Avg. new daily cases in Texas in 7 days ending July 7: 23 per 100,000 (6th most)
> Cumulative confirmed COVID-19 cases in Maverick County as of July 7: 949 per 100,000 people (total: 550)
> COVID-19 related deaths as of July 7: 5
> Population: 57,970
> Largest place in Maverick County: Eagle Pass

22. McLennan County, Texas
> Change in daily avg. new COVID-19 cases week over week: +27.0 per 100,000 people
> Avg. new daily cases in McLennan County in 7 days ending July 7: 46 per 100,000
> Avg. new daily cases in McLennan County in 7 days ending June 30: 19 per 100,000
> Avg. new daily cases in Texas in 7 days ending July 7: 23 per 100,000 (6th most)
> Cumulative confirmed COVID-19 cases in McLennan County as of July 7: 724 per 100,000 people (total: 1,798)
> COVID-19 related deaths as of July 7: 13
> Population: 248,429
> Largest place in McLennan County: Waco
[in-text-ad-2]
21. Liberty County, Florida
> Change in daily avg. new COVID-19 cases week over week: +27.1 per 100,000 people
> Avg. new daily cases in Liberty County in 7 days ending July 7: 28 per 100,000
> Avg. new daily cases in Liberty County in 7 days ending June 30: 1 per 100,000
> Avg. new daily cases in Florida in 7 days ending July 7: 38 per 100,000 (2nd most)
> Cumulative confirmed COVID-19 cases in Liberty County as of July 7: 2,929 per 100,000 people (total: 245)
> COVID-19 related deaths as of July 7: 1
> Population: 8,365
> Largest place in Liberty County: Bristol

20. Pocahontas County, Iowa
> Change in daily avg. new COVID-19 cases week over week: +27.2 per 100,000 people
> Avg. new daily cases in Pocahontas County in 7 days ending July 7: 72 per 100,000
> Avg. new daily cases in Pocahontas County in 7 days ending June 30: 45 per 100,000
> Avg. new daily cases in Iowa in 7 days ending July 7: 13 per 100,000 (17th most)
> Cumulative confirmed COVID-19 cases in Pocahontas County as of July 7: 1,406 per 100,000 people (total: 97)
> COVID-19 related deaths as of July 7: 1
> Population: 6,898
> Largest place in Pocahontas County: Pocahontas
[in-text-ad]

19. West Carroll Parish, Louisiana
> Change in daily avg. new COVID-19 cases week over week: +27.9 per 100,000 people
> Avg. new daily cases in West Carroll Parish in 7 days ending July 7: 37 per 100,000
> Avg. new daily cases in West Carroll Parish in 7 days ending June 30: 9 per 100,000
> Avg. new daily cases in Louisiana in 7 days ending July 7: 26 per 100,000 (4th most)
> Cumulative confirmed COVID-19 cases in West Carroll Parish as of July 7: 1,386 per 100,000 people (total: 155)
> COVID-19 related deaths as of July 7: 5
> Population: 11,180
> Largest place in West Carroll Parish: Oak Grove
[recirclink id=717098]

18. Malheur County, Oregon
> Change in daily avg. new COVID-19 cases week over week: +28.4 per 100,000 people
> Avg. new daily cases in Malheur County in 7 days ending July 7: 45 per 100,000
> Avg. new daily cases in Malheur County in 7 days ending June 30: 17 per 100,000
> Avg. new daily cases in Oregon in 7 days ending July 7: 6 per 100,000 (20th fewest)
> Cumulative confirmed COVID-19 cases in Malheur County as of July 7: 733 per 100,000 people (total: 223)
> COVID-19 related deaths as of July 7: 1
> Population: 30,431
> Largest place in Malheur County: Ontario

17. Colusa County, California
> Change in daily avg. new COVID-19 cases week over week: +28.4 per 100,000 people
> Avg. new daily cases in Colusa County in 7 days ending July 7: 36 per 100,000
> Avg. new daily cases in Colusa County in 7 days ending June 30: 7 per 100,000
> Avg. new daily cases in California in 7 days ending July 7: 20 per 100,000 (10th most)
> Cumulative confirmed COVID-19 cases in Colusa County as of July 7: 391 per 100,000 people (total: 84)
> COVID-19 related deaths as of July 7: 0
> Population: 21,464
> Largest place in Colusa County: Colusa
[in-text-ad-2]

16. Miami-Dade County, Florida
> Change in daily avg. new COVID-19 cases week over week: +29.9 per 100,000 people
> Avg. new daily cases in Miami-Dade County in 7 days ending July 7: 66 per 100,000
> Avg. new daily cases in Miami-Dade County in 7 days ending June 30: 36 per 100,000
> Avg. new daily cases in Florida in 7 days ending July 7: 38 per 100,000 (2nd most)
> Cumulative confirmed COVID-19 cases in Miami-Dade County as of July 7: 1,880 per 100,000 people (total: 51,058)
> COVID-19 related deaths as of July 7: 1,057
> Population: 2,715,516
> Largest place in Miami-Dade County: Miami

15. Pipestone County, Minnesota
> Change in daily avg. new COVID-19 cases week over week: +30.3 per 100,000 people
> Avg. new daily cases in Pipestone County in 7 days ending July 7: 36 per 100,000
> Avg. new daily cases in Pipestone County in 7 days ending June 30: 6 per 100,000
> Avg. new daily cases in Minnesota in 7 days ending July 7: 7 per 100,000 (25th most)
> Cumulative confirmed COVID-19 cases in Pipestone County as of July 7: 642 per 100,000 people (total: 59)
> COVID-19 related deaths as of July 7: 2
> Population: 9,185
> Largest place in Pipestone County: Pipestone
[in-text-ad]

14. Grenada County, Mississippi
> Change in daily avg. new COVID-19 cases week over week: +31.9 per 100,000 people
> Avg. new daily cases in Grenada County in 7 days ending July 7: 107 per 100,000
> Avg. new daily cases in Grenada County in 7 days ending June 30: 75 per 100,000
> Avg. new daily cases in Mississippi in 7 days ending July 7: 22 per 100,000 (8th most)
> Cumulative confirmed COVID-19 cases in Grenada County as of July 7: 2,378 per 100,000 people (total: 506)
> COVID-19 related deaths as of July 7: 7
> Population: 21,278
> Largest place in Grenada County: Grenada
[recirclink id=716994]
13. Nueces County, Texas
> Change in daily avg. new COVID-19 cases week over week: +32.5 per 100,000 people
> Avg. new daily cases in Nueces County in 7 days ending July 7: 70 per 100,000
> Avg. new daily cases in Nueces County in 7 days ending June 30: 37 per 100,000
> Avg. new daily cases in Texas in 7 days ending July 7: 23 per 100,000 (6th most)
> Cumulative confirmed COVID-19 cases in Nueces County as of July 7: 1,133 per 100,000 people (total: 4,084)
> COVID-19 related deaths as of July 7: 18
> Population: 360,486
> Largest place in Nueces County: Corpus Christi

12. Jefferson County, Texas
> Change in daily avg. new COVID-19 cases week over week: +35.1 per 100,000 people
> Avg. new daily cases in Jefferson County in 7 days ending July 7: 48 per 100,000
> Avg. new daily cases in Jefferson County in 7 days ending June 30: 13 per 100,000
> Avg. new daily cases in Texas in 7 days ending July 7: 23 per 100,000 (6th most)
> Cumulative confirmed COVID-19 cases in Jefferson County as of July 7: 1,159 per 100,000 people (total: 2,959)
> COVID-19 related deaths as of July 7: 36
> Population: 255,210
> Largest place in Jefferson County: Beaumont
[in-text-ad-2]
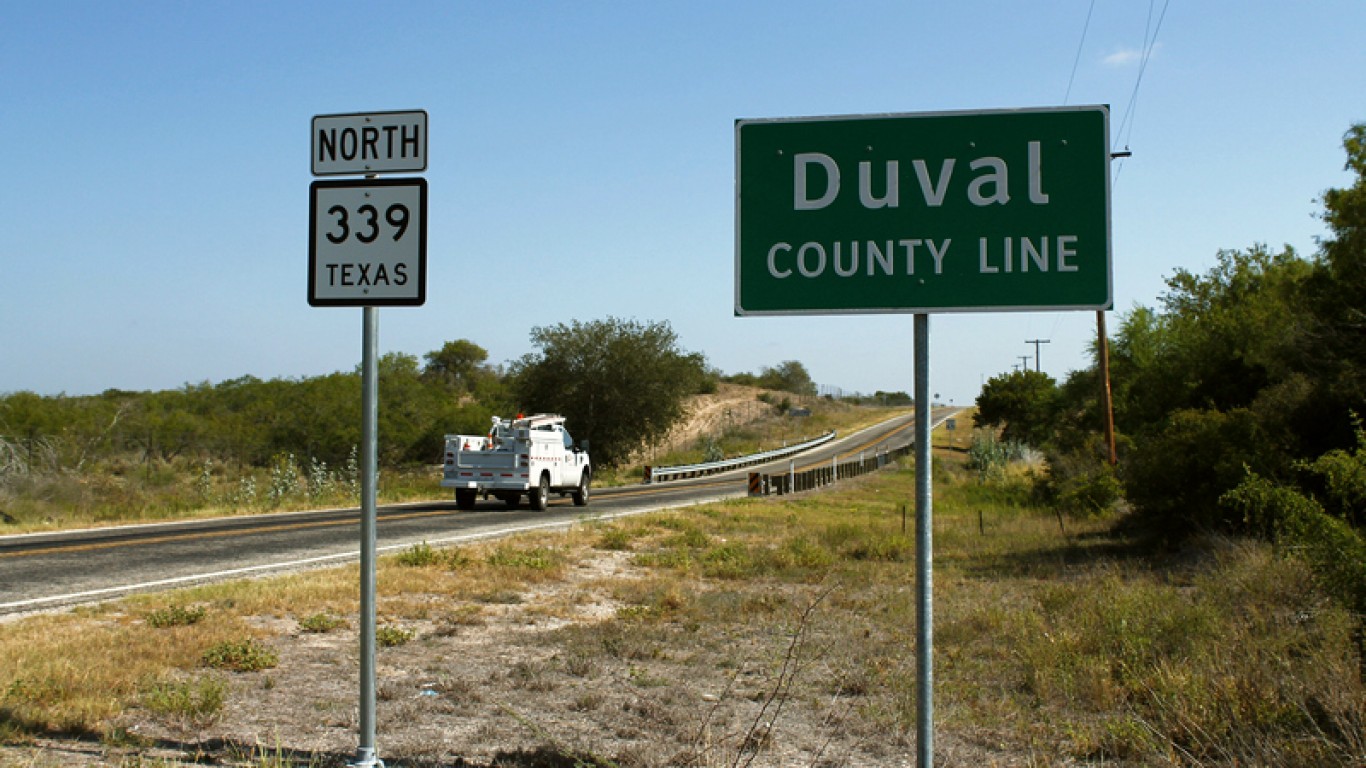
11. Duval County, Texas
> Change in daily avg. new COVID-19 cases week over week: +37.6 per 100,000 people
> Avg. new daily cases in Duval County in 7 days ending July 7: 51 per 100,000
> Avg. new daily cases in Duval County in 7 days ending June 30: 13 per 100,000
> Avg. new daily cases in Texas in 7 days ending July 7: 23 per 100,000 (6th most)
> Cumulative confirmed COVID-19 cases in Duval County as of July 7: 572 per 100,000 people (total: 65)
> COVID-19 related deaths as of July 7: 0
> Population: 11,355
> Largest place in Duval County: San Diego

10. Perry County, Alabama
> Change in daily avg. new COVID-19 cases week over week: +37.6 per 100,000 people
> Avg. new daily cases in Perry County in 7 days ending July 7: 80 per 100,000
> Avg. new daily cases in Perry County in 7 days ending June 30: 42 per 100,000
> Avg. new daily cases in Alabama in 7 days ending July 7: 22 per 100,000 (9th most)
> Cumulative confirmed COVID-19 cases in Perry County as of July 7: 1,887 per 100,000 people (total: 179)
> COVID-19 related deaths as of July 7: 1
> Population: 9,486
> Largest place in Perry County: Marion
[in-text-ad]

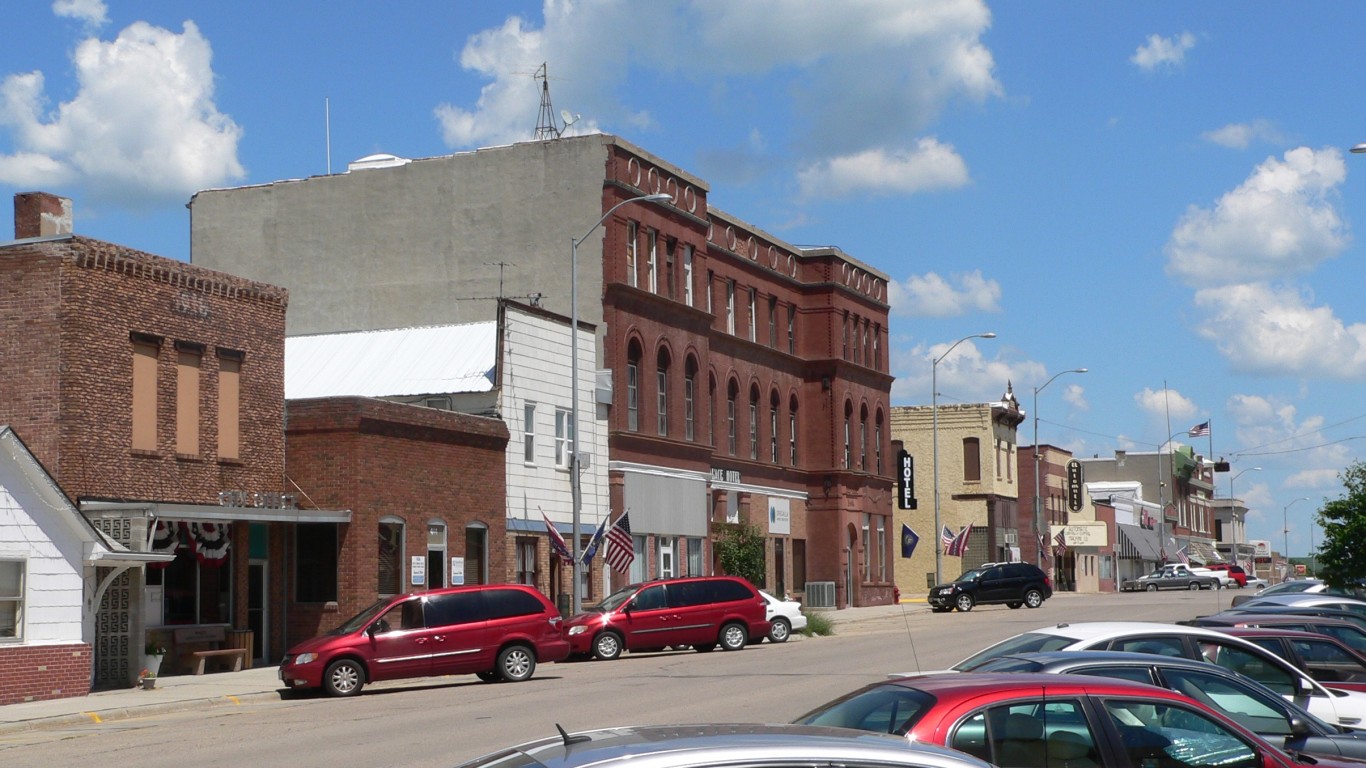
9. Macon County, Tennessee
> Change in daily avg. new COVID-19 cases week over week: +42.3 per 100,000 people
> Avg. new daily cases in Macon County in 7 days ending July 7: 91 per 100,000
> Avg. new daily cases in Macon County in 7 days ending June 30: 49 per 100,000
> Avg. new daily cases in Tennessee in 7 days ending July 7: 20 per 100,000 (11th most)
> Cumulative confirmed COVID-19 cases in Macon County as of July 7: 2,129 per 100,000 people (total: 500)
> COVID-19 related deaths as of July 7: 4
> Population: 23,487
> Largest place in Macon County: Lafayette
[recirclink id=716869]

8. Calcasieu Parish, Louisiana
> Change in daily avg. new COVID-19 cases week over week: +42.9 per 100,000 people
> Avg. new daily cases in Calcasieu Parish in 7 days ending July 7: 63 per 100,000
> Avg. new daily cases in Calcasieu Parish in 7 days ending June 30: 20 per 100,000
> Avg. new daily cases in Louisiana in 7 days ending July 7: 26 per 100,000 (4th most)
> Cumulative confirmed COVID-19 cases in Calcasieu Parish as of July 7: 1,203 per 100,000 people (total: 2,408)
> COVID-19 related deaths as of July 7: 59
> Population: 200,182
> Largest place in Calcasieu Parish: Lake Charles
7. Glynn County, Georgia
> Change in daily avg. new COVID-19 cases week over week: +46.6 per 100,000 people
> Avg. new daily cases in Glynn County in 7 days ending July 7: 91 per 100,000
> Avg. new daily cases in Glynn County in 7 days ending June 30: 44 per 100,000
> Avg. new daily cases in Georgia in 7 days ending July 7: 23 per 100,000 (5th most)
> Cumulative confirmed COVID-19 cases in Glynn County as of July 7: 1,466 per 100,000 people (total: 1,231)
> COVID-19 related deaths as of July 7: 6
> Population: 83,974
> Largest place in Glynn County: Brunswick
[in-text-ad-2]

6. Hale County, Texas
> Change in daily avg. new COVID-19 cases week over week: +52.9 per 100,000 people
> Avg. new daily cases in Hale County in 7 days ending July 7: 94 per 100,000
> Avg. new daily cases in Hale County in 7 days ending June 30: 41 per 100,000
> Avg. new daily cases in Texas in 7 days ending July 7: 23 per 100,000 (6th most)
> Cumulative confirmed COVID-19 cases in Hale County as of July 7: 1,735 per 100,000 people (total: 592)
> COVID-19 related deaths as of July 7: 7
> Population: 34,113
> Largest place in Hale County: Plainview

5. Victoria County, Texas
> Change in daily avg. new COVID-19 cases week over week: +53.1 per 100,000 people
> Avg. new daily cases in Victoria County in 7 days ending July 7: 82 per 100,000
> Avg. new daily cases in Victoria County in 7 days ending June 30: 29 per 100,000
> Avg. new daily cases in Texas in 7 days ending July 7: 23 per 100,000 (6th most)
> Cumulative confirmed COVID-19 cases in Victoria County as of July 7: 1,348 per 100,000 people (total: 1,240)
> COVID-19 related deaths as of July 7: 9
> Population: 91,970
> Largest place in Victoria County: Victoria
[in-text-ad]
4. Thurston County, Nebraska
> Change in daily avg. new COVID-19 cases week over week: +55.7 per 100,000 people
> Avg. new daily cases in Thurston County in 7 days ending July 7: 77 per 100,000
> Avg. new daily cases in Thurston County in 7 days ending June 30: 21 per 100,000
> Avg. new daily cases in Nebraska in 7 days ending July 7: 8 per 100,000 (23rd most)
> Cumulative confirmed COVID-19 cases in Thurston County as of July 7: 2,325 per 100,000 people (total: 166)
> COVID-19 related deaths as of July 7: 1
> Population: 7,140
> Largest place in Thurston County: Pender
[recirclink id=717313]
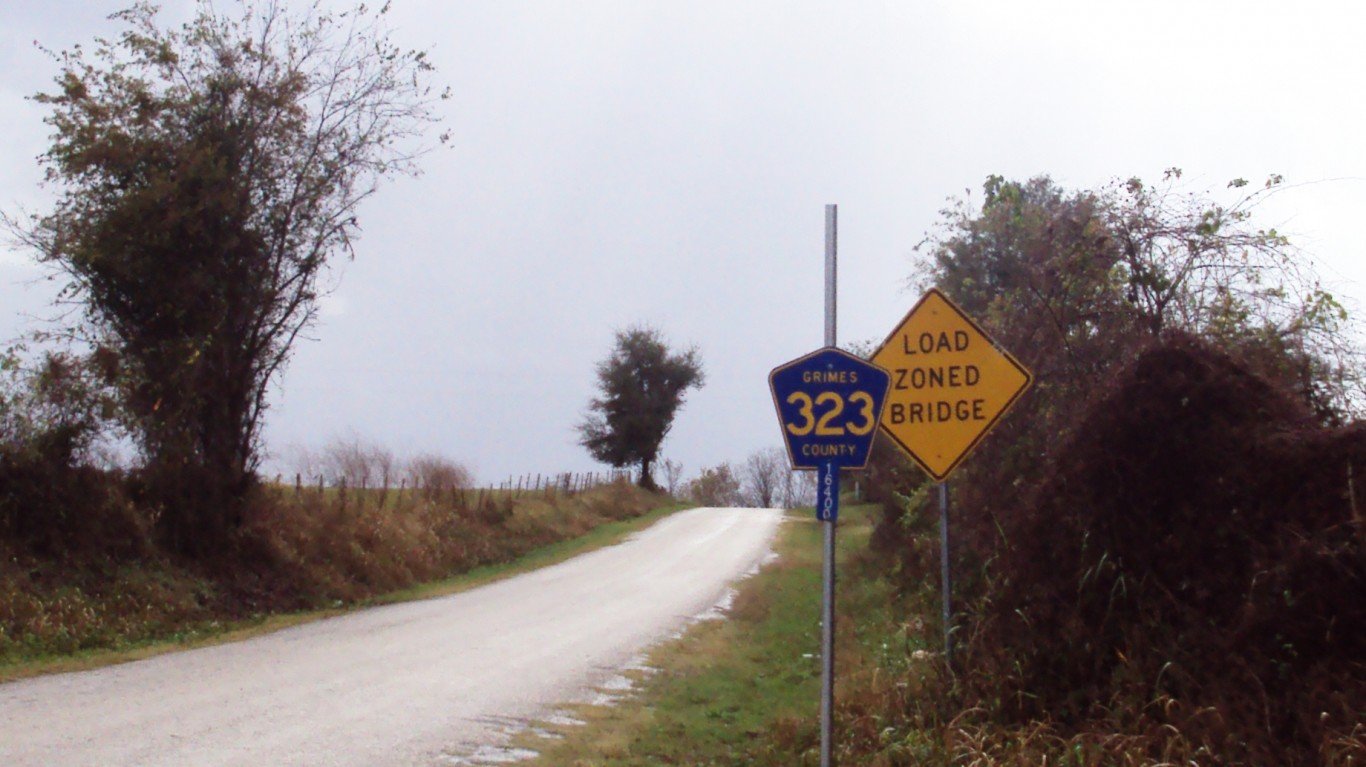
3. Grimes County, Texas
> Change in daily avg. new COVID-19 cases week over week: +66.6 per 100,000 people
> Avg. new daily cases in Grimes County in 7 days ending July 7: 100 per 100,000
> Avg. new daily cases in Grimes County in 7 days ending June 30: 34 per 100,000
> Avg. new daily cases in Texas in 7 days ending July 7: 23 per 100,000 (6th most)
> Cumulative confirmed COVID-19 cases in Grimes County as of July 7: 2,081 per 100,000 people (total: 575)
> COVID-19 related deaths as of July 7: 2
> Population: 27,630
> Largest place in Grimes County: Navasota

2. Stewart County, Georgia
> Change in daily avg. new COVID-19 cases week over week: +79.4 per 100,000 people
> Avg. new daily cases in Stewart County in 7 days ending July 7: 147 per 100,000
> Avg. new daily cases in Stewart County in 7 days ending June 30: 67 per 100,000
> Avg. new daily cases in Georgia in 7 days ending July 7: 23 per 100,000 (5th most)
> Cumulative confirmed COVID-19 cases in Stewart County as of July 7: 3,376 per 100,000 people (total: 204)
> COVID-19 related deaths as of July 7: 3
> Population: 6,042
> Largest place in Stewart County: Richland
[in-text-ad-2]
1. Lee County, Arkansas
> Change in daily avg. new COVID-19 cases week over week: +148.5 per 100,000 people
> Avg. new daily cases in Lee County in 7 days ending July 7: 228 per 100,000
> Avg. new daily cases in Lee County in 7 days ending June 30: 79 per 100,000
> Avg. new daily cases in Arkansas in 7 days ending July 7: 18 per 100,000 (12th most)
> Cumulative confirmed COVID-19 cases in Lee County as of July 7: 8,544 per 100,000 people (total: 803)
> COVID-19 related deaths as of July 7: 3
> Population: 9,398
> Largest place in Lee County: Marianna
Contact [email protected] for any questions or corrections.