
[cnxvideo id=”1066084″ placement=”ros”]
More than 10% of Americans move each year, equating to tens of millions of relocations annually. These moves are primarily motivated by personal reasons, like a new marriage, or economic reasons, like a new job.
As a result of the COVID-19 pandemic, many people have relocated out of large urban areas — either to try to avoid contracting the virus or because the resulting economic fallout cost them their job. While population statistics are not yet available for 2020, plummeting rental prices in many of America’s largest population centers indicate significant population losses.
Virtually every part of America has suffered economically from the COVID-19 pandemic. Many of the cities on this list, where residents have been leaving in droves over the past decade, have been among the hardest-hit by the pandemic. The U.S. unemployment rate stood at 13.3% as of May 2020, though in many cities on this list, it is now much higher.
To determine the cities Americans are abandoning, 24/7 Wall St. used data from the U.S. Census Bureau’s Population Estimates Program. Cities were ranked based on the decline in population due to migration from April 1, 2010 to July 1, 2019. Supplemental data on income, educational attainment, and poverty came from the Census Bureau’s 2018 American Community Survey. Seasonally adjusted data on the May 2020 unemployment rate came from the U.S. Bureau of Labor Statistics.
People moving in with a new partner or spouse, or those simply moving into a larger home, will often relocate within their area. Those who are moving for a job sometimes choose to move much farther. Many of the areas shedding residents in recent years have struggled to bounce back from the Great Recession of 2008, driving thousands of people to different parts of the country to try to improve their economic future.
Over the past decade, thousands of Americans have left the Midwest and Northeast to head south and west in search of warmer climates and better job opportunities. Many of these “Rust Belt” cities have lost thousands of blue collar jobs over the past few decades, as companies have outsourced production or gone out of business. People who work as packers, machine operators, and construction laborers are now more likely to be unemployed than those in almost any other field. These are the jobs with the worst job security.
It can be expensive for someone to uproot their whole lives and move somewhere new, even if it is for a lucrative job opportunity. In dozens of cities across the country it can cost on average more than $5,000 to relocate. These are the 35 most expensive cities to move to.
Click here to see the cities Americans are abandoning.

25. Lima, OH
> Population change due to migration, 2010-2019: -5.2% (-5,522)
> Overall population change, 2010-2019: -3.7% (-3,962)
> Change in employed population, 2010-2019: -1.1% (-505)
> 2019 population estimate: 102,351 (351st out of 383 metro areas)
From April 2010 to July 2019, 5,522 more people moved away from Lima, Ohio than moved to it, resulting in a 5.2% population decline in the western Ohio metro area. Some of the decline was offset by Lima’s birth rate, as the area had over 1,500 more births than deaths throughout the decade. Still, Lima has nearly 4,000 fewer people than it did in 2010.
Like most of the other cities Americans are abandoning, many Lima residents have a harder time finding work than those in the U.S. overall. Though it fluctuates, Lima’s annual unemployment rate was higher than the U.S. rate most of the years between 2010 and 2019.
[in-text-ad]

24. Atlantic City-Hammonton, NJ
> Population change due to migration, 2010-2019: -5.4% (-14,717)
> Overall population change, 2010-2019: -4.0% (-10,855)
> Change in employed population, 2010-2019: -7.1% (-8,708)
> 2019 population estimate: 263,670 (186th out of 383 metro areas)
Although Atlantic City’s population was buoyed somewhat by a positive net international migration of over 7,000 people throughout the last decade, 14,717 more people left the area than moved to it — a 5.4% drop compared to the 2010 population.
As a vacation destination and gambling hub, the economy of the Atlantic City metro area tends to struggle when Americans lose their disposable income. The Atlantic City gaming industry fell on hard times after the Great Recession of 2008 and since 2010, the area has had one of the highest annual unemployment rates each year. It also had to contend with the fallout from 2012’s Hurricane Sandy. In 2014, four of its casinos closed, costing the area thousands of jobs. The city has again been devastated by the COVID-19 pandemic. Its 28 percentage point increase in unemployment from May 2019 to May 2020 is higher than all but one other metro area.
[recirclink id=644026]

23. Peoria, IL
> Population change due to migration, 2010-2019: -5.6% (-23,246)
> Overall population change, 2010-2019: -3.8% (-15,692)
> Change in employed population, 2010-2019: -5.5% (-9,808)
> 2019 population estimate: 400,561 (134th out of 383 metro areas)
Peoria is one of four major metro areas in Illinois in which the population shrank by more than 5% due to migration between 2010 and 2019. Over 23,000 more people moved away from Peoria than moved to it from 2010 to 2019. For context, only 15 other major U.S. metro areas had a greater negative net migration, and most of them have well over 1 million residents. Peoria has just over 400,000 residents.
Peoria’s annual unemployment rate has not been lower than the national unemployment rate since 2012. In 2019, it was a full percentage point higher, at 4.7%.

22. Saginaw, MI
> Population change due to migration, 2010-2019: -5.6% (-11,236)
> Overall population change, 2010-2019: -4.8% (-9,630)
> Change in employed population, 2010-2019: 3.7% (+2,908)
> 2019 population estimate: 190,539 (227th out of 383 metro areas)
Saginaw, Michigan is one of several Rust Belts cities on this list — areas in the Midwest that once relied on manufacturing jobs that have largely moved elsewhere over the past few decades. Yet Saginaw is one of the few cities on this list with more people working in 2019 than were working in 2010. Even as residents moving out since 2010 resulted in a 5.6% decline in the area’s population, it had nearly 3,000 more people employed in 2019 than it did in 2010.
Saginaw has been buoyed by Michigan’s overall employment increase in recent years. Yet these jobs, many of which are in the service industry, often do not pay well. The median household income in Saginaw is just under $49,000, well below the $61,937 earned by the typical American household. Roughly one in six Saginaw households lives below the poverty line.
[in-text-ad-2]

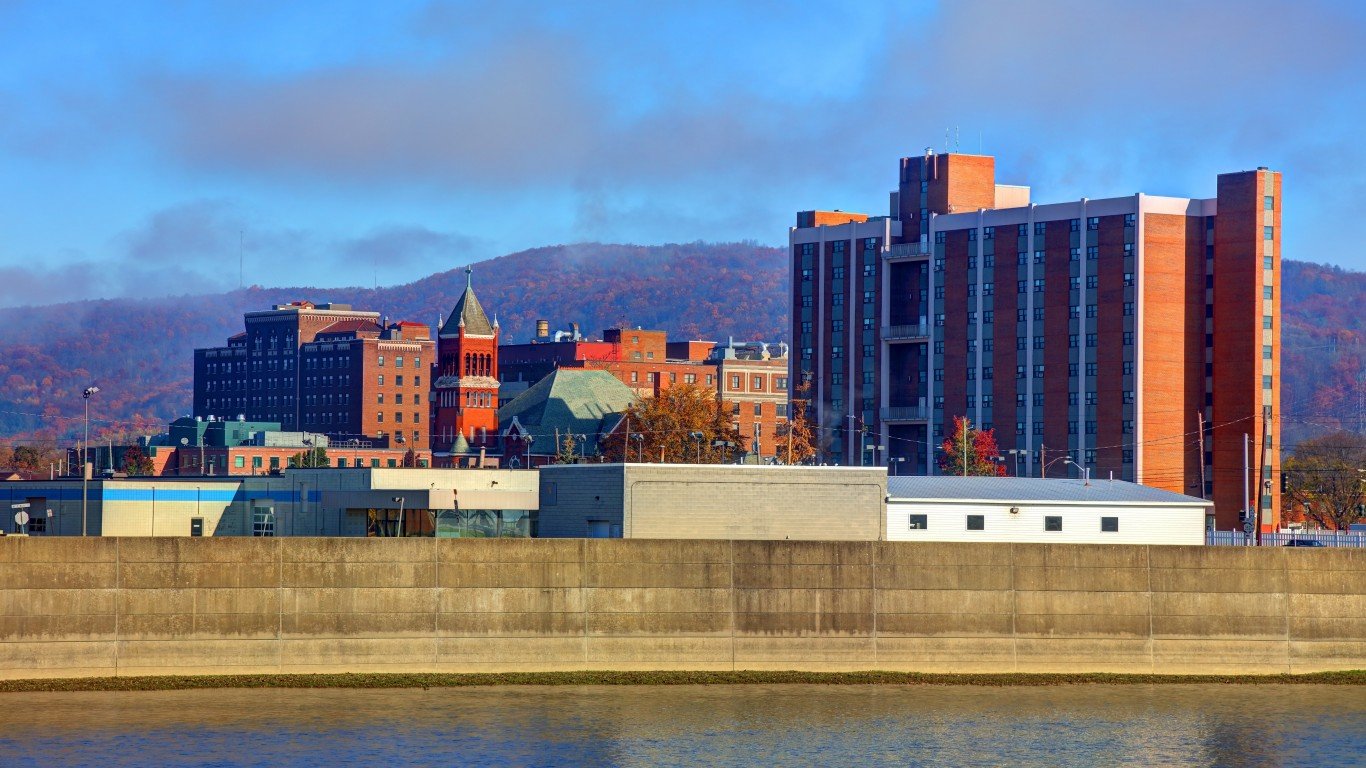
21. Charleston, WV
> Population change due to migration, 2010-2019: -5.6% (-15,683)
> Overall population change, 2010-2019: -7.5% (-20,911)
> Change in employed population, 2010-2019: -8.6% (-8,369)
> 2019 population estimate: 257,074 (188th out of 383 metro areas)
In nearly every city that Americans are abandoning, positive birth rates have offset at least somewhat the population declines due to migration. But in Charleston, West Virginia, deaths outnumber births by more than 5,000 between 2010 and 2019. In many large cities, young parents cannot afford to live in metro areas with high housing costs and leave for a more rural and inexpensive part of the country.
As the United States emerged from a recession in the early part of the decade, many Americans likely moved to cities that bounced back from the downturn successfully and presented new job opportunities. The unemployment rate in the Charleston area has been relatively stagnant over the last decade. While the U.S. unemployment rate declined 5.9 percentage points from 2010 to 2019, falling to 3.7%, Charleston’s declined 2.9 percentage points to 4.8%.

20. Flint, MI
> Population change due to migration, 2010-2019: -5.7% (-24,248)
> Overall population change, 2010-2019: -4.7% (-19,974)
> Change in employed population, 2010-2019: +7.4% (+11,970)
> 2019 population estimate: 405,813 (133rd out of 383 metro areas)
Flint, Michigan drew national attention in 2015 when a change in the city’s water source led to a tainted water supply. While many people certainly left the city as a result, Flint was in decline well before this happened. Like many other cities in the “Rust Belt,” it suffered when companies that had served as economic pillars for decades moved their manufacturing overseas.
Over 24,000 more people moved away from Flint than moved to it in the last decade, accounting for a 5.7% drop in population due to net migration. While Flint’s job market has shown notable improvements over the last decade, few cities have been hit harder by the COVID-19 pandemic. Its unemployment rate climbed 20.2 percentage points, to 25.3% from May 2019 to May 2020, the fifth greatest increase of all American metro areas.
[in-text-ad]

19. Jacksonville, NC
> Population change due to migration, 2010-2019: -5.8% (-10,285)
> Overall population change, 2010-2019: 11.3% (+20,137)
> Change in employed population, 2010-2019: +7.4% (+4,286)
> 2019 population estimate: 197,938 (224th out of 383 metro areas)
Over 10,000 more people moved away from Jacksonville, North Carolina than moved to the metro area from 2010 to 2019, resulting in a 5.8% decline of the population.
Yet Jacksonville got much larger over the past decade, in spite of the negative net migration. It grew 11.3% from 2010 to 2019, driven by the natural increase — births minus deaths — of over 29,000 people. For context, the U.S. as a whole grew 6.3% during those same years.
[recirclink id=644005]

18. Brownsville-Harlingen, TX
> Population change due to migration, 2010-2019: -6.0% (-24,410)
> Overall population change, 2010-2019: 4.2% (+16,948)
> Change in employed population, 2010-2019: +9.4% (+13,504)
> 2019 population estimate: 423,163 (127th out of 383 metro areas)
The Brownsville-Harlingen metro area had a net migration drop of 24,410 from 2010 to 2019, one of the largest total population declines over that time. This amounted to 6% of the metro area’s 2010 population. Yet the area’s total population increased 4.2% during that time, due in part to its relatively high birth rate.
This metro area at the southern tip of Texas is one of the least affluent in the country. Its median household income of $38,378 is lower than all but three population centers in the country. Its 28.1% poverty rate is the second highest nationwide. This lack of economic prosperity likely drove migration to other parts of the country.
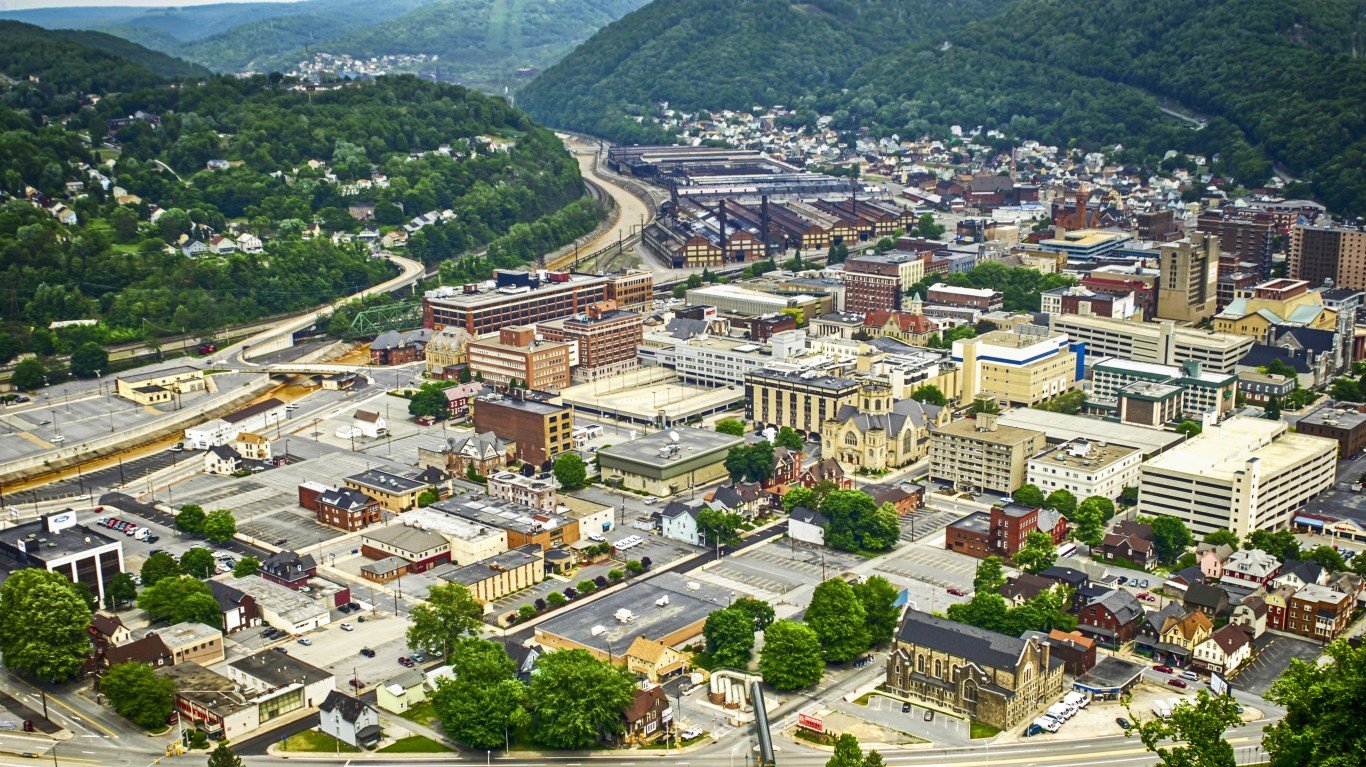
17. Johnstown, PA
> Population change due to migration, 2010-2019: -6.1% (-8,837)
> Overall population change, 2010-2019: -9.4% (-13,503)
> Change in employed population, 2010-2019: -9.1% (-5,498)
> 2019 population estimate: 130,192 (310th out of 383 metro areas)
Johnstown, Pennsylvania, a city just over 50 miles east of Pittsburgh, lost more than 8,800 residents to migration from 2010 to 2019. In many cities with negative net migrations, the population decline is somewhat offset or even completely erased by the birthrate. Yet this was not the case in Johnstown.
Unlike the vast majority of metro areas, births did not outnumber deaths over the past decade in Johnstown — with over 4,700 more deaths than births recorded in the 2010s. This likely indicates the population is an older one, and that many younger people are not staying in Johnstown to start their families. Overall, Johnstown’s population fell by 9.4% during that time, a greater decline than in all but one other metro area.
[in-text-ad-2]
16. Elmira, NY
> Population change due to migration, 2010-2019: -6.2% (-5,499)
> Overall population change, 2010-2019: -6.1% (-5,391)
> Change in employed population, 2010-2019: -12.0% (-4,562)
> 2019 population estimate: 83,456 (371st out of 383 metro areas)
As the country’s economy improved after the Great Recession, nearly every metro area’s economy also improved. Yet Elmira, New York was one of just two metro areas still considered to be in a recession in 2019, according to a Moody’s analysis.
Nearly 5,500 more people moved away from Elmira than moved to it between 2010 and 2019. Elmira’s population shrank at the same time as job opportunities became harder to come by. The total number of people working in Elmira fell 12% from 2010 to 2019 — the second largest decrease of any major metro area in the country. The city in southern New York, just across the border from Pennsylvania, has struggled as manufacturing jobs that once propped up the economy have moved elsewhere.

15. Rockford, IL
> Population change due to migration, 2010-2019: -6.3% (-21,938)
> Overall population change, 2010-2019: -3.8% (-13,315)
> Change in employed population, 2010-2019: 3.0% (+4,607)
> 2019 population estimate: 336,116 (152nd out of 383 metro areas)
Rockford, Illinois consistently had one of the highest annual unemployment rates each year between 2010 and 2019. In 2010, its 14.0% unemployment rate was the 14th highest among metro areas, and was well above the nation’s 9.6% rate. Even as Rockford’s unemployment rate improved to 5.7% in 2019, that was still two percentage points higher than the U.S. rate and still ranked among the 20 highest.
The lack of economic opportunities has likely driven many people to move away from the Rust Belt city. Rockford’s population decline from migration of 21,938 accounts for 6.3% of the 2010 population. Like many other Midwestern cities that were struggling economically ahead of COVID-19, the situation has gotten much worse — Rockford’s unemployment rate stood at 20.6% as of May 2020.
[in-text-ad]
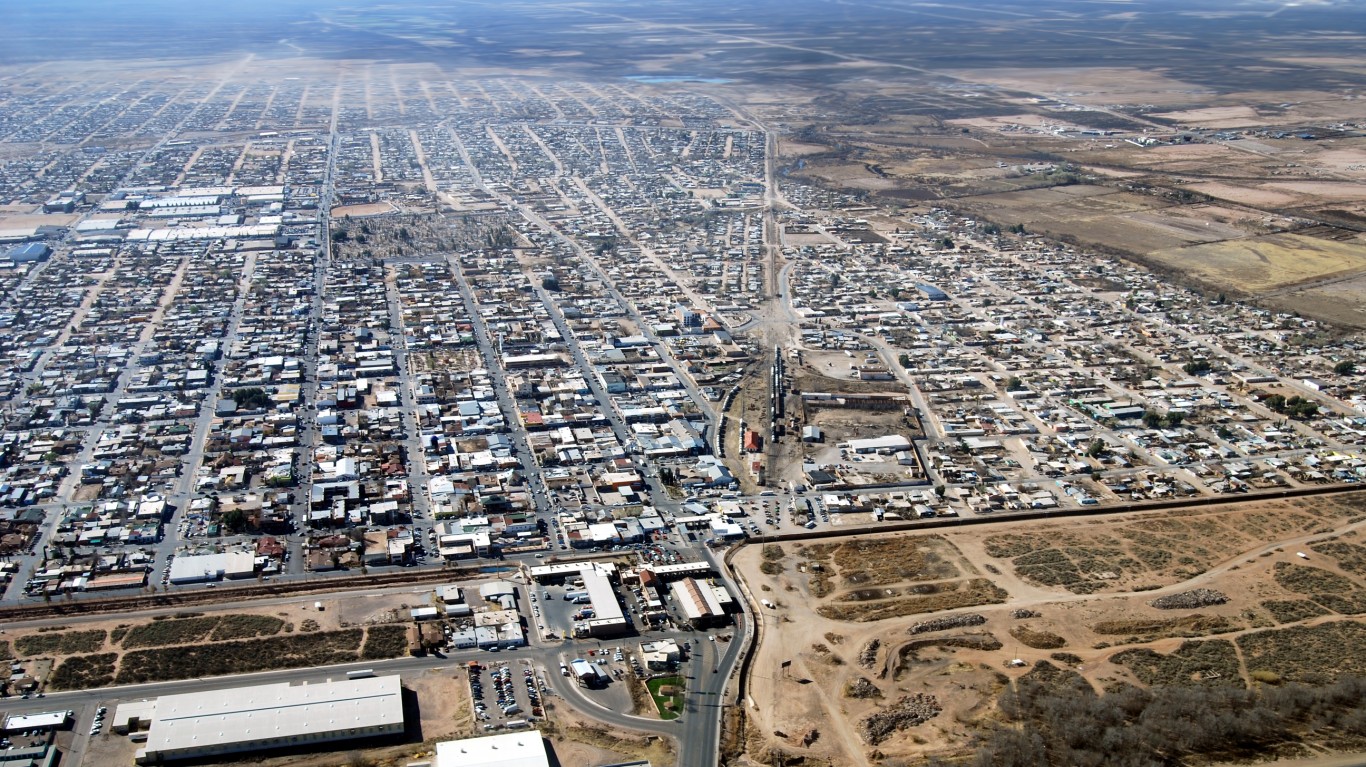
14. Sierra Vista-Douglas, AZ
> Population change due to migration, 2010-2019: -6.3% (-8,272)
> Overall population change, 2010-2019: -4.1% (-5,437)
> Change in employed population, 2010-2019: -7.7% (-3,999)
> 2019 population estimate: 125,922 (315th out of 383 metro areas)
The Sierra Vista-Douglas metro area is the only part of Arizona that residents have been consistently moving away from over the past decade. After in- and out-bound migration over the years from 2010 to 2019, the southern Arizona metro area had 8,272 fewer residents– a decline likely driven by the difficult job market There were nearly 4,000 fewer people working in the metro area in 2019 than there were in 2010. In 2019, Sierra Vista-Douglas had an annual unemployment rate of 5.7% — two full percentage points higher than the U.S. overall.
Since the Great Recession, the economy of the Sierra Vista-Douglas area has not matched the improvement seen in the rest of the country. In 2010, its annual unemployment rate of 9.3% was actually slightly better than that of the nation overall. But the U.S. annual unemployment rate improved to 3.7% by 2019, while Sierra Vista-Douglas had an unemployment rate two percentage points higher.
[recirclink id=651445]

13. El Centro, CA
> Population change due to migration, 2010-2019: -6.8% (-11,851)
> Overall population change, 2010-2019: 3.8% (+6,691)
> Change in employed population, 2010-2019: +4.2% (+2,353)
> 2019 population estimate: 181,215 (233rd out of 383 metro areas)
El Centro, California is about 100 miles east of San Diego, just north of the U.S. border with Mexico. The metro area had the highest annual unemployment rate in America every year from 2010 to 2019, except in 2013 when it ranked second highest. In 2019, its annual unemployment rate was 18.3%, nearly five times the U.S. rate of 3.7%.
This poor job market is likely a factor in El Centro’s negative net migration. Nearly 12,000 more people moved away from El Centro than moved to it in the past decade. While job opportunities appear to be limited, the city does not have a highly qualified labor pool for many jobs, as only 14.1% of El Centro residents have a bachelor’s degree or above, the lowest share of any metro area.

12. Decatur, IL
> Population change due to migration, 2010-2019: -7.1% (-7,840)
> Overall population change, 2010-2019: -6.1% (-6,768)
> Change in employed population, 2010-2019: -6.2% (-3,086)
> 2019 population estimate: 104,009 (347th out of 383 metro areas)
Decatur is one of four Illinois metro areas to have among the largest population declines due to migration. It is also one of just a dozen metro areas to lose over 7% of its 2010 population to migration, with a net population decline of 7,840.
The central Illinois city is one of a number of Rust Belt cities that has lost manufacturing jobs over the past decade, and struggled economically as a result. Decatur has a poverty rate of 18.0%, well above the national rate of 13.3%.
[in-text-ad-2]

11. Vineland-Bridgeton, NJ
> Population change due to migration, 2010-2019: -7.5% (-11,725)
> Overall population change, 2010-2019: -4.5% (-7,100)
> Change in employed population, 2010-2019: -2.8% (-1,752)
> 2019 population estimate: 149,527 (281st out of 383 metro areas)
The Vineland-Bridgeton area, located on the southern coast of New Jersey, has experienced among the largest population declines due to migration over the past decade. From 2010 to 2019, 11,725 more people left the area than moved to it — many likely in search of job opportunities.
Those who hold college degrees are more likely to find jobs that pay well, but just 16.6% of adults 25 years old and older in the Vineland-Bridgeton area have at least a bachelor’s degree, compared to 32.6% of Americans from the same age group.

10. Danville, IL
> Population change due to migration, 2010-2019: -7.8% (-6,361)
> Overall population change, 2010-2019: -7.2% (-5,867)
> Change in employed population, 2010-2019: -5.8% (-1,942)
> 2019 population estimate: 75,758 (378th out of 383 metro areas)
Danville ranks among the 10 cities with the largest rates of population decline due to migration during the last decade. Even after counting new arrivals, 7.8% of its 2010 population had moved away by 2019, accounting for over 6,300 people.
Economic factors are one of the leading reasons people relocate, and the economic reality in Danville is more difficult than in almost all other major metro areas in America. A Moody’s analysis found that Danville is one of just two metro areas to still be in a recession in 2019. One in 10 households in Danville lives on less than $10,000 per year.
[in-text-ad]

9. Albany, GA
> Population change due to migration, 2010-2019: -8.3% (-12,853)
> Overall population change, 2010-2019: -4.7% (-7,307)
> Change in employed population, 2010-2019: +2.1% (+1,323)
> 2019 population estimate: 146,726 (286th out of 383 metro areas)
As in many other cities Americans are leaving, many residents of Albany, Georgia struggle with harsh economic conditions. The metro area has a poverty rate of 24.7%, 11.9% of households have an income below $10,000, and 22.2% rely on food stamps or SNAP benefits — all of which are among the 10 highest shares in the nation.
Residents likely moved to other areas to try to find better economic opportunities than Albany provided throughout the last decade. Its net population decline from migration of 12,853 accounted for 8.3% of the metro area’s 2010 population. Yet those who stayed in Albany have been relatively insulated from the negative economic effects of COVID-19 thus far. In May 2020, Albany’s unemployment rate was 8.8%, well below the 13.3% national rate.
[recirclink id=642995]

8. Lawton, OK
> Population change due to migration, 2010-2019: -9.0% (-11,769)
> Overall population change, 2010-2019: -3.0% (-3,873)
> Change in employed population, 2010-2019: -4.5% (-2,314)
> 2019 population estimate: 126,415 (314th out of 383 metro areas)
People moving in and out of the southwestern Oklahoma metro area of Lawton over the past decade resulted in a population decline of 11,769. Even when considering the relatively high natural increase to the population due to a high birth rate, the population declined 3.0% from 2010 to 2019.
The population began to decline in Lawton, Oklahoma in 2014, around the same time that the state’s GDP weakened, relative to the national GDP. A Federal Reserve analysis found that the drop in net migration in the Lawton area was driven by younger, college-educated adults who likely left the area in search of better economic opportunities.

7. Hanford-Corcoran, CA
> Population change due to migration, 2010-2019: -9.6% (-14,649)
> Overall population change, 2010-2019: 0.0% (-34)
> Change in employed population, 2010-2019: +6.7% (+3,365)
> 2019 population estimate: 152,940 (271st out of 383 metro areas)
The Hanford-Corcoran metro area in central California has consistently had among the 10 highest annual unemployment rates since 2011. In 2019, its unemployment rate of 7.9% was the fifth highest in the country, and more than double the national rate.
This lack of jobs likely drove many people away from the area in search of work. The Hanford-Corcoran metro area population had a net decline from migration of 14,649 between 2010 and 2019, accounting for 9.6% of the 2010 population. This population outflow was offset by a relatively high birth rate.
[in-text-ad-2]

6. Manhattan, KS
> Population change due to migration, 2010-2019: -9.8% (-12,490)
> Overall population change, 2010-2019: 2.5% (+3,191)
> Change in employed population, 2010-2019: +1.2% (+567)
> 2019 population estimate: 130,285 (309th out of 383 metro areas)
Manhattan, Kansas is unique from many other cities on this list, in large part because its job market is in relatively good shape and has been throughout the past decade — its unemployment rate has consistently been well below the national rate. Still, nearly 12,500 more people have moved away from Manhattan than moved to it from 2010 to 2019.
Manhattan is a college town, home to Kansas State University. Like many other college towns, graduates often move away after finishing school. But KSU’s enrollment has declined by more than 3,000 from its peak in 2014. It is also worth noting that, while unemployment is relatively rare in Manhattan, the jobs do not tend to pay well. The metro area’s median household income is $49,200, well below the U.S. median of $61,937. Manhattan also has a poverty rate of 18.8%, well beyond the 13.3% U.S. rate. This has likely spurred some residents to seek higher paying employment elsewhere.

5. Farmington, NM
> Population change due to migration, 2010-2019: -10.1% (-13,162)
> Overall population change, 2010-2019: -4.7% (-6,087)
> Change in employed population, 2010-2019: -1.5% (-739)
> 2019 population estimate: 123,958 (321st out of 383 metro areas)
Farmington, New Mexico is one of just five cities in which the population is more than 10% smaller than it was in 2019 due to migration alone. The northwestern New Mexico city lost over 13,000 more people than it gained over the last decade. During that time, the area’s population, even when accounting for natural population increase from births, declined 4.7%.
As the U.S. unemployment rate decreased each year from 2010 to 2019, Farmington’s unemployment rate fluctuated, and has been higher than the U.S. rate each year since 2014. The metro area’s 2019 annual unemployment rate was two percentage points higher than the national rate, at 5.7%. Yet the Farmington area has not been as harshly affected by COVID-19. While the national unemployment rate jumped from 3.6% in May 2019 to 13.3% in May 2020, Farmington’s increased from 5.5% to 10.6%.
[in-text-ad]

4. Hinesville, GA
> Population change due to migration, 2010-2019: -11.4% (-8,903)
> Overall population change, 2010-2019: +3.9% (+3,065)
> Change in employed population, 2010-2019: +9.1% (+2,761)
> 2019 population estimate: 80,994 (376th out of 383 metro areas)
Over 8,900 more people moved away from Hinesville, Georgia than moved to the metro area in the last decade — resulting in a population decline of 11.4%. Yet the eastern Georgia metro area actually grew by over 3,000 people, as it had a 14.7% natural increase in population during that same time.
Hinesville has a median household income of $47,234, well below the U.S. median of $61,937. In the past 12 months, 15.9% of households relied on SNAP benefits to afford food, and 15.5% of people earned incomes below the poverty line — both well above national rates.
[recirclink id=649906]

3. Fairbanks, AK
> Population change due to migration, 2010-2019: -12.2% (-11,928)
> Overall population change, 2010-2019: -0.8% (-736)
> Change in employed population, 2010-2019: -6.3% (-2,835)
> 2019 population estimate: 96,849 (362nd out of 383 metro areas)
Fairbanks, Alaska is one of just three major metro areas in the country in which people moving away over the last decade led to a more than 12% decline in the 2010 population. Yet the population remained relatively level, as the change due to natural increase — more births than deaths — was also one of the highest in the nation, nearly offsetting the negative net migration.
Each of America’s 383 metro areas had a lower annual unemployment rate in 2019 than they did in 2010. Yet while the nation’s annual unemployment rate dropped 5.2 percentage points during that time, the annual unemployment rate for Fairbanks dropped only 1.2 percentage points, the second lowest improvement in the country. During that time, Fairbanks’ unemployment rate went from one of the best in the country to one of the worst, likely driving many residents to seek employment elsewhere.

2. Pine Bluff, AR
> Population change due to migration, 2010-2019: -12.8% (-12,826)
> Overall population change, 2010-2019: -12.4% (-12,485)
> Change in employed population, 2010-2019: -13.4% (-5,113)
> 2019 population estimate: 87,804 (368th out of 383 metro areas)
No metro area lost a greater share of its population over the last decade than Pine Bluff, Arkansas. The metro area lost nearly 13,000 more people to migration than it gained. It also had one of the lowest natural population growths of any metro area. From 2010 to 2019, Pine Bluff’s births exceeded its deaths by fewer than 200. Outbound residents and the area’s low birth rate contributed to the 12.4% drop in the total number of people living in Pine Bluff over the past decade — no other city had an overall population decline over the last decade of more than 10%.
This is likely due in large part to the fact that Pine Bluff has consistently had a relatively high unemployment rate over the last decade. Data from 2018, the most recent available, shows that Pine Bluff had a number of other economic challenges — its poverty rate, 21.1%, was well above the U.S. poverty rate of 13.3%. Its median household income of $37,314 was also lower than all but two other metro areas. Yet Pine Bluff’s economy has not been as dramatically affected by COVID-19 as most other parts of the country — its unemployment rate increased just five percentage points from May 2019 to May 2020, up to 10.3%, below the 13.3% unemployment rate.
[in-text-ad-2]

1. Watertown-Fort Drum, NY
> Population change due to migration, 2010-2019: -15.0% (-17,420)
> Overall population change, 2010-2019: -5.5% (-6,398)
> Change in employed population, 2010-2019: -9.1% (-4,168)
> 2019 population estimate: 109,834 (344th out of 383 metro areas)
A larger share of the Watertown-Fort Drum metro area’s population moved away in the last decade than any other major U.S. population center. Roughly 116,000 people lived in the northern New York metro area in April 2010. Even after counting new arrivals, the area’s population had lost 17,000 residents, 15% of the 2010 population, to migration by July 2019. No other metro area in the nation had a net decline larger than 13% over that period.
Like many other cities on this list, people may have left the Watertown area because job opportunities were harder to come by there than in most other population centers. Its 2010 unemployment rate of 9.3% was actually lower than the U.S. rate of 9.6%. But as the American job market improved throughout the decade, the Watertown area’s job market did not keep pace. In 2019, the local unemployment rate was the 23rd highest in the country at 5.6%, while nationwide the unemployment rate dropped to 3.7%. The metro area was not as harshly impacted by COVID-19 as most others — its May 2020 unemployment rate of 13.3% is exactly in line with the national rate for that month.
Contact [email protected] for any questions or corrections.