The number of new daily COVID-19 cases in the United States appears to have leveled off — there was just one day in July in which there were fewer than 45,000 new confirmed cases of the virus, but there have been six such days in August through the 20th. Though daily new COVID-19 cases are declining nationwide, there are many places across the country where they are still increasing. All but two states have at least one large county in which cases per capita increased last week compared to the week before.
Using data from state and local health departments, 24/7 Wall St. compiled and reviewed the average of new daily confirmed COVID-19 cases for the week ending August 17 and compared it to the average of new daily cases from the previous week to determine the county in each state where the virus is spreading the fastest. We excluded counties with populations of fewer than 5,000 people, as well as those with fewer than 20 reported new cases in the past 14 days. Starting Aug. 12, Massachusetts began excluding probable COVID-19 cases and deaths from its official case and death counts. As a result, we did not include the state’s count of average daily new cases over the last week.
The average number of new daily cases per capita nationwide has decreased slightly week-over-week, from 17.3 daily new cases per 100,000 people during the week ending Aug. 10 to 15.4 per 100,000 in the week ending Aug. 17. There were 29 states that recorded week-over-week case declines during that time. Yet there were only two states — New Hampshire and Massachusetts — in which there were no counties that recorded increases in confirmed cases per capita. These are the states where the spread of the virus is slowing, and where it is getting worse.
Some of the counties on this list reported a relatively low average of daily new cases for the week ending Aug. 17, with a dozen reporting fewer than the national average of 15.4 new daily cases per 100,000 residents. Yet a number of counties on this list reported many more new daily cases per capita, and three reported over 100 daily new cases per 100,000 residents in the last week. And one, Lafayette County, Florida, reported a staggering 857 cases per 100,000 residents that week alone.
The spike in Lafayette County is directly related to an outbreak at a prison facility in the county. On Aug. 14, the Florida Department of Corrections announced that 639 of the approximately 1,400 inmates at the Mayo Annex Correctional Institution tested positive for COVID-19. Throughout the pandemic, many other areas have reported sharp increases in the number of cases due to an outbreak at a contained facility such as a prison or a nursing home, where the virus can spread quickly throughout the population.
Click here to see the place in every state where COVID-19 is growing the fastest
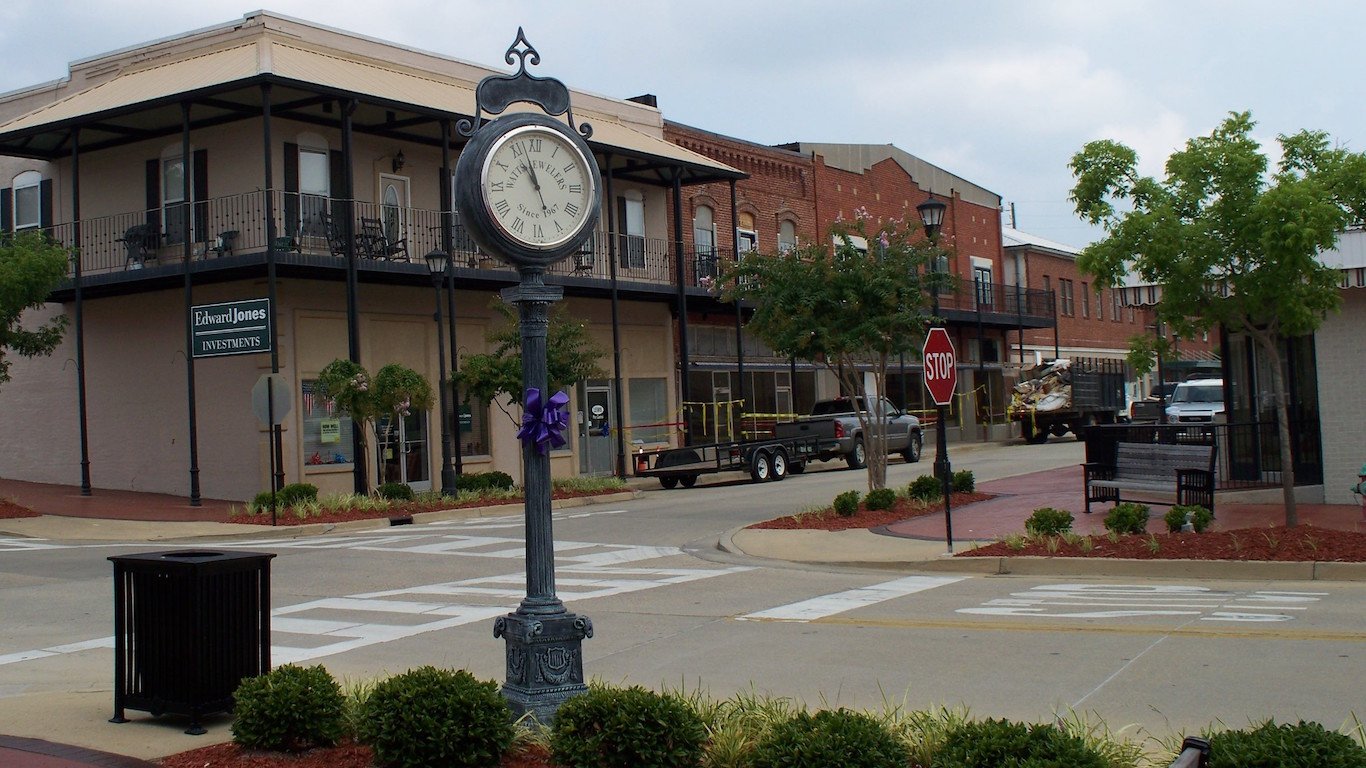
Alabama: Clarke County
> Change in daily avg. new COVID-19 cases week over week: +100 per 100,000 people
> Avg. new daily cases in Clarke County in 7 days ending August 17: 155 per 100,000
> Avg. new daily cases in Clarke County in 7 days ending August 10: 56 per 100,000
> Avg. new daily cases in Alabama in 7 days ending August 17: 23 per 100,000 (9th most)
> Cumulative confirmed COVID-19 cases in Clarke County as of August 17: 3,424 per 100,000 people (total: 835)
> Population: 24,387
> Largest place in Clarke County: Jackson
[in-text-ad]

Alaska: Juneau City and Borough
> Change in daily avg. new COVID-19 cases week over week: +3 per 100,000 people
> Avg. new daily cases in Juneau City and Borough in 7 days ending August 17: 16 per 100,000
> Avg. new daily cases in Juneau City and Borough in 7 days ending August 10: 13 per 100,000
> Avg. new daily cases in Alaska in 7 days ending August 17: 12 per 100,000 (24th fewest)
> Cumulative confirmed COVID-19 cases in Juneau City and Borough as of August 17: 690 per 100,000 people (total: 223)
> Population: 32,330
> Largest place in Juneau City and Borough: Juneau
[recirclink id=729735]

Arizona: Cochise County
> Change in daily avg. new COVID-19 cases week over week: +9 per 100,000 people
> Avg. new daily cases in Cochise County in 7 days ending August 17: 19 per 100,000
> Avg. new daily cases in Cochise County in 7 days ending August 10: 10 per 100,000
> Avg. new daily cases in Arizona in 7 days ending August 17: 14 per 100,000 (18th most)
> Cumulative confirmed COVID-19 cases in Cochise County as of August 17: 1,395 per 100,000 people (total: 1,762)
> Population: 126,279
> Largest place in Cochise County: Sierra Vista
Arkansas: Lee County
> Change in daily avg. new COVID-19 cases week over week: +28 per 100,000 people
> Avg. new daily cases in Lee County in 7 days ending August 17: 44 per 100,000
> Avg. new daily cases in Lee County in 7 days ending August 10: 16 per 100,000
> Avg. new daily cases in Arkansas in 7 days ending August 17: 19 per 100,000 (13th most)
> Cumulative confirmed COVID-19 cases in Lee County as of August 17: 10,396 per 100,000 people (total: 977)
> Population: 9,398
> Largest place in Lee County: Marianna
[in-text-ad-2]

California: Merced County
> Change in daily avg. new COVID-19 cases week over week: +58 per 100,000 people
> Avg. new daily cases in Merced County in 7 days ending August 17: 90 per 100,000
> Avg. new daily cases in Merced County in 7 days ending August 10: 32 per 100,000
> Avg. new daily cases in California in 7 days ending August 17: 21 per 100,000 (10th most)
> Cumulative confirmed COVID-19 cases in Merced County as of August 17: 2,506 per 100,000 people (total: 6,744)
> Population: 269,075
> Largest place in Merced County: Merced
Colorado: Kit Carson County
> Change in daily avg. new COVID-19 cases week over week: +30 per 100,000 people
> Avg. new daily cases in Kit Carson County in 7 days ending August 17: 37 per 100,000
> Avg. new daily cases in Kit Carson County in 7 days ending August 10: 7 per 100,000
> Avg. new daily cases in Colorado in 7 days ending August 17: 7 per 100,000 (11th fewest)
> Cumulative confirmed COVID-19 cases in Kit Carson County as of August 17: 917 per 100,000 people (total: 70)
> Population: 7,635
> Largest place in Kit Carson County: Burlington
[in-text-ad]

Connecticut: New Haven County
> Change in daily avg. new COVID-19 cases week over week: +1 per 100,000 people
> Avg. new daily cases in New Haven County in 7 days ending August 17: 3 per 100,000
> Avg. new daily cases in New Haven County in 7 days ending August 10: 2 per 100,000
> Avg. new daily cases in Connecticut in 7 days ending August 17: 2 per 100,000 (4th fewest)
> Cumulative confirmed COVID-19 cases in New Haven County as of August 17: 1,557 per 100,000 people (total: 13,378)
> Population: 859,339
> Largest place in New Haven County: New Haven
[recirclink id=730024]

Delaware: Kent County
> Change in daily avg. new COVID-19 cases week over week: +5 per 100,000 people
> Avg. new daily cases in Kent County in 7 days ending August 17: 13 per 100,000
> Avg. new daily cases in Kent County in 7 days ending August 10: 8 per 100,000
> Avg. new daily cases in Delaware in 7 days ending August 17: 11 per 100,000 (19th fewest)
> Cumulative confirmed COVID-19 cases in Kent County as of August 17: 1,428 per 100,000 people (total: 2,496)
> Population: 174,822
> Largest place in Kent County: Dover

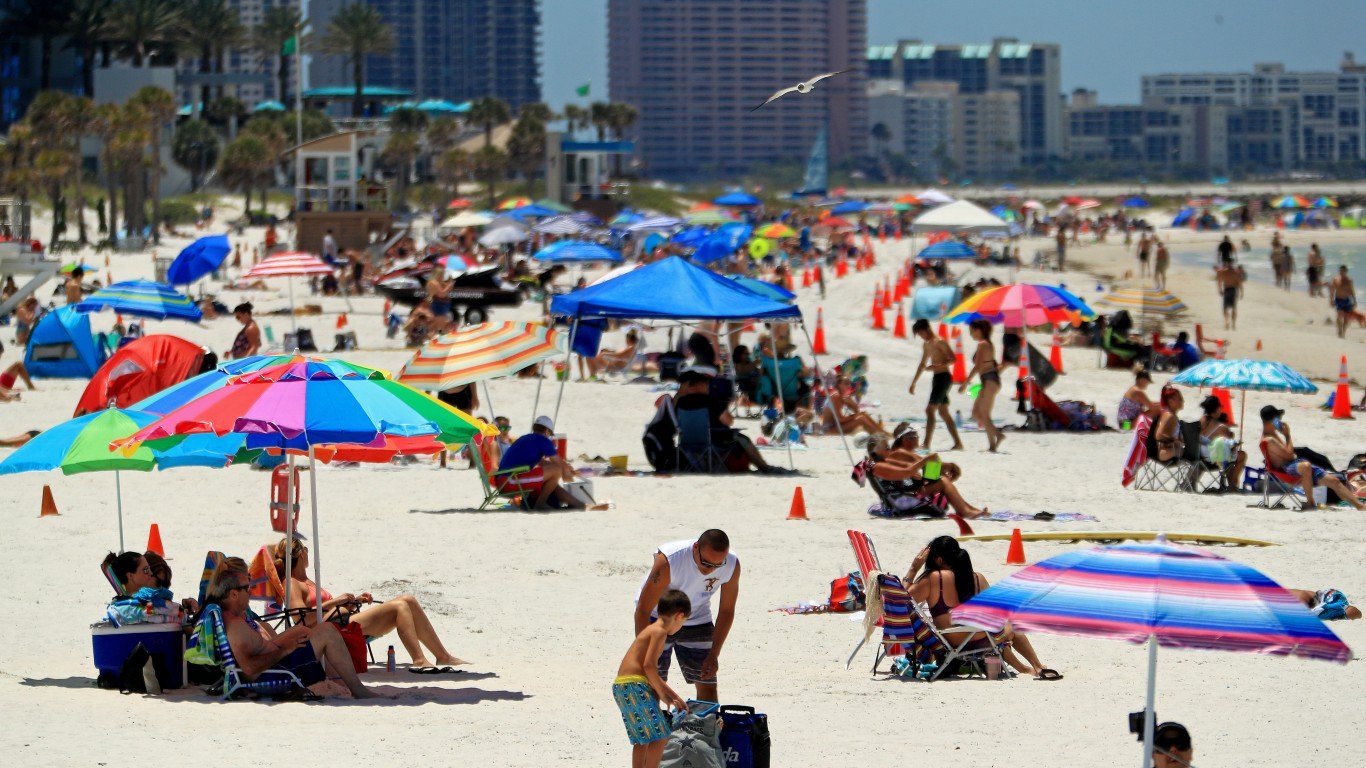
Florida: Lafayette County
> Change in daily avg. new COVID-19 cases week over week: +819 per 100,000 people
> Avg. new daily cases in Lafayette County in 7 days ending August 17: 857 per 100,000
> Avg. new daily cases in Lafayette County in 7 days ending August 10: 39 per 100,000
> Avg. new daily cases in Florida in 7 days ending August 17: 30 per 100,000 (2nd most)
> Cumulative confirmed COVID-19 cases in Lafayette County as of August 17: 11,539 per 100,000 people (total: 1,009)
> Population: 8,744
> Largest place in Lafayette County: Mayo
[in-text-ad-2]

Georgia: Appling County
> Change in daily avg. new COVID-19 cases week over week: +34 per 100,000 people
> Avg. new daily cases in Appling County in 7 days ending August 17: 91 per 100,000
> Avg. new daily cases in Appling County in 7 days ending August 10: 57 per 100,000
> Avg. new daily cases in Georgia in 7 days ending August 17: 31 per 100,000 (the most)
> Cumulative confirmed COVID-19 cases in Appling County as of August 17: 4,357 per 100,000 people (total: 804)
> Population: 18,454
> Largest place in Appling County: Baxley

Hawaii: Honolulu County
> Change in daily avg. new COVID-19 cases week over week: +5 per 100,000 people
> Avg. new daily cases in Honolulu County in 7 days ending August 17: 20 per 100,000
> Avg. new daily cases in Honolulu County in 7 days ending August 10: 14 per 100,000
> Avg. new daily cases in Hawaii in 7 days ending August 17: 14 per 100,000 (23rd most)
> Cumulative confirmed COVID-19 cases in Honolulu County as of August 17: 481 per 100,000 people (total: 4,754)
> Population: 987,638
> Largest place in Honolulu County: Honolulu CDP
[in-text-ad]

Idaho: Shoshone County
> Change in daily avg. new COVID-19 cases week over week: +46 per 100,000 people
> Avg. new daily cases in Shoshone County in 7 days ending August 17: 73 per 100,000
> Avg. new daily cases in Shoshone County in 7 days ending August 10: 27 per 100,000
> Avg. new daily cases in Idaho in 7 days ending August 17: 26 per 100,000 (4th most)
> Cumulative confirmed COVID-19 cases in Shoshone County as of August 17: 1,341 per 100,000 people (total: 168)
> Population: 12,526
> Largest place in Shoshone County: Kellogg
[recirclink id=730289]

Illinois: Logan County
> Change in daily avg. new COVID-19 cases week over week: +27 per 100,000 people
> Avg. new daily cases in Logan County in 7 days ending August 17: 39 per 100,000
> Avg. new daily cases in Logan County in 7 days ending August 10: 12 per 100,000
> Avg. new daily cases in Illinois in 7 days ending August 17: 14 per 100,000 (22nd most)
> Cumulative confirmed COVID-19 cases in Logan County as of August 17: 688 per 100,000 people (total: 201)
> Population: 29,207
> Largest place in Logan County: Lincoln

Indiana: Henry County
> Change in daily avg. new COVID-19 cases week over week: +22 per 100,000 people
> Avg. new daily cases in Henry County in 7 days ending August 17: 27 per 100,000
> Avg. new daily cases in Henry County in 7 days ending August 10: 6 per 100,000
> Avg. new daily cases in Indiana in 7 days ending August 17: 14 per 100,000 (21st most)
> Cumulative confirmed COVID-19 cases in Henry County as of August 17: 1,040 per 100,000 people (total: 504)
> Population: 48,483
> Largest place in Henry County: New Castle
[in-text-ad-2]
Iowa: Winnebago County
> Change in daily avg. new COVID-19 cases week over week: +19 per 100,000 people
> Avg. new daily cases in Winnebago County in 7 days ending August 17: 30 per 100,000
> Avg. new daily cases in Winnebago County in 7 days ending August 10: 10 per 100,000
> Avg. new daily cases in Iowa in 7 days ending August 17: 15 per 100,000 (16th most)
> Cumulative confirmed COVID-19 cases in Winnebago County as of August 17: 1,126 per 100,000 people (total: 119)
> Population: 10,571
> Largest place in Winnebago County: Forest City
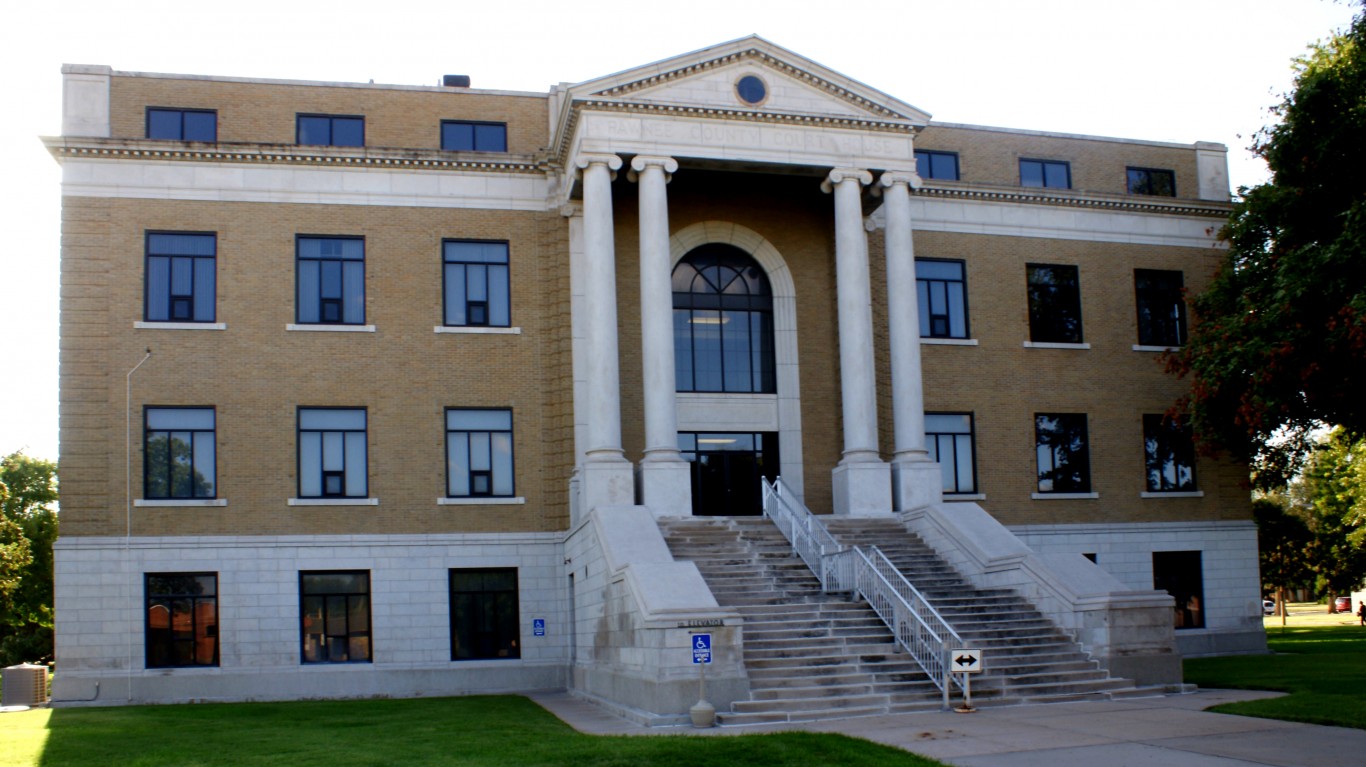
Kansas: Pawnee County
> Change in daily avg. new COVID-19 cases week over week: +64 per 100,000 people
> Avg. new daily cases in Pawnee County in 7 days ending August 17: 67 per 100,000
> Avg. new daily cases in Pawnee County in 7 days ending August 10: 2 per 100,000
> Avg. new daily cases in Kansas in 7 days ending August 17: 15 per 100,000 (17th most)
> Cumulative confirmed COVID-19 cases in Pawnee County as of August 17: 969 per 100,000 people (total: 65)
> Population: 6,709
> Largest place in Pawnee County: Larned
[in-text-ad]
Kentucky: Lewis County
> Change in daily avg. new COVID-19 cases week over week: +26 per 100,000 people
> Avg. new daily cases in Lewis County in 7 days ending August 17: 33 per 100,000
> Avg. new daily cases in Lewis County in 7 days ending August 10: 7 per 100,000
> Avg. new daily cases in Kentucky in 7 days ending August 17: 14 per 100,000 (20th most)
> Cumulative confirmed COVID-19 cases in Lewis County as of August 17: 638 per 100,000 people (total: 86)
> Population: 13,490
> Largest place in Lewis County: Vanceburg
[recirclink id=729078]

Louisiana: West Feliciana Parish
> Change in daily avg. new COVID-19 cases week over week: +34 per 100,000 people
> Avg. new daily cases in West Feliciana Parish in 7 days ending August 17: 50 per 100,000
> Avg. new daily cases in West Feliciana Parish in 7 days ending August 10: 16 per 100,000
> Avg. new daily cases in Louisiana in 7 days ending August 17: 24 per 100,000 (8th most)
> Cumulative confirmed COVID-19 cases in West Feliciana Parish as of August 17: 2,653 per 100,000 people (total: 408)
> Population: 15,377
> Largest place in West Feliciana Parish: St. Francisville
Maine: Androscoggin County
> Change in daily avg. new COVID-19 cases week over week: +1 per 100,000 people
> Avg. new daily cases in Androscoggin County in 7 days ending August 17: 2 per 100,000
> Avg. new daily cases in Androscoggin County in 7 days ending August 10: 1 per 100,000
> Avg. new daily cases in Maine in 7 days ending August 17: 1 per 100,000 (the fewest)
> Cumulative confirmed COVID-19 cases in Androscoggin County as of August 17: 540 per 100,000 people (total: 580)
> Population: 107,444
> Largest place in Androscoggin County: Lewiston
[in-text-ad-2]

Maryland: Allegany County
> Change in daily avg. new COVID-19 cases week over week: +4 per 100,000 people
> Avg. new daily cases in Allegany County in 7 days ending August 17: 8 per 100,000
> Avg. new daily cases in Allegany County in 7 days ending August 10: 4 per 100,000
> Avg. new daily cases in Maryland in 7 days ending August 17: 12 per 100,000 (21st fewest)
> Cumulative confirmed COVID-19 cases in Allegany County as of August 17: 477 per 100,000 people (total: 343)
> Population: 71,977
> Largest place in Allegany County: Cumberland

Massachusetts: No Counties With Increase
[in-text-ad]

Michigan: Ontonagon County
> Change in daily avg. new COVID-19 cases week over week: +18 per 100,000 people
> Avg. new daily cases in Ontonagon County in 7 days ending August 17: 31 per 100,000
> Avg. new daily cases in Ontonagon County in 7 days ending August 10: 12 per 100,000
> Avg. new daily cases in Michigan in 7 days ending August 17: 8 per 100,000 (12th fewest)
> Cumulative confirmed COVID-19 cases in Ontonagon County as of August 17: 486 per 100,000 people (total: 29)
> Population: 5,968
> Largest place in Ontonagon County: Ontonagon
[recirclink id=729561]

Minnesota: Watonwan County
> Change in daily avg. new COVID-19 cases week over week: +73 per 100,000 people
> Avg. new daily cases in Watonwan County in 7 days ending August 17: 83 per 100,000
> Avg. new daily cases in Watonwan County in 7 days ending August 10: 9 per 100,000
> Avg. new daily cases in Minnesota in 7 days ending August 17: 11 per 100,000 (20th fewest)
> Cumulative confirmed COVID-19 cases in Watonwan County as of August 17: 3,582 per 100,000 people (total: 393)
> Population: 10,973
> Largest place in Watonwan County: St. James
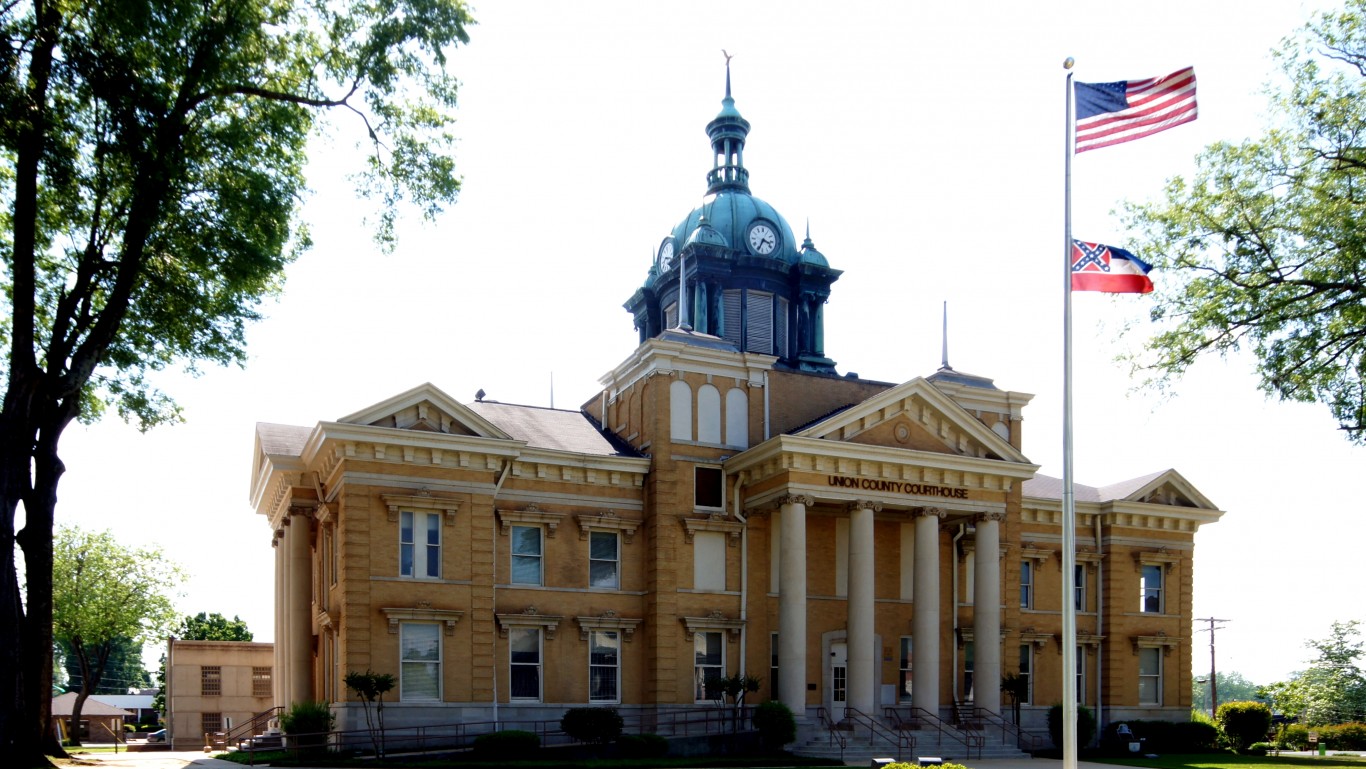
Mississippi: Union County
> Change in daily avg. new COVID-19 cases week over week: +18 per 100,000 people
> Avg. new daily cases in Union County in 7 days ending August 17: 71 per 100,000
> Avg. new daily cases in Union County in 7 days ending August 10: 53 per 100,000
> Avg. new daily cases in Mississippi in 7 days ending August 17: 26 per 100,000 (5th most)
> Cumulative confirmed COVID-19 cases in Union County as of August 17: 2,723 per 100,000 people (total: 772)
> Population: 28,356
> Largest place in Union County: New Albany
[in-text-ad-2]

Missouri: Ralls County
> Change in daily avg. new COVID-19 cases week over week: +19 per 100,000 people
> Avg. new daily cases in Ralls County in 7 days ending August 17: 29 per 100,000
> Avg. new daily cases in Ralls County in 7 days ending August 10: 9 per 100,000
> Avg. new daily cases in Missouri in 7 days ending August 17: 19 per 100,000 (12th most)
> Cumulative confirmed COVID-19 cases in Ralls County as of August 17: 568 per 100,000 people (total: 58)
> Population: 10,217
> Largest place in Ralls County: New London
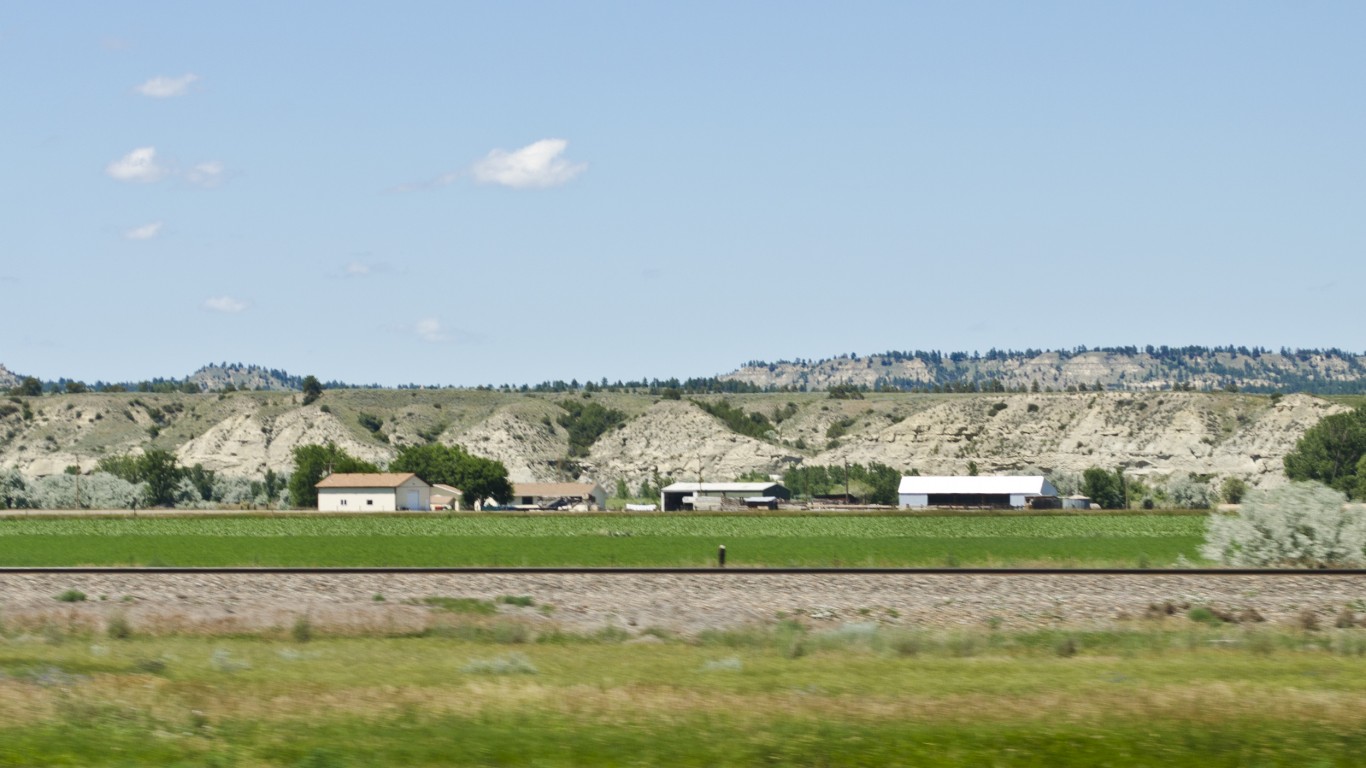
Montana: Yellowstone County
> Change in daily avg. new COVID-19 cases week over week: +3 per 100,000 people
> Avg. new daily cases in Yellowstone County in 7 days ending August 17: 21 per 100,000
> Avg. new daily cases in Yellowstone County in 7 days ending August 10: 18 per 100,000
> Avg. new daily cases in Montana in 7 days ending August 17: 11 per 100,000 (18th fewest)
> Cumulative confirmed COVID-19 cases in Yellowstone County as of August 17: 971 per 100,000 people (total: 1,533)
> Population: 157,816
> Largest place in Yellowstone County: Billings
[in-text-ad]
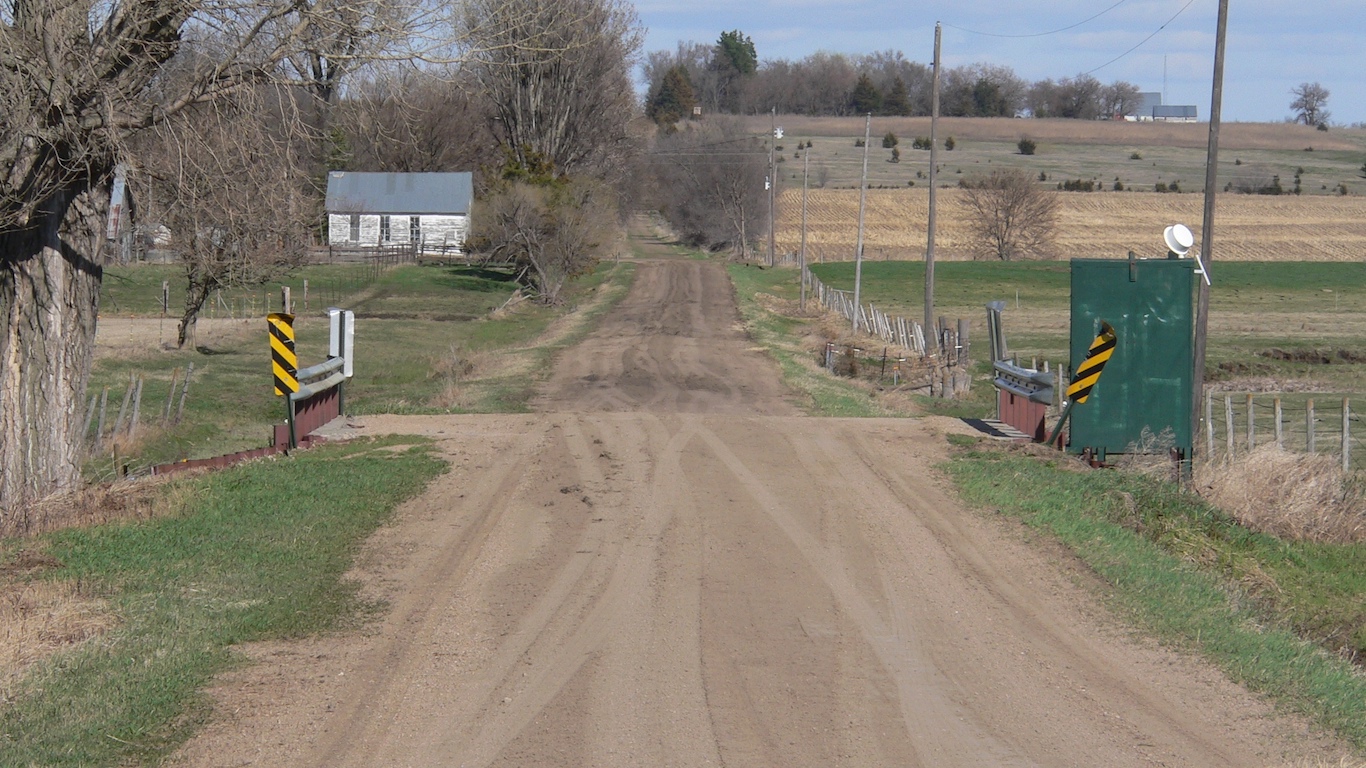
Nebraska: Pierce County
> Change in daily avg. new COVID-19 cases week over week: +26 per 100,000 people
> Avg. new daily cases in Pierce County in 7 days ending August 17: 29 per 100,000
> Avg. new daily cases in Pierce County in 7 days ending August 10: 3 per 100,000
> Avg. new daily cases in Nebraska in 7 days ending August 17: 14 per 100,000 (19th most)
> Cumulative confirmed COVID-19 cases in Pierce County as of August 17: 629 per 100,000 people (total: 45)
> Population: 7,157
> Largest place in Pierce County: Pierce
[recirclink id=729735]
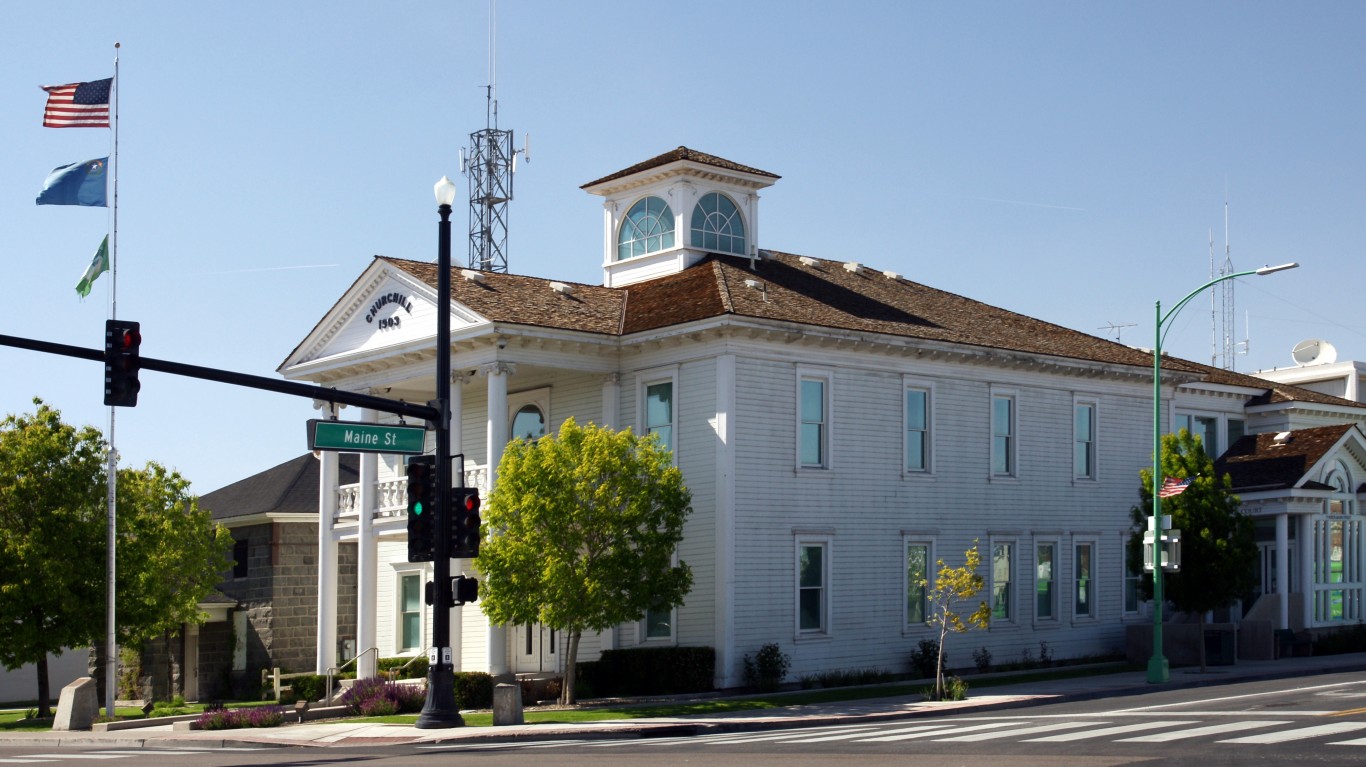
Nevada: Churchill County
> Change in daily avg. new COVID-19 cases week over week: +5 per 100,000 people
> Avg. new daily cases in Churchill County in 7 days ending August 17: 13 per 100,000
> Avg. new daily cases in Churchill County in 7 days ending August 10: 7 per 100,000
> Avg. new daily cases in Nevada in 7 days ending August 17: 24 per 100,000 (6th most)
> Cumulative confirmed COVID-19 cases in Churchill County as of August 17: 342 per 100,000 people (total: 82)
> Population: 24,010
> Largest place in Churchill County: Fallon

New Hampshire: No Counties With Increase
> Avg. new daily cases in New Hampshire in 7 days ending August 17: 2 per 100,000
[in-text-ad-2]
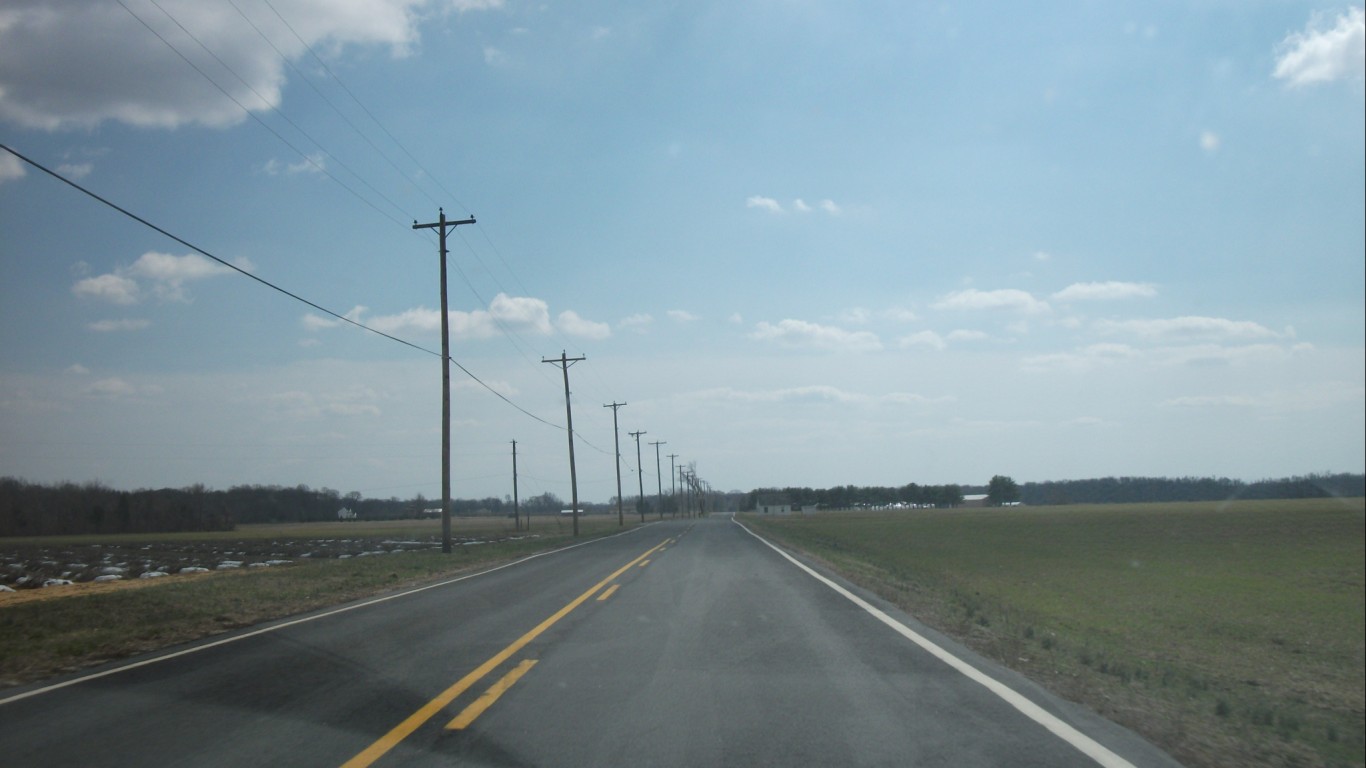
New Jersey: Salem County
> Change in daily avg. new COVID-19 cases week over week: +3 per 100,000 people
> Avg. new daily cases in Salem County in 7 days ending August 17: 7 per 100,000
> Avg. new daily cases in Salem County in 7 days ending August 10: 4 per 100,000
> Avg. new daily cases in New Jersey in 7 days ending August 17: 4 per 100,000 (6th fewest)
> Cumulative confirmed COVID-19 cases in Salem County as of August 17: 1,473 per 100,000 people (total: 933)
> Population: 63,336
> Largest place in Salem County: Pennsville CDP
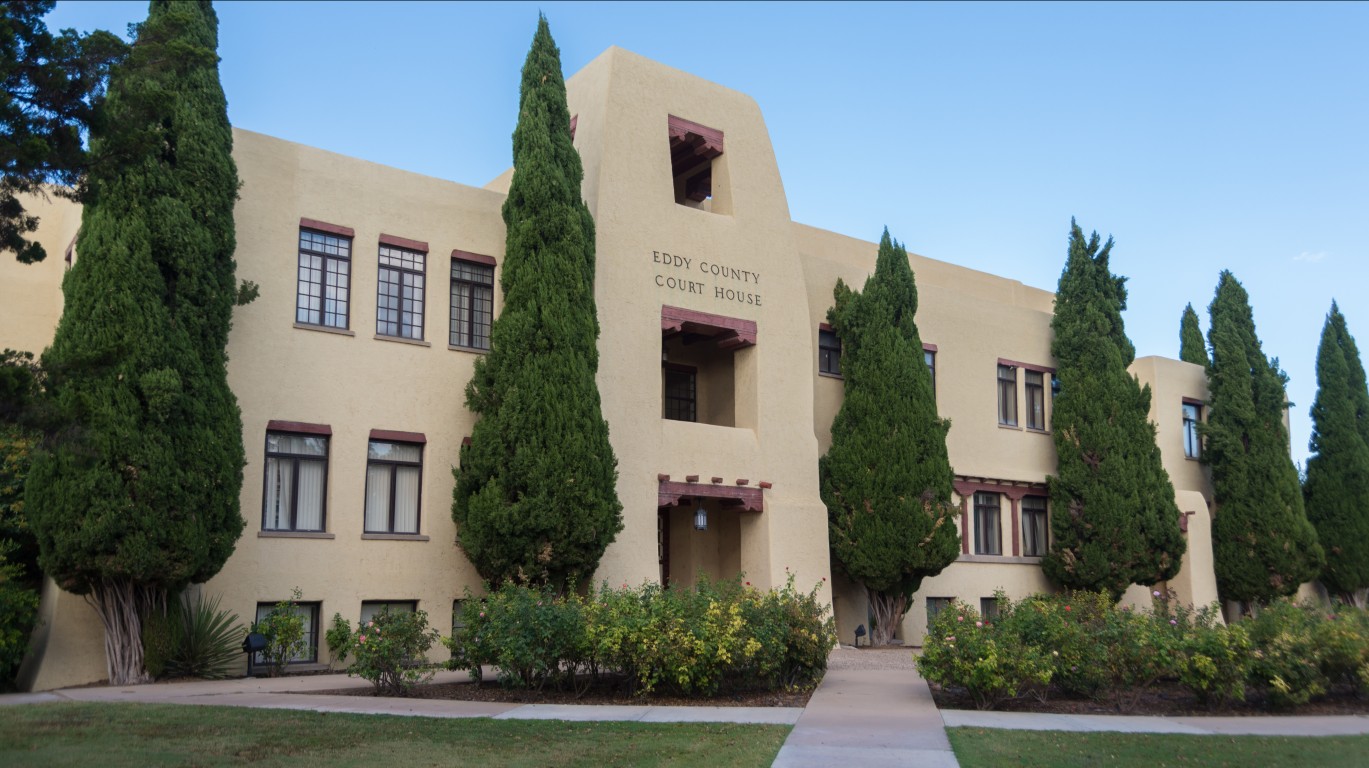
New Mexico: Eddy County
> Change in daily avg. new COVID-19 cases week over week: +6 per 100,000 people
> Avg. new daily cases in Eddy County in 7 days ending August 17: 17 per 100,000
> Avg. new daily cases in Eddy County in 7 days ending August 10: 10 per 100,000
> Avg. new daily cases in New Mexico in 7 days ending August 17: 8 per 100,000 (13th fewest)
> Cumulative confirmed COVID-19 cases in Eddy County as of August 17: 655 per 100,000 people (total: 376)
> Population: 57,437
> Largest place in Eddy County: Carlsbad
[in-text-ad]
New York: Chemung County
> Change in daily avg. new COVID-19 cases week over week: +2 per 100,000 people
> Avg. new daily cases in Chemung County in 7 days ending August 17: 3 per 100,000
> Avg. new daily cases in Chemung County in 7 days ending August 10: 1 per 100,000
> Avg. new daily cases in New York in 7 days ending August 17: 3 per 100,000 (5th fewest)
> Cumulative confirmed COVID-19 cases in Chemung County as of August 17: 222 per 100,000 people (total: 190)
> Population: 85,740
> Largest place in Chemung County: Elmira
[recirclink id=730024]
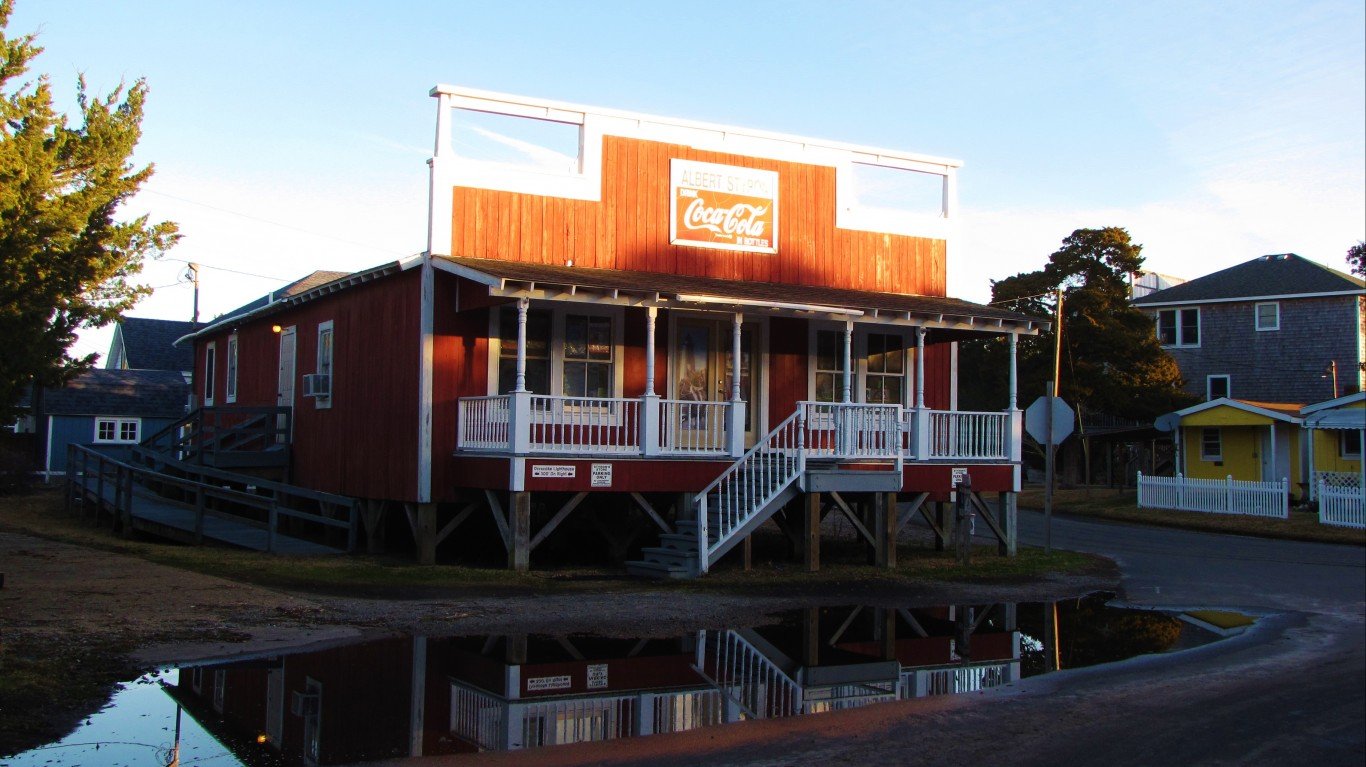
North Carolina: Hyde County
> Change in daily avg. new COVID-19 cases week over week: +23 per 100,000 people
> Avg. new daily cases in Hyde County in 7 days ending August 17: 31 per 100,000
> Avg. new daily cases in Hyde County in 7 days ending August 10: 8 per 100,000
> Avg. new daily cases in North Carolina in 7 days ending August 17: 13 per 100,000 (25th fewest)
> Cumulative confirmed COVID-19 cases in Hyde County as of August 17: 1,075 per 100,000 people (total: 58)
> Population: 5,393
> Largest place in Hyde County: Ocracoke CDP

North Dakota: McLean County
> Change in daily avg. new COVID-19 cases week over week: +27 per 100,000 people
> Avg. new daily cases in McLean County in 7 days ending August 17: 55 per 100,000
> Avg. new daily cases in McLean County in 7 days ending August 10: 29 per 100,000
> Avg. new daily cases in North Dakota in 7 days ending August 17: 18 per 100,000 (14th most)
> Cumulative confirmed COVID-19 cases in McLean County as of August 17: 1,062 per 100,000 people (total: 102)
> Population: 9,608
> Largest place in McLean County: Garrison
[in-text-ad-2]

Ohio: Madison County
> Change in daily avg. new COVID-19 cases week over week: +48 per 100,000 people
> Avg. new daily cases in Madison County in 7 days ending August 17: 63 per 100,000
> Avg. new daily cases in Madison County in 7 days ending August 10: 14 per 100,000
> Avg. new daily cases in Ohio in 7 days ending August 17: 9 per 100,000 (16th fewest)
> Cumulative confirmed COVID-19 cases in Madison County as of August 17: 1,353 per 100,000 people (total: 595)
> Population: 43,988
> Largest place in Madison County: London
Oklahoma: Osage County
> Change in daily avg. new COVID-19 cases week over week: +14 per 100,000 people
> Avg. new daily cases in Osage County in 7 days ending August 17: 28 per 100,000
> Avg. new daily cases in Osage County in 7 days ending August 10: 14 per 100,000
> Avg. new daily cases in Oklahoma in 7 days ending August 17: 17 per 100,000 (15th most)
> Cumulative confirmed COVID-19 cases in Osage County as of August 17: 1,192 per 100,000 people (total: 564)
> Population: 47,311
> Largest place in Osage County: Tulsa
[in-text-ad]

Oregon: Hood River County
> Change in daily avg. new COVID-19 cases week over week: +5 per 100,000 people
> Avg. new daily cases in Hood River County in 7 days ending August 17: 18 per 100,000
> Avg. new daily cases in Hood River County in 7 days ending August 10: 12 per 100,000
> Avg. new daily cases in Oregon in 7 days ending August 17: 7 per 100,000 (9th fewest)
> Cumulative confirmed COVID-19 cases in Hood River County as of August 17: 942 per 100,000 people (total: 218)
> Population: 23,131
> Largest place in Hood River County: Hood River
[recirclink id=730289]

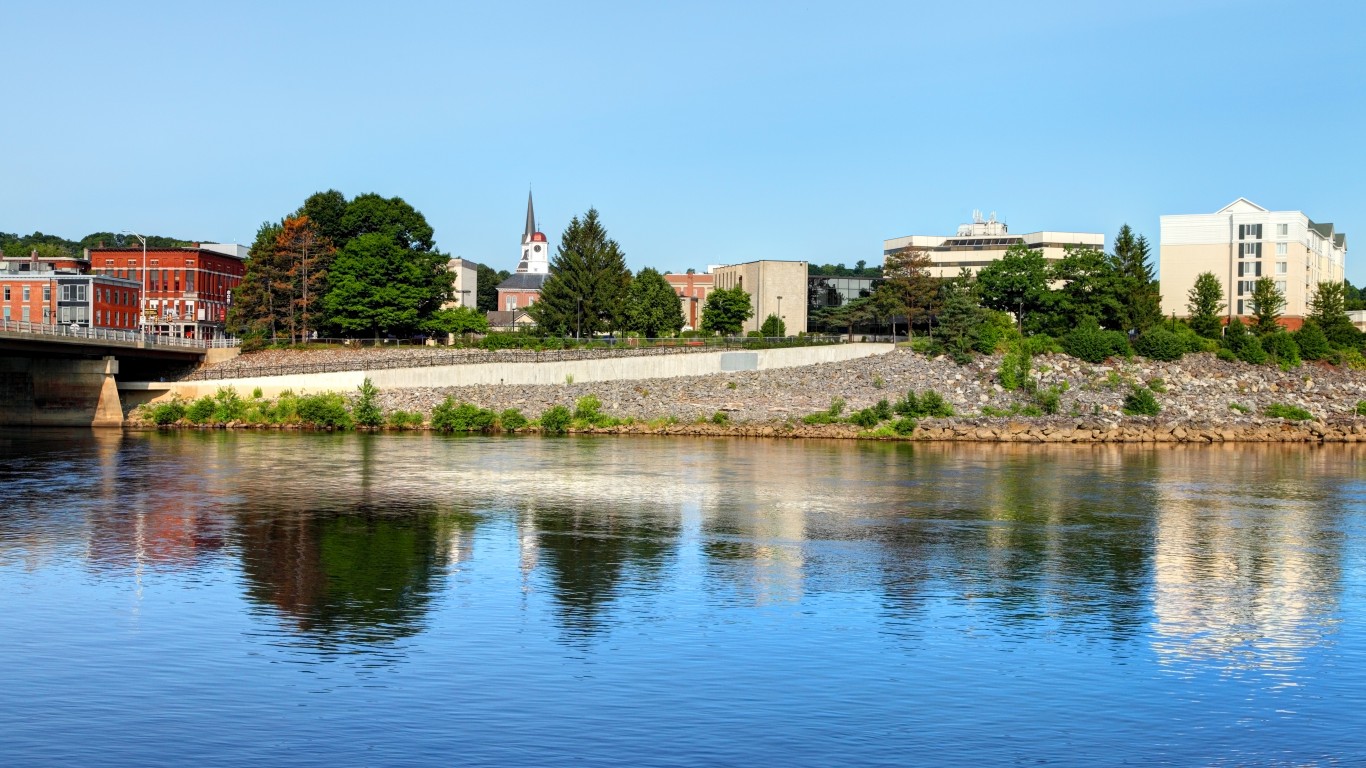
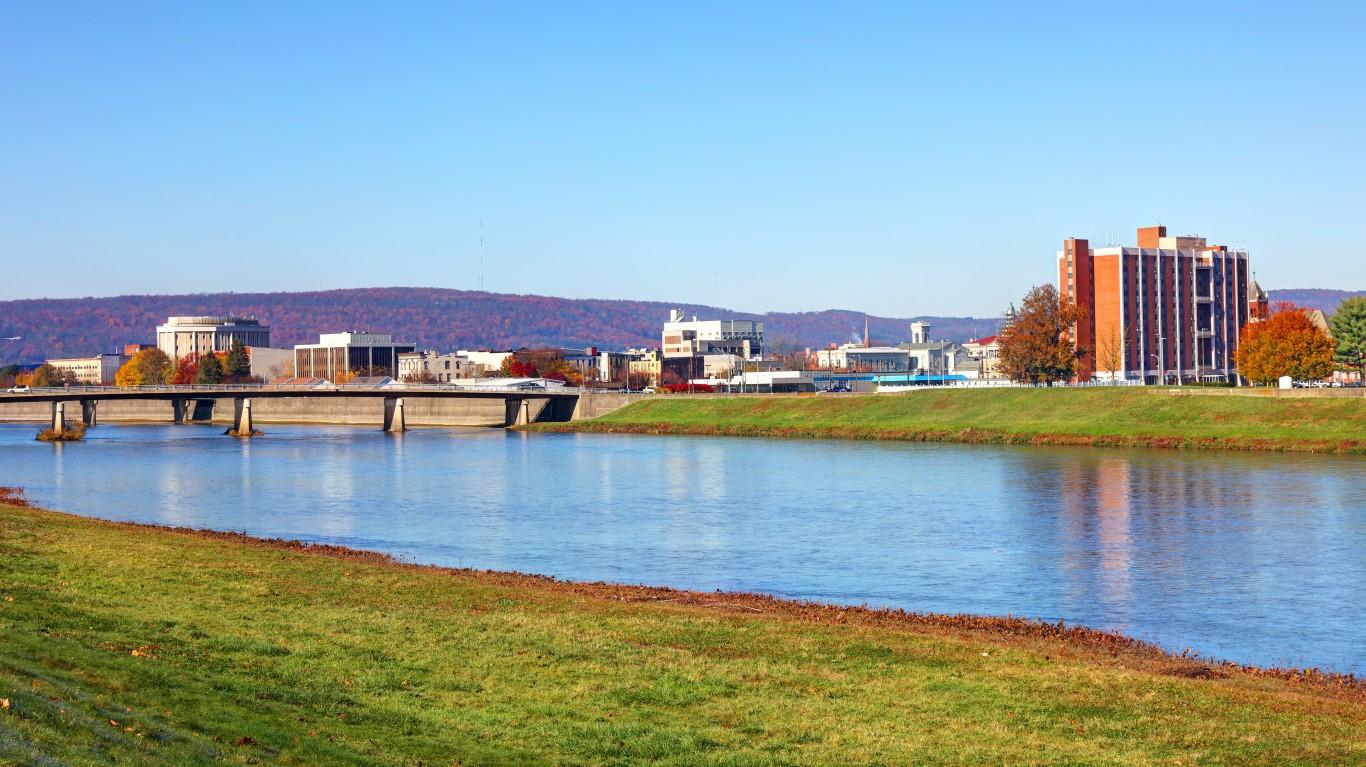
Pennsylvania: Northumberland County
> Change in daily avg. new COVID-19 cases week over week: +7 per 100,000 people
> Avg. new daily cases in Northumberland County in 7 days ending August 17: 14 per 100,000
> Avg. new daily cases in Northumberland County in 7 days ending August 10: 7 per 100,000
> Avg. new daily cases in Pennsylvania in 7 days ending August 17: 6 per 100,000 (8th fewest)
> Cumulative confirmed COVID-19 cases in Northumberland County as of August 17: 623 per 100,000 people (total: 575)
> Population: 92,325
> Largest place in Northumberland County: Sunbury

Rhode Island: Providence County
> Change in daily avg. new COVID-19 cases week over week: +2 per 100,000 people
> Avg. new daily cases in Providence County in 7 days ending August 17: 13 per 100,000
> Avg. new daily cases in Providence County in 7 days ending August 10: 11 per 100,000
> Avg. new daily cases in Rhode Island in 7 days ending August 17: 8 per 100,000 (14th fewest)
> Cumulative confirmed COVID-19 cases in Providence County as of August 17: 2,465 per 100,000 people (total: 15,644)
> Population: 634,533
> Largest place in Providence County: Providence
[in-text-ad-2]

South Carolina: McCormick County
> Change in daily avg. new COVID-19 cases week over week: +14 per 100,000 people
> Avg. new daily cases in McCormick County in 7 days ending August 17: 31 per 100,000
> Avg. new daily cases in McCormick County in 7 days ending August 10: 17 per 100,000
> Avg. new daily cases in South Carolina in 7 days ending August 17: 19 per 100,000 (11th most)
> Cumulative confirmed COVID-19 cases in McCormick County as of August 17: 1,468 per 100,000 people (total: 141)
> Population: 9,606
> Largest place in McCormick County: McCormick
South Dakota: Yankton County
> Change in daily avg. new COVID-19 cases week over week: +12 per 100,000 people
> Avg. new daily cases in Yankton County in 7 days ending August 17: 17 per 100,000
> Avg. new daily cases in Yankton County in 7 days ending August 10: 5 per 100,000
> Avg. new daily cases in South Dakota in 7 days ending August 17: 11 per 100,000 (17th fewest)
> Cumulative confirmed COVID-19 cases in Yankton County as of August 17: 691 per 100,000 people (total: 157)
> Population: 22,717
> Largest place in Yankton County: Yankton
[in-text-ad]

Tennessee: Overton County
> Change in daily avg. new COVID-19 cases week over week: +26 per 100,000 people
> Avg. new daily cases in Overton County in 7 days ending August 17: 53 per 100,000
> Avg. new daily cases in Overton County in 7 days ending August 10: 27 per 100,000
> Avg. new daily cases in Tennessee in 7 days ending August 17: 27 per 100,000 (3rd most)
> Cumulative confirmed COVID-19 cases in Overton County as of August 17: 1,272 per 100,000 people (total: 280)
> Population: 22,004
> Largest place in Overton County: Livingston
[recirclink id=729078]
Texas: Wharton County
> Change in daily avg. new COVID-19 cases week over week: +59 per 100,000 people
> Avg. new daily cases in Wharton County in 7 days ending August 17: 90 per 100,000
> Avg. new daily cases in Wharton County in 7 days ending August 10: 31 per 100,000
> Avg. new daily cases in Texas in 7 days ending August 17: 24 per 100,000 (7th most)
> Cumulative confirmed COVID-19 cases in Wharton County as of August 17: 2,455 per 100,000 people (total: 1,020)
> Population: 41,551
> Largest place in Wharton County: El Campo
Utah: Wasatch County
> Change in daily avg. new COVID-19 cases week over week: +5 per 100,000 people
> Avg. new daily cases in Wasatch County in 7 days ending August 17: 17 per 100,000
> Avg. new daily cases in Wasatch County in 7 days ending August 10: 12 per 100,000
> Avg. new daily cases in Utah in 7 days ending August 17: 12 per 100,000 (22nd fewest)
> Cumulative confirmed COVID-19 cases in Wasatch County as of August 17: 1,966 per 100,000 people (total: 600)
> Population: 30,523
> Largest place in Wasatch County: Heber
[in-text-ad-2]

Vermont: Chittenden County
> Change in daily avg. new COVID-19 cases week over week: +1 per 100,000 people
> Avg. new daily cases in Chittenden County in 7 days ending August 17: 2 per 100,000
> Avg. new daily cases in Chittenden County in 7 days ending August 10: 1 per 100,000
> Avg. new daily cases in Vermont in 7 days ending August 17: 1 per 100,000 (2nd fewest)
> Cumulative confirmed COVID-19 cases in Chittenden County as of August 17: 471 per 100,000 people (total: 763)
> Population: 162,052
> Largest place in Chittenden County: Burlington

Virginia: Greensville County
> Change in daily avg. new COVID-19 cases week over week: +63 per 100,000 people
> Avg. new daily cases in Greensville County in 7 days ending August 17: 111 per 100,000
> Avg. new daily cases in Greensville County in 7 days ending August 10: 48 per 100,000
> Avg. new daily cases in Virginia in 7 days ending August 17: 12 per 100,000 (23rd fewest)
> Cumulative confirmed COVID-19 cases in Greensville County as of August 17: 4,906 per 100,000 people (total: 572)
> Population: 11,659
> Largest place in Greensville County: Jarratt
[in-text-ad]
Washington: Grant County
> Change in daily avg. new COVID-19 cases week over week: +11 per 100,000 people
> Avg. new daily cases in Grant County in 7 days ending August 17: 41 per 100,000
> Avg. new daily cases in Grant County in 7 days ending August 10: 30 per 100,000
> Avg. new daily cases in Washington in 7 days ending August 17: 9 per 100,000 (15th fewest)
> Cumulative confirmed COVID-19 cases in Grant County as of August 17: 1,932 per 100,000 people (total: 1,833)
> Population: 94,860
> Largest place in Grant County: Moses Lake
[recirclink id=729561]
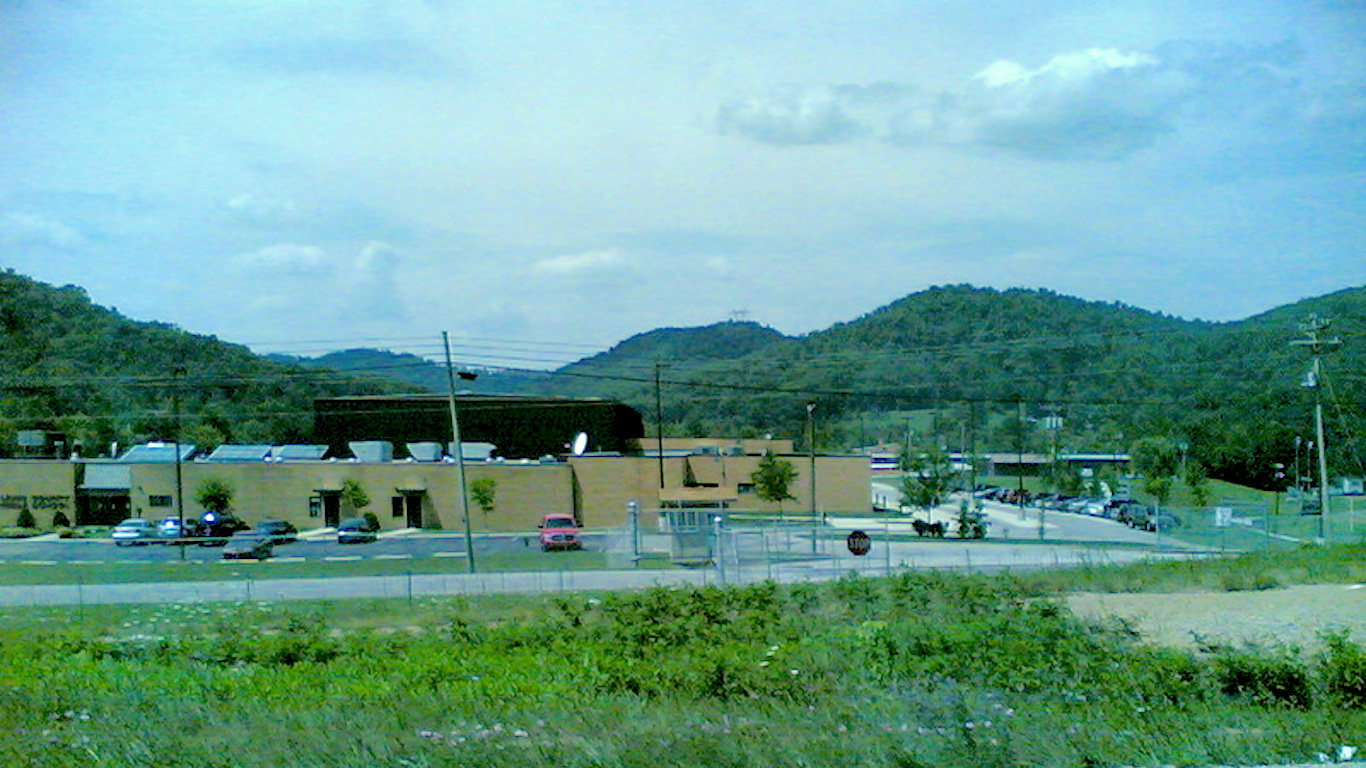
West Virginia: Logan County
> Change in daily avg. new COVID-19 cases week over week: +16 per 100,000 people
> Avg. new daily cases in Logan County in 7 days ending August 17: 46 per 100,000
> Avg. new daily cases in Logan County in 7 days ending August 10: 30 per 100,000
> Avg. new daily cases in West Virginia in 7 days ending August 17: 7 per 100,000 (10th fewest)
> Cumulative confirmed COVID-19 cases in Logan County as of August 17: 1,071 per 100,000 people (total: 362)
> Population: 33,801
> Largest place in Logan County: Mount Gay-Shamrock CDP

Wisconsin: Lafayette County
> Change in daily avg. new COVID-19 cases week over week: +14 per 100,000 people
> Avg. new daily cases in Lafayette County in 7 days ending August 17: 32 per 100,000
> Avg. new daily cases in Lafayette County in 7 days ending August 10: 18 per 100,000
> Avg. new daily cases in Wisconsin in 7 days ending August 17: 13 per 100,000 (24th most)
> Cumulative confirmed COVID-19 cases in Lafayette County as of August 17: 1,028 per 100,000 people (total: 172)
> Population: 16,735
> Largest place in Lafayette County: Darlington
[in-text-ad-2]
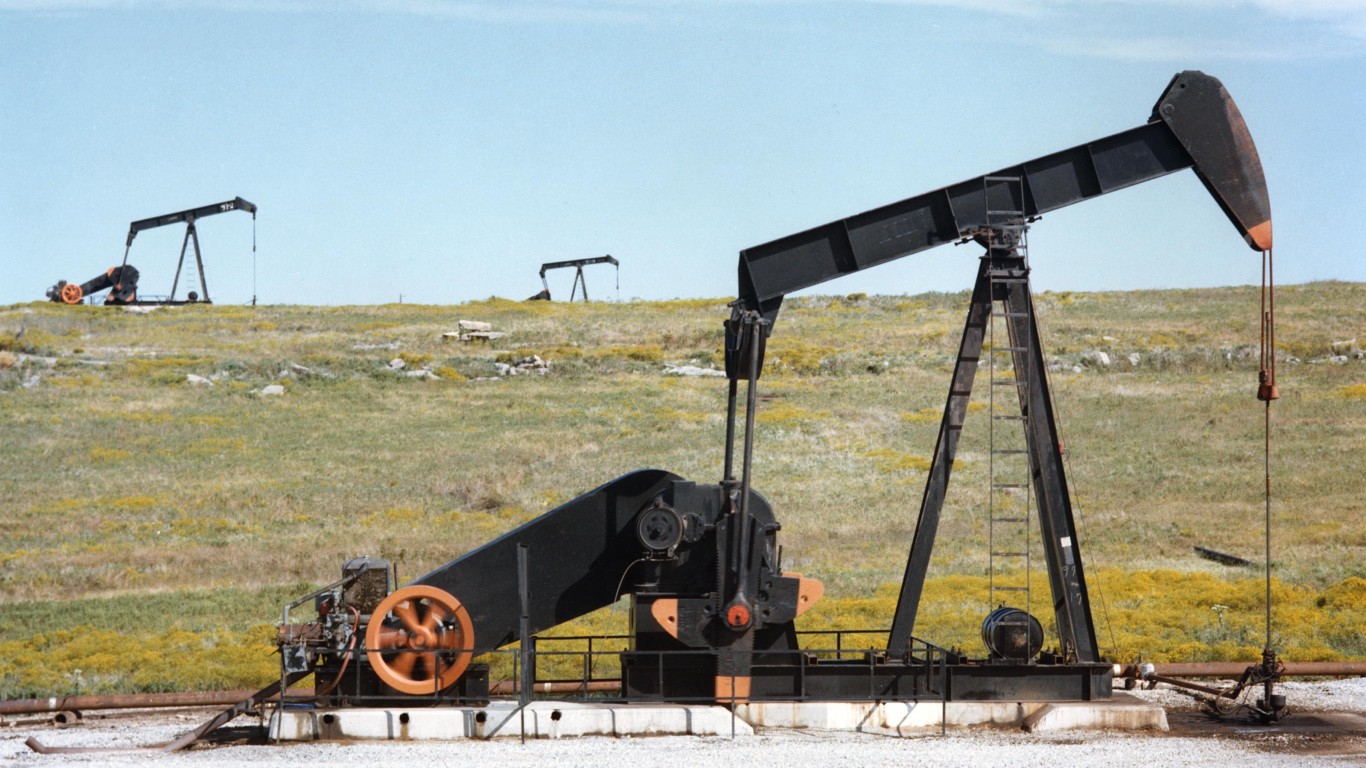
Wyoming: Carbon County
> Change in daily avg. new COVID-19 cases week over week: +12 per 100,000 people
> Avg. new daily cases in Carbon County in 7 days ending August 17: 30 per 100,000
> Avg. new daily cases in Carbon County in 7 days ending August 10: 18 per 100,000
> Avg. new daily cases in Wyoming in 7 days ending August 17: 5 per 100,000 (7th fewest)
> Cumulative confirmed COVID-19 cases in Carbon County as of August 17: 1,092 per 100,000 people (total: 169)
> Population: 15,477
> Largest place in Carbon County: Rawlins
Contact [email protected] for any questions or corrections.