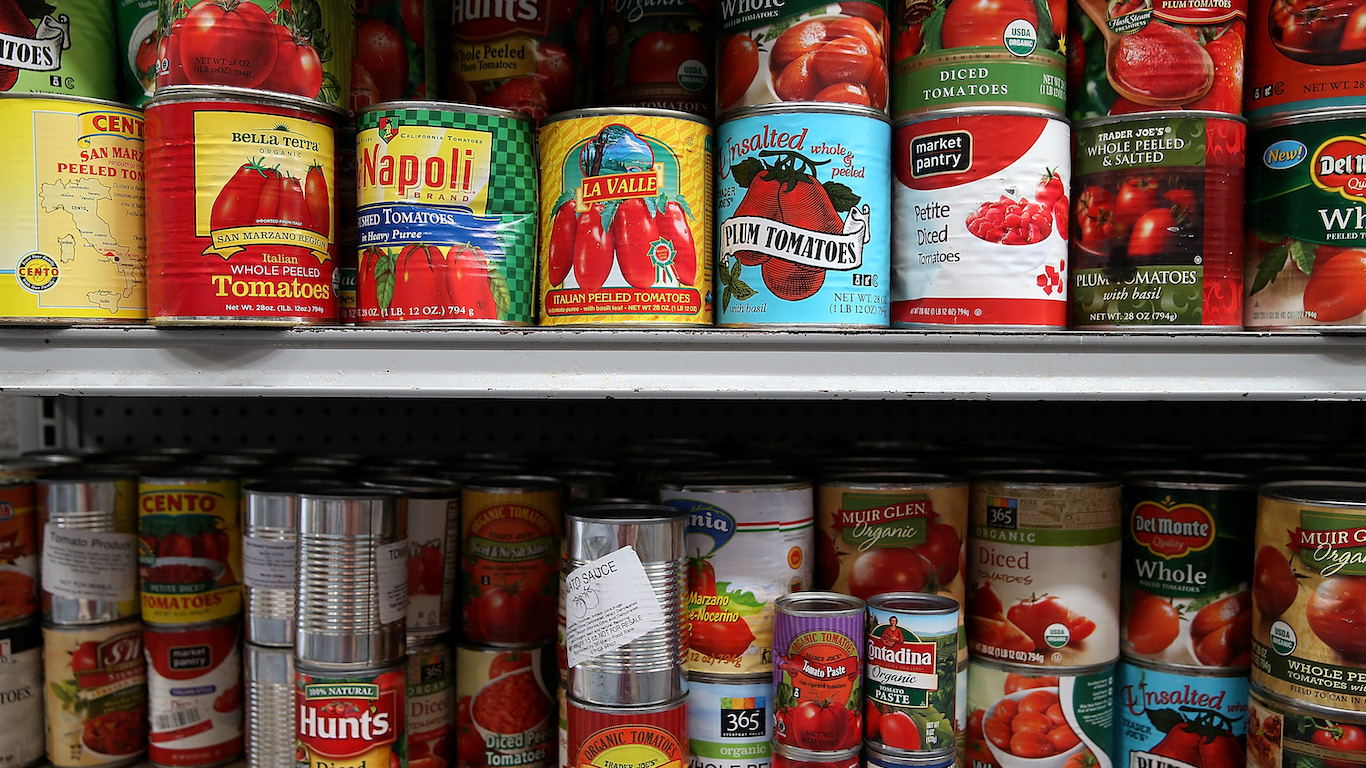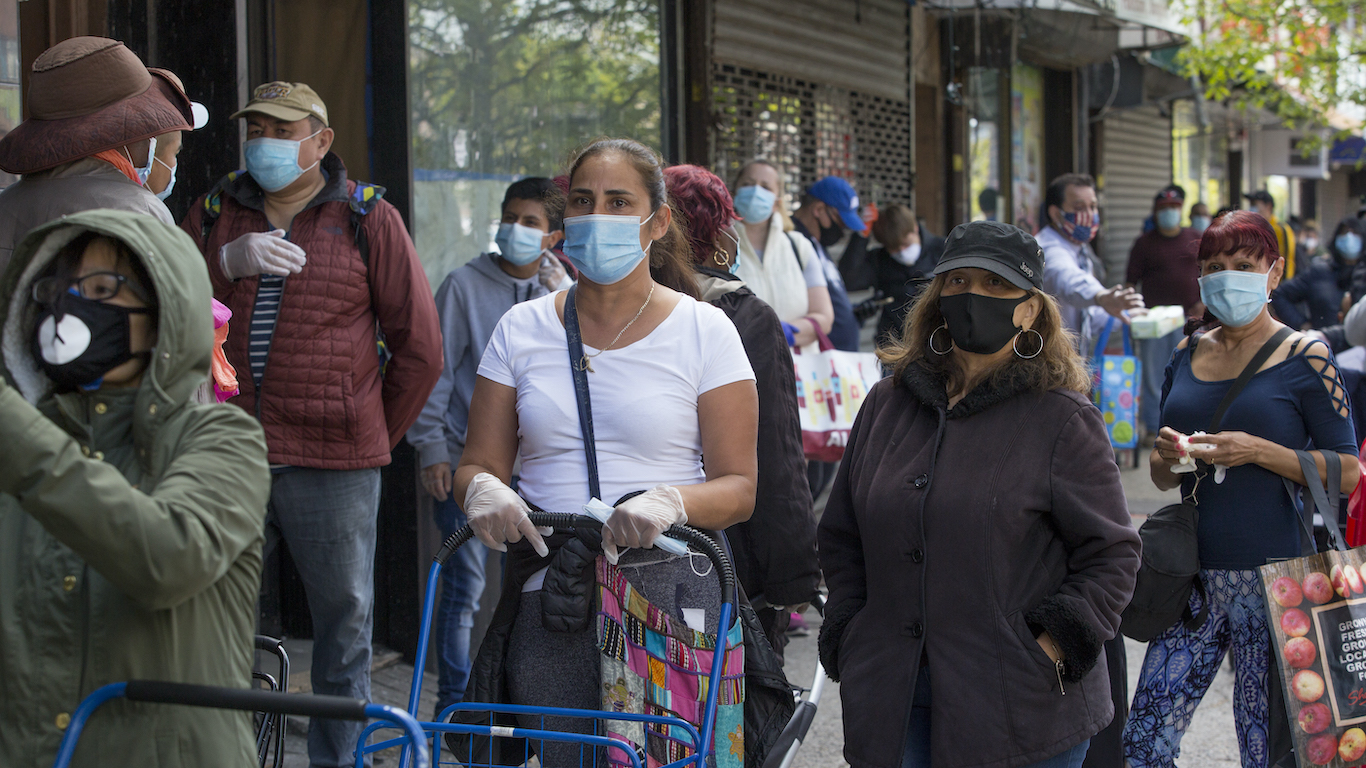
The world’s largest economy and food-producing country has faced a hunger crisis even before the coronavirus pandemic, which has exacerbated the problem. Miles of cars lined up to receive meals from food banks, as the unprecedented surge in unemployment created skyrocketing demand for food assistance that overwhelmed food pantries and affected large segments of the U.S. population.
In 2019, before the coronavirus pandemic was declared a national emergency in 2020, the U.S. government spent $92.4 billion on food assistance programs, accounting for 2.4% of the $4.4 trillion in government spending that fiscal year. The program spending was down by 5% from the previous year and by 22% from the recent peak spending year in 2013.
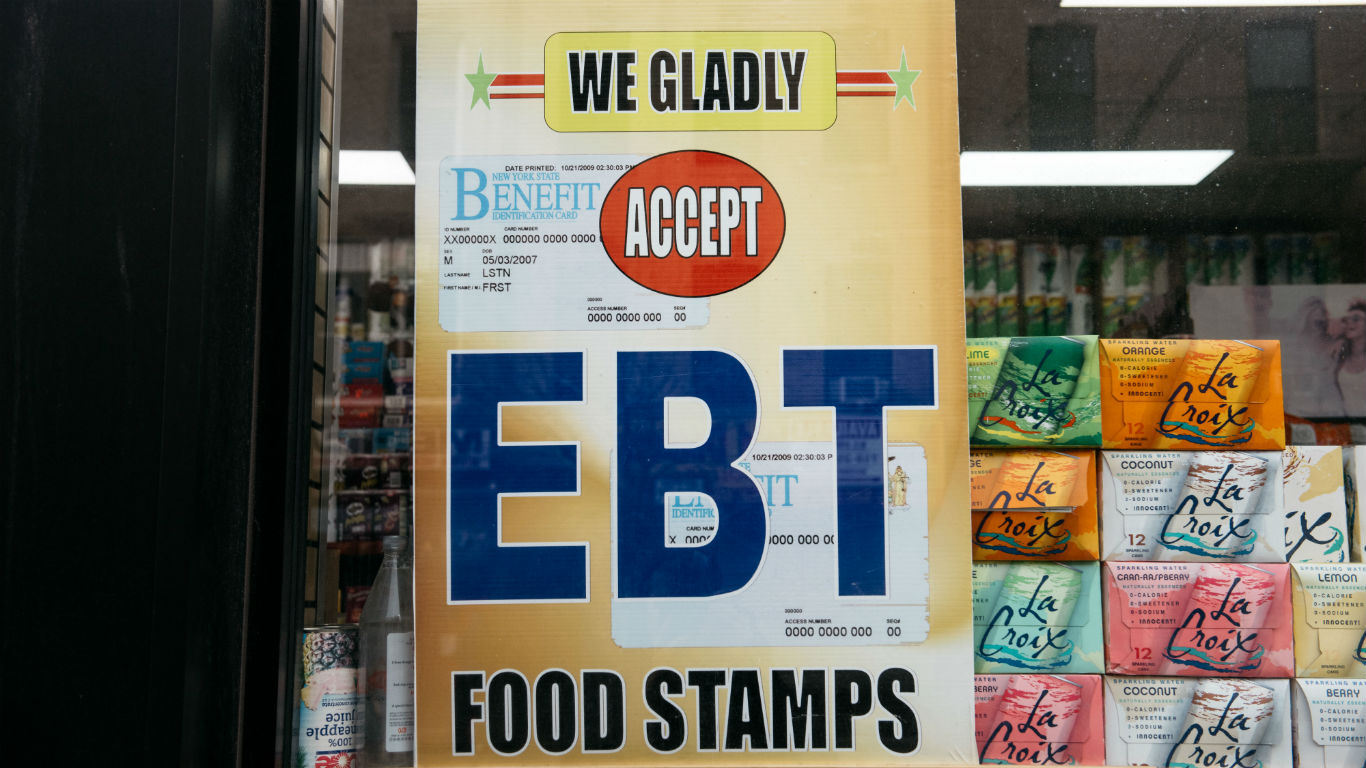
Americans have access to 15 nutrition assistance programs administered by the U.S. Department of Agriculture. Millions of families across the country have received benefits through these government programs, which include the Supplemental Nutrition Assistance Program (SNAP), the national school lunch program, and the Special Supplemental Nutrition Program for Women, Infants, and Children (WIC program). Here’s how many children live in poverty in your state.
SNAP provided relief to an average of 35.7 million people every month in 2019. The national school lunch program, the second largest food assistance program, served 29.4 million children each school day in 2019. The WIC program provided food assistance to 6.4 million people each month. In 2017, 7.3 million people received WIC benefits, including half of all children born in the U.S. that year.
24/7 Wall St. reviewed the latest available monthly food assistance program statistics for March and April 2020 in every state. We concentrated on SNAP, the largest nutrition assistance program. In March, shortly after the start of the U.S. outbreak, 37.1 million individuals received SNAP benefits. In April, that figure rose 15.8% to 43.0 million people, well above the pre-pandemic monthly average.
While more recent data is not available, the increase even at that time was likely tied to the job losses, public health crises, rising food prices, and other factors associated with the coronavirus. All but four states reported increases in SNAP recipients between March and April this year. Click here to see 19 groceries driving up your bill during the pandemic.
Click here to see the state’s pandemic food assistance is spike
Click here to read our methodology

Alabama
> SNAP recipients Mar 2020 vs Apr 2020: 4.7% (from 706,626 to 739,950) — 13th smallest
> SNAP recipients Apr 2019 vs Apr 2020: 3.2% (from 717,163 to 739,950) — 20th smallest
> SNAP benefits Mar 2020 vs Apr 2020: 3.8% (from $124.6 million to $129.3 million) — 4th smallest
> SNAP benefits Apr 2019 vs Apr 2020: 53.8% (from $84.0 million to $129.3 million) — 12th smallest
> Food insecure households pre-pandemic: 16.3% — 5th highest
> Unemployment rate Mar 2020: 3.0% — 11th lowest
> Unemployment rate Apr 2020: 13.8% — 24th highest
> Confirmed COVID-19 cases, Aug 30, 2020: 2,562 per 100,000 — 5th highest
[in-text-ad]

Alaska
> SNAP recipients Mar 2020 vs Apr 2020: 5.4% (from 80,824 to 85,150) — 17th smallest
> SNAP recipients Apr 2019 vs Apr 2020: -2.7% (from 87,526 to 85,150) — 4th smallest
> SNAP benefits Mar 2020 vs Apr 2020: 46.2% (from $13.9 million to $20.4 million) — 19th smallest
> SNAP benefits Apr 2019 vs Apr 2020: 38.7% (from $14.7 million to $20.4 million) — 5th smallest
> Food insecure households pre-pandemic: 11.6% — 22nd lowest
> Unemployment rate Mar 2020: 5.2% — 9th highest
> Unemployment rate Apr 2020: 13.5% — 24th lowest
> Confirmed COVID-19 cases, Aug 30, 2020: 825 per 100,000 — 9th lowest
[recirclink id=728915]

Arizona
> SNAP recipients Mar 2020 vs Apr 2020: 25.6% (from 790,961 to 993,751) — 6th largest
> SNAP recipients Apr 2019 vs Apr 2020: 29.1% (from 769,805 to 993,751) — 5th largest
> SNAP benefits Mar 2020 vs Apr 2020: 78.7% (from $95.9 million to $171.4 million) — 13th largest
> SNAP benefits Apr 2019 vs Apr 2020: 86.1% (from $92.1 million to $171.4 million) — 14th largest
> Food insecure households pre-pandemic: 13.1% — 18th highest
> Unemployment rate Mar 2020: 6.1% — 4th highest
> Unemployment rate Apr 2020: 13.4% — 22nd lowest
> Confirmed COVID-19 cases, Aug 30, 2020: 2,812 per 100,000 — 3rd highest

Arkansas
> SNAP recipients Mar 2020 vs Apr 2020: 13.0% (from 337,151 to 381,027) — 15th largest
> SNAP recipients Apr 2019 vs Apr 2020: 9.8% (from 347,080 to 381,027) — 19th largest
> SNAP benefits Mar 2020 vs Apr 2020: 14.0% (from $56.8 million to $64.8 million) — 10th smallest
> SNAP benefits Apr 2019 vs Apr 2020: 75.1% (from $37.0 million to $64.8 million) — 19th largest
> Food insecure households pre-pandemic: 17.4% — 2nd highest
> Unemployment rate Mar 2020: 5.0% — 15th highest
> Unemployment rate Apr 2020: 10.8% — 10th lowest
> Confirmed COVID-19 cases, Aug 30, 2020: 2,019 per 100,000 — 15th highest
[in-text-ad-2]

California
> SNAP recipients Mar 2020 vs Apr 2020: 10.1% (from 4,041,712 to 4,451,007) — 20th largest
> SNAP recipients Apr 2019 vs Apr 2020: 22.8% (from 3,623,654 to 4,451,007) — 7th largest
> SNAP benefits Mar 2020 vs Apr 2020: 54.4% (from $498.0 million to $768.8 million) — 21st smallest
> SNAP benefits Apr 2019 vs Apr 2020: 60.4% (from $479.4 million to $768.8 million) — 21st smallest
> Food insecure households pre-pandemic: 11.2% — 19th lowest
> Unemployment rate Mar 2020: 5.5% — 8th highest
> Unemployment rate Apr 2020: 16.4% — 11th highest
> Confirmed COVID-19 cases, Aug 30, 2020: 1,769 per 100,000 — 20th highest

Colorado
> SNAP recipients Mar 2020 vs Apr 2020: 15.4% (from 439,355 to 507,074) — 12th largest
> SNAP recipients Apr 2019 vs Apr 2020: 13.2% (from 447,801 to 507,074) — 10th largest
> SNAP benefits Mar 2020 vs Apr 2020: 111.5% (from $53.5 million to $113.1 million) — 3rd largest
> SNAP benefits Apr 2019 vs Apr 2020: 113.1% (from $53.1 million to $113.1 million) — 5th largest
> Food insecure households pre-pandemic: 9.2% — 4th lowest
> Unemployment rate Mar 2020: 5.2% — 9th highest
> Unemployment rate Apr 2020: 12.2% — 18th lowest
> Confirmed COVID-19 cases, Aug 30, 2020: 1,005 per 100,000 — 11th lowest
[in-text-ad]

Connecticut
> SNAP recipients Mar 2020 vs Apr 2020: 5.5% (from 360,128 to 379,936) — 18th smallest
> SNAP recipients Apr 2019 vs Apr 2020: 4.3% (from 364,182 to 379,936) — 22nd smallest
> SNAP benefits Mar 2020 vs Apr 2020: 73.6% (from $47.8 million to $83.0 million) — 18th largest
> SNAP benefits Apr 2019 vs Apr 2020: 73.3% (from $47.9 million to $83.0 million) — 22nd largest
> Food insecure households pre-pandemic: 12.2% — 25th highest
> Unemployment rate Mar 2020: 3.4% — 20th lowest
> Unemployment rate Apr 2020: 8.3% — the lowest
> Confirmed COVID-19 cases, Aug 30, 2020: 1,469 per 100,000 — 23rd lowest
[recirclink id=715712]

Delaware
> SNAP recipients Mar 2020 vs Apr 2020: 9.6% (from 114,978 to 126,015) — 22nd largest
> SNAP recipients Apr 2019 vs Apr 2020: -1.8% (from 128,321 to 126,015) — 7th smallest
> SNAP benefits Mar 2020 vs Apr 2020: 61.6% (from $13.1 million to $21.2 million) — 24th largest
> SNAP benefits Apr 2019 vs Apr 2020: 46.0% (from $14.6 million to $21.2 million) — 9th smallest
> Food insecure households pre-pandemic: 11.1% — 17th lowest
> Unemployment rate Mar 2020: 5.0% — 15th highest
> Unemployment rate Apr 2020: 14.9% — 21st highest
> Confirmed COVID-19 cases, Aug 30, 2020: 1,793 per 100,000 — 18th highest

Florida
> SNAP recipients Mar 2020 vs Apr 2020: 18.5% (from 2,634,892 to 3,123,525) — 8th largest
> SNAP recipients Apr 2019 vs Apr 2020: 12.9% (from 2,765,663 to 3,123,525) — 11th largest
> SNAP benefits Mar 2020 vs Apr 2020: 17.9% (from $479.3 million to $565.1 million) — 11th smallest
> SNAP benefits Apr 2019 vs Apr 2020: 74.2% (from $324.4 million to $565.1 million) — 20th largest
> Food insecure households pre-pandemic: 11.9% — 24th lowest
> Unemployment rate Mar 2020: 4.4% — 19th highest
> Unemployment rate Apr 2020: 13.8% — 24th highest
> Confirmed COVID-19 cases, Aug 30, 2020: 2,918 per 100,000 — 2nd highest
[in-text-ad-2]

Georgia
> SNAP recipients Mar 2020 vs Apr 2020: -0.9% (from 1,320,269 to 1,308,963) — 3rd smallest
> SNAP recipients Apr 2019 vs Apr 2020: -6.3% (from 1,397,447 to 1,308,963) — 2nd smallest
> SNAP benefits Mar 2020 vs Apr 2020: -34.1% (from $246.5 million to $162.3 million) — the smallest
> SNAP benefits Apr 2019 vs Apr 2020: -4.0% (from $169.1 million to $162.3 million) — 2nd smallest
> Food insecure households pre-pandemic: 13.0% — 19th highest
> Unemployment rate Mar 2020: 4.6% — 18th highest
> Unemployment rate Apr 2020: 12.6% — 19th lowest
> Confirmed COVID-19 cases, Aug 30, 2020: 2,557 per 100,000 — 6th highest

Hawaii
> SNAP recipients Mar 2020 vs Apr 2020: 12.0% (from 153,047 to 171,451) — 18th largest
> SNAP recipients Apr 2019 vs Apr 2020: 11.0% (from 154,526 to 171,451) — 17th largest
> SNAP benefits Mar 2020 vs Apr 2020: 13.6% (from $49.7 million to $56.5 million) — 9th smallest
> SNAP benefits Apr 2019 vs Apr 2020: 54.1% (from $36.7 million to $56.5 million) — 13th smallest
> Food insecure households pre-pandemic: 7.4% — the lowest
> Unemployment rate Mar 2020: 2.4% — 3rd lowest
> Unemployment rate Apr 2020: 23.8% — 3rd highest
> Confirmed COVID-19 cases, Aug 30, 2020: 573 per 100,000 — 5th lowest
[in-text-ad]

Idaho
> SNAP recipients Mar 2020 vs Apr 2020: 3.0% (from 148,022 to 152,412) — 7th smallest
> SNAP recipients Apr 2019 vs Apr 2020: 3.8% (from 146,903 to 152,412) — 21st smallest
> SNAP benefits Mar 2020 vs Apr 2020: 56.4% (from $16.0 million to $25.0 million) — 22nd smallest
> SNAP benefits Apr 2019 vs Apr 2020: 54.8% (from $16.2 million to $25.0 million) — 16th smallest
> Food insecure households pre-pandemic: 11.0% — 16th lowest
> Unemployment rate Mar 2020: 2.5% — 4th lowest
> Unemployment rate Apr 2020: 11.8% — 14th lowest
> Confirmed COVID-19 cases, Aug 30, 2020: 1,817 per 100,000 — 17th highest
[recirclink id=593555]

Illinois
> SNAP recipients Mar 2020 vs Apr 2020: 10.1% (from 1,752,080 to 1,929,163) — 21st largest
> SNAP recipients Apr 2019 vs Apr 2020: 11.1% (from 1,737,117 to 1,929,163) — 15th largest
> SNAP benefits Mar 2020 vs Apr 2020: 102.5% (from $218.2 million to $441.9 million) — 5th largest
> SNAP benefits Apr 2019 vs Apr 2020: 106.1% (from $214.5 million to $441.9 million) — 7th largest
> Food insecure households pre-pandemic: 11.2% — 19th lowest
> Unemployment rate Mar 2020: 4.2% — 22nd highest
> Unemployment rate Apr 2020: 17.2% — 7th highest
> Confirmed COVID-19 cases, Aug 30, 2020: 1,832 per 100,000 — 16th highest

Indiana
> SNAP recipients Mar 2020 vs Apr 2020: -3.5% (from 565,717 to 546,121) — the smallest
> SNAP recipients Apr 2019 vs Apr 2020: -3.5% (from 566,081 to 546,121) — 3rd smallest
> SNAP benefits Mar 2020 vs Apr 2020: 73.3% (from $67.9 million to $117.7 million) — 19th largest
> SNAP benefits Apr 2019 vs Apr 2020: 74.0% (from $67.7 million to $117.7 million) — 21st largest
> Food insecure households pre-pandemic: 13.6% — 13th highest
> Unemployment rate Mar 2020: 3.0% — 11th lowest
> Unemployment rate Apr 2020: 17.5% — 6th highest
> Confirmed COVID-19 cases, Aug 30, 2020: 1,394 per 100,000 — 20th lowest
[in-text-ad-2]

Iowa
> SNAP recipients Mar 2020 vs Apr 2020: 12.4% (from 287,997 to 323,637) — 17th largest
> SNAP recipients Apr 2019 vs Apr 2020: 1.8% (from 317,878 to 323,637) — 14th smallest
> SNAP benefits Mar 2020 vs Apr 2020: 76.1% (from $32.0 million to $56.3 million) — 15th largest
> SNAP benefits Apr 2019 vs Apr 2020: 59.7% (from $35.2 million to $56.3 million) — 19th smallest
> Food insecure households pre-pandemic: 10.5% — 12th lowest
> Unemployment rate Mar 2020: 3.3% — 19th lowest
> Unemployment rate Apr 2020: 11.0% — 12th lowest
> Confirmed COVID-19 cases, Aug 30, 2020: 2,031 per 100,000 — 14th highest
Kansas
> SNAP recipients Mar 2020 vs Apr 2020: 6.5% (from 189,527 to 201,869) — 20th smallest
> SNAP recipients Apr 2019 vs Apr 2020: 2.6% (from 196,818 to 201,869) — 17th smallest
> SNAP benefits Mar 2020 vs Apr 2020: 63.1% (from $20.6 million to $33.7 million) — 21st largest
> SNAP benefits Apr 2019 vs Apr 2020: 57.0% (from $21.4 million to $33.7 million) — 17th smallest
> Food insecure households pre-pandemic: 13.3% — 16th highest
> Unemployment rate Mar 2020: 2.8% — 6th lowest
> Unemployment rate Apr 2020: 11.9% — 17th lowest
> Confirmed COVID-19 cases, Aug 30, 2020: 1,410 per 100,000 — 22nd lowest
[in-text-ad]

Kentucky
> SNAP recipients Mar 2020 vs Apr 2020: 16.1% (from 510,411 to 592,538) — 10th largest
> SNAP recipients Apr 2019 vs Apr 2020: 11.0% (from 533,922 to 592,538) — 16th largest
> SNAP benefits Mar 2020 vs Apr 2020: 76.1% (from $60.1 million to $105.8 million) — 14th largest
> SNAP benefits Apr 2019 vs Apr 2020: 75.4% (from $60.3 million to $105.8 million) — 18th largest
> Food insecure households pre-pandemic: 14.7% — 8th highest
> Unemployment rate Mar 2020: 5.2% — 9th highest
> Unemployment rate Apr 2020: 16.6% — 9th highest
> Confirmed COVID-19 cases, Aug 30, 2020: 1,065 per 100,000 — 14th lowest
[recirclink id=731581]

Louisiana
> SNAP recipients Mar 2020 vs Apr 2020: 5.0% (from 774,468 to 812,957) — 15th smallest
> SNAP recipients Apr 2019 vs Apr 2020: 2.4% (from 794,152 to 812,957) — 16th smallest
> SNAP benefits Mar 2020 vs Apr 2020: 44.9% (from $113.8 million to $165.0 million) — 17th smallest
> SNAP benefits Apr 2019 vs Apr 2020: 70.2% (from $96.9 million to $165.0 million) — 23rd largest
> Food insecure households pre-pandemic: 17.3% — 3rd highest
> Unemployment rate Mar 2020: 6.7% — 2nd highest
> Unemployment rate Apr 2020: 15.1% — 20th highest
> Confirmed COVID-19 cases, Aug 30, 2020: 3,173 per 100,000 — the highest

Maine
> SNAP recipients Mar 2020 vs Apr 2020: 12.7% (from 153,770 to 173,241) — 16th largest
> SNAP recipients Apr 2019 vs Apr 2020: 11.2% (from 155,769 to 173,241) — 14th largest
> SNAP benefits Mar 2020 vs Apr 2020: 79.3% (from $17.1 million to $30.7 million) — 12th largest
> SNAP benefits Apr 2019 vs Apr 2020: 80.9% (from $17.0 million to $30.7 million) — 16th largest
> Food insecure households pre-pandemic: 14.4% — 9th highest
> Unemployment rate Mar 2020: 3.0% — 11th lowest
> Unemployment rate Apr 2020: 10.4% — 9th lowest
> Confirmed COVID-19 cases, Aug 30, 2020: 337 per 100,000 — 2nd lowest
[in-text-ad-2]

Maryland
> SNAP recipients Mar 2020 vs Apr 2020: 15.9% (from 594,828 to 689,530) — 11th largest
> SNAP recipients Apr 2019 vs Apr 2020: 12.6% (from 612,581 to 689,530) — 12th largest
> SNAP benefits Mar 2020 vs Apr 2020: 76.0% (from $68.3 million to $120.2 million) — 16th largest
> SNAP benefits Apr 2019 vs Apr 2020: 69.7% (from $70.8 million to $120.2 million) — 25th largest
> Food insecure households pre-pandemic: 10.4% — 11th lowest
> Unemployment rate Mar 2020: 3.3% — 19th lowest
> Unemployment rate Apr 2020: 10.1% — 6th lowest
> Confirmed COVID-19 cases, Aug 30, 2020: 1,784 per 100,000 — 19th highest

Massachusetts
> SNAP recipients Mar 2020 vs Apr 2020: 89.5% (from 813,078 to 1,540,693) — the largest
> SNAP recipients Apr 2019 vs Apr 2020: 104.7% (from 752,757 to 1,540,693) — the largest
> SNAP benefits Mar 2020 vs Apr 2020: 61.1% (from $110.8 million to $178.6 million) — 24th smallest
> SNAP benefits Apr 2019 vs Apr 2020: 93.9% (from $92.1 million to $178.6 million) — 11th largest
> Food insecure households pre-pandemic: 10.2% — 10th lowest
> Unemployment rate Mar 2020: 2.8% — 6th lowest
> Unemployment rate Apr 2020: 16.2% — 15th highest
> Confirmed COVID-19 cases, Aug 30, 2020: 1,717 per 100,000 — 22nd highest
[in-text-ad]

Michigan
> SNAP recipients Mar 2020 vs Apr 2020: 68.7% (from 1,235,969 to 2,085,651) — 2nd largest
> SNAP recipients Apr 2019 vs Apr 2020: 77.4% (from 1,175,365 to 2,085,651) — 2nd largest
> SNAP benefits Mar 2020 vs Apr 2020: 75.9% (from $207.4 million to $364.9 million) — 17th largest
> SNAP benefits Apr 2019 vs Apr 2020: 160.1% (from $140.3 million to $364.9 million) — the largest
> Food insecure households pre-pandemic: 13.6% — 13th highest
> Unemployment rate Mar 2020: 4.3% — 20th highest
> Unemployment rate Apr 2020: 24.0% — 2nd highest
> Confirmed COVID-19 cases, Aug 30, 2020: 1,126 per 100,000 — 15th lowest
[recirclink id=731694]

Minnesota
> SNAP recipients Mar 2020 vs Apr 2020: 9.0% (from 391,236 to 426,477) — 23rd largest
> SNAP recipients Apr 2019 vs Apr 2020: 5.2% (from 405,566 to 426,477) — 24th smallest
> SNAP benefits Mar 2020 vs Apr 2020: 47.8% (from $40.0 million to $59.2 million) — 20th smallest
> SNAP benefits Apr 2019 vs Apr 2020: 40.6% (from $42.1 million to $59.2 million) — 6th smallest
> Food insecure households pre-pandemic: 9.5% — 6th lowest
> Unemployment rate Mar 2020: 2.9% — 8th lowest
> Unemployment rate Apr 2020: 8.7% — 3rd lowest
> Confirmed COVID-19 cases, Aug 30, 2020: 1,340 per 100,000 — 18th lowest

Mississippi
> SNAP recipients Mar 2020 vs Apr 2020: 8.4% (from 421,180 to 456,724) — 25th largest
> SNAP recipients Apr 2019 vs Apr 2020: 2.9% (from 443,868 to 456,724) — 18th smallest
> SNAP benefits Mar 2020 vs Apr 2020: 13.0% (from $72.5 million to $82.0 million) — 8th smallest
> SNAP benefits Apr 2019 vs Apr 2020: 66.7% (from $49.2 million to $82.0 million) — 24th smallest
> Food insecure households pre-pandemic: 17.2% — 4th highest
> Unemployment rate Mar 2020: 5.1% — 12th highest
> Unemployment rate Apr 2020: 16.3% — 12th highest
> Confirmed COVID-19 cases, Aug 30, 2020: 2,768 per 100,000 — 4th highest
[in-text-ad-2]

Missouri
> SNAP recipients Mar 2020 vs Apr 2020: 13.9% (from 660,628 to 752,315) — 13th largest
> SNAP recipients Apr 2019 vs Apr 2020: 9.9% (from 684,676 to 752,315) — 18th largest
> SNAP benefits Mar 2020 vs Apr 2020: 19.8% (from $114.7 million to $137.4 million) — 12th smallest
> SNAP benefits Apr 2019 vs Apr 2020: 70.0% (from $80.8 million to $137.4 million) — 24th largest
> Food insecure households pre-pandemic: 12.8% — 22nd highest
> Unemployment rate Mar 2020: 3.9% — 25th highest
> Unemployment rate Apr 2020: 10.2% — 7th lowest
> Confirmed COVID-19 cases, Aug 30, 2020: 1,365 per 100,000 — 19th lowest

Montana
> SNAP recipients Mar 2020 vs Apr 2020: -0.7% (from 105,265 to 104,548) — 4th smallest
> SNAP recipients Apr 2019 vs Apr 2020: -2.7% (from 107,433 to 104,548) — 5th smallest
> SNAP benefits Mar 2020 vs Apr 2020: -0.7% (from $12.1 million to $12.0 million) — 3rd smallest
> SNAP benefits Apr 2019 vs Apr 2020: -2.2% (from $12.3 million to $12.0 million) — 3rd smallest
> Food insecure households pre-pandemic: 11.4% — 21st lowest
> Unemployment rate Mar 2020: 3.6% — 22nd lowest
> Unemployment rate Apr 2020: 11.9% — 17th lowest
> Confirmed COVID-19 cases, Aug 30, 2020: 691 per 100,000 — 8th lowest
[in-text-ad]

Nebraska
> SNAP recipients Mar 2020 vs Apr 2020: 7.7% (from 153,889 to 165,801) — 25th smallest
> SNAP recipients Apr 2019 vs Apr 2020: 2.0% (from 162,585 to 165,801) — 15th smallest
> SNAP benefits Mar 2020 vs Apr 2020: 61.1% (from $17.4 million to $28.1 million) — 25th smallest
> SNAP benefits Apr 2019 vs Apr 2020: 47.6% (from $19.0 million to $28.1 million) — 10th smallest
> Food insecure households pre-pandemic: 13.5% — 15th highest
> Unemployment rate Mar 2020: 4.0% — 24th highest
> Unemployment rate Apr 2020: 8.7% — 3rd lowest
> Confirmed COVID-19 cases, Aug 30, 2020: 1,750 per 100,000 — 21st highest
[recirclink id=728915]

Nevada
> SNAP recipients Mar 2020 vs Apr 2020: 16.6% (from 426,527 to 497,313) — 9th largest
> SNAP recipients Apr 2019 vs Apr 2020: 18.6% (from 419,347 to 497,313) — 8th largest
> SNAP benefits Mar 2020 vs Apr 2020: 38.5% (from $78.2 million to $108.2 million) — 14th smallest
> SNAP benefits Apr 2019 vs Apr 2020: 122.6% (from $48.6 million to $108.2 million) — 4th largest
> Food insecure households pre-pandemic: 12.4% — 23rd highest
> Unemployment rate Mar 2020: 6.9% — the highest
> Unemployment rate Apr 2020: 30.1% — the highest
> Confirmed COVID-19 cases, Aug 30, 2020: 2,271 per 100,000 — 8th highest

New Hampshire
> SNAP recipients Mar 2020 vs Apr 2020: 7.3% (from 72,006 to 77,279) — 22nd smallest
> SNAP recipients Apr 2019 vs Apr 2020: 1.5% (from 76,113 to 77,279) — 13th smallest
> SNAP benefits Mar 2020 vs Apr 2020: 149.9% (from $7.2 million to $18.0 million) — the largest
> SNAP benefits Apr 2019 vs Apr 2020: 132.3% (from $7.7 million to $18.0 million) — 3rd largest
> Food insecure households pre-pandemic: 9.4% — 5th lowest
> Unemployment rate Mar 2020: 2.4% — 3rd lowest
> Unemployment rate Apr 2020: 17.1% — 8th highest
> Confirmed COVID-19 cases, Aug 30, 2020: 535 per 100,000 — 3rd lowest
[in-text-ad-2]

New Jersey
> SNAP recipients Mar 2020 vs Apr 2020: 3.5% (from 667,206 to 690,739) — 8th smallest
> SNAP recipients Apr 2019 vs Apr 2020: -0.8% (from 695,964 to 690,739) — 8th smallest
> SNAP benefits Mar 2020 vs Apr 2020: 7.5% (from $113.7 million to $122.3 million) — 5th smallest
> SNAP benefits Apr 2019 vs Apr 2020: 54.1% (from $79.3 million to $122.3 million) — 14th smallest
> Food insecure households pre-pandemic: 8.6% — 2nd lowest
> Unemployment rate Mar 2020: 3.7% — 23rd lowest
> Unemployment rate Apr 2020: 16.3% — 12th highest
> Confirmed COVID-19 cases, Aug 30, 2020: 2,151 per 100,000 — 11th highest

New Mexico
> SNAP recipients Mar 2020 vs Apr 2020: 7.5% (from 447,420 to 481,136) — 23rd smallest
> SNAP recipients Apr 2019 vs Apr 2020: 8.3% (from 444,329 to 481,136) — 22nd largest
> SNAP benefits Mar 2020 vs Apr 2020: 103.7% (from $52.8 million to $107.6 million) — 4th largest
> SNAP benefits Apr 2019 vs Apr 2020: 106.6% (from $52.1 million to $107.6 million) — 6th largest
> Food insecure households pre-pandemic: 17.9% — the highest
> Unemployment rate Mar 2020: 6.3% — 3rd highest
> Unemployment rate Apr 2020: 11.9% — 17th lowest
> Confirmed COVID-19 cases, Aug 30, 2020: 1,207 per 100,000 — 16th lowest
[in-text-ad]

New York
> SNAP recipients Mar 2020 vs Apr 2020: 31.0% (from 2,561,187 to 3,354,912) — 5th largest
> SNAP recipients Apr 2019 vs Apr 2020: 26.0% (from 2,662,511 to 3,354,912) — 6th largest
> SNAP benefits Mar 2020 vs Apr 2020: 86.6% (from $351.0 million to $654.8 million) — 11th largest
> SNAP benefits Apr 2019 vs Apr 2020: 82.4% (from $359.0 million to $654.8 million) — 15th largest
> Food insecure households pre-pandemic: 10.9% — 15th lowest
> Unemployment rate Mar 2020: 4.1% — 23rd highest
> Unemployment rate Apr 2020: 15.3% — 19th highest
> Confirmed COVID-19 cases, Aug 30, 2020: 2,221 per 100,000 — 10th highest
[recirclink id=715712]

North Carolina
> SNAP recipients Mar 2020 vs Apr 2020: -2.3% (from 1,214,762 to 1,187,235) — 2nd smallest
> SNAP recipients Apr 2019 vs Apr 2020: -7.2% (from 1,278,787 to 1,187,235) — the smallest
> SNAP benefits Mar 2020 vs Apr 2020: -1.9% (from $137.2 million to $134.6 million) — 2nd smallest
> SNAP benefits Apr 2019 vs Apr 2020: -6.4% (from $143.8 million to $134.6 million) — the smallest
> Food insecure households pre-pandemic: 14.4% — 9th highest
> Unemployment rate Mar 2020: 4.3% — 20th highest
> Unemployment rate Apr 2020: 12.9% — 21st lowest
> Confirmed COVID-19 cases, Aug 30, 2020: 1,600 per 100,000 — 24th highest

North Dakota
> SNAP recipients Mar 2020 vs Apr 2020: 7.1% (from 48,059 to 51,483) — 21st smallest
> SNAP recipients Apr 2019 vs Apr 2020: 7.0% (from 48,096 to 51,483) — 23rd largest
> SNAP benefits Mar 2020 vs Apr 2020: 100.1% (from $5.6 million to $11.3 million) — 7th largest
> SNAP benefits Apr 2019 vs Apr 2020: 100.0% (from $5.6 million to $11.3 million) — 9th largest
> Food insecure households pre-pandemic: 9.0% — 3rd lowest
> Unemployment rate Mar 2020: 2.0% — the lowest
> Unemployment rate Apr 2020: 9.1% — 4th lowest
> Confirmed COVID-19 cases, Aug 30, 2020: 1,540 per 100,000 — 25th highest
[in-text-ad-2]

Ohio
> SNAP recipients Mar 2020 vs Apr 2020: 0.6% (from 1,374,108 to 1,382,485) — 5th smallest
> SNAP recipients Apr 2019 vs Apr 2020: -0.2% (from 1,385,222 to 1,382,485) — 9th smallest
> SNAP benefits Mar 2020 vs Apr 2020: 62.0% (from $167.9 million to $272.0 million) — 23rd largest
> SNAP benefits Apr 2019 vs Apr 2020: 63.4% (from $166.5 million to $272.0 million) — 23rd smallest
> Food insecure households pre-pandemic: 13.7% — 12th highest
> Unemployment rate Mar 2020: 5.8% — 6th highest
> Unemployment rate Apr 2020: 17.6% — 5th highest
> Confirmed COVID-19 cases, Aug 30, 2020: 1,046 per 100,000 — 13th lowest

Oklahoma
> SNAP recipients Mar 2020 vs Apr 2020: 7.6% (from 569,566 to 612,779) — 24th smallest
> SNAP recipients Apr 2019 vs Apr 2020: 8.3% (from 565,900 to 612,779) — 21st largest
> SNAP benefits Mar 2020 vs Apr 2020: 90.7% (from $67.0 million to $127.8 million) — 9th largest
> SNAP benefits Apr 2019 vs Apr 2020: 91.4% (from $66.8 million to $127.8 million) — 13th largest
> Food insecure households pre-pandemic: 15.0% — 6th highest
> Unemployment rate Mar 2020: 2.9% — 8th lowest
> Unemployment rate Apr 2020: 14.7% — 23rd highest
> Confirmed COVID-19 cases, Aug 30, 2020: 1,471 per 100,000 — 24th lowest
[in-text-ad]

Oregon
> SNAP recipients Mar 2020 vs Apr 2020: 10.7% (from 601,101 to 665,156) — 19th largest
> SNAP recipients Apr 2019 vs Apr 2020: 11.6% (from 596,165 to 665,156) — 13th largest
> SNAP benefits Mar 2020 vs Apr 2020: 62.3% (from $73.1 million to $118.6 million) — 22nd largest
> SNAP benefits Apr 2019 vs Apr 2020: 61.6% (from $73.4 million to $118.6 million) — 22nd smallest
> Food insecure households pre-pandemic: 12.9% — 20th highest
> Unemployment rate Mar 2020: 3.5% — 21st lowest
> Unemployment rate Apr 2020: 14.9% — 21st highest
> Confirmed COVID-19 cases, Aug 30, 2020: 634 per 100,000 — 6th lowest
[recirclink id=593555]

Pennsylvania
> SNAP recipients Mar 2020 vs Apr 2020: 6.4% (from 1,732,446 to 1,843,929) — 19th smallest
> SNAP recipients Apr 2019 vs Apr 2020: 5.5% (from 1,747,214 to 1,843,929) — 25th largest
> SNAP benefits Mar 2020 vs Apr 2020: 100.2% (from $203.8 million to $408.0 million) — 6th largest
> SNAP benefits Apr 2019 vs Apr 2020: 99.0% (from $205.0 million to $408.0 million) — 10th largest
> Food insecure households pre-pandemic: 12.1% — 25th lowest
> Unemployment rate Mar 2020: 5.8% — 6th highest
> Unemployment rate Apr 2020: 16.1% — 16th highest
> Confirmed COVID-19 cases, Aug 30, 2020: 1,042 per 100,000 — 12th lowest

Rhode Island
> SNAP recipients Mar 2020 vs Apr 2020: 54.9% (from 145,411 to 225,202) — 4th largest
> SNAP recipients Apr 2019 vs Apr 2020: 49.8% (from 150,288 to 225,202) — 4th largest
> SNAP benefits Mar 2020 vs Apr 2020: 87.0% (from $19.4 million to $36.2 million) — 10th largest
> SNAP benefits Apr 2019 vs Apr 2020: 80.5% (from $20.1 million to $36.2 million) — 17th largest
> Food insecure households pre-pandemic: 12.4% — 23rd highest
> Unemployment rate Mar 2020: 4.7% — 17th highest
> Unemployment rate Apr 2020: 18.1% — 4th highest
> Confirmed COVID-19 cases, Aug 30, 2020: 2,051 per 100,000 — 13th highest
[in-text-ad-2]

South Carolina
> SNAP recipients Mar 2020 vs Apr 2020: 4.2% (from 568,652 to 592,738) — 10th smallest
> SNAP recipients Apr 2019 vs Apr 2020: 0.3% (from 590,881 to 592,738) — 10th smallest
> SNAP benefits Mar 2020 vs Apr 2020: 8.3% (from $98.1 million to $106.2 million) — 6th smallest
> SNAP benefits Apr 2019 vs Apr 2020: 54.2% (from $68.9 million to $106.2 million) — 15th smallest
> Food insecure households pre-pandemic: 11.7% — 23rd lowest
> Unemployment rate Mar 2020: 3.2% — 15th lowest
> Unemployment rate Apr 2020: 12.8% — 20th lowest
> Confirmed COVID-19 cases, Aug 30, 2020: 2,327 per 100,000 — 7th highest

South Dakota
> SNAP recipients Mar 2020 vs Apr 2020: 2.4% (from 77,302 to 79,148) — 6th smallest
> SNAP recipients Apr 2019 vs Apr 2020: -2.2% (from 80,939 to 79,148) — 6th smallest
> SNAP benefits Mar 2020 vs Apr 2020: 41.8% (from $9.7 million to $13.7 million) — 15th smallest
> SNAP benefits Apr 2019 vs Apr 2020: 35.9% (from $10.1 million to $13.7 million) — 4th smallest
> Food insecure households pre-pandemic: 11.4% — 21st lowest
> Unemployment rate Mar 2020: 3.1% — 14th lowest
> Unemployment rate Apr 2020: 10.9% — 11th lowest
> Confirmed COVID-19 cases, Aug 30, 2020: 1,510 per 100,000 — 25th lowest
[in-text-ad]

Tennessee
> SNAP recipients Mar 2020 vs Apr 2020: 4.5% (from 861,061 to 900,106) — 11th smallest
> SNAP recipients Apr 2019 vs Apr 2020: 1.2% (from 889,691 to 900,106) — 12th smallest
> SNAP benefits Mar 2020 vs Apr 2020: 93.8% (from $106.4 million to $206.2 million) — 8th largest
> SNAP benefits Apr 2019 vs Apr 2020: 93.6% (from $106.5 million to $206.2 million) — 12th largest
> Food insecure households pre-pandemic: 12.9% — 20th highest
> Unemployment rate Mar 2020: 3.3% — 19th lowest
> Unemployment rate Apr 2020: 15.5% — 18th highest
> Confirmed COVID-19 cases, Aug 30, 2020: 2,249 per 100,000 — 9th highest
[recirclink id=731581]

Texas
> SNAP recipients Mar 2020 vs Apr 2020: 13.0% (from 3,214,013 to 3,632,605) — 14th largest
> SNAP recipients Apr 2019 vs Apr 2020: 9.3% (from 3,322,131 to 3,632,605) — 20th largest
> SNAP benefits Mar 2020 vs Apr 2020: 61.4% (from $382.3 million to $616.9 million) — 25th largest
> SNAP benefits Apr 2019 vs Apr 2020: 60.1% (from $385.4 million to $616.9 million) — 20th smallest
> Food insecure households pre-pandemic: 14.0% — 11th highest
> Unemployment rate Mar 2020: 5.1% — 12th highest
> Unemployment rate Apr 2020: 13.5% — 24th lowest
> Confirmed COVID-19 cases, Aug 30, 2020: 2,127 per 100,000 — 12th highest

Utah
> SNAP recipients Mar 2020 vs Apr 2020: 5.2% (from 163,895 to 172,489) — 16th smallest
> SNAP recipients Apr 2019 vs Apr 2020: 0.9% (from 170,989 to 172,489) — 11th smallest
> SNAP benefits Mar 2020 vs Apr 2020: 45.8% (from $18.9 million to $27.5 million) — 18th smallest
> SNAP benefits Apr 2019 vs Apr 2020: 42.3% (from $19.3 million to $27.5 million) — 7th smallest
> Food insecure households pre-pandemic: 10.7% — 13th lowest
> Unemployment rate Mar 2020: 3.8% — 25th lowest
> Unemployment rate Apr 2020: 10.4% — 9th lowest
> Confirmed COVID-19 cases, Aug 30, 2020: 1,640 per 100,000 — 23rd highest
[in-text-ad-2]

Vermont
> SNAP recipients Mar 2020 vs Apr 2020: 4.6% (from 69,063 to 72,262) — 12th smallest
> SNAP recipients Apr 2019 vs Apr 2020: 4.8% (from 68,932 to 72,262) — 23rd smallest
> SNAP benefits Mar 2020 vs Apr 2020: 44.4% (from $8.2 million to $11.9 million) — 16th smallest
> SNAP benefits Apr 2019 vs Apr 2020: 44.7% (from $8.2 million to $11.9 million) — 8th smallest
> Food insecure households pre-pandemic: 9.8% — 7th lowest
> Unemployment rate Mar 2020: 3.1% — 14th lowest
> Unemployment rate Apr 2020: 16.5% — 10th highest
> Confirmed COVID-19 cases, Aug 30, 2020: 258 per 100,000 — the lowest

Virginia
> SNAP recipients Mar 2020 vs Apr 2020: 8.5% (from 687,984 to 746,608) — 24th largest
> SNAP recipients Apr 2019 vs Apr 2020: 6.5% (from 701,304 to 746,608) — 24th largest
> SNAP benefits Mar 2020 vs Apr 2020: 10.1% (from $118.4 million to $130.4 million) — 7th smallest
> SNAP benefits Apr 2019 vs Apr 2020: 58.2% (from $82.4 million to $130.4 million) — 18th smallest
> Food insecure households pre-pandemic: 10.1% — 9th lowest
> Unemployment rate Mar 2020: 3.3% — 19th lowest
> Unemployment rate Apr 2020: 11.2% — 13th lowest
> Confirmed COVID-19 cases, Aug 30, 2020: 1,406 per 100,000 — 21st lowest
[in-text-ad]

Washington
> SNAP recipients Mar 2020 vs Apr 2020: 20.4% (from 797,246 to 960,064) — 7th largest
> SNAP recipients Apr 2019 vs Apr 2020: 17.3% (from 818,771 to 960,064) — 9th largest
> SNAP benefits Mar 2020 vs Apr 2020: 36.6% (from $147.0 million to $200.8 million) — 13th smallest
> SNAP benefits Apr 2019 vs Apr 2020: 103.9% (from $98.4 million to $200.8 million) — 8th largest
> Food insecure households pre-pandemic: 10.8% — 14th lowest
> Unemployment rate Mar 2020: 5.1% — 12th highest
> Unemployment rate Apr 2020: 16.3% — 12th highest
> Confirmed COVID-19 cases, Aug 30, 2020: 986 per 100,000 — 10th lowest
[recirclink id=731694]

West Virginia
> SNAP recipients Mar 2020 vs Apr 2020: 4.8% (from 303,032 to 317,622) — 14th smallest
> SNAP recipients Apr 2019 vs Apr 2020: 5.2% (from 302,044 to 317,622) — 25th smallest
> SNAP benefits Mar 2020 vs Apr 2020: 67.4% (from $32.7 million to $54.8 million) — 20th largest
> SNAP benefits Apr 2019 vs Apr 2020: 68.5% (from $32.5 million to $54.8 million) — 25th smallest
> Food insecure households pre-pandemic: 14.9% — 7th highest
> Unemployment rate Mar 2020: 6.0% — 5th highest
> Unemployment rate Apr 2020: 15.9% — 17th highest
> Confirmed COVID-19 cases, Aug 30, 2020: 560 per 100,000 — 4th lowest

Wisconsin
> SNAP recipients Mar 2020 vs Apr 2020: 66.5% (from 607,188 to 1,011,159) — 3rd largest
> SNAP recipients Apr 2019 vs Apr 2020: 64.9% (from 613,035 to 1,011,159) — 3rd largest
> SNAP benefits Mar 2020 vs Apr 2020: 142.2% (from $65.3 million to $158.2 million) — 2nd largest
> SNAP benefits Apr 2019 vs Apr 2020: 147.5% (from $63.9 million to $158.2 million) — 2nd largest
> Food insecure households pre-pandemic: 10.0% — 8th lowest
> Unemployment rate Mar 2020: 3.1% — 14th lowest
> Unemployment rate Apr 2020: 13.6% — 25th lowest
> Confirmed COVID-19 cases, Aug 30, 2020: 1,296 per 100,000 — 17th lowest
[in-text-ad-2]

Wyoming
> SNAP recipients Mar 2020 vs Apr 2020: 4.1% (from 25,735 to 26,795) — 9th smallest
> SNAP recipients Apr 2019 vs Apr 2020: 3.0% (from 26,025 to 26,795) — 19th smallest
> SNAP benefits Mar 2020 vs Apr 2020: 56.4% (from $2.9 million to $4.6 million) — 23rd smallest
> SNAP benefits Apr 2019 vs Apr 2020: 53.1% (from $3.0 million to $4.6 million) — 11th smallest
> Food insecure households pre-pandemic: 13.2% — 17th highest
> Unemployment rate Mar 2020: 3.8% — 25th lowest
> Unemployment rate Apr 2020: 9.6% — 5th lowest
> Confirmed COVID-19 cases, Aug 30, 2020: 661 per 100,000 — 7th lowest
Methodology
To identify the states where government food assistance is spiking, 24/7 Wall St. reviewed state-level data from the U.S. Department of Agriculture (USDA) on total Supplemental Nutrition Assistance Program (SNAP) benefits received by individuals and households for March and April of 2020 as well as April 2019. Data is as of July 10, 2020, and figures are preliminary and subject to revision by the USDA.
The share of food insecure households in every state are 2015-2017 averages and were provided by the USDA Economic Research Service. Food security means: The ready availability of nutritionally adequate and safe foods. Assured ability to acquire acceptable foods in socially acceptable ways (without resorting to emergency food supplies, scavenging, stealing, or other coping strategies).
Labor force statistics by state for March 2019, March 2020, and April 2020 is from the Bureau of Labor Statistics and is seasonally adjusted.
COVID-19 case and death data as of March 31, April 31, and Aug. 24 came from the 24/7 Wall St. COVID API.
Total population, median household income, poverty rate, and educational attainment are from the American Community Survey 2018 1-Year Estimates.
Contact [email protected] for any questions or corrections.