
On Aug. 31, state and local health authorities reported 31,658 confirmed cases of COVID-19, the lowest total for a single day in over two months. Overall, daily new confirmed infections seem to be trending down from their peak in mid-July. But there are still some places in the country where the spread of COVID-19 cases increased in the last week, compared to the week before.
Using data from state and local health departments, 24/7 Wall St. compiled and reviewed the average number of new daily confirmed COVID-19 cases for the week ending Aug. 31 and compared it to the average from the previous week to determine the cities where the virus is growing the fastest. For comparison purposes, we adjusted the number of confirmed cases per 100,000 people. We excluded metropolitan areas with fewer than 20 new daily cases as of the most recent week.
These cities are concentrated in two areas — the South and the Midwest, each of which is home to 15 of the 32 cities with the largest week-over-week increase in daily new cases per capita. For weeks, Southern cities have accounted for a large share of the cities on this list, but the presence of so many Midwestern cities is a relatively recent phenomenon. Texas is the only state with five cities on the list, followed by Indiana with three and Iowa and Georgia with two apiece. These are the states where the spread of COVID-19 is slowing and where it is getting worse.
The majority of the metro areas on this list are home to large colleges or universities. A number of Midwestern colleges like the University of Iowa, Iowa State, and the University of Kansas have reported hundreds of cases among their student populations since fall 2020 classes began. This influx of thousands of students now living in close proximity is one of the reasons the cities these schools are located in now rank among the cities where COVID-19 is growing the fastest. This is every state’s plan to reopen schools in the fall.
Click here to see the cities where COVID-19 is growing the fastest

32. Rome, GA
> Change in daily avg. new COVID-19 cases week over week: +6.2 per 100,000 people
> Avg. new daily cases in 7 days ending Aug. 31: 38.5 per 100,000 people
> Avg. new daily cases in 7 days ending Aug. 24: 32.3 per 100,000 people
> Cumulative confirmed COVID-19 cases as of Aug. 31: 2,352 per 100,000 people (total: 2,277)
> COVID-19 related deaths as of Aug. 31: 32
> Population: 97,927
> Avg. new daily cases in Georgia in 7 days ending Aug. 31: 21 per 100,000 (7th most)
[in-text-ad]

31. Gainesville, GA
> Change in daily avg. new COVID-19 cases week over week: +6.2 per 100,000 people
> Avg. new daily cases in 7 days ending Aug. 31: 40.7 per 100,000 people
> Avg. new daily cases in 7 days ending Aug. 24: 34.5 per 100,000 people
> Cumulative confirmed COVID-19 cases as of Aug. 31: 3,936 per 100,000 people (total: 7,714)
> COVID-19 related deaths as of Aug. 31: 125
> Population: 202,148
> Avg. new daily cases in Georgia in 7 days ending Aug. 31: 21 per 100,000 (7th most)
[recirclink id=732043]
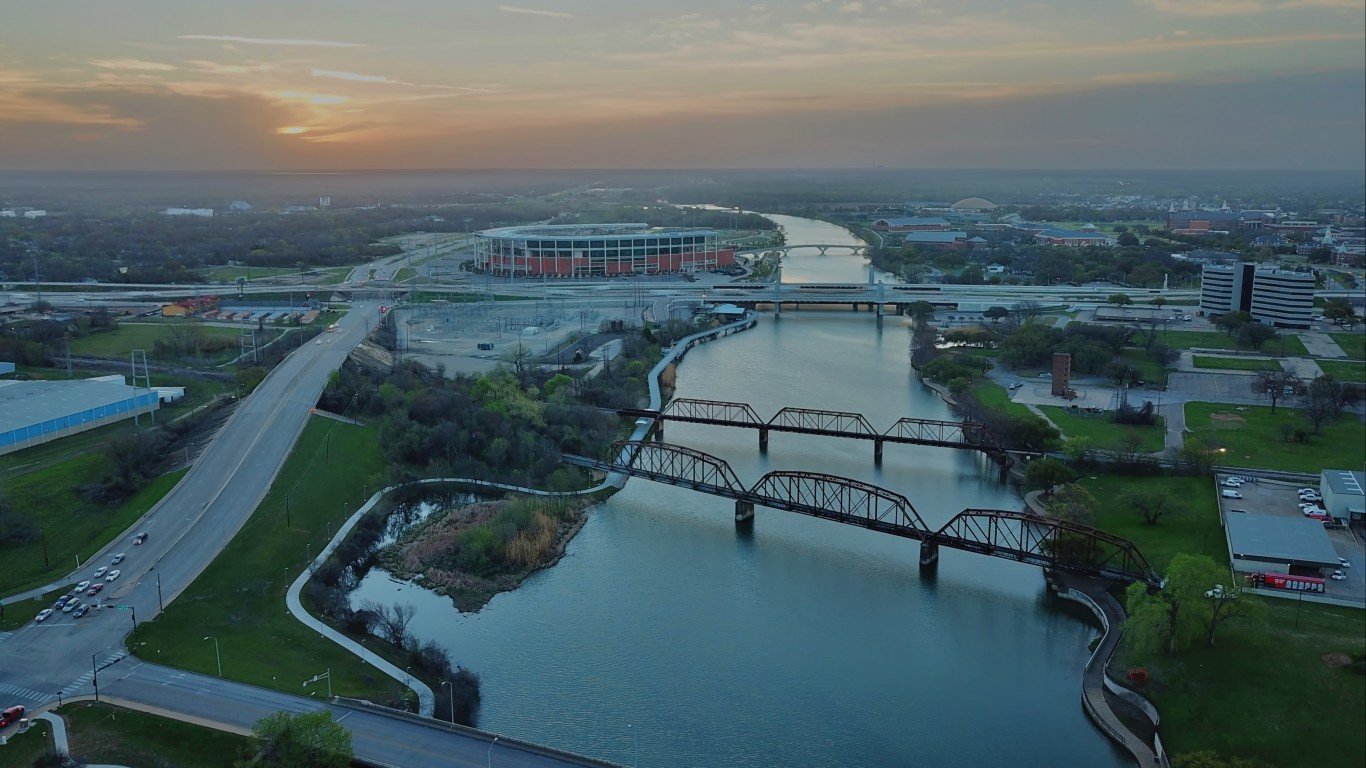
30. Waco, TX
> Change in daily avg. new COVID-19 cases week over week: +6.4 per 100,000 people
> Avg. new daily cases in 7 days ending Aug. 31: 26.0 per 100,000 people
> Avg. new daily cases in 7 days ending Aug. 24: 19.6 per 100,000 people
> Cumulative confirmed COVID-19 cases as of Aug. 31: 2,420 per 100,000 people (total: 6,430)
> COVID-19 related deaths as of Aug. 31: 84
> Population: 270,566
> Avg. new daily cases in Texas in 7 days ending Aug. 31: 17 per 100,000 (14th most)
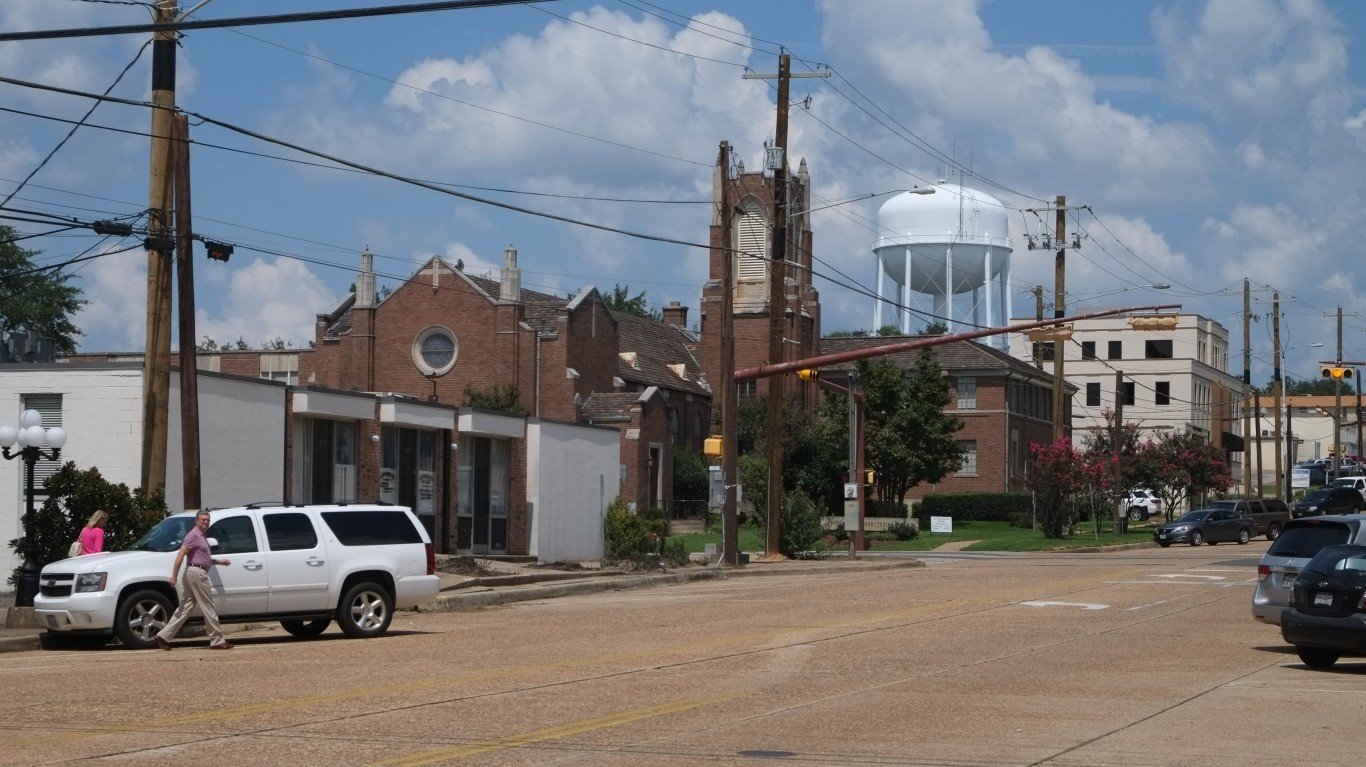
29. Longview, TX
> Change in daily avg. new COVID-19 cases week over week: +6.4 per 100,000 people
> Avg. new daily cases in 7 days ending Aug. 31: 19.5 per 100,000 people
> Avg. new daily cases in 7 days ending Aug. 24: 13.1 per 100,000 people
> Cumulative confirmed COVID-19 cases as of Aug. 31: 1,303 per 100,000 people (total: 3,708)
> COVID-19 related deaths as of Aug. 31: 86
> Population: 219,417
> Avg. new daily cases in Texas in 7 days ending Aug. 31: 17 per 100,000 (14th most)
[in-text-ad-2]

28. Sioux City, IA-NE-SD
> Change in daily avg. new COVID-19 cases week over week: +6.9 per 100,000 people
> Avg. new daily cases in 7 days ending Aug. 31: 20.8 per 100,000 people
> Avg. new daily cases in 7 days ending Aug. 24: 13.9 per 100,000 people
> Cumulative confirmed COVID-19 cases as of Aug. 31: 4,495 per 100,000 people (total: 6,457)
> COVID-19 related deaths as of Aug. 31: 104
> Population: 169,354
> Avg. new daily cases in Iowa in 7 days ending Aug. 31: 32 per 100,000 (2nd most)

27. Mankato, MN
> Change in daily avg. new COVID-19 cases week over week: +7.5 per 100,000 people
> Avg. new daily cases in 7 days ending Aug. 31: 22.4 per 100,000 people
> Avg. new daily cases in 7 days ending Aug. 24: 14.9 per 100,000 people
> Cumulative confirmed COVID-19 cases as of Aug. 31: 1,683 per 100,000 people (total: 1,685)
> COVID-19 related deaths as of Aug. 31: 20
> Population: 101,647
> Avg. new daily cases in Minnesota in 7 days ending Aug. 31: 13 per 100,000 (25th most)
[in-text-ad]

26. Athens-Clarke County, GA
> Change in daily avg. new COVID-19 cases week over week: +7.7 per 100,000 people
> Avg. new daily cases in 7 days ending Aug. 31: 29.5 per 100,000 people
> Avg. new daily cases in 7 days ending Aug. 24: 21.8 per 100,000 people
> Cumulative confirmed COVID-19 cases as of Aug. 31: 2,087 per 100,000 people (total: 4,284)
> COVID-19 related deaths as of Aug. 31: 63
> Population: 211,802
> Avg. new daily cases in Georgia in 7 days ending Aug. 31: 21 per 100,000 (7th most)
[recirclink id=732110]
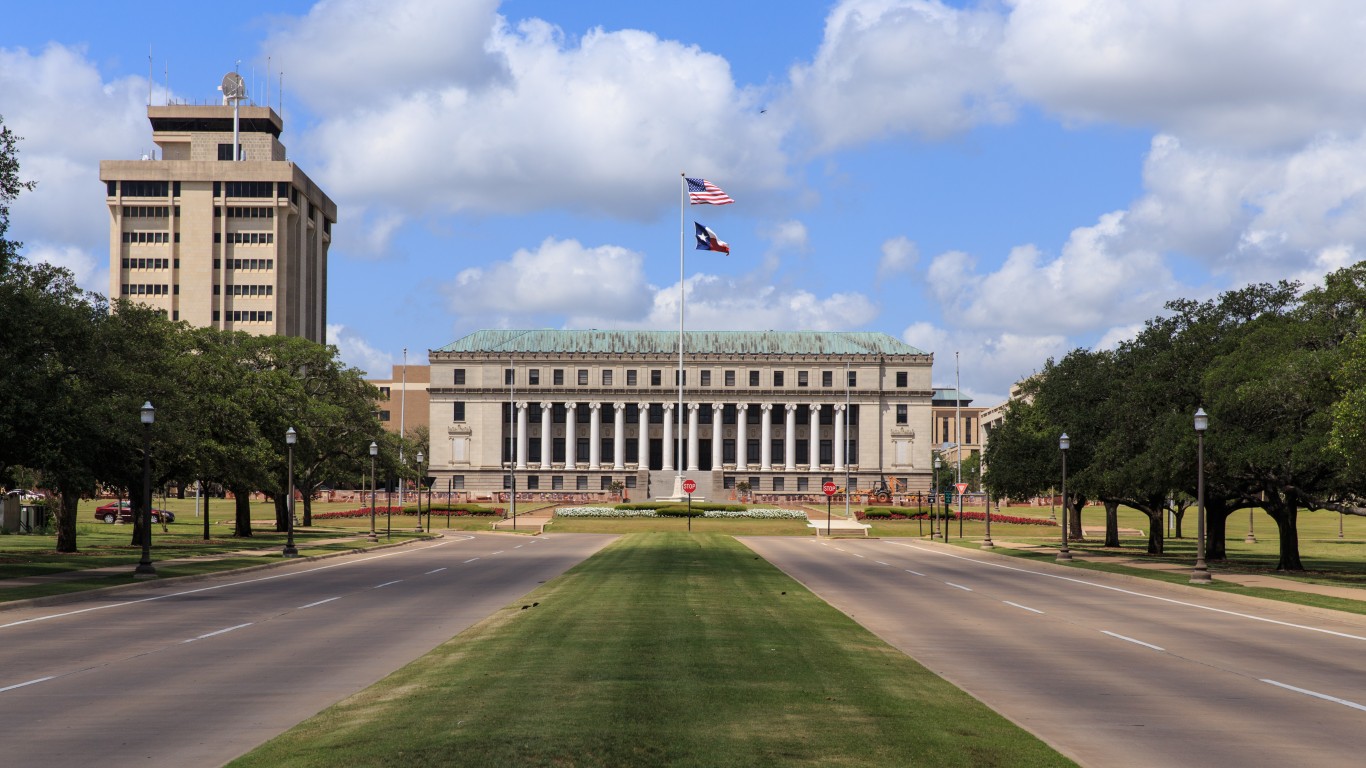
25. College Station-Bryan, TX
> Change in daily avg. new COVID-19 cases week over week: +8.6 per 100,000 people
> Avg. new daily cases in 7 days ending Aug. 31: 16.7 per 100,000 people
> Avg. new daily cases in 7 days ending Aug. 24: 8.1 per 100,000 people
> Cumulative confirmed COVID-19 cases as of Aug. 31: 2,063 per 100,000 people (total: 5,239)
> COVID-19 related deaths as of Aug. 31: 65
> Population: 265,024
> Avg. new daily cases in Texas in 7 days ending Aug. 31: 17 per 100,000 (14th most)

24. Enid, OK
> Change in daily avg. new COVID-19 cases week over week: +9.1 per 100,000 people
> Avg. new daily cases in 7 days ending Aug. 31: 43.3 per 100,000 people
> Avg. new daily cases in 7 days ending Aug. 24: 34.1 per 100,000 people
> Cumulative confirmed COVID-19 cases as of Aug. 31: 1,576 per 100,000 people (total: 980)
> COVID-19 related deaths as of Aug. 31: 12
> Population: 60,913
> Avg. new daily cases in Oklahoma in 7 days ending Aug. 31: 18 per 100,000 (11th most)
[in-text-ad-2]

23. Bowling Green, KY
> Change in daily avg. new COVID-19 cases week over week: +9.1 per 100,000 people
> Avg. new daily cases in 7 days ending Aug. 31: 25.4 per 100,000 people
> Avg. new daily cases in 7 days ending Aug. 24: 16.2 per 100,000 people
> Cumulative confirmed COVID-19 cases as of Aug. 31: 2,321 per 100,000 people (total: 3,995)
> COVID-19 related deaths as of Aug. 31: 63
> Population: 177,183
> Avg. new daily cases in Kentucky in 7 days ending Aug. 31: 14 per 100,000 (22nd most)

22. Lawton, OK
> Change in daily avg. new COVID-19 cases week over week: +9.3 per 100,000 people
> Avg. new daily cases in 7 days ending Aug. 31: 24.2 per 100,000 people
> Avg. new daily cases in 7 days ending Aug. 24: 14.9 per 100,000 people
> Cumulative confirmed COVID-19 cases as of Aug. 31: 996 per 100,000 people (total: 1,280)
> COVID-19 related deaths as of Aug. 31: 13
> Population: 125,696
> Avg. new daily cases in Oklahoma in 7 days ending Aug. 31: 18 per 100,000 (11th most)
[in-text-ad]

21. Harrisonburg, VA
> Change in daily avg. new COVID-19 cases week over week: +9.3 per 100,000 people
> Avg. new daily cases in 7 days ending Aug. 31: 15.4 per 100,000 people
> Avg. new daily cases in 7 days ending Aug. 24: 6.1 per 100,000 people
> Cumulative confirmed COVID-19 cases as of Aug. 31: 1,810 per 100,000 people (total: 2,404)
> COVID-19 related deaths as of Aug. 31: 53
> Population: 135,277
> Avg. new daily cases in Virginia in 7 days ending Aug. 31: 11 per 100,000 (22nd fewest)
[recirclink id=731973]

20. Bloomsburg-Berwick, PA
> Change in daily avg. new COVID-19 cases week over week: +9.4 per 100,000 people
> Avg. new daily cases in 7 days ending Aug. 31: 15.5 per 100,000 people
> Avg. new daily cases in 7 days ending Aug. 24: 6.1 per 100,000 people
> Cumulative confirmed COVID-19 cases as of Aug. 31: 943 per 100,000 people (total: 797)
> COVID-19 related deaths as of Aug. 31: 40
> Population: 83,696
> Avg. new daily cases in Pennsylvania in 7 days ending Aug. 31: 5 per 100,000 (8th fewest)

19. Great Falls, MT
> Change in daily avg. new COVID-19 cases week over week: +9.7 per 100,000 people
> Avg. new daily cases in 7 days ending Aug. 31: 13.0 per 100,000 people
> Avg. new daily cases in 7 days ending Aug. 24: 3.3 per 100,000 people
> Cumulative confirmed COVID-19 cases as of Aug. 31: 347 per 100,000 people (total: 284)
> COVID-19 related deaths as of Aug. 31: 5
> Population: 81,643
> Avg. new daily cases in Montana in 7 days ending Aug. 31: 12 per 100,000 (23rd fewest)
[in-text-ad-2]
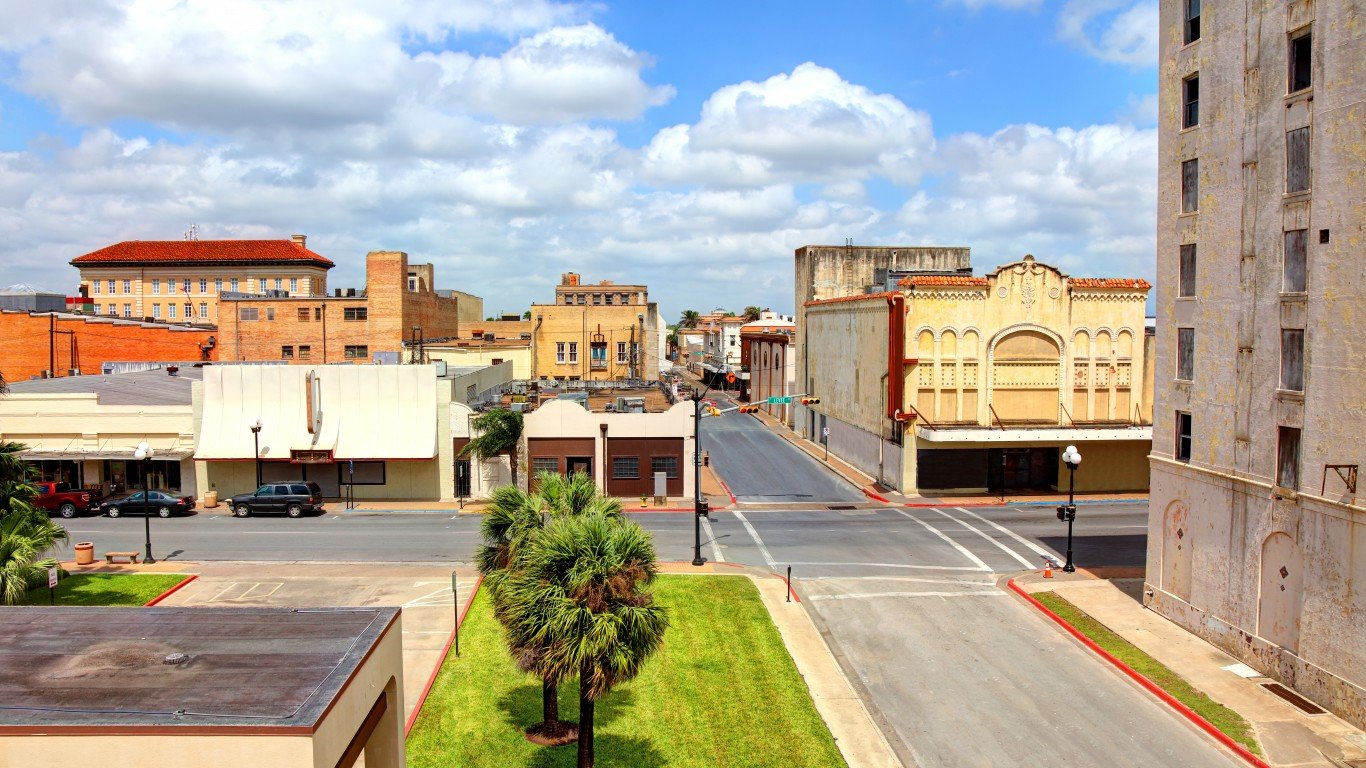
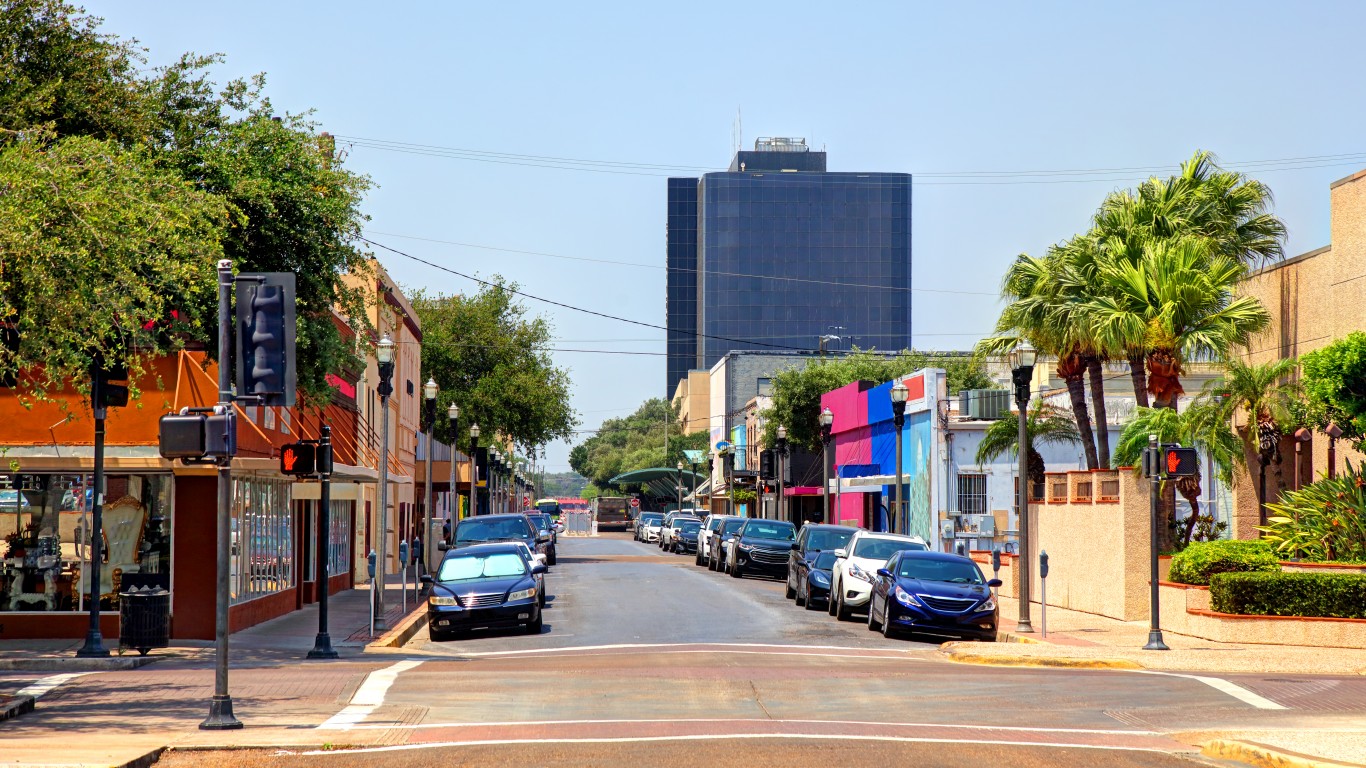
18. Brownsville-Harlingen, TX
> Change in daily avg. new COVID-19 cases week over week: +10.7 per 100,000 people
> Avg. new daily cases in 7 days ending Aug. 31: 53.0 per 100,000 people
> Avg. new daily cases in 7 days ending Aug. 24: 42.3 per 100,000 people
> Cumulative confirmed COVID-19 cases as of Aug. 31: 4,944 per 100,000 people (total: 20,853)
> COVID-19 related deaths as of Aug. 31: 757
> Population: 423,908
> Avg. new daily cases in Texas in 7 days ending Aug. 31: 17 per 100,000 (14th most)

17. Bloomington, IN
> Change in daily avg. new COVID-19 cases week over week: +11.1 per 100,000 people
> Avg. new daily cases in 7 days ending Aug. 31: 17.8 per 100,000 people
> Avg. new daily cases in 7 days ending Aug. 24: 6.7 per 100,000 people
> Cumulative confirmed COVID-19 cases as of Aug. 31: 777 per 100,000 people (total: 1,292)
> COVID-19 related deaths as of Aug. 31: 37
> Population: 167,762
> Avg. new daily cases in Indiana in 7 days ending Aug. 31: 15 per 100,000 (20th most)
[in-text-ad]

16. Manhattan, KS
> Change in daily avg. new COVID-19 cases week over week: +13.2 per 100,000 people
> Avg. new daily cases in 7 days ending Aug. 31: 19.7 per 100,000 people
> Avg. new daily cases in 7 days ending Aug. 24: 6.5 per 100,000 people
> Cumulative confirmed COVID-19 cases as of Aug. 31: 857 per 100,000 people (total: 1,146)
> COVID-19 related deaths as of Aug. 31: 0
> Population: 97,980
> Avg. new daily cases in Kansas in 7 days ending Aug. 31: 20 per 100,000 (8th most)
[recirclink id=731694]

15. Champaign-Urbana, IL
> Change in daily avg. new COVID-19 cases week over week: +13.4 per 100,000 people
> Avg. new daily cases in 7 days ending Aug. 31: 24.6 per 100,000 people
> Avg. new daily cases in 7 days ending Aug. 24: 11.2 per 100,000 people
> Cumulative confirmed COVID-19 cases as of Aug. 31: 1,125 per 100,000 people (total: 2,541)
> COVID-19 related deaths as of Aug. 31: 20
> Population: 237,356
> Avg. new daily cases in Illinois in 7 days ending Aug. 31: 15 per 100,000 (19th most)

14. Muncie, IN
> Change in daily avg. new COVID-19 cases week over week: +13.8 per 100,000 people
> Avg. new daily cases in 7 days ending Aug. 31: 22.4 per 100,000 people
> Avg. new daily cases in 7 days ending Aug. 24: 8.6 per 100,000 people
> Cumulative confirmed COVID-19 cases as of Aug. 31: 1,016 per 100,000 people (total: 1,175)
> COVID-19 related deaths as of Aug. 31: 57
> Population: 114,772
> Avg. new daily cases in Indiana in 7 days ending Aug. 31: 15 per 100,000 (20th most)
[in-text-ad-2]

13. Des Moines-West Des Moines, IA
> Change in daily avg. new COVID-19 cases week over week: +13.9 per 100,000 people
> Avg. new daily cases in 7 days ending Aug. 31: 33.9 per 100,000 people
> Avg. new daily cases in 7 days ending Aug. 24: 20.0 per 100,000 people
> Cumulative confirmed COVID-19 cases as of Aug. 31: 2,592 per 100,000 people (total: 17,396)
> COVID-19 related deaths as of Aug. 31: 306
> Population: 655,409
> Avg. new daily cases in Iowa in 7 days ending Aug. 31: 32 per 100,000 (2nd most)

12. Columbia, MO
> Change in daily avg. new COVID-19 cases week over week: +14.8 per 100,000 people
> Avg. new daily cases in 7 days ending Aug. 31: 38.1 per 100,000 people
> Avg. new daily cases in 7 days ending Aug. 24: 23.3 per 100,000 people
> Cumulative confirmed COVID-19 cases as of Aug. 31: 1,453 per 100,000 people (total: 2,968)
> COVID-19 related deaths as of Aug. 31: 7
> Population: 180,005
> Avg. new daily cases in Missouri in 7 days ending Aug. 31: 19 per 100,000 (10th most)
[in-text-ad]
11. McAllen-Edinburg-Mission, TX
> Change in daily avg. new COVID-19 cases week over week: +16.2 per 100,000 people
> Avg. new daily cases in 7 days ending Aug. 31: 52.7 per 100,000 people
> Avg. new daily cases in 7 days ending Aug. 24: 36.5 per 100,000 people
> Cumulative confirmed COVID-19 cases as of Aug. 31: 3,227 per 100,000 people (total: 27,408)
> COVID-19 related deaths as of Aug. 31: 1,129
> Population: 865,939
> Avg. new daily cases in Texas in 7 days ending Aug. 31: 17 per 100,000 (14th most)
[recirclink id=731274]

10. Macon-Bibb County, GA
> Change in daily avg. new COVID-19 cases week over week: +16.9 per 100,000 people
> Avg. new daily cases in 7 days ending Aug. 31: 62.0 per 100,000 people
> Avg. new daily cases in 7 days ending Aug. 24: 45.0 per 100,000 people
> Cumulative confirmed COVID-19 cases as of Aug. 31: 2,946 per 100,000 people (total: 6,767)
> COVID-19 related deaths as of Aug. 31: 177
> Population: 226,680
> Avg. new daily cases in Georgia in 7 days ending Aug. 31: 21 per 100,000 (7th most)

9. Blacksburg-Christiansburg, VA
> Change in daily avg. new COVID-19 cases week over week: +17.8 per 100,000 people
> Avg. new daily cases in 7 days ending Aug. 31: 25.9 per 100,000 people
> Avg. new daily cases in 7 days ending Aug. 24: 8.1 per 100,000 people
> Cumulative confirmed COVID-19 cases as of Aug. 31: 642 per 100,000 people (total: 1,070)
> COVID-19 related deaths as of Aug. 31: 7
> Population: 181,926
> Avg. new daily cases in Virginia in 7 days ending Aug. 31: 11 per 100,000 (22nd fewest)
[in-text-ad-2]
8. South Bend-Mishawaka, IN-MI
> Change in daily avg. new COVID-19 cases week over week: +18.2 per 100,000 people
> Avg. new daily cases in 7 days ending Aug. 31: 37.3 per 100,000 people
> Avg. new daily cases in 7 days ending Aug. 24: 19.2 per 100,000 people
> Cumulative confirmed COVID-19 cases as of Aug. 31: 1,734 per 100,000 people (total: 5,562)
> COVID-19 related deaths as of Aug. 31: 109
> Population: 322,424
> Avg. new daily cases in Indiana in 7 days ending Aug. 31: 15 per 100,000 (20th most)

7. Lawrence, KS
> Change in daily avg. new COVID-19 cases week over week: +18.9 per 100,000 people
> Avg. new daily cases in 7 days ending Aug. 31: 30.2 per 100,000 people
> Avg. new daily cases in 7 days ending Aug. 24: 11.3 per 100,000 people
> Cumulative confirmed COVID-19 cases as of Aug. 31: 1,045 per 100,000 people (total: 1,247)
> COVID-19 related deaths as of Aug. 31: 0
> Population: 121,436
> Avg. new daily cases in Kansas in 7 days ending Aug. 31: 20 per 100,000 (8th most)
[in-text-ad]

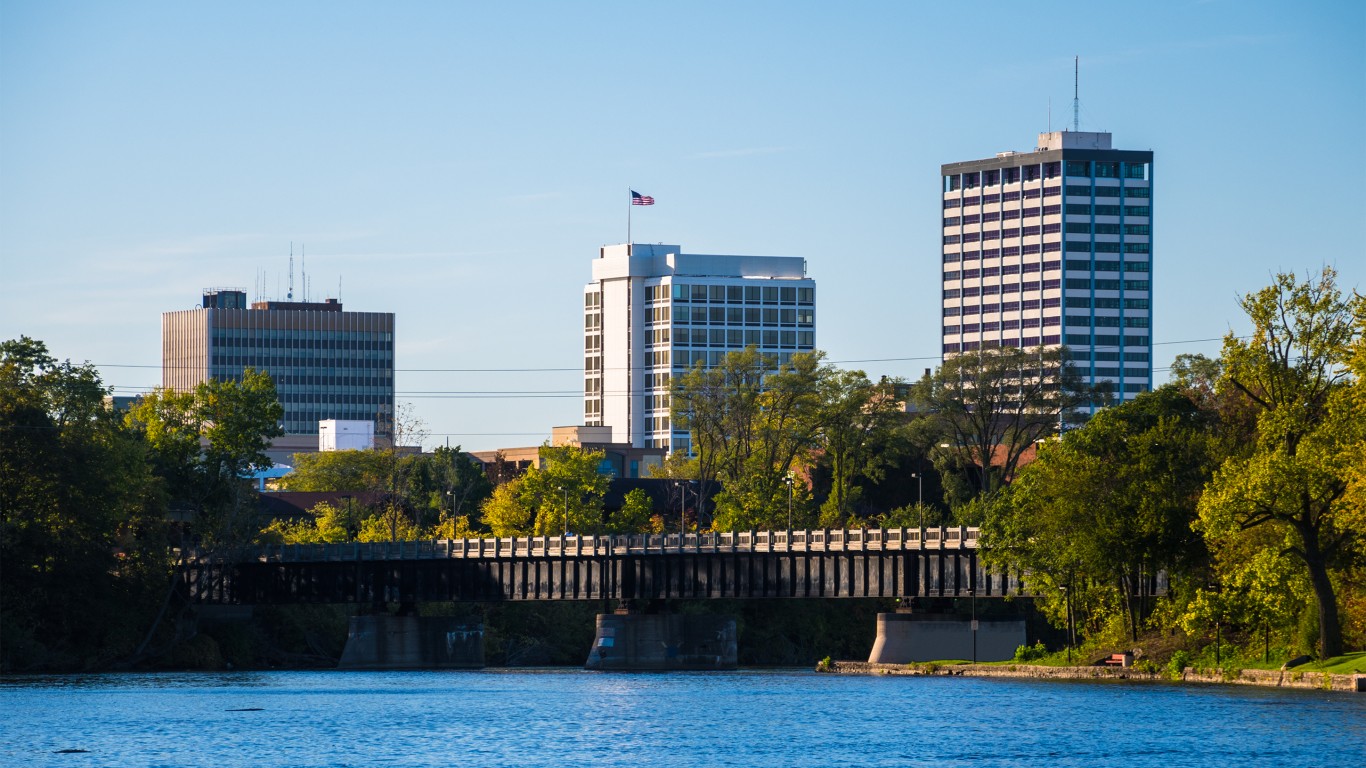
6. Bloomington, IL
> Change in daily avg. new COVID-19 cases week over week: +19.4 per 100,000 people
> Avg. new daily cases in 7 days ending Aug. 31: 39.0 per 100,000 people
> Avg. new daily cases in 7 days ending Aug. 24: 19.6 per 100,000 people
> Cumulative confirmed COVID-19 cases as of Aug. 31: 1,032 per 100,000 people (total: 1,788)
> COVID-19 related deaths as of Aug. 31: 16
> Population: 190,884
> Avg. new daily cases in Illinois in 7 days ending Aug. 31: 15 per 100,000 (19th most)
[recirclink id=732043]

5. Rapid City, SD
> Change in daily avg. new COVID-19 cases week over week: +25.7 per 100,000 people
> Avg. new daily cases in 7 days ending Aug. 31: 38.3 per 100,000 people
> Avg. new daily cases in 7 days ending Aug. 24: 12.6 per 100,000 people
> Cumulative confirmed COVID-19 cases as of Aug. 31: 1,267 per 100,000 people (total: 1,732)
> COVID-19 related deaths as of Aug. 31: 34
> Population: 147,316
> Avg. new daily cases in South Dakota in 7 days ending Aug. 31: 29 per 100,000 (4th most)

4. Greenville, NC
> Change in daily avg. new COVID-19 cases week over week: +30.6 per 100,000 people
> Avg. new daily cases in 7 days ending Aug. 31: 56.4 per 100,000 people
> Avg. new daily cases in 7 days ending Aug. 24: 25.8 per 100,000 people
> Cumulative confirmed COVID-19 cases as of Aug. 31: 1,990 per 100,000 people (total: 3,529)
> COVID-19 related deaths as of Aug. 31: 19
> Population: 179,914
> Avg. new daily cases in North Carolina in 7 days ending Aug. 31: 15 per 100,000 (17th most)
[in-text-ad-2]

3. Grand Forks, ND-MN
> Change in daily avg. new COVID-19 cases week over week: +33.0 per 100,000 people
> Avg. new daily cases in 7 days ending Aug. 31: 58.9 per 100,000 people
> Avg. new daily cases in 7 days ending Aug. 24: 25.9 per 100,000 people
> Cumulative confirmed COVID-19 cases as of Aug. 31: 1,649 per 100,000 people (total: 1,682)
> COVID-19 related deaths as of Aug. 31: 15
> Population: 102,299
> Avg. new daily cases in North Dakota in 7 days ending Aug. 31: 32 per 100,000 (3rd most)

2. Ames, IA
> Change in daily avg. new COVID-19 cases week over week: +39.2 per 100,000 people
> Avg. new daily cases in 7 days ending Aug. 31: 67.9 per 100,000 people
> Avg. new daily cases in 7 days ending Aug. 24: 28.7 per 100,000 people
> Cumulative confirmed COVID-19 cases as of Aug. 31: 2,194 per 100,000 people (total: 2,706)
> COVID-19 related deaths as of Aug. 31: 20
> Population: 98,105
> Avg. new daily cases in Iowa in 7 days ending Aug. 31: 32 per 100,000 (2nd most)
[in-text-ad]
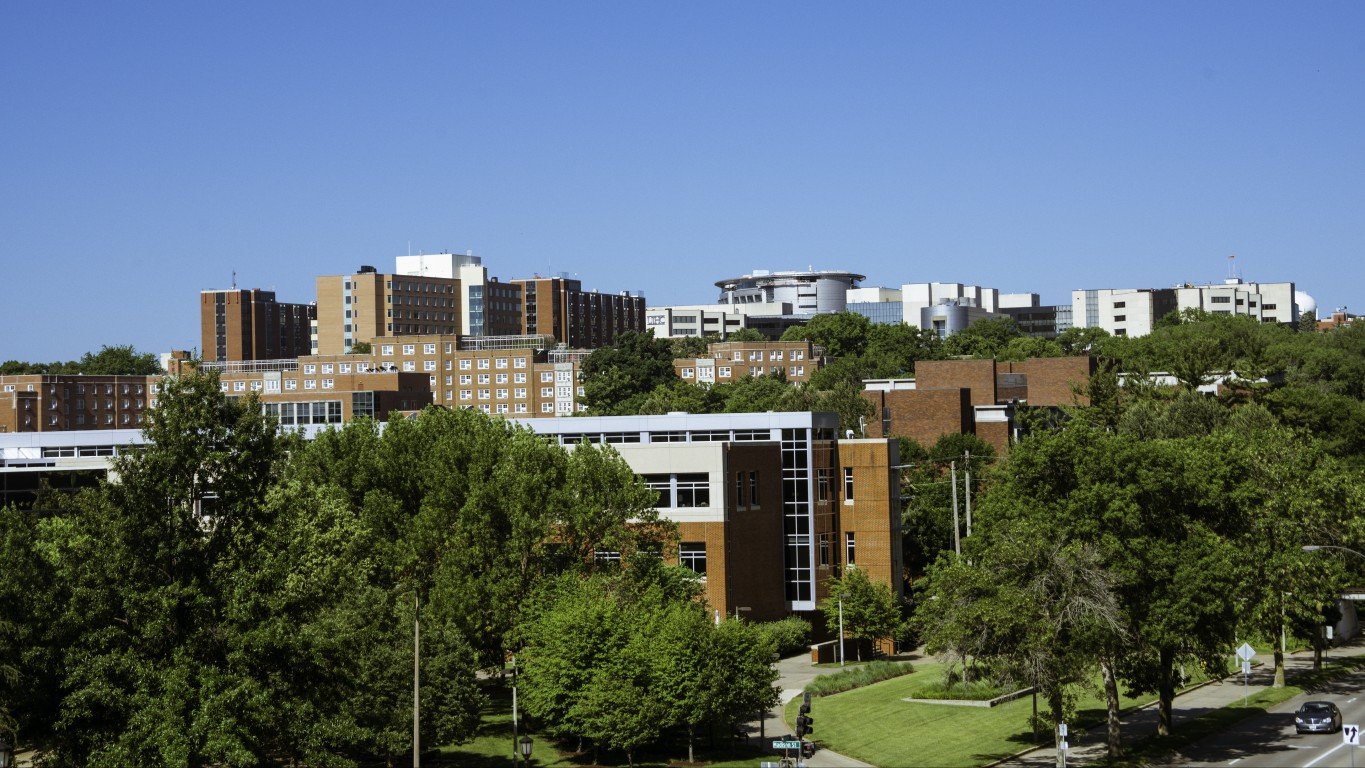
1. Iowa City, IA
> Change in daily avg. new COVID-19 cases week over week: +59.4 per 100,000 people
> Avg. new daily cases in 7 days ending Aug. 31: 78.0 per 100,000 people
> Avg. new daily cases in 7 days ending Aug. 24: 18.6 per 100,000 people
> Cumulative confirmed COVID-19 cases as of Aug. 31: 2,469 per 100,000 people (total: 4,176)
> COVID-19 related deaths as of Aug. 31: 37
> Population: 173,401
> Avg. new daily cases in Iowa in 7 days ending Aug. 31: 32 per 100,000 (2nd most)
Contact [email protected] for any questions or corrections.