It has been about seven months since COVID-19 was declared a pandemic in the United States, and in that time, more than 210,000 Americans died from the novel coronavirus — by far the highest death toll of any country. The virus has spread throughout the country in 2020 in a way that has been difficult to predict, surging in one region, then showing signs of improvement, and then reappearing in other regions. This has been accompanied by inconsistent safety measures and regulations from state to state, and even on a local level. Many states where cases appeared to be largely under control have experienced resurgences in recent months.
The extent of the spread of the novel coronavirus continues to vary considerably from state to state, and even from county to county. Even as the number of daily new cases is flattening or even declining in some parts of the country, new cases are surging at a growing rate in others.
Nationwide, the number of new daily cases across the country has fluctuated between 30,000 and 50,000 per day, fewer than during the surge that occurred this summer, but more than during the initial months of the pandemic. And though some states continue to report relatively low figures compared to their peaks this spring and summer, each state has at least one county in which cases have been growing.
Using data from state and local health departments, 24/7 Wall St. compiled and reviewed the average of daily new confirmed COVID-19 cases for the week ending Oct. 4 and compared it to the average of new daily cases from the previous week to determine the county in each state where the virus is spreading the fastest, adjusted for the population. We excluded counties with populations of fewer than 5,000 people, as well as those with fewer than 20 reported new cases in the past 14 days. Because up to date data was not available for Missouri, that state was excluded from our list.
Though every state, for which there is sufficient data, had at least one county or county equivalent with a week-over-week increase in COVID-19 cases, the virus is spreading much faster in some of these counties compared to others. For instance, in seven states, the county where COVID-19 is growing fastest recorded an increase of over 50 in daily new cases per 100,000 residents in the week ending Oct. 4 as compared to the week ending Sept. 27.
Conversely, in 13 states no county recorded an increase of more than 10 cases per 100,000 residents week over week. The majority of these states are on the West Coast or in the Northeast. Unsurprisingly, nearly all of these states had among the lowest average daily new cases per 100,000 residents in the last week. These are the states where the spread of the virus is slowing, and where it is getting worse.
Click here to see the county in every state where COVID-19 is growing the fastest.

Alabama: Covington County
> Change in daily avg. new COVID-19 cases, week over week: +214.5 per 100,000 people
> Avg. new daily cases in Covington County in 7 days ending Oct. 4: 219.2 per 100,000
> Avg. new daily cases in Covington County in 7 days ending Sept. 27: 4.7 per 100,000
> Avg. new daily cases in Alabama in 7 days ending Oct. 4: 21 per 100,000 (12th most)
> Cumulative confirmed COVID-19 cases in Covington County as of Oct. 4: 3,957 per 100,000 people (total: 1,478)
> Population: 37,351
> Largest place in Covington County: Andalusia
[in-text-ad]

Alaska: Nome Census Area
> Change in daily avg. new COVID-19 cases, week over week: +7.8 per 100,000 people
> Avg. new daily cases in Nome Census Area in 7 days ending Oct. 4: 22.4 per 100,000
> Avg. new daily cases in Nome Census Area in 7 days ending Sept. 27: 14.6 per 100,000
> Avg. new daily cases in Alaska in 7 days ending Oct. 4: 17 per 100,000 (21st most)
> Cumulative confirmed COVID-19 cases in Nome Census Area as of Oct. 4: 866 per 100,000 people (total: 86)
> Population: 9,925
> Largest place in Nome Census Area: Nome
[recirclink id=800095]
Arizona: Gila County
> Change in daily avg. new COVID-19 cases, week over week: +11.4 per 100,000 people
> Avg. new daily cases in Gila County in 7 days ending Oct. 4: 29.9 per 100,000
> Avg. new daily cases in Gila County in 7 days ending Sept. 27: 18.5 per 100,000
> Avg. new daily cases in Arizona in 7 days ending Oct. 4: 7 per 100,000 (7th fewest)
> Cumulative confirmed COVID-19 cases in Gila County as of Oct. 4: 2,717 per 100,000 people (total: 1,451)
> Population: 53,400
> Largest place in Gila County: Payson

Arkansas: Jackson County
> Change in daily avg. new COVID-19 cases, week over week: +49.4 per 100,000 people
> Avg. new daily cases in Jackson County in 7 days ending Oct. 4: 94.1 per 100,000
> Avg. new daily cases in Jackson County in 7 days ending Sept. 27: 44.7 per 100,000
> Avg. new daily cases in Arkansas in 7 days ending Oct. 4: 27 per 100,000 (8th most)
> Cumulative confirmed COVID-19 cases in Jackson County as of Oct. 4: 3,210 per 100,000 people (total: 553)
> Population: 17,225
> Largest place in Jackson County: Newport
[in-text-ad-2]

California: Imperial County
> Change in daily avg. new COVID-19 cases, week over week: +8.4 per 100,000 people
> Avg. new daily cases in Imperial County in 7 days ending Oct. 4: 23.6 per 100,000
> Avg. new daily cases in Imperial County in 7 days ending Sept. 27: 15.2 per 100,000
> Avg. new daily cases in California in 7 days ending Oct. 4: 8 per 100,000 (13th fewest)
> Cumulative confirmed COVID-19 cases in Imperial County as of Oct. 4: 6,154 per 100,000 people (total: 11,090)
> Population: 180,216
> Largest place in Imperial County: El Centro
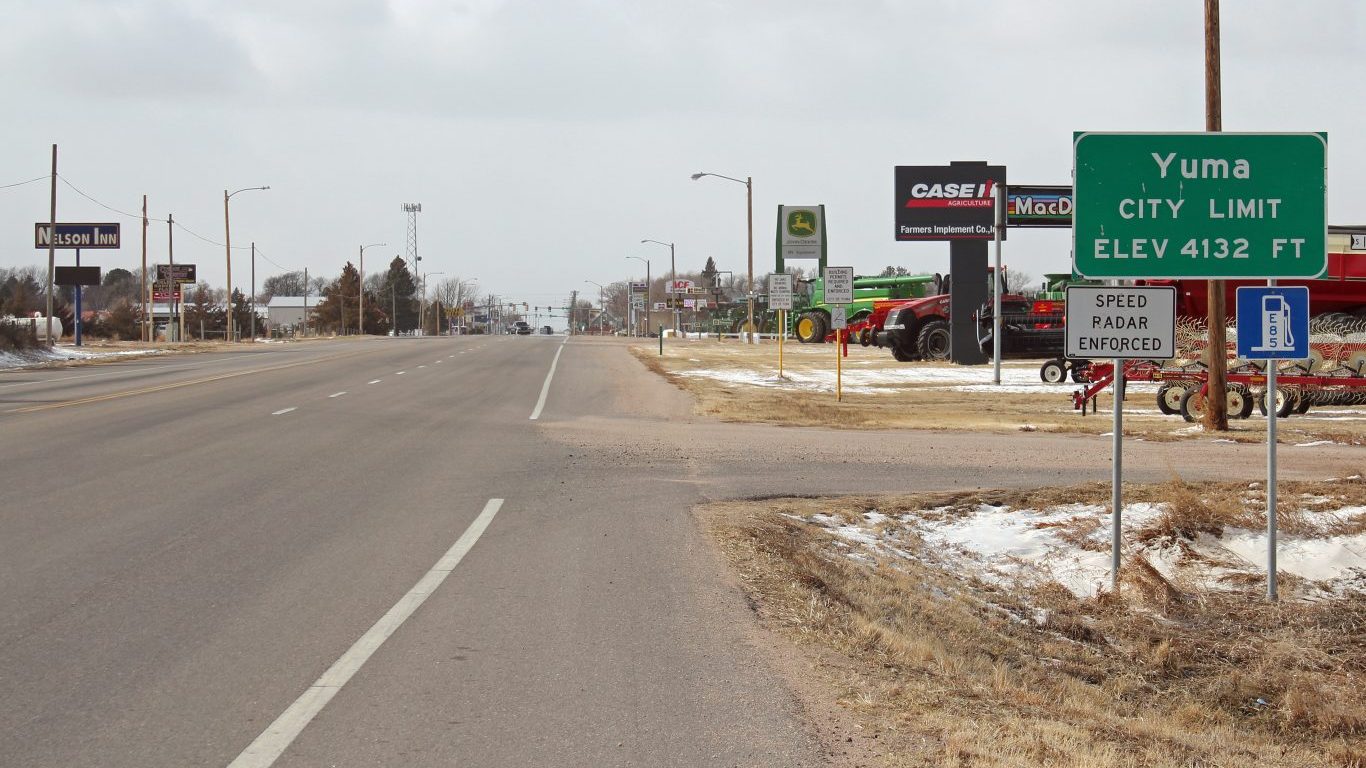
Colorado: Yuma County
> Change in daily avg. new COVID-19 cases, week over week: +12.0 per 100,000 people
> Avg. new daily cases in Yuma County in 7 days ending Oct. 4: 39.1 per 100,000
> Avg. new daily cases in Yuma County in 7 days ending Sept. 27: 27.2 per 100,000
> Avg. new daily cases in Colorado in 7 days ending Oct. 4: 10 per 100,000 (20th fewest)
> Cumulative confirmed COVID-19 cases in Yuma County as of Oct. 4: 1,311 per 100,000 people (total: 132)
> Population: 10,069
> Largest place in Yuma County: Yuma
[in-text-ad]

Connecticut: New London County
> Change in daily avg. new COVID-19 cases, week over week: +8.9 per 100,000 people
> Avg. new daily cases in New London County in 7 days ending Oct. 4: 15.1 per 100,000
> Avg. new daily cases in New London County in 7 days ending Sept. 27: 6.2 per 100,000
> Avg. new daily cases in Connecticut in 7 days ending Oct. 4: 6 per 100,000 (5th fewest)
> Cumulative confirmed COVID-19 cases in New London County as of Oct. 4: 820 per 100,000 people (total: 2,206)
> Population: 268,881
> Largest place in New London County: Norwich
[recirclink id=800100]

Delaware: New Castle County
> Change in daily avg. new COVID-19 cases, week over week: +6.3 per 100,000 people
> Avg. new daily cases in New Castle County in 7 days ending Oct. 4: 18.6 per 100,000
> Avg. new daily cases in New Castle County in 7 days ending Sept. 27: 12.2 per 100,000
> Avg. new daily cases in Delaware in 7 days ending Oct. 4: 13 per 100,000 (25th fewest)
> Cumulative confirmed COVID-19 cases in New Castle County as of Oct. 4: 1,982 per 100,000 people (total: 11,005)
> Population: 555,133
> Largest place in New Castle County: Wilmington

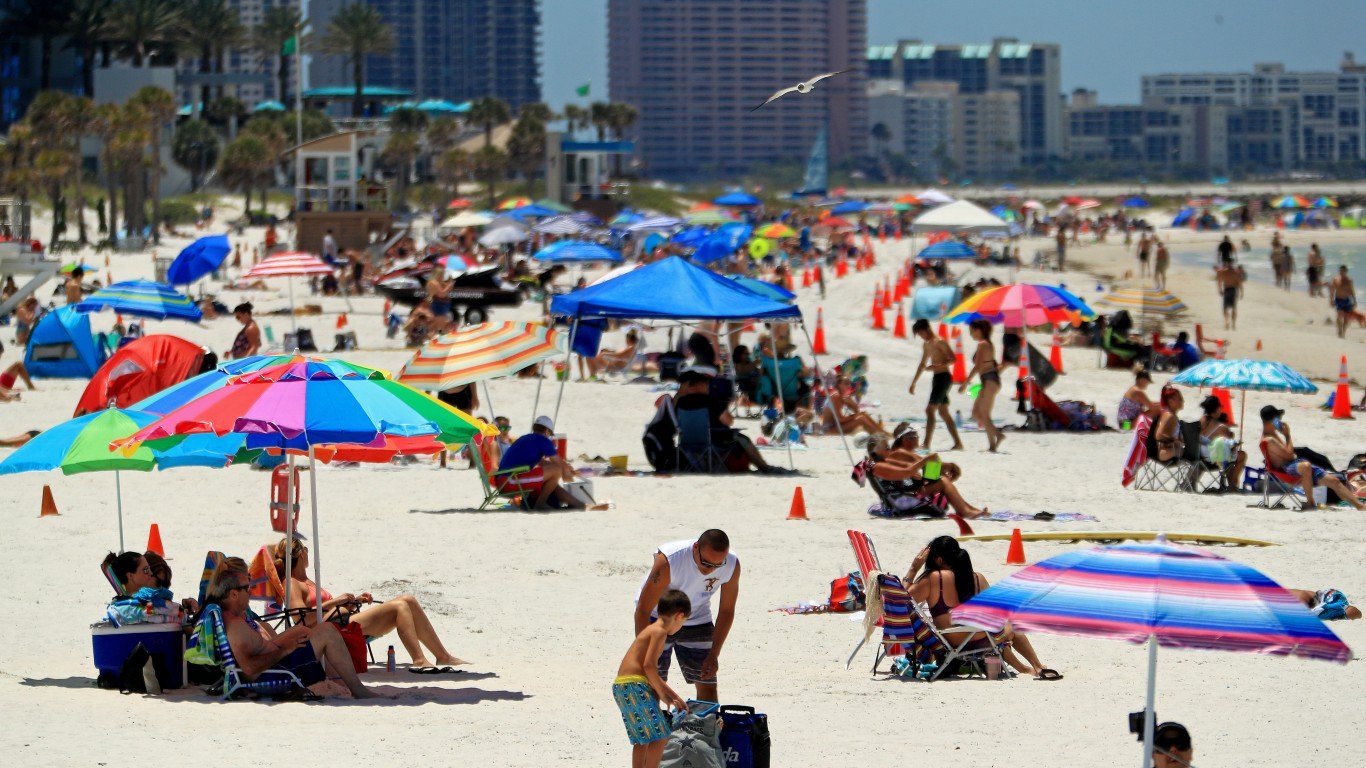
Florida: Sumter County
> Change in daily avg. new COVID-19 cases, week over week: +11.0 per 100,000 people
> Avg. new daily cases in Sumter County in 7 days ending Oct. 4: 18.5 per 100,000
> Avg. new daily cases in Sumter County in 7 days ending Sept. 27: 7.5 per 100,000
> Avg. new daily cases in Florida in 7 days ending Oct. 4: 11 per 100,000 (23rd fewest)
> Cumulative confirmed COVID-19 cases in Sumter County as of Oct. 4: 2,022 per 100,000 people (total: 2,446)
> Population: 120,999
> Largest place in Sumter County: The Villages
[in-text-ad-2]

Georgia: Chattahoochee County
> Change in daily avg. new COVID-19 cases, week over week: +14.0 per 100,000 people
> Avg. new daily cases in Chattahoochee County in 7 days ending Oct. 4: 46.8 per 100,000
> Avg. new daily cases in Chattahoochee County in 7 days ending Sept. 27: 32.8 per 100,000
> Avg. new daily cases in Georgia in 7 days ending Oct. 4: 11 per 100,000 (24th fewest)
> Cumulative confirmed COVID-19 cases in Chattahoochee County as of Oct. 4: 15,631 per 100,000 people (total: 1,683)
> Population: 10,767
> Largest place in Chattahoochee County: Fort Benning South

Hawaii: Hawaii County
> Change in daily avg. new COVID-19 cases, week over week: +0.8 per 100,000 people
> Avg. new daily cases in Hawaii County in 7 days ending Oct. 4: 5.0 per 100,000
> Avg. new daily cases in Hawaii County in 7 days ending Sept. 27: 4.2 per 100,000
> Avg. new daily cases in Hawaii in 7 days ending Oct. 4: 7 per 100,000 (11th fewest)
> Cumulative confirmed COVID-19 cases in Hawaii County as of Oct. 4: 410 per 100,000 people (total: 810)
> Population: 197,658
> Largest place in Hawaii County: Hilo
[in-text-ad]

Idaho: Madison County
> Change in daily avg. new COVID-19 cases, week over week: +34.7 per 100,000 people
> Avg. new daily cases in Madison County in 7 days ending Oct. 4: 104.1 per 100,000
> Avg. new daily cases in Madison County in 7 days ending Sept. 27: 69.4 per 100,000
> Avg. new daily cases in Idaho in 7 days ending Oct. 4: 27 per 100,000 (7th most)
> Cumulative confirmed COVID-19 cases in Madison County as of Oct. 4: 2,679 per 100,000 people (total: 1,037)
> Population: 38,705
> Largest place in Madison County: Rexburg
[recirclink id=799927]

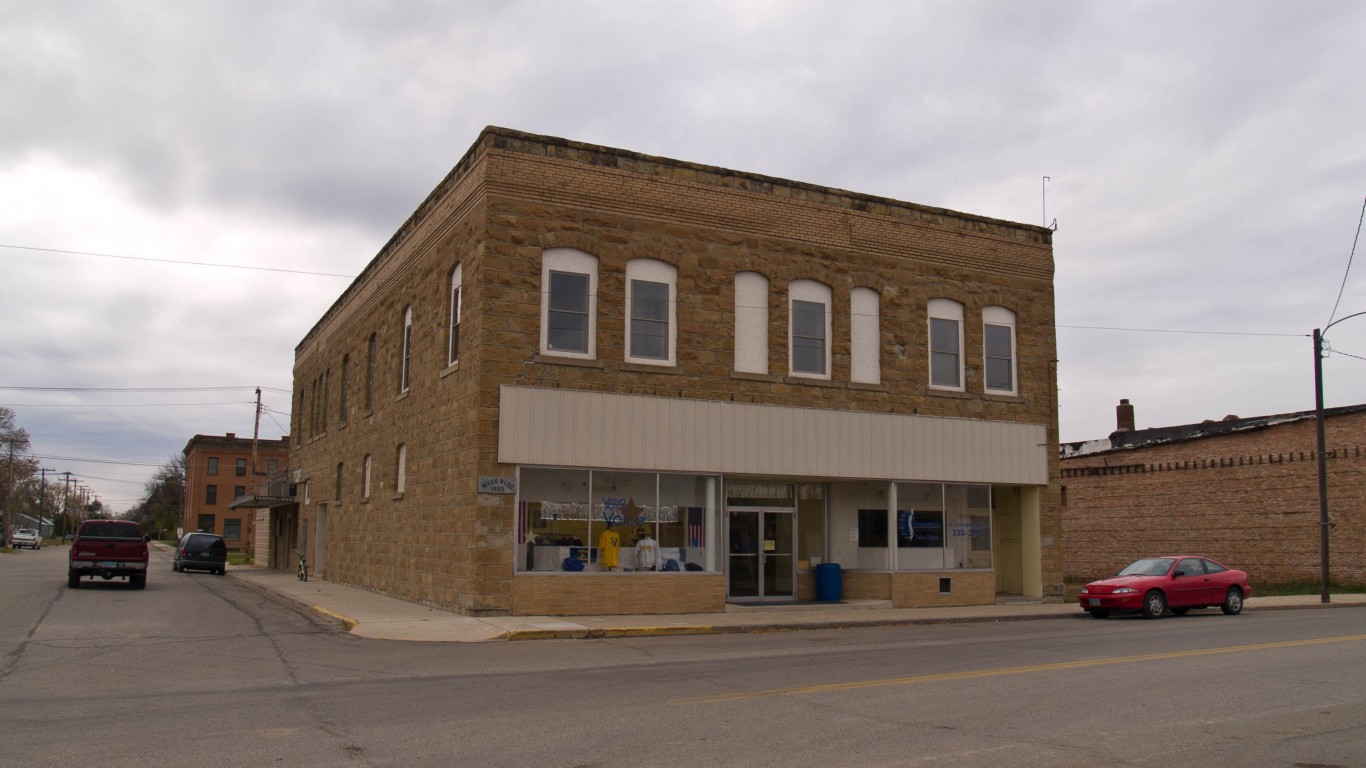
Illinois: Clay County
> Change in daily avg. new COVID-19 cases, week over week: +17.0 per 100,000 people
> Avg. new daily cases in Clay County in 7 days ending Oct. 4: 27.8 per 100,000
> Avg. new daily cases in Clay County in 7 days ending Sept. 27: 10.9 per 100,000
> Avg. new daily cases in Illinois in 7 days ending Oct. 4: 16 per 100,000 (22nd most)
> Cumulative confirmed COVID-19 cases in Clay County as of Oct. 4: 1,432 per 100,000 people (total: 191)
> Population: 13,338
> Largest place in Clay County: Flora

Indiana: Pike County
> Change in daily avg. new COVID-19 cases, week over week: +49.5 per 100,000 people
> Avg. new daily cases in Pike County in 7 days ending Oct. 4: 65.3 per 100,000
> Avg. new daily cases in Pike County in 7 days ending Sept. 27: 15.8 per 100,000
> Avg. new daily cases in Indiana in 7 days ending Oct. 4: 15 per 100,000 (25th most)
> Cumulative confirmed COVID-19 cases in Pike County as of Oct. 4: 1,934 per 100,000 people (total: 240)
> Population: 12,411
> Largest place in Pike County: Petersburg
[in-text-ad-2]

Iowa: Harrison County
> Change in daily avg. new COVID-19 cases, week over week: +49.9 per 100,000 people
> Avg. new daily cases in Harrison County in 7 days ending Oct. 4: 84.4 per 100,000
> Avg. new daily cases in Harrison County in 7 days ending Sept. 27: 34.5 per 100,000
> Avg. new daily cases in Iowa in 7 days ending Oct. 4: 29 per 100,000 (6th most)
> Cumulative confirmed COVID-19 cases in Harrison County as of Oct. 4: 2,256 per 100,000 people (total: 319)
> Population: 14,143
> Largest place in Harrison County: Missouri Valley

Kansas: Rooks County
> Change in daily avg. new COVID-19 cases, week over week: +67.8 per 100,000 people
> Avg. new daily cases in Rooks County in 7 days ending Oct. 4: 113.2 per 100,000
> Avg. new daily cases in Rooks County in 7 days ending Sept. 27: 45.5 per 100,000
> Avg. new daily cases in Kansas in 7 days ending Oct. 4: 22 per 100,000 (11th most)
> Cumulative confirmed COVID-19 cases in Rooks County as of Oct. 4: 2,208 per 100,000 people (total: 113)
> Population: 5,118
> Largest place in Rooks County: Plainville
[in-text-ad]

Kentucky: Fulton County
> Change in daily avg. new COVID-19 cases, week over week: +26.6 per 100,000 people
> Avg. new daily cases in Fulton County in 7 days ending Oct. 4: 44.7 per 100,000
> Avg. new daily cases in Fulton County in 7 days ending Sept. 27: 18.1 per 100,000
> Avg. new daily cases in Kentucky in 7 days ending Oct. 4: 18 per 100,000 (17th most)
> Cumulative confirmed COVID-19 cases in Fulton County as of Oct. 4: 2,770 per 100,000 people (total: 172)
> Population: 6,210
> Largest place in Fulton County: Fulton
[recirclink id=799937]

Louisiana: Plaquemines Parish
> Change in daily avg. new COVID-19 cases, week over week: +25.7 per 100,000 people
> Avg. new daily cases in Plaquemines Parish in 7 days ending Oct. 4: 32.9 per 100,000
> Avg. new daily cases in Plaquemines Parish in 7 days ending Sept. 27: 7.2 per 100,000
> Avg. new daily cases in Louisiana in 7 days ending Oct. 4: 11 per 100,000 (22nd fewest)
> Cumulative confirmed COVID-19 cases in Plaquemines Parish as of Oct. 4: 3,162 per 100,000 people (total: 739)
> Population: 23,373
> Largest place in Plaquemines Parish: Belle Chasse

Maine: Androscoggin County
> Change in daily avg. new COVID-19 cases, week over week: +1.4 per 100,000 people
> Avg. new daily cases in Androscoggin County in 7 days ending Oct. 4: 6.0 per 100,000
> Avg. new daily cases in Androscoggin County in 7 days ending Sept. 27: 4.6 per 100,000
> Avg. new daily cases in Maine in 7 days ending Oct. 4: 2 per 100,000 (2nd fewest)
> Cumulative confirmed COVID-19 cases in Androscoggin County as of Oct. 4: 714 per 100,000 people (total: 767)
> Population: 107,444
> Largest place in Androscoggin County: Lewiston
[in-text-ad-2]

Maryland: Baltimore city
> Change in daily avg. new COVID-19 cases, week over week: +4.3 per 100,000 people
> Avg. new daily cases in Baltimore city in 7 days ending Oct. 4: 8.7 per 100,000
> Avg. new daily cases in Baltimore city in 7 days ending Sept. 27: 4.4 per 100,000
> Avg. new daily cases in Maryland in 7 days ending Oct. 4: 9 per 100,000 (14th fewest)
> Cumulative confirmed COVID-19 cases in Baltimore city as of Oct. 4: 2,595 per 100,000 people (total: 15,954)
> Population: 614,700
> Largest place in Baltimore city: Baltimore

Massachusetts: Nantucket County
> Change in daily avg. new COVID-19 cases, week over week: +18.6 per 100,000 people
> Avg. new daily cases in Nantucket County in 7 days ending Oct. 4: 30.1 per 100,000
> Avg. new daily cases in Nantucket County in 7 days ending Sept. 27: 11.6 per 100,000
> Avg. new daily cases in Massachusetts in 7 days ending Oct. 4: 7 per 100,000 (12th fewest)
> Cumulative confirmed COVID-19 cases in Nantucket County as of Oct. 4: 1,117 per 100,000 people (total: 124)
> Population: 11,101
> Largest place in Nantucket County: Nantucket
[in-text-ad]

Michigan: Delta County
> Change in daily avg. new COVID-19 cases, week over week: +47.1 per 100,000 people
> Avg. new daily cases in Delta County in 7 days ending Oct. 4: 89.3 per 100,000
> Avg. new daily cases in Delta County in 7 days ending Sept. 27: 42.2 per 100,000
> Avg. new daily cases in Michigan in 7 days ending Oct. 4: 9 per 100,000 (18th fewest)
> Cumulative confirmed COVID-19 cases in Delta County as of Oct. 4: 1,810 per 100,000 people (total: 655)
> Population: 36,190
> Largest place in Delta County: Escanaba
[recirclink id=788083]
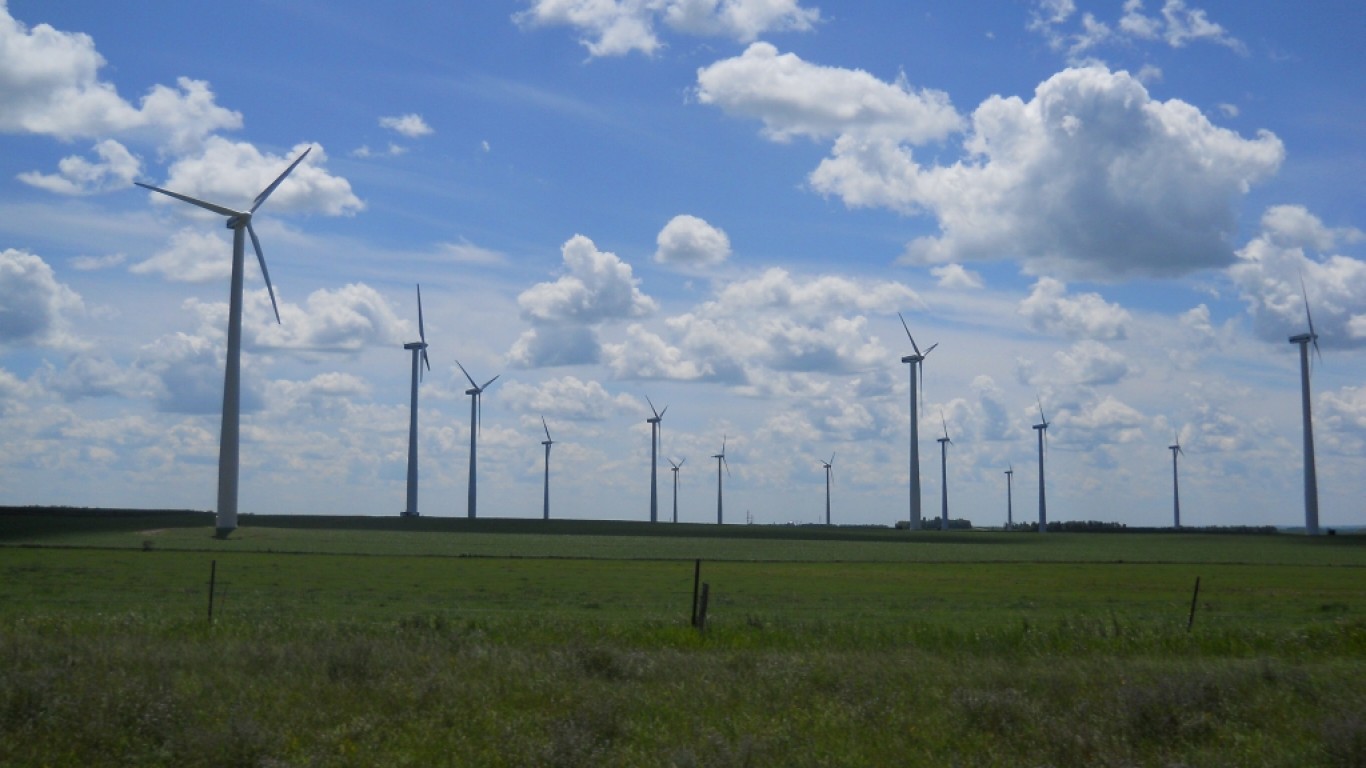
Minnesota: Pipestone County
> Change in daily avg. new COVID-19 cases, week over week: +24.2 per 100,000 people
> Avg. new daily cases in Pipestone County in 7 days ending Oct. 4: 45.5 per 100,000
> Avg. new daily cases in Pipestone County in 7 days ending Sept. 27: 21.3 per 100,000
> Avg. new daily cases in Minnesota in 7 days ending Oct. 4: 18 per 100,000 (16th most)
> Cumulative confirmed COVID-19 cases in Pipestone County as of Oct. 4: 2,929 per 100,000 people (total: 269)
> Population: 9,185
> Largest place in Pipestone County: Pipestone

Mississippi: Lee County
> Change in daily avg. new COVID-19 cases, week over week: +17.9 per 100,000 people
> Avg. new daily cases in Lee County in 7 days ending Oct. 4: 42.2 per 100,000
> Avg. new daily cases in Lee County in 7 days ending Sept. 27: 24.3 per 100,000
> Avg. new daily cases in Mississippi in 7 days ending Oct. 4: 17 per 100,000 (20th most)
> Cumulative confirmed COVID-19 cases in Lee County as of Oct. 4: 3,580 per 100,000 people (total: 3,040)
> Population: 84,915
> Largest place in Lee County: Tupelo
[in-text-ad-2]
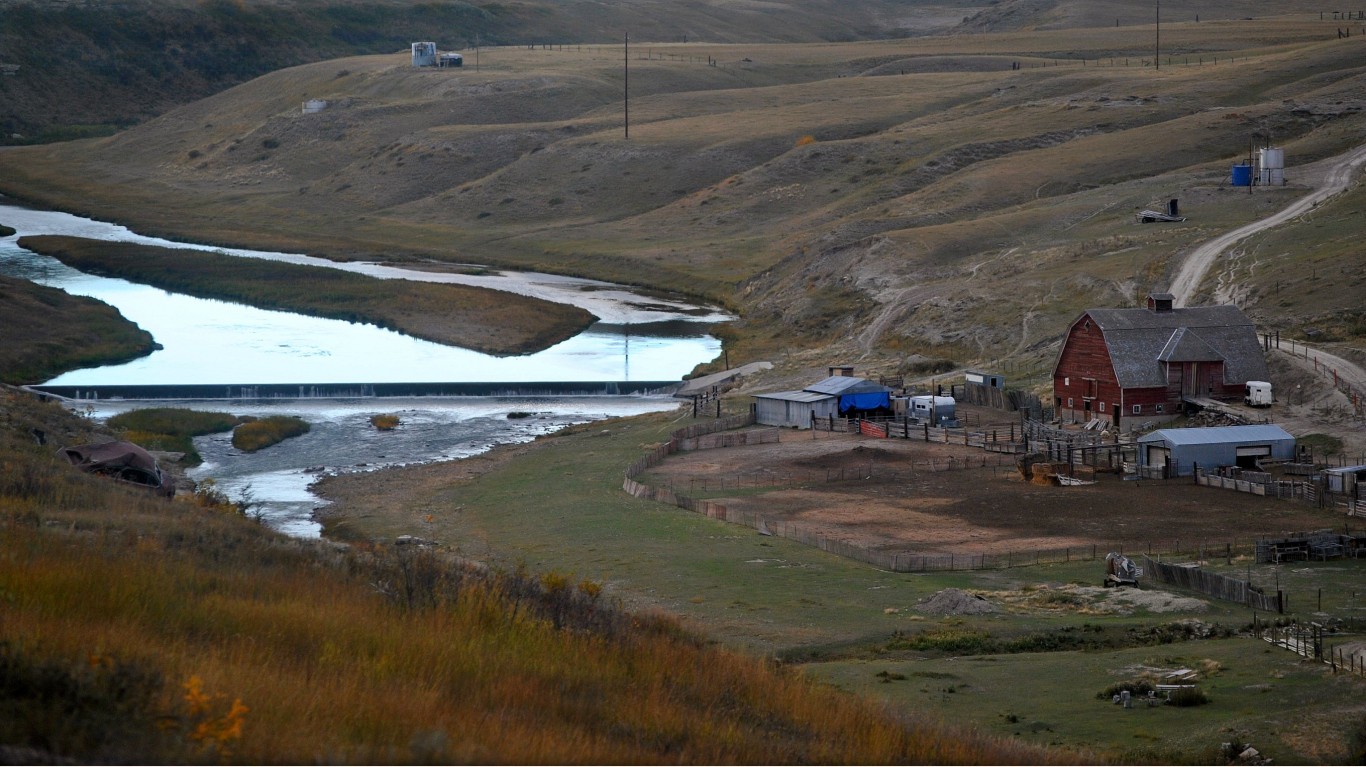
Montana: Glacier County
> Change in daily avg. new COVID-19 cases, week over week: +96.5 per 100,000 people
> Avg. new daily cases in Glacier County in 7 days ending Oct. 4: 161.8 per 100,000
> Avg. new daily cases in Glacier County in 7 days ending Sept. 27: 65.3 per 100,000
> Avg. new daily cases in Montana in 7 days ending Oct. 4: 30 per 100,000 (5th most)
> Cumulative confirmed COVID-19 cases in Glacier County as of Oct. 4: 3,219 per 100,000 people (total: 441)
> Population: 13,699
> Largest place in Glacier County: Cut Bank
[in-text-ad]

Nebraska: Johnson County
> Change in daily avg. new COVID-19 cases, week over week: +37.3 per 100,000 people
> Avg. new daily cases in Johnson County in 7 days ending Oct. 4: 54.6 per 100,000
> Avg. new daily cases in Johnson County in 7 days ending Sept. 27: 17.3 per 100,000
> Avg. new daily cases in Nebraska in 7 days ending Oct. 4: 25 per 100,000 (10th most)
> Cumulative confirmed COVID-19 cases in Johnson County as of Oct. 4: 1,347 per 100,000 people (total: 70)
> Population: 5,197
> Largest place in Johnson County: Tecumseh
[recirclink id=800095]

Nevada: Clark County
> Change in daily avg. new COVID-19 cases, week over week: +4.0 per 100,000 people
> Avg. new daily cases in Clark County in 7 days ending Oct. 4: 16.3 per 100,000
> Avg. new daily cases in Clark County in 7 days ending Sept. 27: 12.3 per 100,000
> Avg. new daily cases in Nevada in 7 days ending Oct. 4: 15 per 100,000 (23rd most)
> Cumulative confirmed COVID-19 cases in Clark County as of Oct. 4: 3,215 per 100,000 people (total: 68,851)
> Population: 2,141,574
> Largest place in Clark County: Las Vegas

New Hampshire: Hillsborough County
> Change in daily avg. new COVID-19 cases, week over week: +3.1 per 100,000 people
> Avg. new daily cases in Hillsborough County in 7 days ending Oct. 4: 5.9 per 100,000
> Avg. new daily cases in Hillsborough County in 7 days ending Sept. 27: 2.9 per 100,000
> Avg. new daily cases in New Hampshire in 7 days ending Oct. 4: 4 per 100,000 (3rd fewest)
> Cumulative confirmed COVID-19 cases in Hillsborough County as of Oct. 4: 1,129 per 100,000 people (total: 4,642)
> Population: 411,087
> Largest place in Hillsborough County: Manchester
[in-text-ad-2]
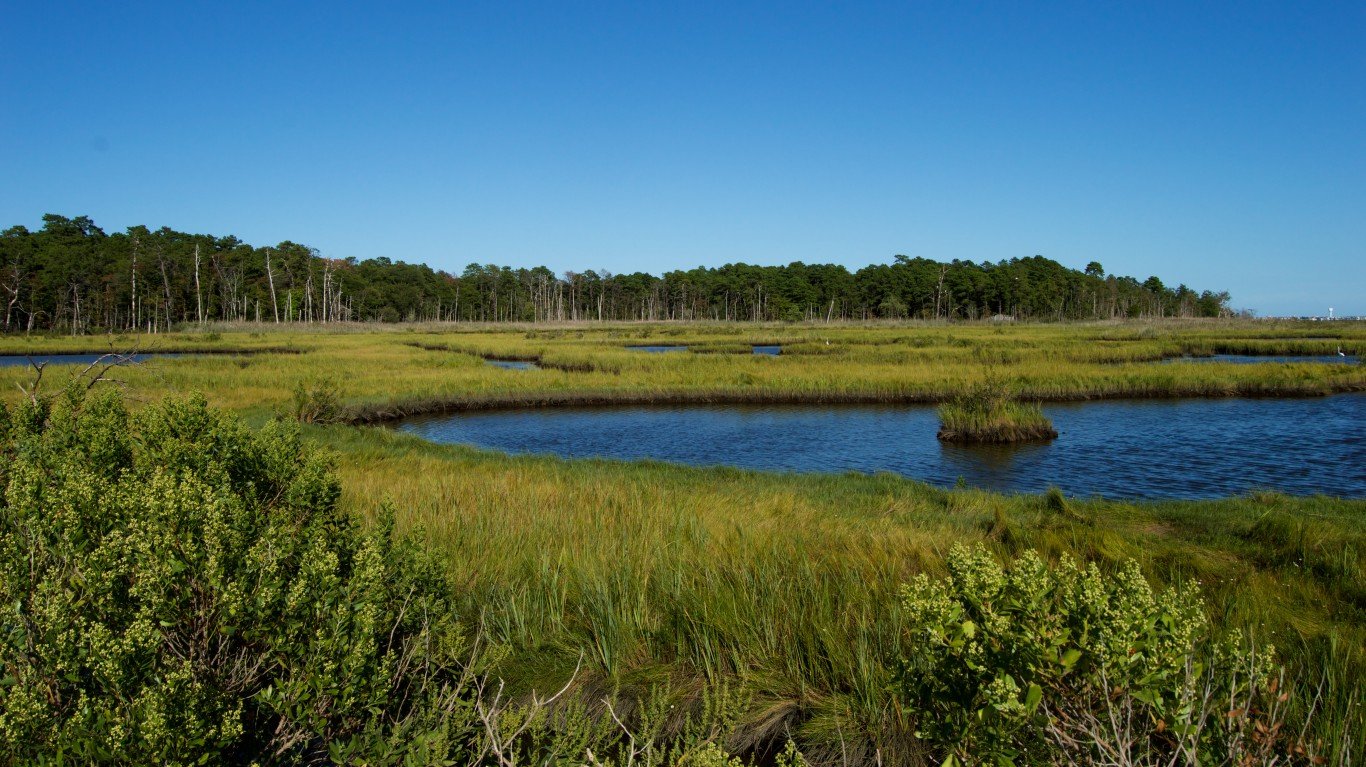
New Jersey: Ocean County
> Change in daily avg. new COVID-19 cases, week over week: +14.5 per 100,000 people
> Avg. new daily cases in Ocean County in 7 days ending Oct. 4: 28.8 per 100,000
> Avg. new daily cases in Ocean County in 7 days ending Sept. 27: 14.3 per 100,000
> Avg. new daily cases in New Jersey in 7 days ending Oct. 4: 7 per 100,000 (8th fewest)
> Cumulative confirmed COVID-19 cases in Ocean County as of Oct. 4: 2,406 per 100,000 people (total: 14,244)
> Population: 591,939
> Largest place in Ocean County: Toms River
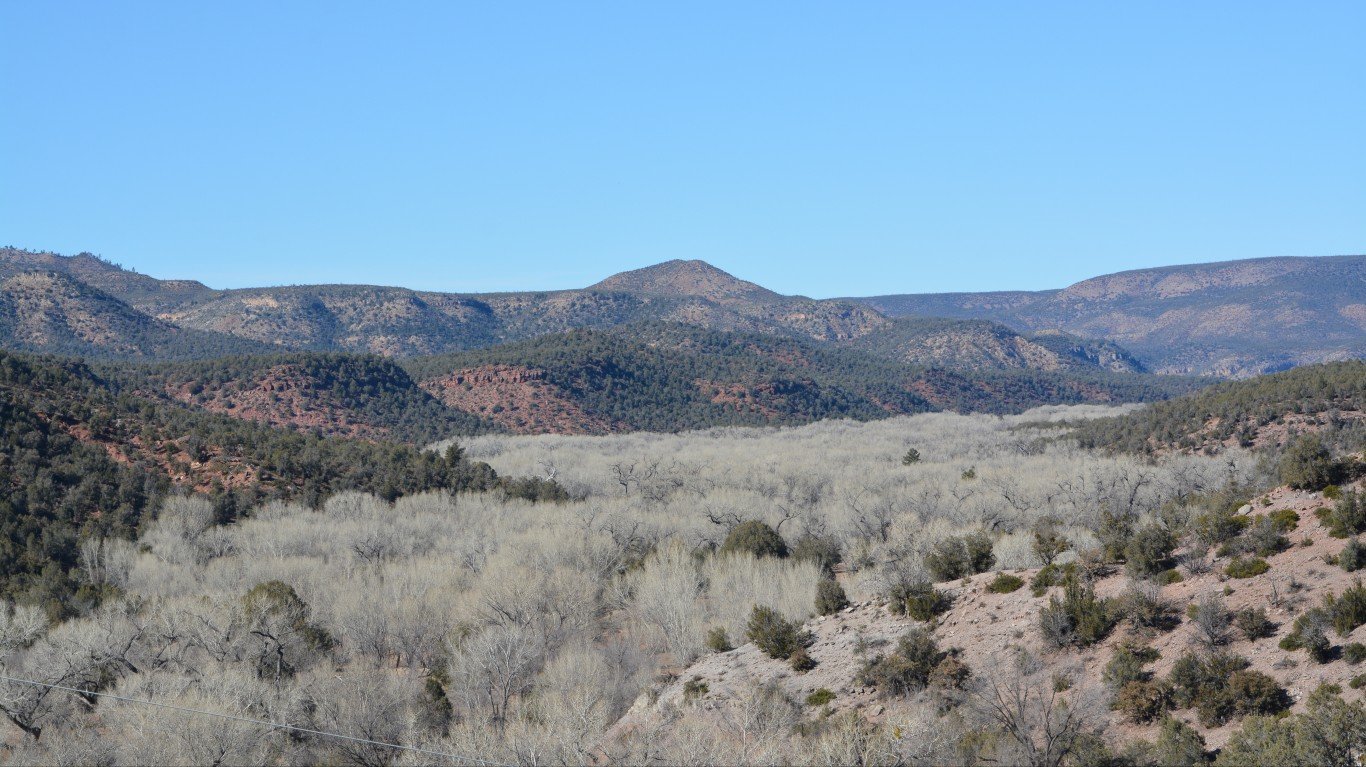
New Mexico: Curry County
> Change in daily avg. new COVID-19 cases, week over week: +16.2 per 100,000 people
> Avg. new daily cases in Curry County in 7 days ending Oct. 4: 26.1 per 100,000
> Avg. new daily cases in Curry County in 7 days ending Sept. 27: 9.9 per 100,000
> Avg. new daily cases in New Mexico in 7 days ending Oct. 4: 10 per 100,000 (19th fewest)
> Cumulative confirmed COVID-19 cases in Curry County as of Oct. 4: 1,809 per 100,000 people (total: 908)
> Population: 50,199
> Largest place in Curry County: Clovis
[in-text-ad]

New York: Rockland County
> Change in daily avg. new COVID-19 cases, week over week: +15.7 per 100,000 people
> Avg. new daily cases in Rockland County in 7 days ending Oct. 4: 28.7 per 100,000
> Avg. new daily cases in Rockland County in 7 days ending Sept. 27: 13.0 per 100,000
> Avg. new daily cases in New York in 7 days ending Oct. 4: 5 per 100,000 (4th fewest)
> Cumulative confirmed COVID-19 cases in Rockland County as of Oct. 4: 4,948 per 100,000 people (total: 16,016)
> Population: 323,686
> Largest place in Rockland County: New City
[recirclink id=800100]

North Carolina: Graham County
> Change in daily avg. new COVID-19 cases, week over week: +27.7 per 100,000 people
> Avg. new daily cases in Graham County in 7 days ending Oct. 4: 60.1 per 100,000
> Avg. new daily cases in Graham County in 7 days ending Sept. 27: 32.4 per 100,000
> Avg. new daily cases in North Carolina in 7 days ending Oct. 4: 17 per 100,000 (19th most)
> Cumulative confirmed COVID-19 cases in Graham County as of Oct. 4: 2,115 per 100,000 people (total: 181)
> Population: 8,557
> Largest place in Graham County: Lake Royale
North Dakota: McHenry County
> Change in daily avg. new COVID-19 cases, week over week: +60.6 per 100,000 people
> Avg. new daily cases in McHenry County in 7 days ending Oct. 4: 67.8 per 100,000
> Avg. new daily cases in McHenry County in 7 days ending Sept. 27: 7.2 per 100,000
> Avg. new daily cases in North Dakota in 7 days ending Oct. 4: 53 per 100,000 (the most)
> Cumulative confirmed COVID-19 cases in McHenry County as of Oct. 4: 1,620 per 100,000 people (total: 96)
> Population: 5,927
> Largest place in McHenry County: Velva
[in-text-ad-2]

Ohio: Fulton County
> Change in daily avg. new COVID-19 cases, week over week: +17.7 per 100,000 people
> Avg. new daily cases in Fulton County in 7 days ending Oct. 4: 23.3 per 100,000
> Avg. new daily cases in Fulton County in 7 days ending Sept. 27: 5.6 per 100,000
> Avg. new daily cases in Ohio in 7 days ending Oct. 4: 9 per 100,000 (15th fewest)
> Cumulative confirmed COVID-19 cases in Fulton County as of Oct. 4: 823 per 100,000 people (total: 348)
> Population: 42,305
> Largest place in Fulton County: Wauseon

Oklahoma: Osage County
> Change in daily avg. new COVID-19 cases, week over week: +43.6 per 100,000 people
> Avg. new daily cases in Osage County in 7 days ending Oct. 4: 66.9 per 100,000
> Avg. new daily cases in Osage County in 7 days ending Sept. 27: 23.3 per 100,000
> Avg. new daily cases in Oklahoma in 7 days ending Oct. 4: 26 per 100,000 (9th most)
> Cumulative confirmed COVID-19 cases in Osage County as of Oct. 4: 2,397 per 100,000 people (total: 1,134)
> Population: 47,311
> Largest place in Osage County: Tulsa
[in-text-ad]

Oregon: Umatilla County
> Change in daily avg. new COVID-19 cases, week over week: +8.5 per 100,000 people
> Avg. new daily cases in Umatilla County in 7 days ending Oct. 4: 18.6 per 100,000
> Avg. new daily cases in Umatilla County in 7 days ending Sept. 27: 10.0 per 100,000
> Avg. new daily cases in Oregon in 7 days ending Oct. 4: 7 per 100,000 (6th fewest)
> Cumulative confirmed COVID-19 cases in Umatilla County as of Oct. 4: 4,025 per 100,000 people (total: 3,095)
> Population: 76,898
> Largest place in Umatilla County: Hermiston
[recirclink id=799927]

Pennsylvania: Montour County
> Change in daily avg. new COVID-19 cases, week over week: +13.5 per 100,000 people
> Avg. new daily cases in Montour County in 7 days ending Oct. 4: 17.4 per 100,000
> Avg. new daily cases in Montour County in 7 days ending Sept. 27: 3.9 per 100,000
> Avg. new daily cases in Pennsylvania in 7 days ending Oct. 4: 7 per 100,000 (10th fewest)
> Cumulative confirmed COVID-19 cases in Montour County as of Oct. 4: 1,082 per 100,000 people (total: 198)
> Population: 18,294
> Largest place in Montour County: Danville

Rhode Island: Washington County
> Change in daily avg. new COVID-19 cases, week over week: +2.9 per 100,000 people
> Avg. new daily cases in Washington County in 7 days ending Oct. 4: 7.6 per 100,000
> Avg. new daily cases in Washington County in 7 days ending Sept. 27: 4.7 per 100,000
> Avg. new daily cases in Rhode Island in 7 days ending Oct. 4: 9 per 100,000 (17th fewest)
> Cumulative confirmed COVID-19 cases in Washington County as of Oct. 4: 695 per 100,000 people (total: 877)
> Population: 126,242
> Largest place in Washington County: Westerly
[in-text-ad-2]

South Carolina: Oconee County
> Change in daily avg. new COVID-19 cases, week over week: +54.5 per 100,000 people
> Avg. new daily cases in Oconee County in 7 days ending Oct. 4: 67.5 per 100,000
> Avg. new daily cases in Oconee County in 7 days ending Sept. 27: 13.0 per 100,000
> Avg. new daily cases in South Carolina in 7 days ending Oct. 4: 18 per 100,000 (18th most)
> Cumulative confirmed COVID-19 cases in Oconee County as of Oct. 4: 2,533 per 100,000 people (total: 1,943)
> Population: 76,696
> Largest place in Oconee County: Seneca

South Dakota: Grant County
> Change in daily avg. new COVID-19 cases, week over week: +33.4 per 100,000 people
> Avg. new daily cases in Grant County in 7 days ending Oct. 4: 94.7 per 100,000
> Avg. new daily cases in Grant County in 7 days ending Sept. 27: 61.4 per 100,000
> Avg. new daily cases in South Dakota in 7 days ending Oct. 4: 47 per 100,000 (2nd most)
> Cumulative confirmed COVID-19 cases in Grant County as of Oct. 4: 2,494 per 100,000 people (total: 180)
> Population: 7,217
> Largest place in Grant County: Milbank
[in-text-ad]

Tennessee: Houston County
> Change in daily avg. new COVID-19 cases, week over week: +26.0 per 100,000 people
> Avg. new daily cases in Houston County in 7 days ending Oct. 4: 97.1 per 100,000
> Avg. new daily cases in Houston County in 7 days ending Sept. 27: 71.1 per 100,000
> Avg. new daily cases in Tennessee in 7 days ending Oct. 4: 20 per 100,000 (13th most)
> Cumulative confirmed COVID-19 cases in Houston County as of Oct. 4: 3,547 per 100,000 people (total: 290)
> Population: 8,176
> Largest place in Houston County: Tennessee Ridge
[recirclink id=799937]

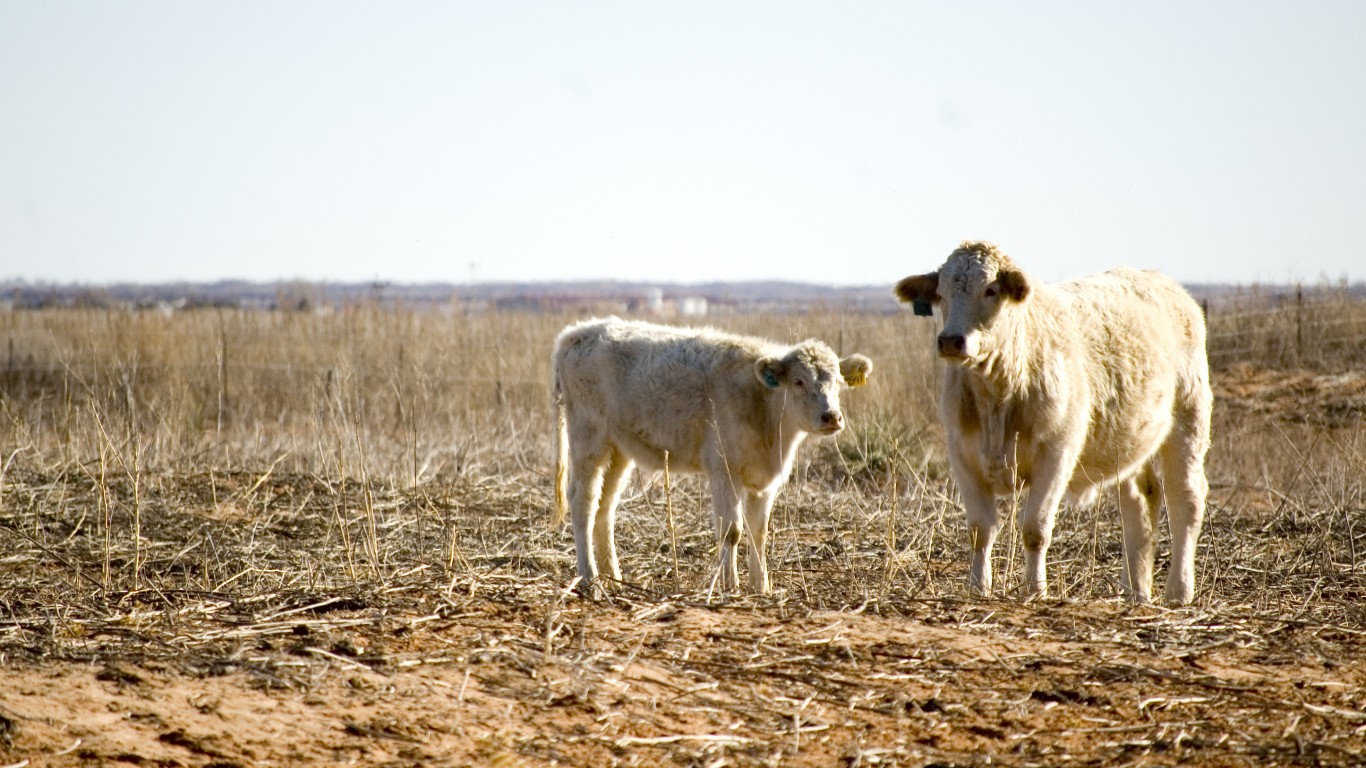
Texas: Potter County
> Change in daily avg. new COVID-19 cases, week over week: +93.7 per 100,000 people
> Avg. new daily cases in Potter County in 7 days ending Oct. 4: 122.0 per 100,000
> Avg. new daily cases in Potter County in 7 days ending Sept. 27: 28.3 per 100,000
> Avg. new daily cases in Texas in 7 days ending Oct. 4: 15 per 100,000 (24th most)
> Cumulative confirmed COVID-19 cases in Potter County as of Oct. 4: 5,068 per 100,000 people (total: 6,127)
> Population: 120,899
> Largest place in Potter County: Amarillo
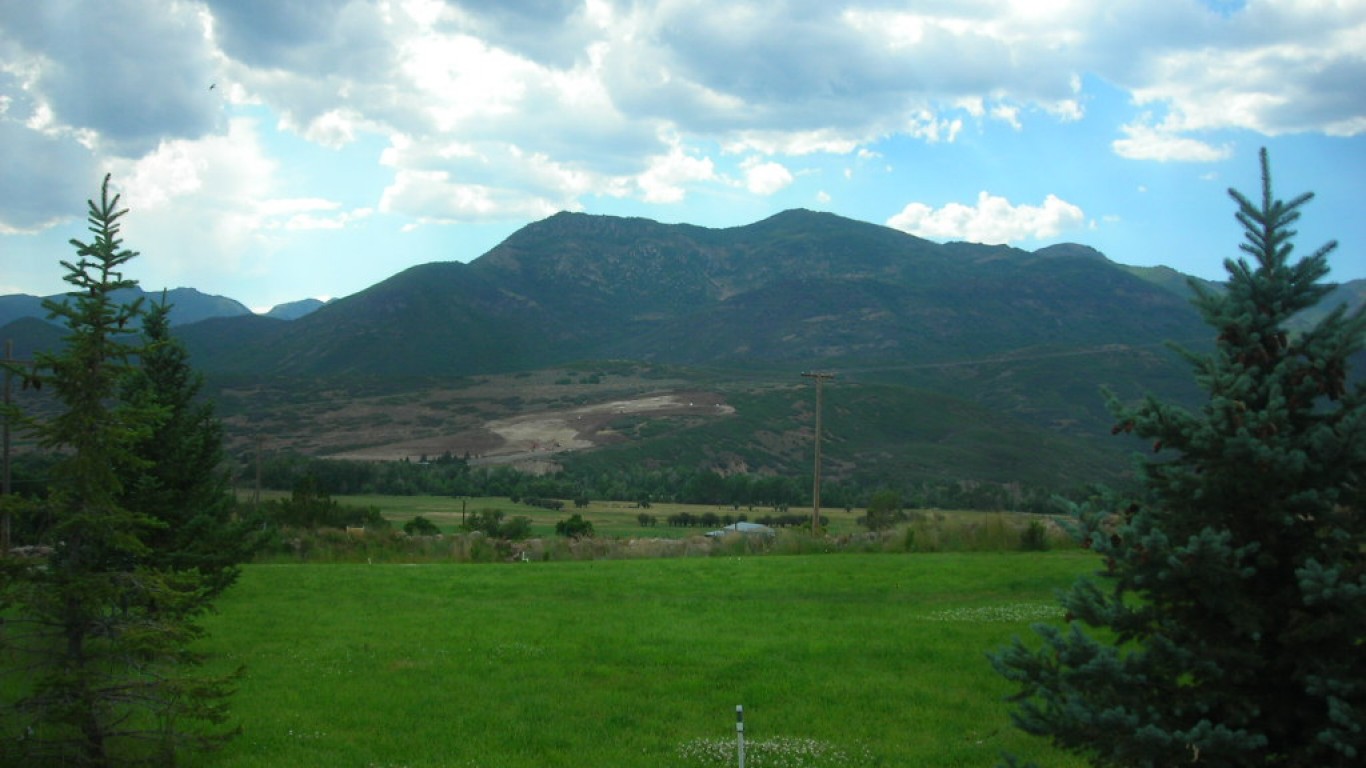
Utah: Wasatch County
> Change in daily avg. new COVID-19 cases, week over week: +10.6 per 100,000 people
> Avg. new daily cases in Wasatch County in 7 days ending Oct. 4: 32.4 per 100,000
> Avg. new daily cases in Wasatch County in 7 days ending Sept. 27: 21.7 per 100,000
> Avg. new daily cases in Utah in 7 days ending Oct. 4: 31 per 100,000 (4th most)
> Cumulative confirmed COVID-19 cases in Wasatch County as of Oct. 4: 2,749 per 100,000 people (total: 839)
> Population: 30,523
> Largest place in Wasatch County: Heber
[in-text-ad-2]

Vermont: Chittenden County
> Change in daily avg. new COVID-19 cases, week over week: +0.01 per 100,000 people
> Avg. new daily cases in Chittenden County in 7 days ending Oct. 4: .8 per 100,000
> Avg. new daily cases in Chittenden County in 7 days ending Sept. 27: .7 per 100,000
> Avg. new daily cases in Vermont in 7 days ending Oct. 4: 1 per 100,000 (the fewest)
> Cumulative confirmed COVID-19 cases in Chittenden County as of Oct. 4: 526 per 100,000 people (total: 852)
> Population: 162,052
> Largest place in Chittenden County: Burlington

Virginia: Lexington city
> Change in daily avg. new COVID-19 cases, week over week: +43.9 per 100,000 people
> Avg. new daily cases in Lexington city in 7 days ending Oct. 4: 80.7 per 100,000
> Avg. new daily cases in Lexington city in 7 days ending Sept. 27: 36.7 per 100,000
> Avg. new daily cases in Virginia in 7 days ending Oct. 4: 9 per 100,000 (16th fewest)
> Cumulative confirmed COVID-19 cases in Lexington city as of Oct. 4: 1,744 per 100,000 people (total: 124)
> Population: 7,110
> Largest place in Lexington city: Lexington
[in-text-ad]

Washington: Pend Oreille County
> Change in daily avg. new COVID-19 cases, week over week: +8.0 per 100,000 people
> Avg. new daily cases in Pend Oreille County in 7 days ending Oct. 4: 11.0 per 100,000
> Avg. new daily cases in Pend Oreille County in 7 days ending Sept. 27: 2.9 per 100,000
> Avg. new daily cases in Washington in 7 days ending Oct. 4: 7 per 100,000 (9th fewest)
> Cumulative confirmed COVID-19 cases in Pend Oreille County as of Oct. 4: 613 per 100,000 people (total: 81)
> Population: 13,219
> Largest place in Pend Oreille County: Newport
[recirclink id=788083]

West Virginia: Tucker County
> Change in daily avg. new COVID-19 cases, week over week: +26.4 per 100,000 people
> Avg. new daily cases in Tucker County in 7 days ending Oct. 4: 34.9 per 100,000
> Avg. new daily cases in Tucker County in 7 days ending Sept. 27: 8.4 per 100,000
> Avg. new daily cases in West Virginia in 7 days ending Oct. 4: 10 per 100,000 (21st fewest)
> Cumulative confirmed COVID-19 cases in Tucker County as of Oct. 4: 598 per 100,000 people (total: 42)
> Population: 7,027
> Largest place in Tucker County: Parsons

Wisconsin: Shawano County
> Change in daily avg. new COVID-19 cases, week over week: +48.9 per 100,000 people
> Avg. new daily cases in Shawano County in 7 days ending Oct. 4: 133.3 per 100,000
> Avg. new daily cases in Shawano County in 7 days ending Sept. 27: 84.4 per 100,000
> Avg. new daily cases in Wisconsin in 7 days ending Oct. 4: 40 per 100,000 (3rd most)
> Cumulative confirmed COVID-19 cases in Shawano County as of Oct. 4: 3,099 per 100,000 people (total: 1,271)
> Population: 41,009
> Largest place in Shawano County: Shawano
[in-text-ad-2]
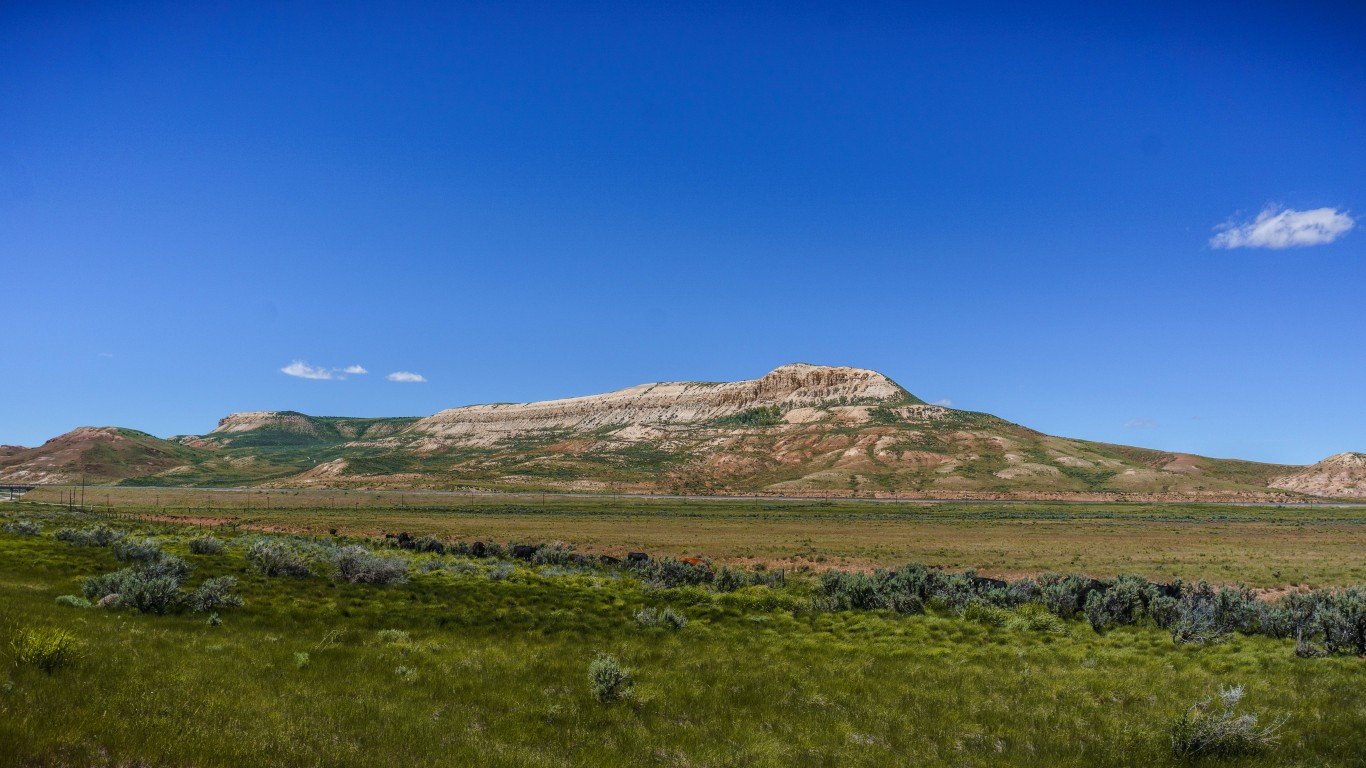
Wyoming: Lincoln County
> Change in daily avg. new COVID-19 cases, week over week: +14.5 per 100,000 people
> Avg. new daily cases in Lincoln County in 7 days ending Oct. 4: 37.1 per 100,000
> Avg. new daily cases in Lincoln County in 7 days ending Sept. 27: 22.7 per 100,000
> Avg. new daily cases in Wyoming in 7 days ending Oct. 4: 20 per 100,000 (14th most)
> Cumulative confirmed COVID-19 cases in Lincoln County as of Oct. 4: 1,205 per 100,000 people (total: 229)
> Population: 19,011
> Largest place in Lincoln County: Kemmerer
Contact [email protected] for any questions or corrections.