[cnxvideo id=”1124170″ placement=”ros”]
In most of the United States, an individual with an annual income of $12,760 or less is classified as living below the poverty line. Though the share of the population living on such low incomes has fallen considerably in recent years, there are still 43.5 million Americans living in poverty — a number that will likely climb as the ongoing COVID-19 pandemic has crippled the U.S. economy, and continues to threaten businesses and livelihoods. Here is a look at job losses across the 50 states in the first three months of the pandemic.
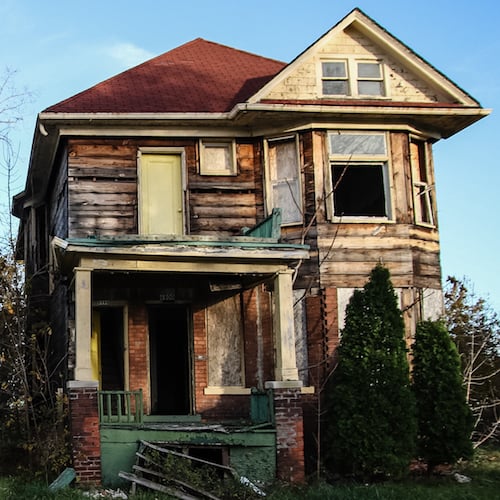
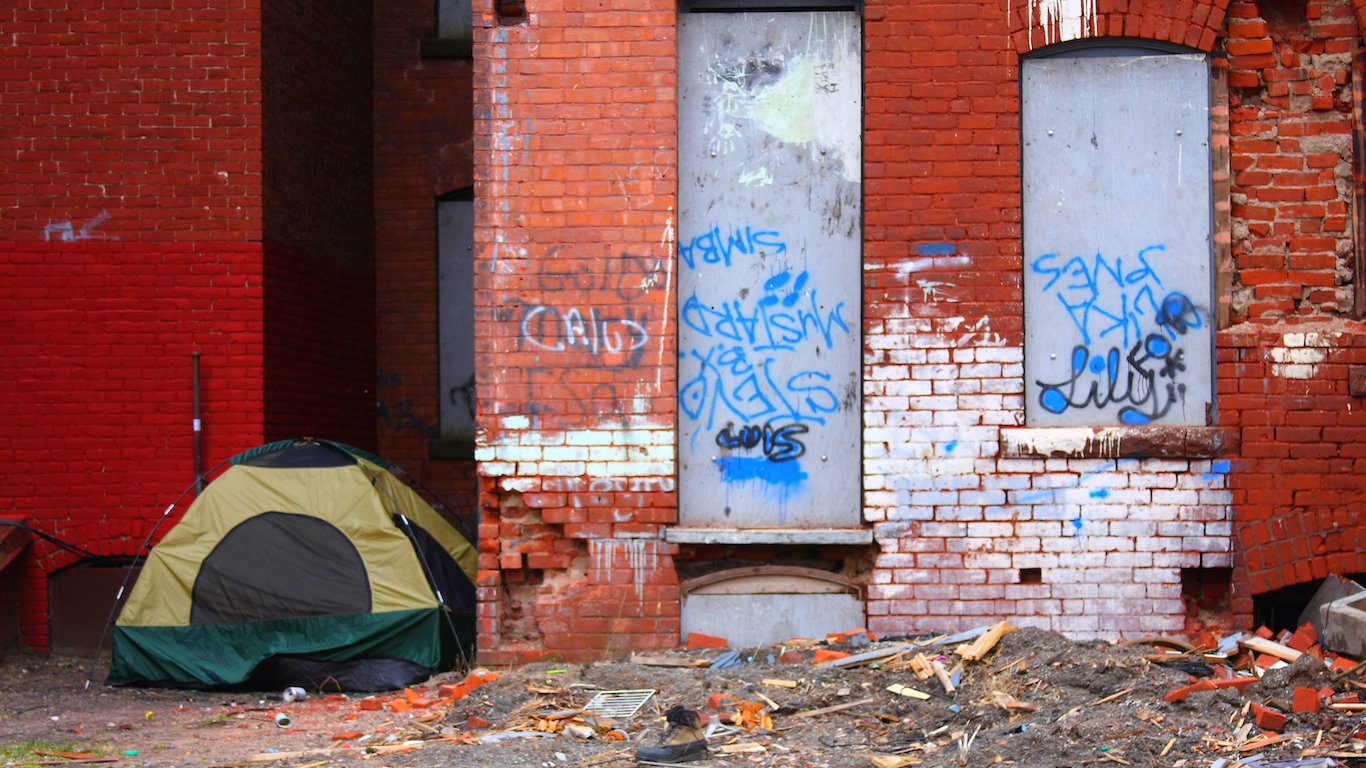
Americans living below the poverty line face a wide range of unique challenges with many struggling to afford basic necessities such as food, housing, and health care. Other challenges include increased stress and often worse than average health outcomes. These problems can be compounded for those who live on poverty level incomes in communities of concentrated poverty — defined as Census tracts where 40% or more of the population live below the poverty line.
In these concentrated-poverty neighborhoods, crime rates tend to be higher, education outcomes tend to lag, and job opportunities can be limited. Each of these factors makes it more difficult for the poorest Americans to climb out of poverty. Nationwide, 9.6% of the 43.5 million people living below the poverty line also reside in communities of concentrated poverty.
To identify the cities hit hardest by extreme poverty in every state, 24/7 Wall St. reviewed Census data on the share of the population living below the poverty line in concentrated-poverty neighborhoods in each of the nation’s 383 metropolitan areas. All data — including unemployment — is from the U.S. Census Bureau’s 2018 American Community Survey.
Metro areas were excluded if concentrated poverty Census tracts had a college or graduate school enrollment rate of 25% or higher as large student populations can skew the actual severity of financial hardship in a community. Due in part to the presence of college and university students, not every state has a metro area with extreme poverty.
Just because a city ranks on this list does not mean its extreme poverty rate is high relative to the U.S. as a whole. There are several metro areas on this list with extreme poverty rates below the 9.6% national rate.
In many of the metro areas on this list, however, the high concentrated poverty rate also coincides with a high overall poverty rate. Many of these cities also have among the lowest median incomes in the country. Here is a look at America’s poorest metro areas.
Click here to see the cities hit hardest by extreme poverty in every state
Click here to read our methodology

Alabama: Mobile
> Concentrated poverty rate: 19.7% of poor pop. live in poor neighborhoods
> Overall poverty rate: 19.3% (state: 17.3%)
> Neighborhoods with concentrated poverty: 20 out of 113
> 2018 Census unemployment rate: 13.9% in poor neighborhoods; 5.7% in all other neighborhoods
In the Mobile, Alabama, metro area, about 78,200 people live below the poverty line — and 19.7% of them live in neighborhoods where the poverty rate is 40% or higher. In neighborhoods with such concentrated poverty, upward economic mobility is particularly challenging. Job opportunities in Mobile’s poorest communities are especially limited. The jobless rate in these concentrated poverty areas stands at 13.9%, more than double the 5.7% jobless rate in all other neighborhoods in the metro area.
In Mobile, African Americans are far more likely to be affected by extreme poverty than other racial groups. Of metro area residents living in neighborhoods where 40% or more residents live in poverty, 86.0% are Black.
[in-text-ad]

Alaska: No metro area with concentrated poverty
> State poverty rate: 10.8%
In both metropolitan areas in Alaska — Anchorage and Fairbanks — less than one in every 10 residents live below the poverty line, a smaller share than the 13.9% national poverty rate and the 10.8% statewide rate. Not only is poverty less common in these cities, but those who are struggling financially are not as economically segregated as low-income Americans in cities across the country are. There are no Census tracts of concentrated poverty — tracts with poverty rates of 40% or higher — in either Anchorage or Fairbanks.
[recirclink id=714364]
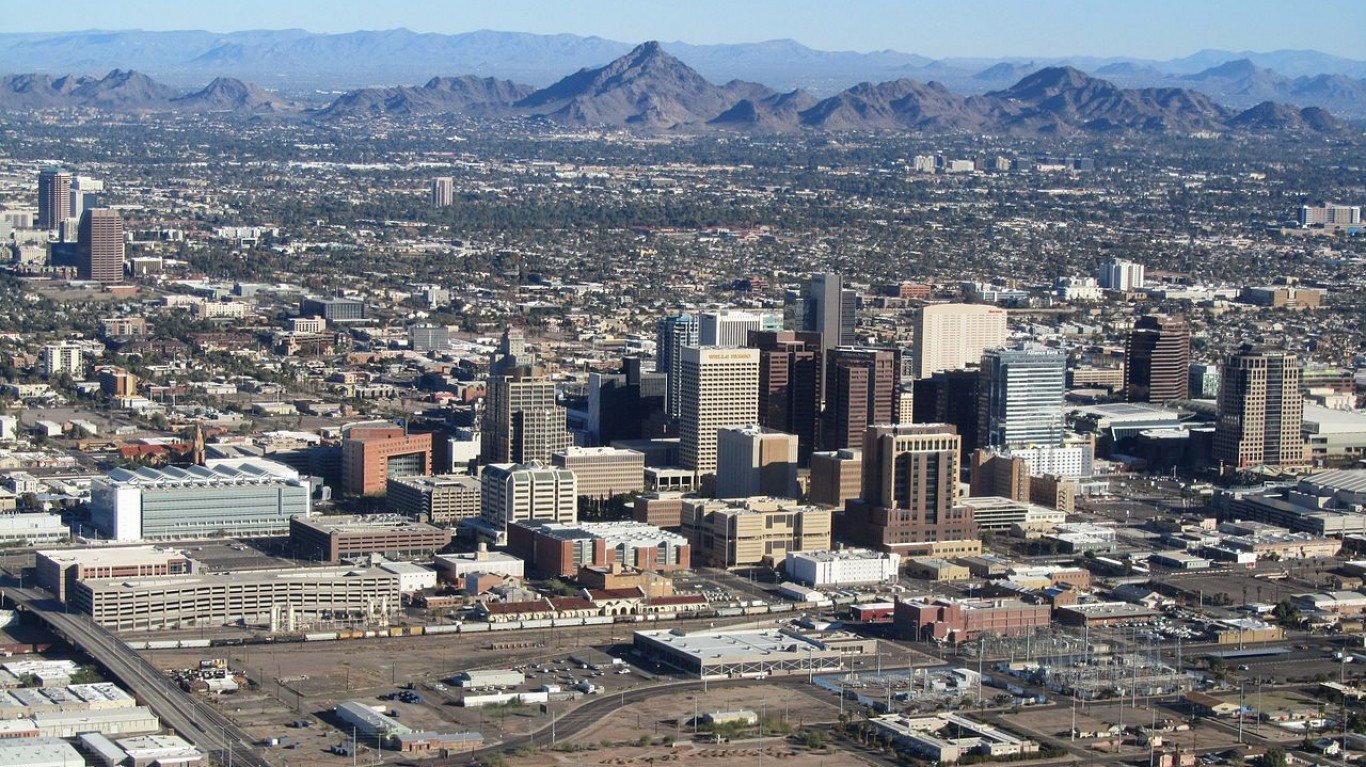
Arizona: Phoenix-Mesa-Scottsdale
> Concentrated poverty rate: 13.8% of poor pop. live in poor neighborhoods
> Overall poverty rate: 14.6% (state: 15.9%)
> Neighborhoods with concentrated poverty: 49 out of 975
> 2018 Census unemployment rate: 8.5% in poor neighborhoods; 5.5% in all other neighborhoods
Phoenix’s overall poverty rate is lower than the statewide rate, at 14.6% compared to 15.9% across all of Arizona. Still, Phoenix’s poor residents are more likely to be isolated in predominantly poor neighborhoods than poor residents of any other metropolitan area in the state. Nearly 14% of the more than 666,000 Phoenix residents living below the poverty line live in the 49 metro area neighborhoods with concentrated poverty — where at least 40% of all residents have poverty level income.
Homeownership is a practical way for many Americans to build wealth. In Phoenix’s concentrated poverty neighborhoods, the homeownership rate stands at just 30.4%, less than half the homeownership rate of 63.9% in the metro area’s remaining neighborhoods.

Arkansas: Hot Springs
> Concentrated poverty rate: 18.6% of poor pop. live in poor neighborhoods
> Overall poverty rate: 18.6% (state: 17.4%)
> Neighborhoods with concentrated poverty: 3 out of 20
> 2018 Census unemployment rate: 15.1% in poor neighborhoods; 6.4% in all other neighborhoods
In Hot Springs, Arkansas, 3,335 people live on poverty level income and in neighborhoods where at least 40% of residents live below the poverty line. The 18.6% concentrated poverty rate in Hot Springs is by far the highest of any of the six metropolitan areas in the state. In Little Rock, 9.8% of poor residents live in concentrated poverty neighborhoods, the second highest concentrated poverty rate in the state.
Cities with higher rates of concentrated poverty are often poorer than average, partially because upward economic mobility is typically limited in poor neighborhoods. The average household income in Hot Springs is $62,899, below both the state average of $64,423 and the national average of $85,123.
[in-text-ad-2]
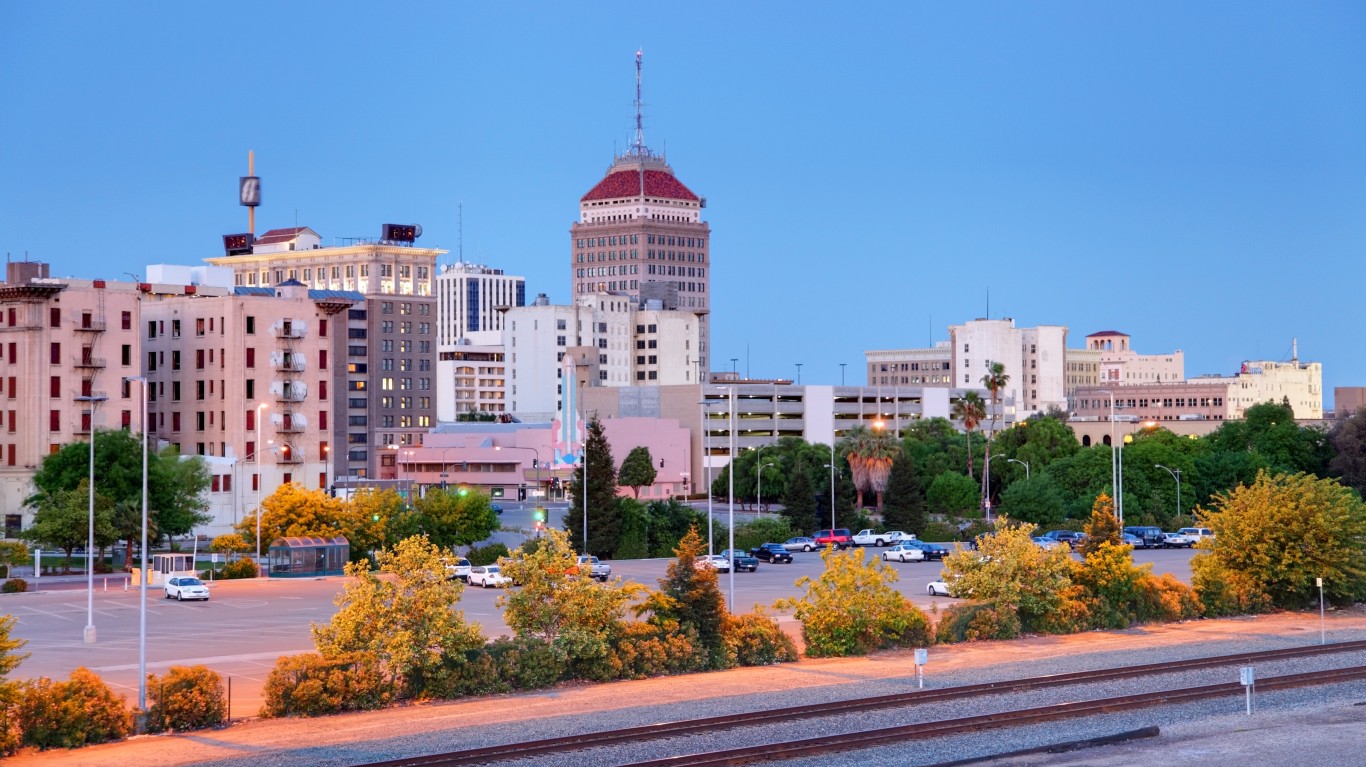
California: Fresno
> Concentrated poverty rate: 33.2% of poor pop. live in poor neighborhoods
> Overall poverty rate: 24.1% (state: 14.1%)
> Neighborhoods with concentrated poverty: 35 out of 198
> 2018 Census unemployment rate: 14.5% in poor neighborhoods; 8.5% in all other neighborhoods
The hardships associated with poverty are often compounded for those also living in extremely poor neighborhoods. In Fresno, California, about one in every three of the 231,111 people living below the poverty line reside in neighborhoods where at least 40% of the population also lives on poverty level income.
Job opportunities appear to be far more limited in Fresno’s poorest neighborhoods than in other parts of the metro area. Unemployment in parts of the metro area where the poverty rate is at least 40% stands at 14.5%, well above the average unemployment rate of 8.5% in the remaining communities in Fresno.
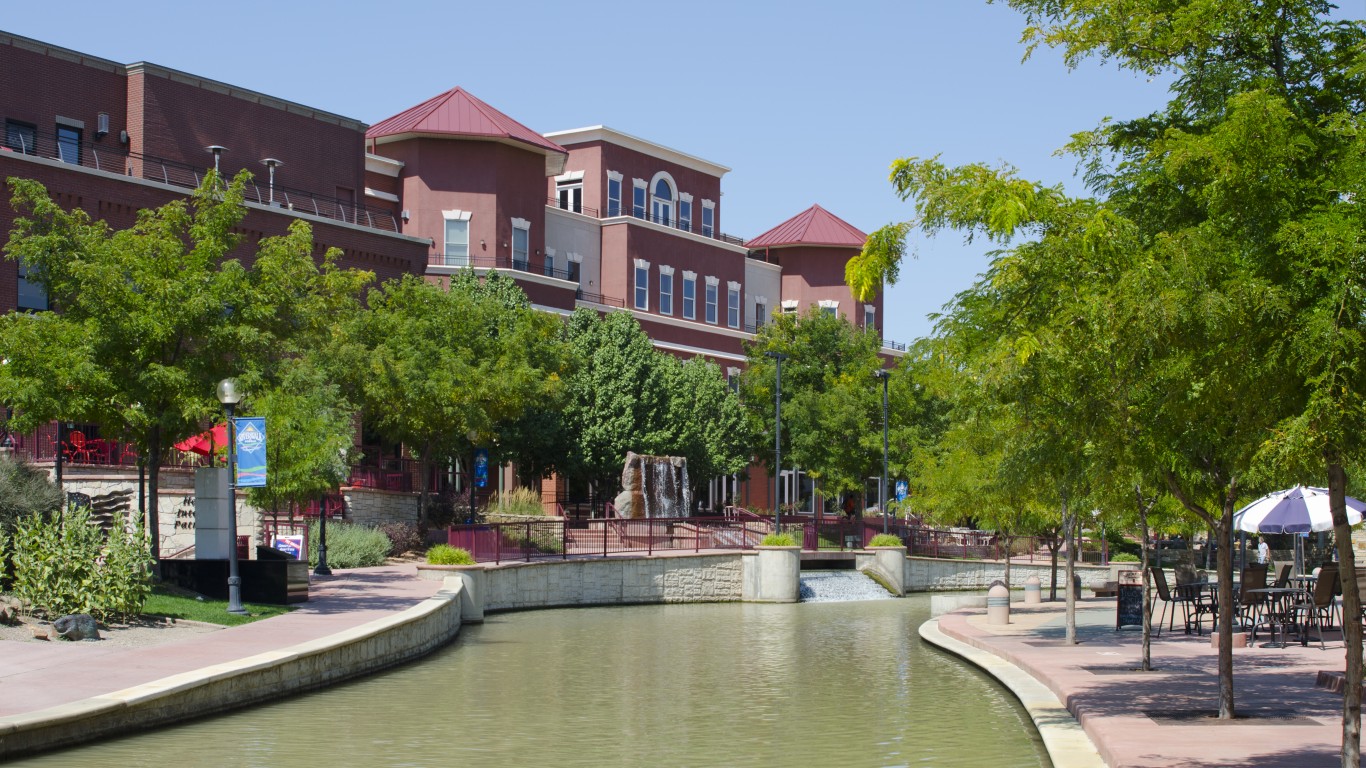
Colorado: Pueblo
> Concentrated poverty rate: 9.3% of poor pop. live in poor neighborhoods
> Overall poverty rate: 18.9% (state: 10.7%)
> Neighborhoods with concentrated poverty: 3 out of 53
> 2018 Census unemployment rate: 16.1% in poor neighborhoods; 8.1% in all other neighborhoods
Pueblo is by far the poorest metropolitan area in Colorado — and it also has the worst economic segregation of any metro area in the state. The metro area’s poverty rate of 18.9% is well above the state poverty rate of 10.7%. Of the more than 30,000 people living in poverty in the metro area, 9.3% live in communities with poverty rates of at least 40%.
Job opportunities appear scarce in Pueblo’s high poverty neighborhoods. The unemployment rate in the metro area’s poorest areas stands at 16.1%, nearly double the jobless rate in the communities with poverty rates under 40%.
[in-text-ad]
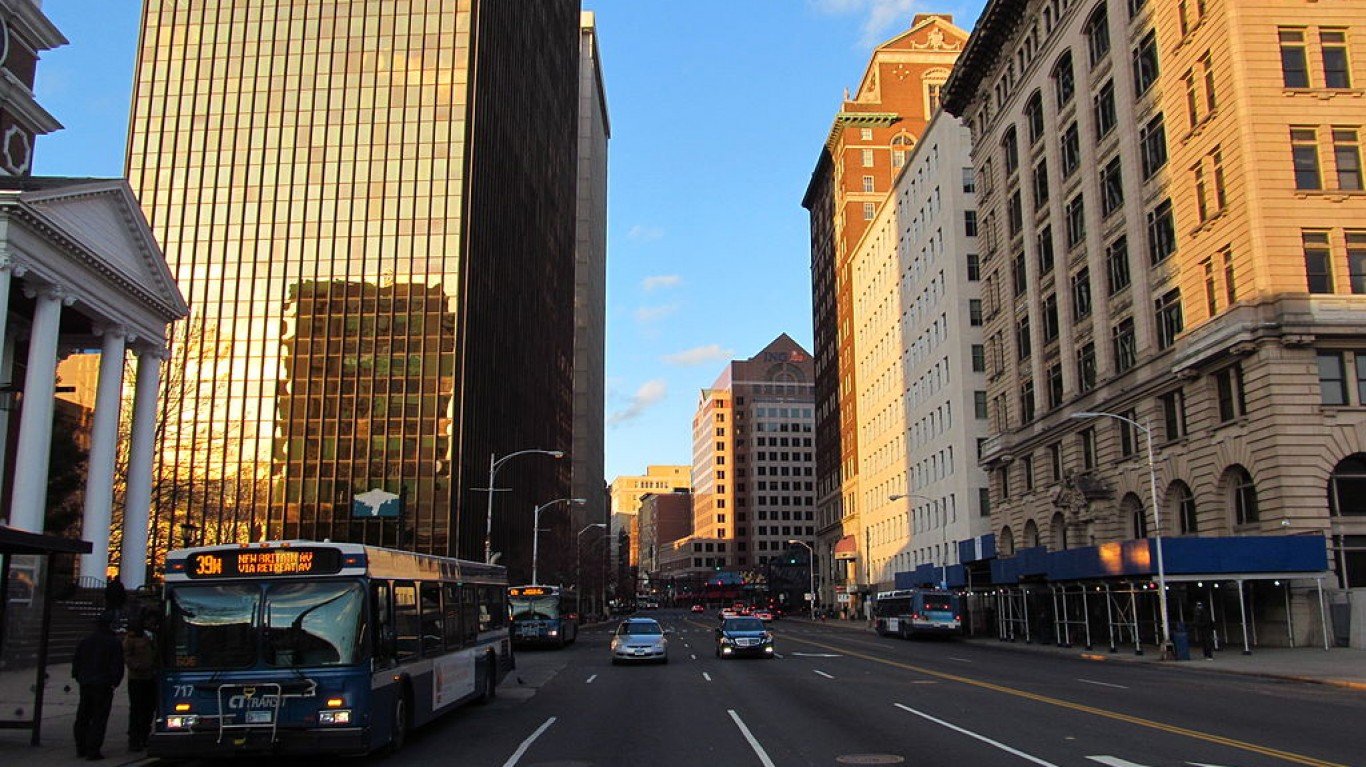
Connecticut: Hartford-West Hartford-East Hartford
> Concentrated poverty rate: 9.2% of poor pop. live in poor neighborhoods
> Overall poverty rate: 10.0% (state: 10.0%)
> Neighborhoods with concentrated poverty: 9 out of 283
> 2018 Census unemployment rate: 17.0% in poor neighborhoods; 5.9% in all other neighborhoods
Nearly one in every 10 of the 115,657 people living on poverty level income in the Hartford metro area reside in communities with poverty rates of 40% or greater. Income inequality between the metro area’s neighborhoods is high. The average annual household income in the metro area’s concentrated poverty neighborhoods is just $37,810 compared to $101,865 in all the other neighborhoods across the metro area.
[recirclink id=715247]

Delaware: No metro area with concentrated poverty
> Overall poverty rate: 11.6%
Dover is the only metro area in Delaware, and every neighborhood in the city has a poverty rate below 40%. The absence of concentrated poverty in the city is a marked improvement from a half decade ago, when the area had one Census tract of concentrated poverty, home to about 5% of the metro area’s population living in poverty. The decline in concentrated poverty in Dover may be due to an improved job market. According to the U.S. Census Bureau, unemployment in the metro area was 9.8% in 2013, well above the 5.9% rate in 2018, the most recent year of available data.
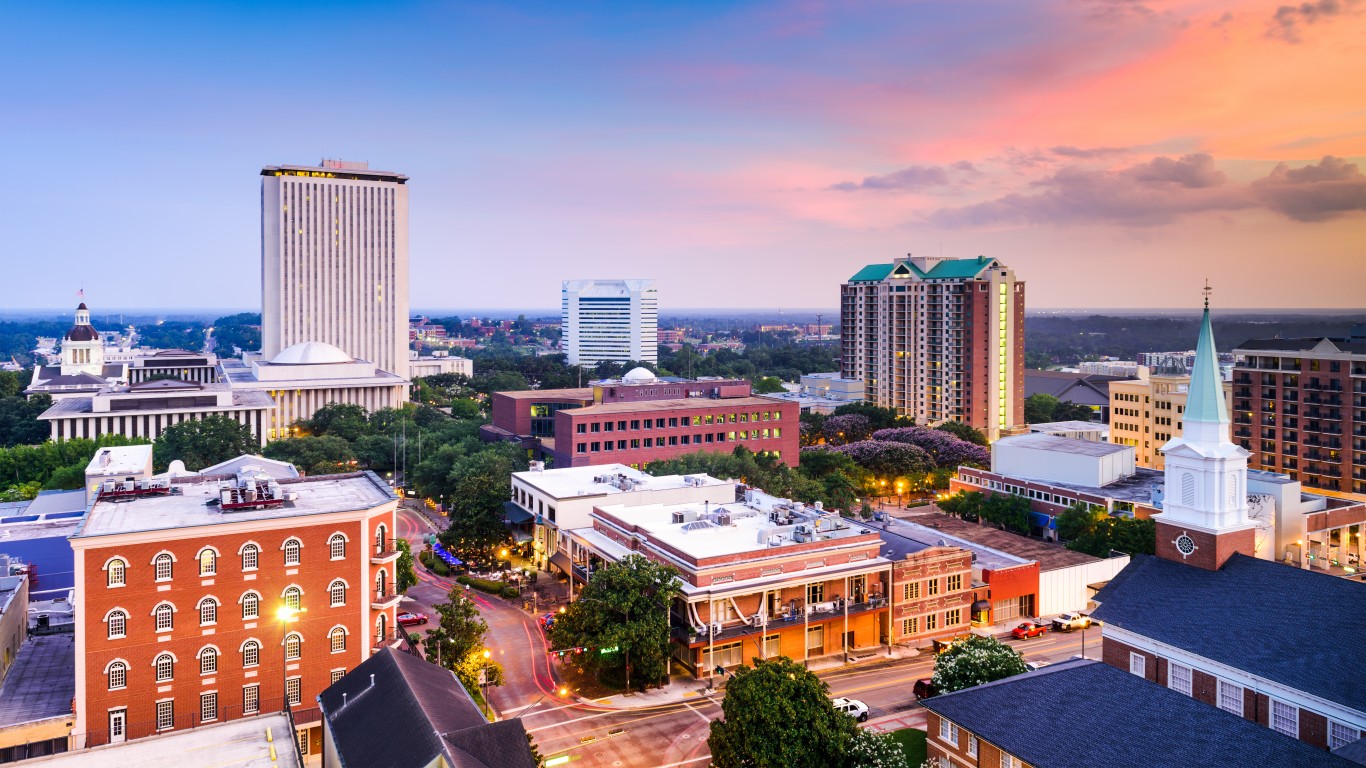
Florida: Tallahassee
> Concentrated poverty rate: 16.7% of poor pop. live in poor neighborhoods
> Overall poverty rate: 15.7% (state: 14.6%)
> Neighborhoods with concentrated poverty: 6 out of 75
> 2018 Census unemployment rate: 18.0% in poor neighborhoods; 5.9% in all other neighborhoods
There are six neighborhoods in the Tallahassee metro area in which over 40% of the population lives below the poverty line. Residents of these neighborhoods include 16.7% of the more than 50,000 metro area residents who live below the poverty line.
Incomes tend to rise with educational attainment. In the Tallahassee communities that are characterized by concentrated poverty, just 14.1% of adults have a bachelor’s degree or higher, less than half the 39.1% share of adults in neighborhoods across the metro area where the poverty rate is lower than 40%.
[in-text-ad-2]
Georgia: Albany
> Concentrated poverty rate: 38.2% of poor pop. live in poor neighborhoods
> Overall poverty rate: 25.2% (state: 15.9%)
> Neighborhoods with concentrated poverty: 9 out of 43
> 2018 Census unemployment rate: 21.4% in poor neighborhoods; 9.2% in all other neighborhoods
People living in poverty in Albany, Georgia, are far more likely to live in close proximity to others who are also living below the poverty line than poverty-level residents of most other cities. Of the 37,204 Albany residents living on poverty level incomes, 38.2% live in concentrated poverty neighborhoods.
Opportunities for upward economic mobility appear to be scarce in Albany’s poorest communities. The unemployment rate in the metro area’s nine Census tracts with poverty rates of at least 40% stands at 21.4% — more than double the 9.2% jobless rate in the rest of the city.
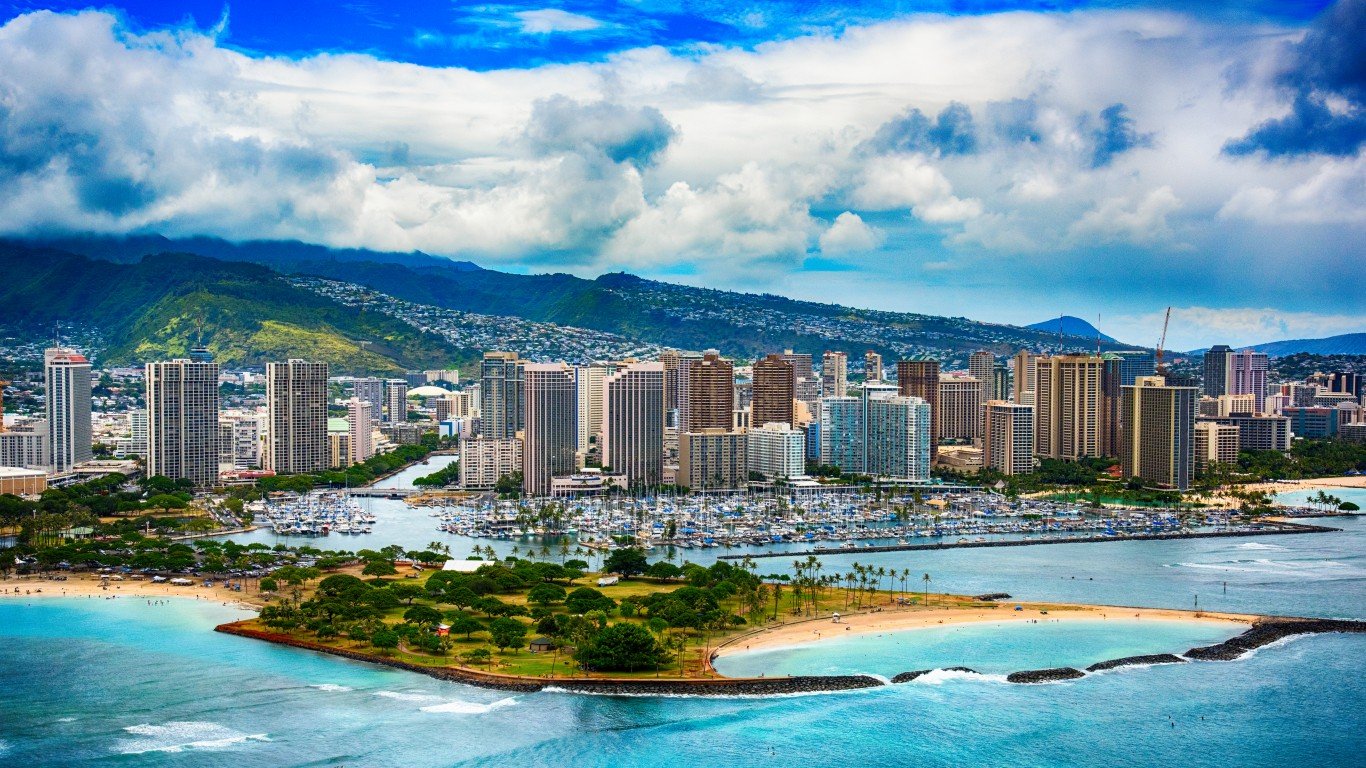
Hawaii: Urban Honolulu
> Concentrated poverty rate: 5.4% of poor pop. live in poor neighborhoods
> Overall poverty rate: 8.7% (state: 9.9%)
> Neighborhoods with concentrated poverty: 3 out of 228
> 2018 Census unemployment rate: 15.5% in poor neighborhoods; 4.2% in all other neighborhoods
Of the two metro areas in Hawaii — Urban Honolulu and Kahului-Wailuku-Lahaina — Honolulu is the only one with neighborhoods where more than 40% of residents live below the poverty line. An estimated 5.4% of the 83,131 Honolulu metro area residents who live below the poverty line live in the three poorest communities in the city.
Incomes tend to rise with educational attainment. In the Urban Honolulu communities that are characterized by concentrated poverty, just 8.8% of adults have a bachelor’s degree or higher, less than one-third of the 34.6% share of adults in the remaining neighborhoods across the metro area where less than 40% of the population lives in poverty.
[in-text-ad]
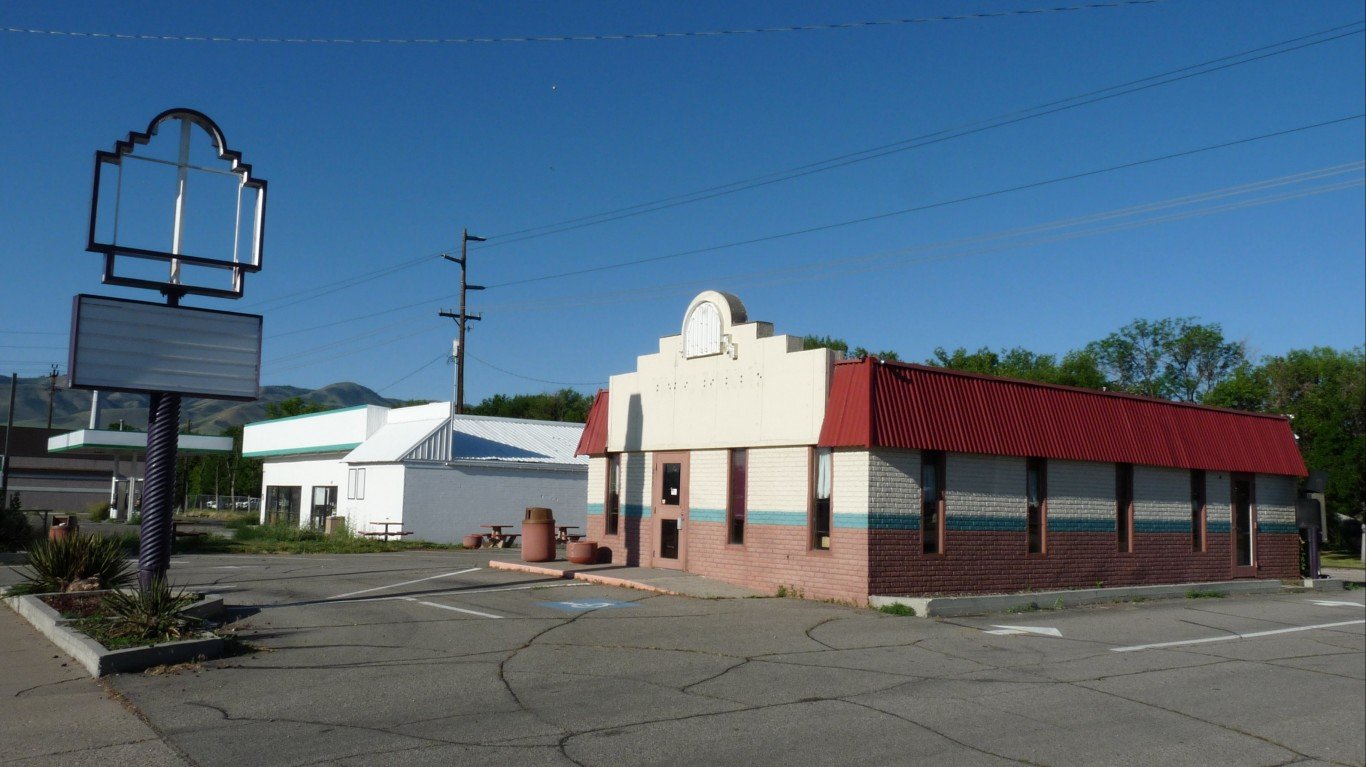
Idaho: No metro area with concentrated poverty
> State poverty rate: 13.7%
Idaho is one of a handful of states where no metro area qualifies for this list. Of the six metro areas located in the state, Pocatello is the only one with Census tracts where more than 40% of the population lives in poverty. However, Pocatello was not considered for this piece as it is home to Idaho State University, and college towns often have skewed poverty rates. In Pocatello, more than a third of the metro area’s concentrated poverty residents are college or graduate students.
Overall, poverty is not especially common in Idaho. The state’s poverty rate of 13.7% is just below the national poverty rate of 13.9%.
[recirclink id=723248]
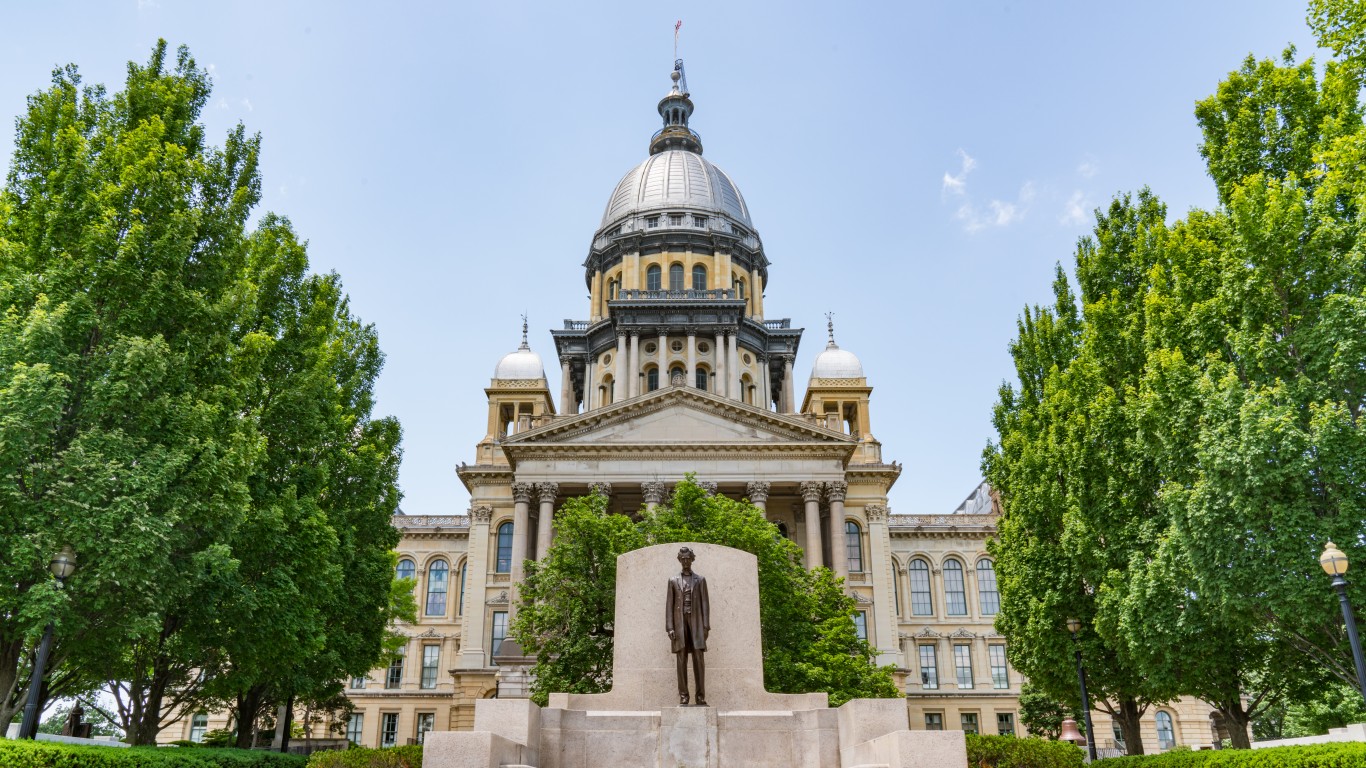
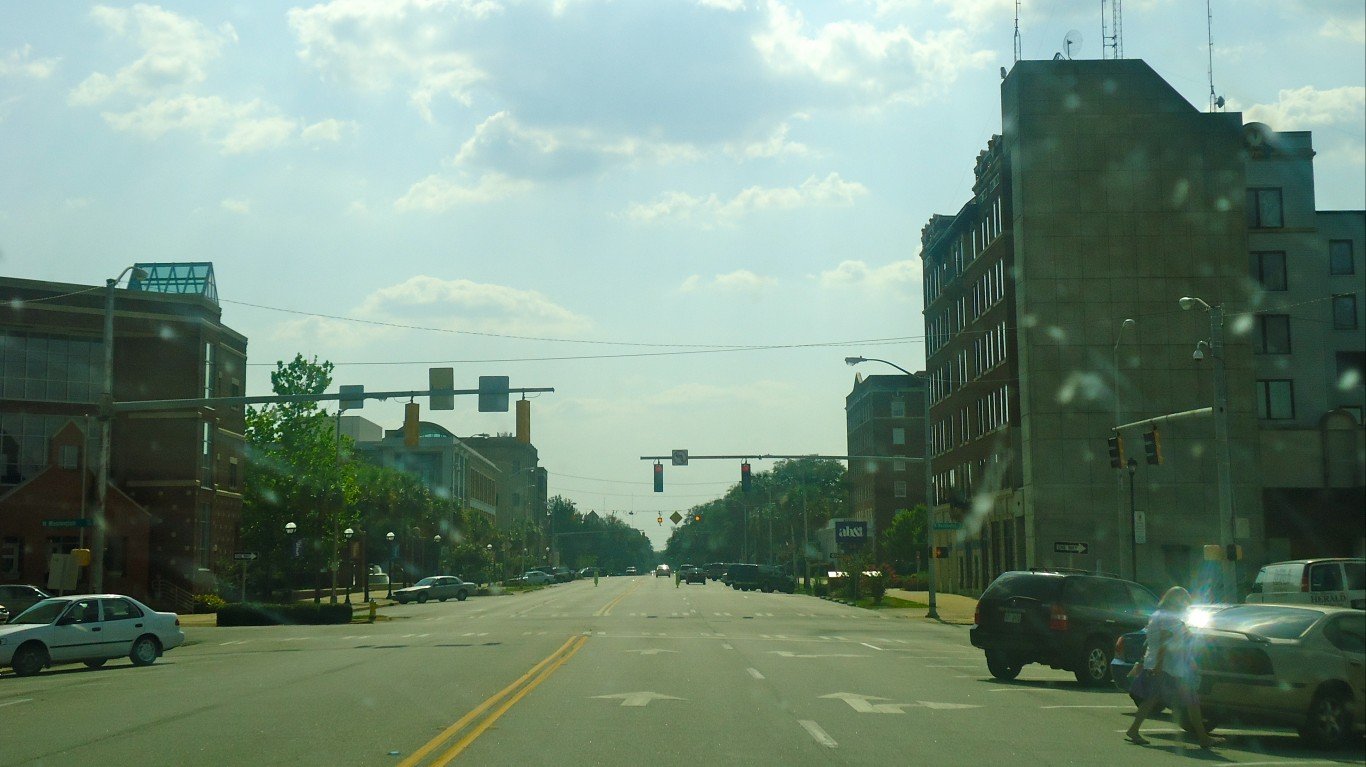
Illinois: Springfield
> Concentrated poverty rate: 23.8% of poor pop. live in poor neighborhoods
> Overall poverty rate: 14.9% (state: 12.8%)
> Neighborhoods with concentrated poverty: 7 out of 56
> 2018 Census unemployment rate: 12.3% in poor neighborhoods; 5.8% in all other neighborhoods
In Springfield, Illinois, 7,275 people live on poverty level incomes and in neighborhoods where at least 40% of residents also live below the poverty line. The 23.8% concentrated poverty rate in Springfield is the highest of any of the 10 metropolitan areas in the state.
This kind of economic segregation can make upward economic mobility more difficult for poor metro area residents living in poor communities. For example, the unemployment rate in Springfield’s concentrated poverty neighborhoods stands at 12.3%, more than double the 5.8% average unemployment rate in the other neighborhoods across the metro area.
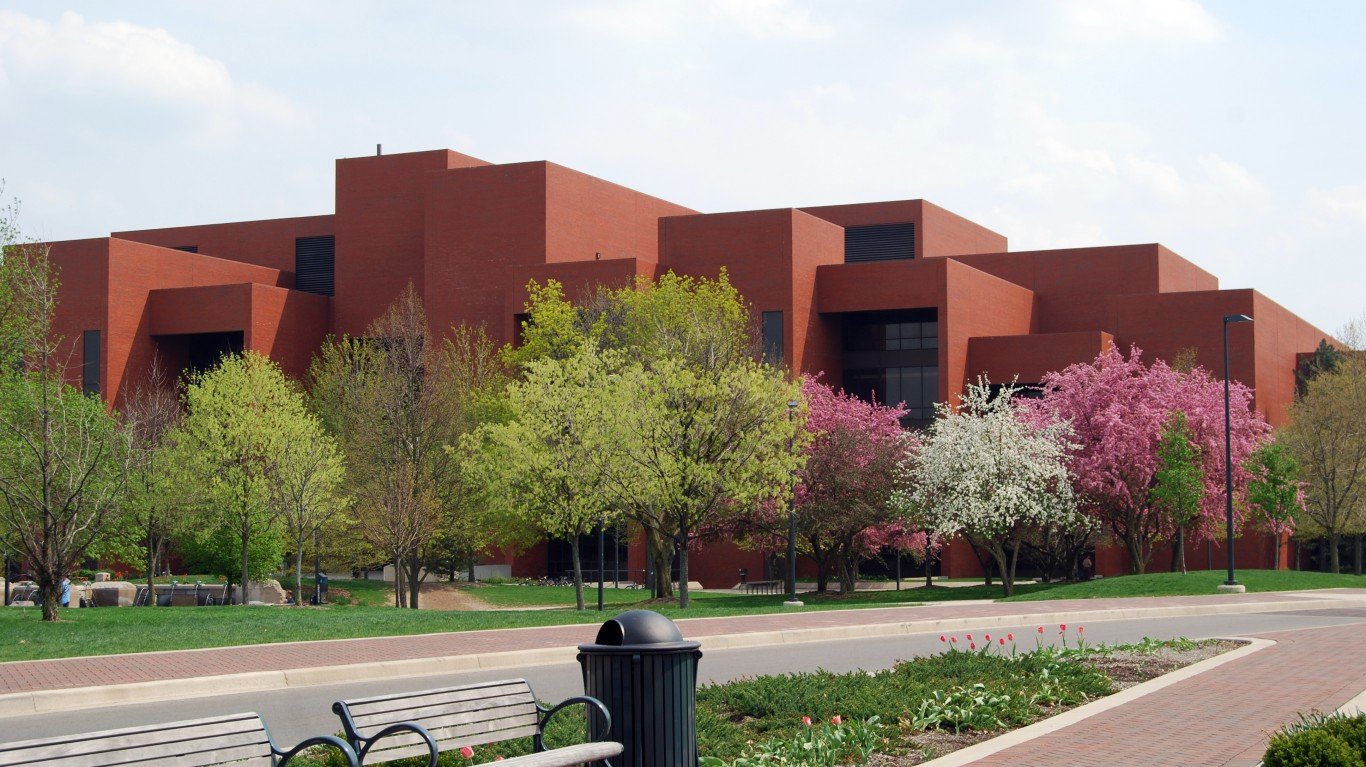
Indiana: Muncie
> Concentrated poverty rate: 29.5% of poor pop. live in poor neighborhoods
> Overall poverty rate: 18.4% (state: 13.8%)
> Neighborhoods with concentrated poverty: 6 out of 27
> 2018 Census unemployment rate: 13.0% in poor neighborhoods; 5.7% in all other neighborhoods
There are 18,353 people living below the poverty line in Muncie, Indiana, and nearly 30% of them reside in one of six local communities characterized by concentrated poverty. The metro area’s African American community is disproportionately affected by this economic segregation. Though only 6.9% of Muncie residents identify as Black, nearly one-third of residents of these low-income communities are Black.
Homeownership is one of the most practical ways to build wealth in the United States. In Muncie’s poorest neighborhoods, the homeownership rate stands at just 34.6%, less than half the comparable rate of 73.0% in the rest of the metro area.
[in-text-ad-2]
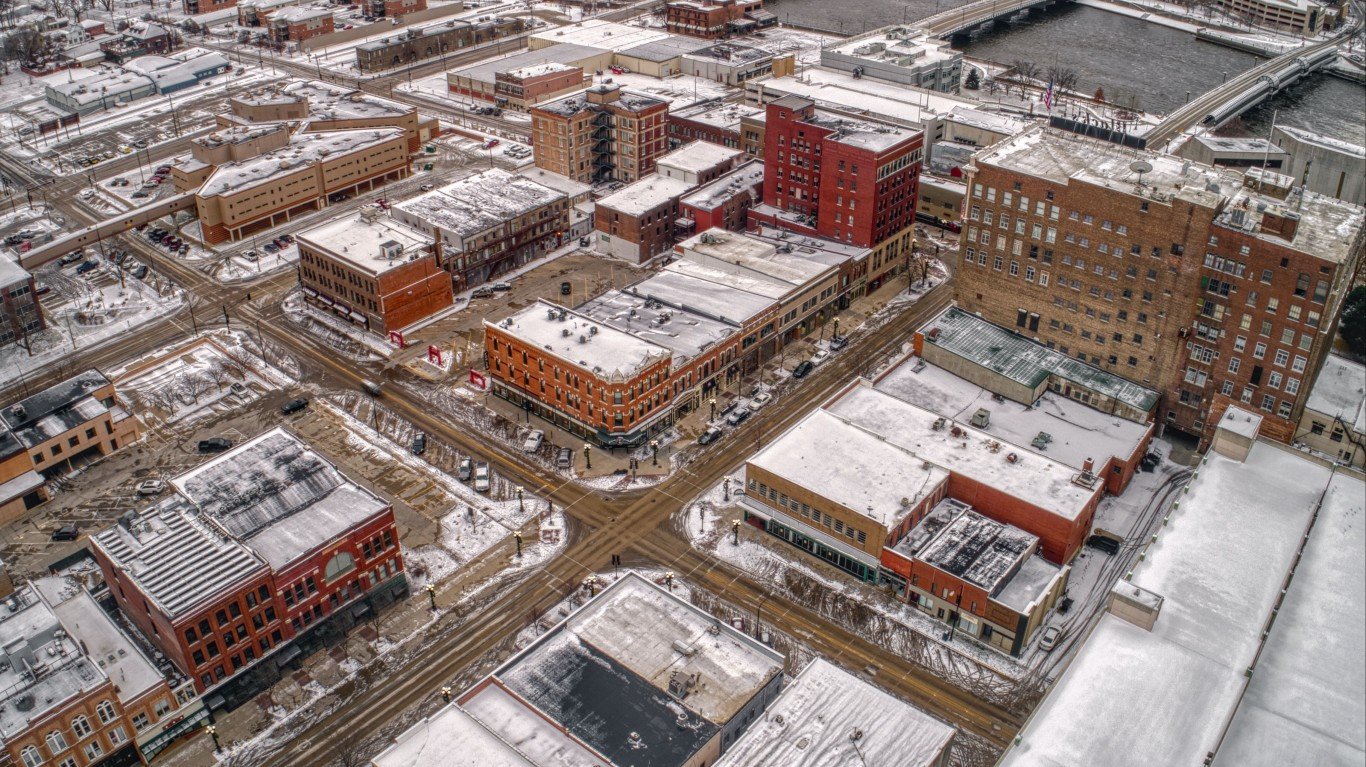
Iowa: Waterloo-Cedar Falls
> Concentrated poverty rate: 8.9% of poor pop. live in poor neighborhoods
> Overall poverty rate: 13.8% (state: 11.1%)
> Neighborhoods with concentrated poverty: 3 out of 48
> 2018 Census unemployment rate: 17.5% in poor neighborhoods; 3.6% in all other neighborhoods
Of the eight metro areas in Iowa, only Davenport, Sioux City, and Waterloo are home to Census tracts with poverty rates of at least 40%. In Waterloo, 8.9% of the population living below the poverty line resides in these concentrated poverty communities. This is higher than the concentrated poverty rate of 8.2% in Sioux City and 3.1% in Davenport.
Economic segregation in Waterloo is further evidenced by the difference in incomes between neighborhoods in the city. The average household income in the metro area’s three concentrated poverty neighborhoods is $34,814, less than half the average income of $75,095 across the city’s remaining neighborhoods.
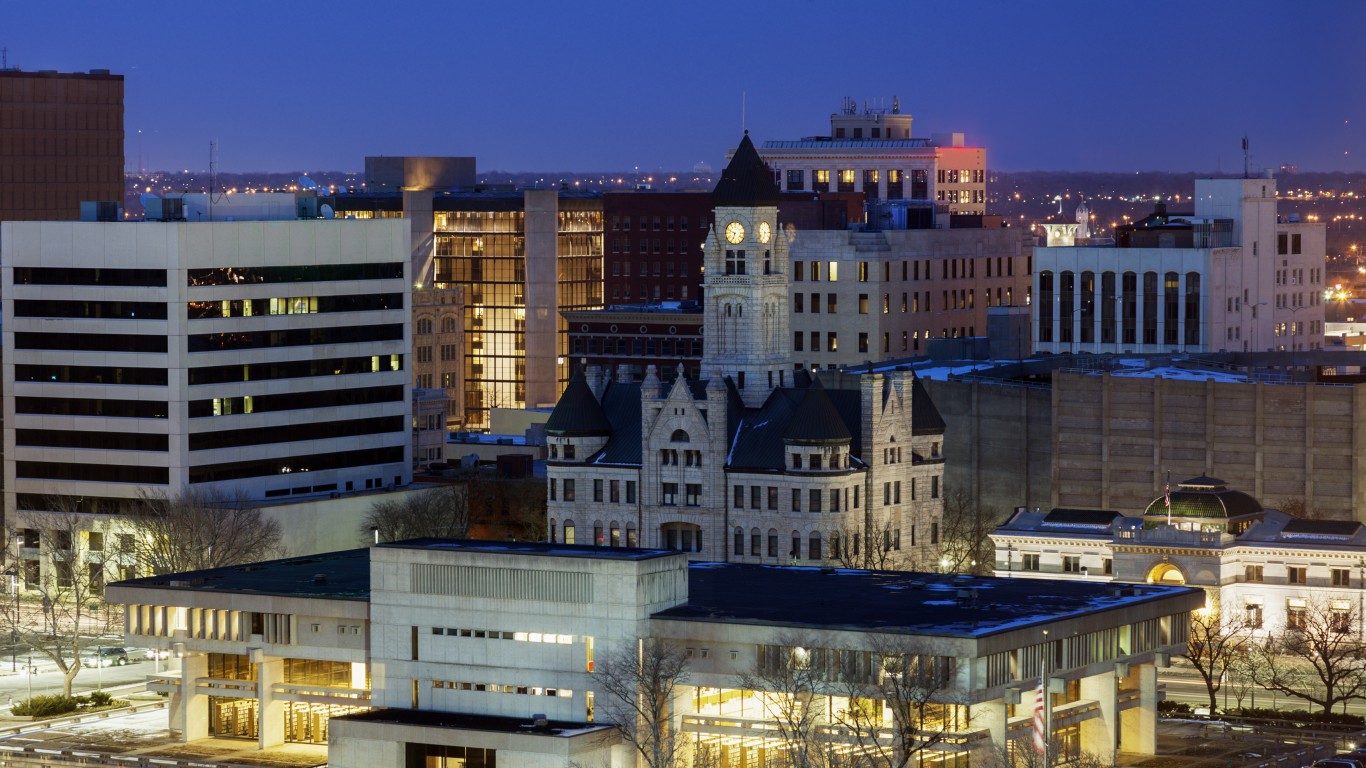
Kansas: Wichita
> Concentrated poverty rate: 7.5% of poor pop. live in poor neighborhoods
> Overall poverty rate: 13.3% (state: 12.1%)
> Neighborhoods with concentrated poverty: 5 out of 152
> 2018 Census unemployment rate: 17.6% in poor neighborhoods; 4.7% in all other neighborhoods
Of the four metro areas in Kansas, Wichita is the only one with neighborhoods with poverty rates of at least 40%. An estimated 7.5% of the 84,316 people living below the poverty line in Wichita reside in communities of concentrated poverty.
Such economic segregation can reduce opportunities for upward economic mobility for many of Wichita’s poorest residents. In the metro area’s communities characterized by concentrated poverty, the jobless rate stands at 17.6%, more than triple the 4.7% unemployment rate in the rest of the city.
[in-text-ad]
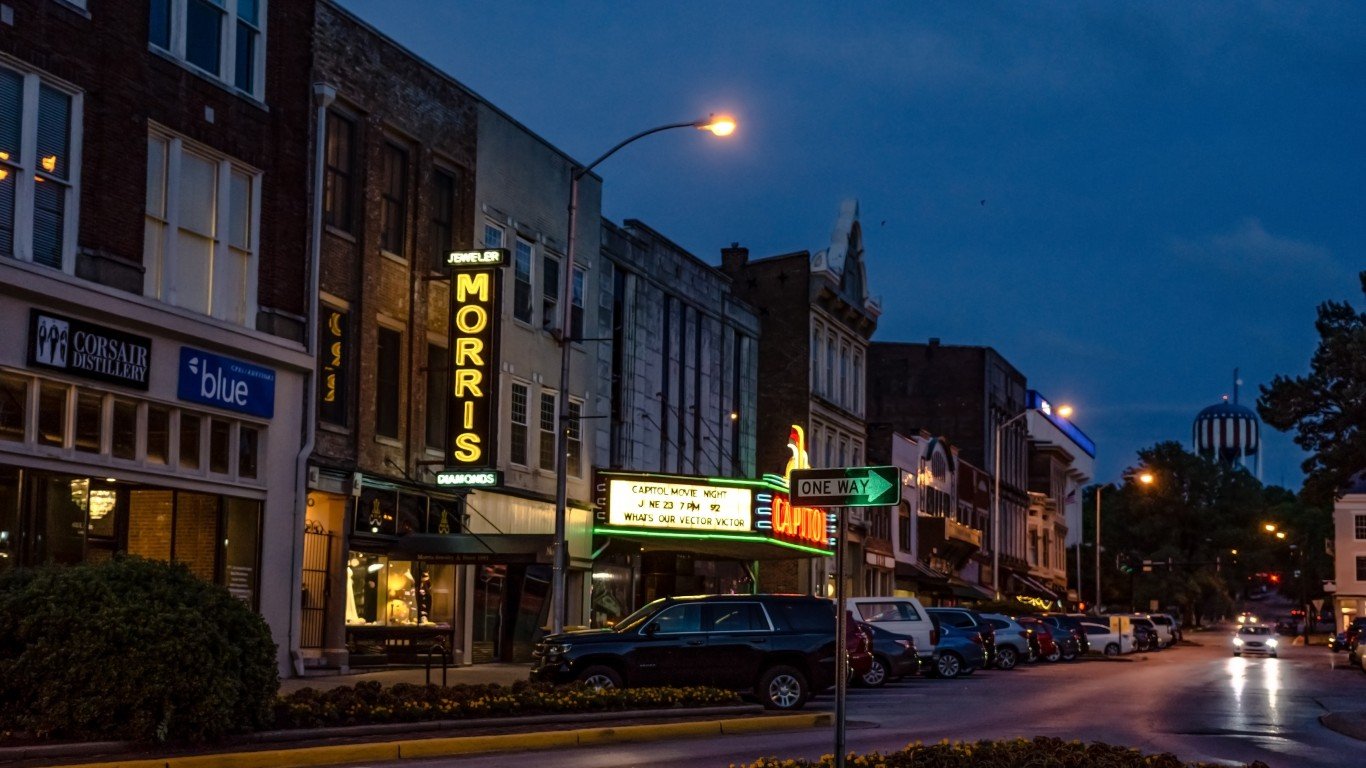
Kentucky: Bowling Green
> Concentrated poverty rate: 15.4% of poor pop. live in poor neighborhoods
> Overall poverty rate: 17.7% (state: 17.7%)
> Neighborhoods with concentrated poverty: 3 out of 37
> 2018 Census unemployment rate: 6.7% in poor neighborhoods; 4.8% in all other neighborhoods
In Bowling Green, Kentucky, there are 4,449 people who live on poverty level incomes in neighborhoods where the poverty rate is at least 40% or higher. In these concentrated-poverty neighborhoods, 29.6% of households rely on SNAP benefits (food stamps) to afford basic necessities, more than double the 12.0% of residents who rely on SNAP in the neighborhoods that make up the rest of the metro area.
Residents of extreme poverty neighborhoods in Bowling Green are also less likely to own their place of residence than those living in other parts of the city. The homeownership rate across the metro area’s three high poverty neighborhoods is 20.2% — less than one-third of the average homeownership rate of 65.8% across the other neighborhoods.
[recirclink id=723425]
Louisiana: Monroe
> Concentrated poverty rate: 34.6% of poor pop. live in poor neighborhoods
> Overall poverty rate: 23.1% (state: 19.2%)
> Neighborhoods with concentrated poverty: 10 out of 44
> 2018 Census unemployment rate: 14.9% in poor neighborhoods; 5.5% in all other neighborhoods
Monroe, Louisiana, is the poorest city in one of the poorest states. Just over 23% of the Monroe population lives below the poverty line, compared to 19.2% of the population across Louisiana — which is well above the 13.9% national poverty rate. Poverty in Monroe also tends to be highly concentrated with more than one-third of the metro area’s nearly 39,000 residents living on poverty level income concentrated in 10 neighborhoods with poverty rates of at least 40%.
This concentrated financial hardship in some of Monroe’s neighborhoods means many residents in these communities depend on government assistance to afford basic necessities. In the city’s concentrated poverty neighborhoods, 42.0% of households receive SNAP benefits, compared to 12.2% of households in the rest of the metro area.
Maine: Bangor
> Concentrated poverty rate: 19.8% of poor pop. live in poor neighborhoods
> Overall poverty rate: 15.4% (state: 12.4%)
> Neighborhoods with concentrated poverty: 2 out of 45
> 2018 Census unemployment rate: 8.8% in poor neighborhoods; 5.1% in all other neighborhoods
About one in every five of the more than 22,000 Bangor residents living below the poverty line live in communities with poverty rates of 40% or higher. As is typically the case, joblessness is far more common in poorer neighborhoods in Bangor than it is in parts of the city where residents are less likely to be struggling financially. As of 2018, the unemployment rate in Bangor’s concentrated poverty neighborhoods stood at 8.8%, well above the 5.1% rate in the rest of the metro area.
[in-text-ad-2]

Maryland: Baltimore-Columbia-Towson
> Concentrated poverty rate: 8.1% of poor pop. live in poor neighborhoods
> Overall poverty rate: 10.4% (state: 9.4%)
> Neighborhoods with concentrated poverty: 22 out of 668
> 2018 Census unemployment rate: 15.6% in poor neighborhoods; 5.4% in all other neighborhoods
Of the 668 Census tracts home to at least 500 people in the Baltimore metro area, there are 22 in which at least 40% of residents live below the poverty line. The extremely poor neighborhoods are home to 8.1% of the more than quarter million metro area residents who live on poverty level incomes. In such an environment, climbing out of poverty is especially challenging.
Employment opportunities tend to be scarce in poor areas. In Baltimore’s concentrated poverty neighborhoods, the 2018 unemployment rate is 15.6%, nearly triple the comparable 5.4% rate in the rest of the metro area.

Massachusetts: Springfield
> Concentrated poverty rate: 27.4% of poor pop. live in poor neighborhoods
> Overall poverty rate: 16.2% (state: 10.6%)
> Neighborhoods with concentrated poverty: 16 out of 133
> 2018 Census unemployment rate: 16.2% in poor neighborhoods; 5.7% in all other neighborhoods
Economic segregation is worse in Springfield than in every other metro area in Massachusetts. More than one in every four residents living below the poverty line reside in neighborhoods with poverty rates of 40% or higher. The metro area’s Hispanic and Latino residents are disproportionately housed in these disadvantaged neighborhoods. Though only about 20% of the metro area population identifies as Hispanic or Latino, a little over 70% of residents in concentrated poverty neighborhoods are Hispanic or Latino.
[in-text-ad]
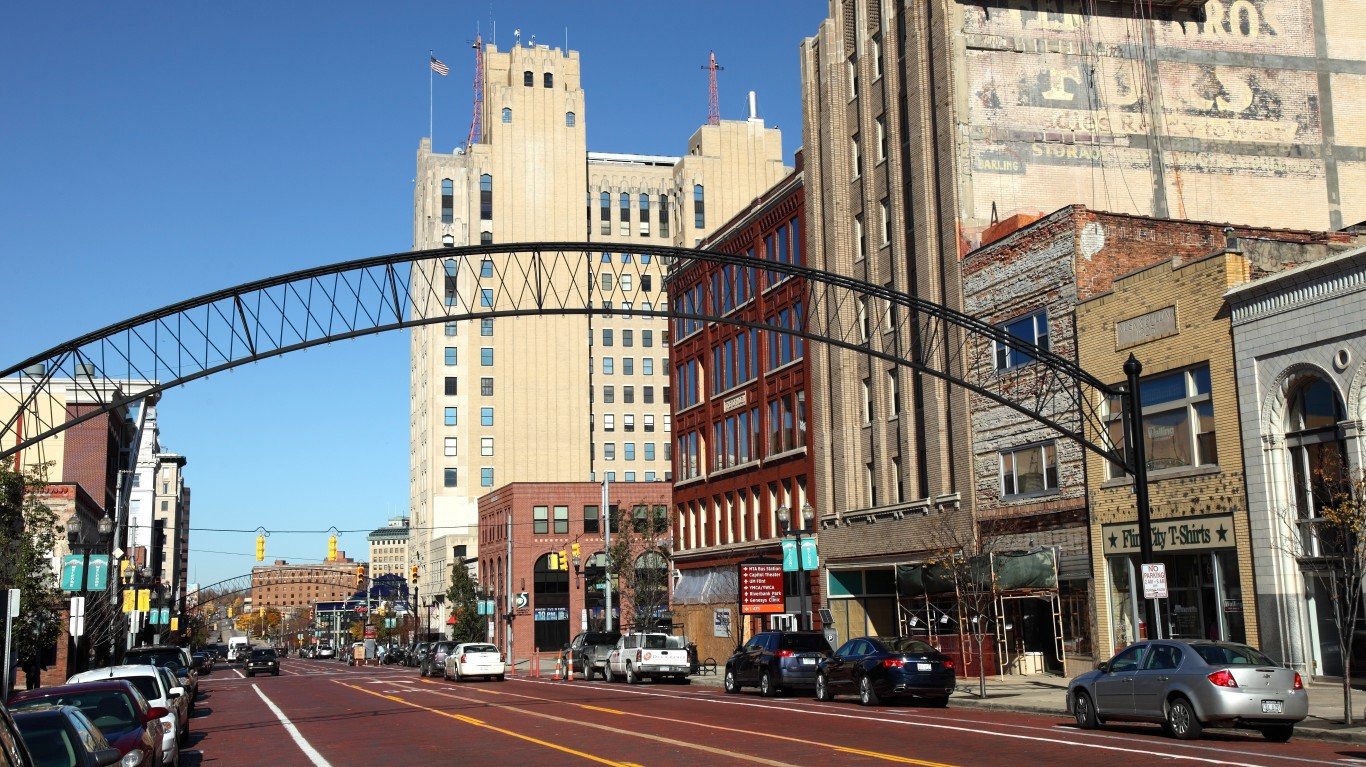
Michigan: Flint
> Concentrated poverty rate: 33.6% of poor pop. live in poor neighborhoods
> Overall poverty rate: 19.8% (state: 14.6%)
> Neighborhoods with concentrated poverty: 22 out of 129
> 2018 Census unemployment rate: 22.7% in poor neighborhoods; 8.1% in all other neighborhoods
More than one-third of the Flint population living below the poverty line resides in neighborhoods with poverty rates of 40% or higher — a higher concentrated poverty rate than any other metro area in the state and one of the highest nationwide. Economic opportunity is lacking in Flint’s poorest neighborhoods as more than 22.7% of the labor force in these areas is unemployed, compared to a jobless rate of 8.1% in the rest of the metro area.
The difference in incomes between high-poverty neighborhoods and the rest of the city is further evidence of the economic segregation in Flint. Across the 22 neighborhoods in the metro area with concentrated poverty, the average annual household income is a little under $35,000 compared to income of over $68,000 in the metro area’s remaining neighborhoods.
[recirclink id=714364]
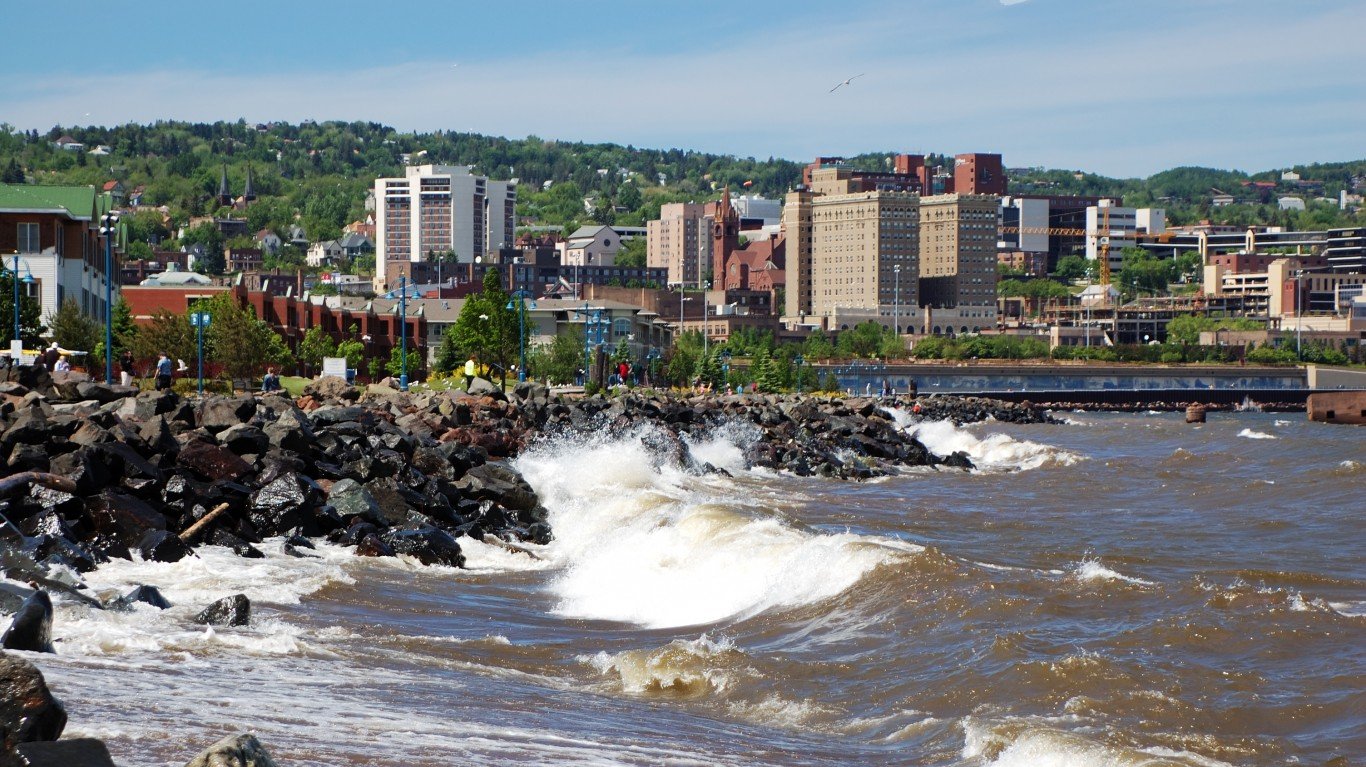
Minnesota: Duluth
> Concentrated poverty rate: 13.9% of poor pop. live in poor neighborhoods
> Overall poverty rate: 14.1% (state: 9.9%)
> Neighborhoods with concentrated poverty: 6 out of 84
> 2018 Census unemployment rate: 6.4% in poor neighborhoods; 4.4% in all other neighborhoods
Duluth’s concentrated poverty rate of 13.9% is below the concentrated poverty rate in Minnesota’s metro areas of Mankato and St. Cloud. However, those two metro areas are home to Minnesota State University and St. Cloud State University — and their concentrated poverty neighborhoods are, in large part, consist of college and university students, meaning economic disadvantages are not likely as severe as the data would suggest. Controlling for student populations, Duluth ranks as the city hit hardest by extreme poverty in Minnesota.
With a poverty rate of 14.1%, Duluth is also the poorest metro area in Minnesota. In the poorest neighborhoods in the metro area, 27.1% of households rely on SNAP benefits to afford basic necessities, more than double the 9.8% SNAP recipiency rate in the neighborhoods across the city with poverty rates below 40%.
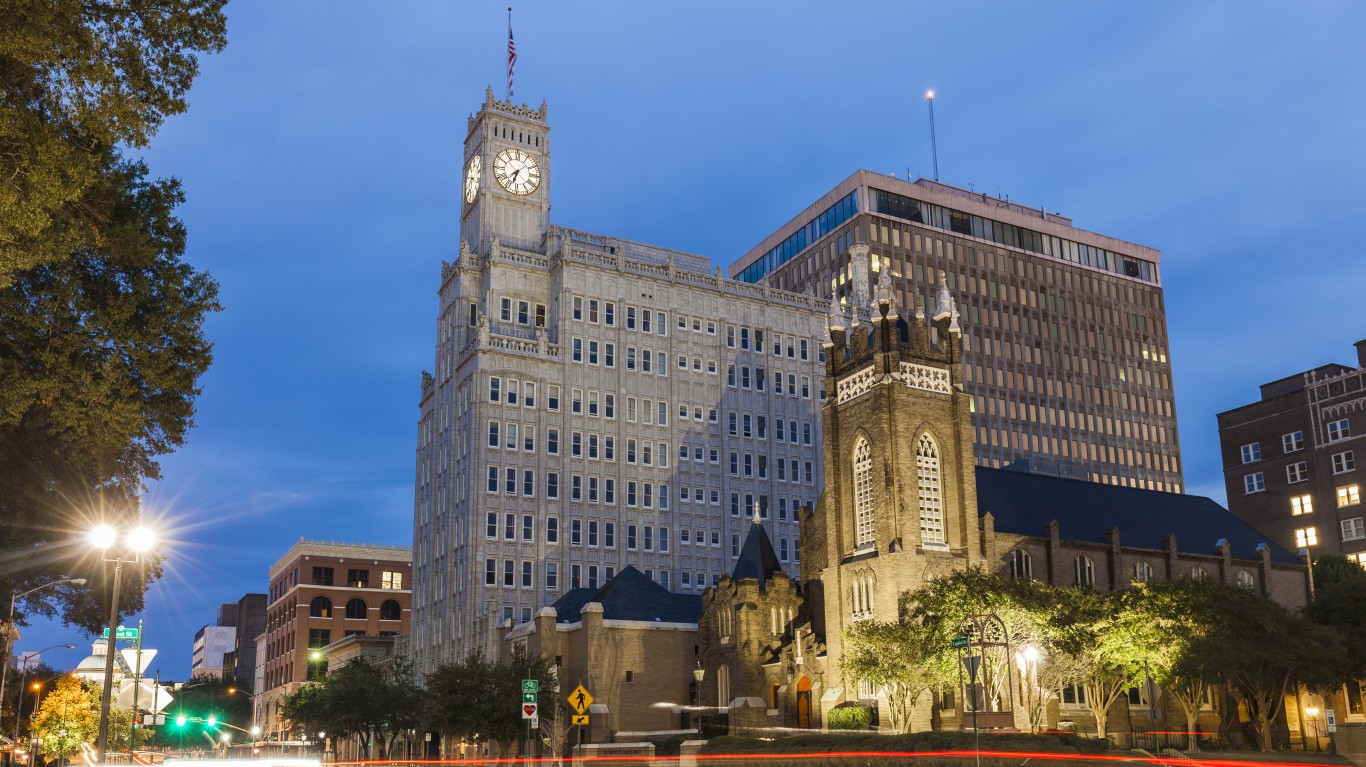
Mississippi: Jackson
> Concentrated poverty rate: 24.4% of poor pop. live in poor neighborhoods
> Overall poverty rate: 17.1% (state: 20.7%)
> Neighborhoods with concentrated poverty: 17 out of 127
> 2018 Census unemployment rate: 19.3% in poor neighborhoods; 6.3% in all other neighborhoods
In Jackson, 24.4% of residents living below the poverty line reside in neighborhoods where at least 40% of the population also lives in poverty — making it the worst metro area for concentrated poverty in Mississippi. As is often the case in the metro areas on this list, minority populations are disproportionately housed in economically disadvantaged neighborhoods. Though only 48.8% of Jackson’s population is Black, nearly 90% of residents in concentrated poverty neighborhoods in the metro area are Black.
[in-text-ad-2]
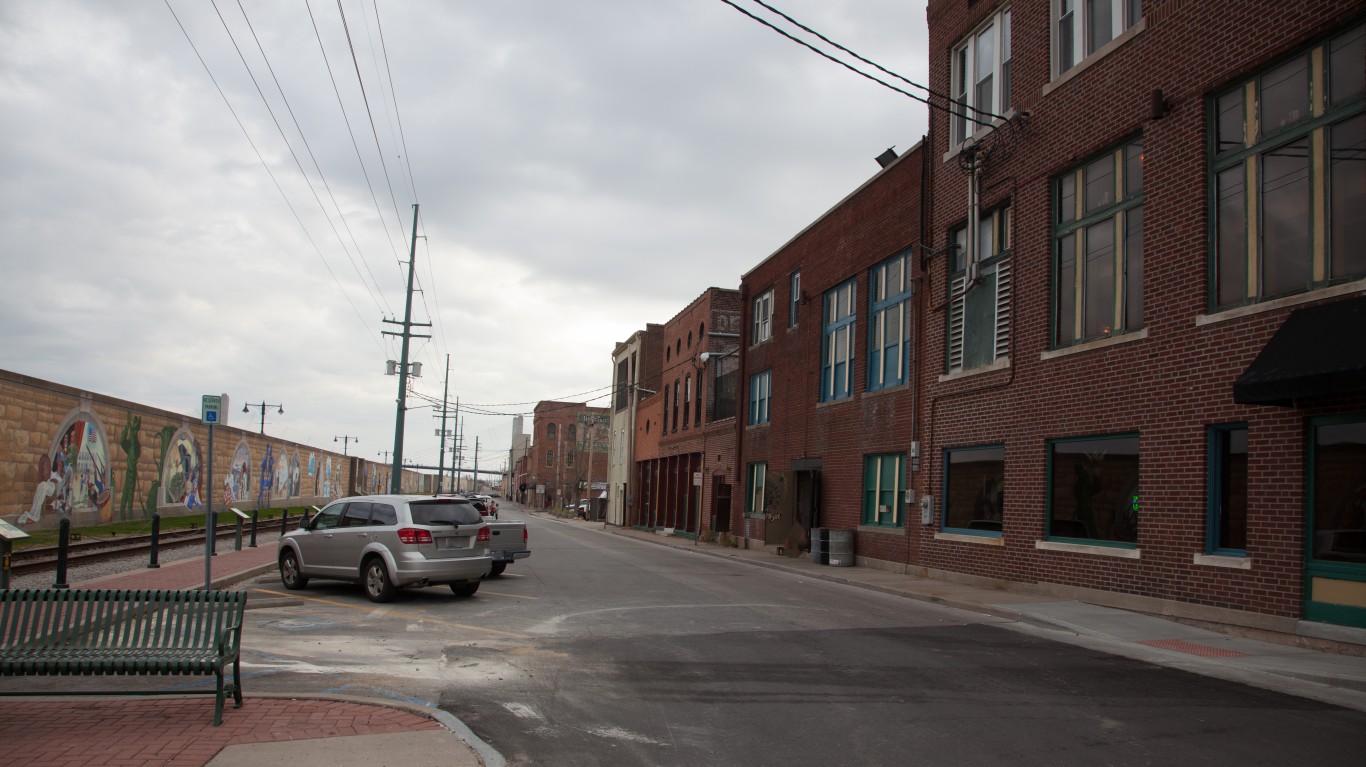
Missouri: Cape Girardeau
> Concentrated poverty rate: 27.8% of poor pop. live in poor neighborhoods
> Overall poverty rate: 17.5% (state: 14.0%)
> Neighborhoods with concentrated poverty: 4 out of 22
> 2018 Census unemployment rate: 9.8% in poor neighborhoods; 4.5% in all other neighborhoods
Cape Girardeau has the worst concentrated poverty in Missouri and some of the worst of any metro area nationwide. Nearly 28% of the more than 16,000 metro area residents earning poverty level incomes reside in neighborhoods where at least 40% of the population also lives in poverty.
In the poorest neighborhoods of Cape Girardeau, the 2018 unemployment rate is 9.8%, more than double the 4.5% jobless rate in the rest of the metro area.

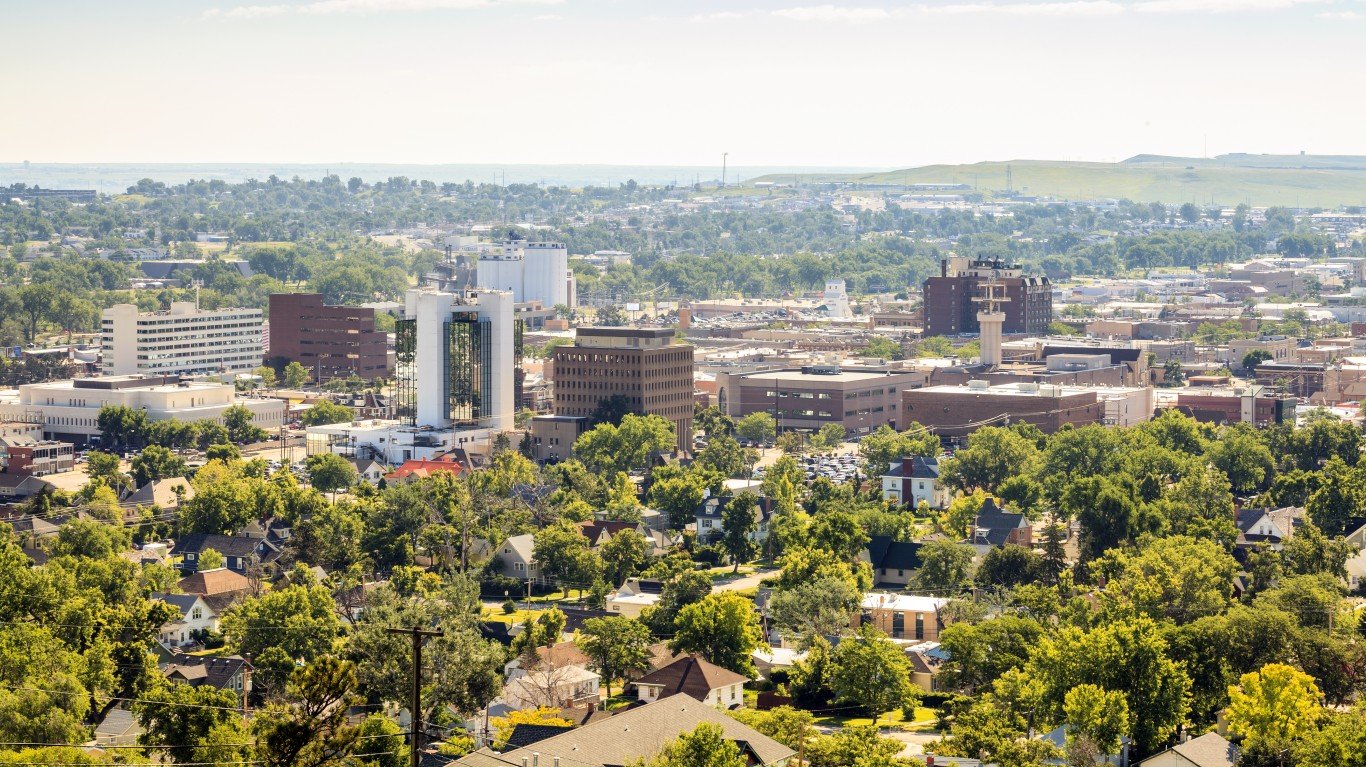
Montana: No metro area with concentrated poverty
> State poverty rate: 13.5%
None of Montana’s three metro areas — Billings, Great Falls, and Missoula — have a single neighborhood with a poverty rate of 40% or higher. In each of these cities, the poverty rate is inline with, or lower than, the 13.9% national poverty rate. As recently as 2013, both Great Falls and Missoula each had one high poverty neighborhood and concentrated poverty rates of 11.0% and 5.7% respectively. However, in the years since, economic conditions appear to have improved considerably in both metro areas as unemployment fell from 6.2% in 2013 to 4.2% in 2018 in Great Falls and from 9.4% to 4.1% in Missoula over the same five year period.
[in-text-ad]
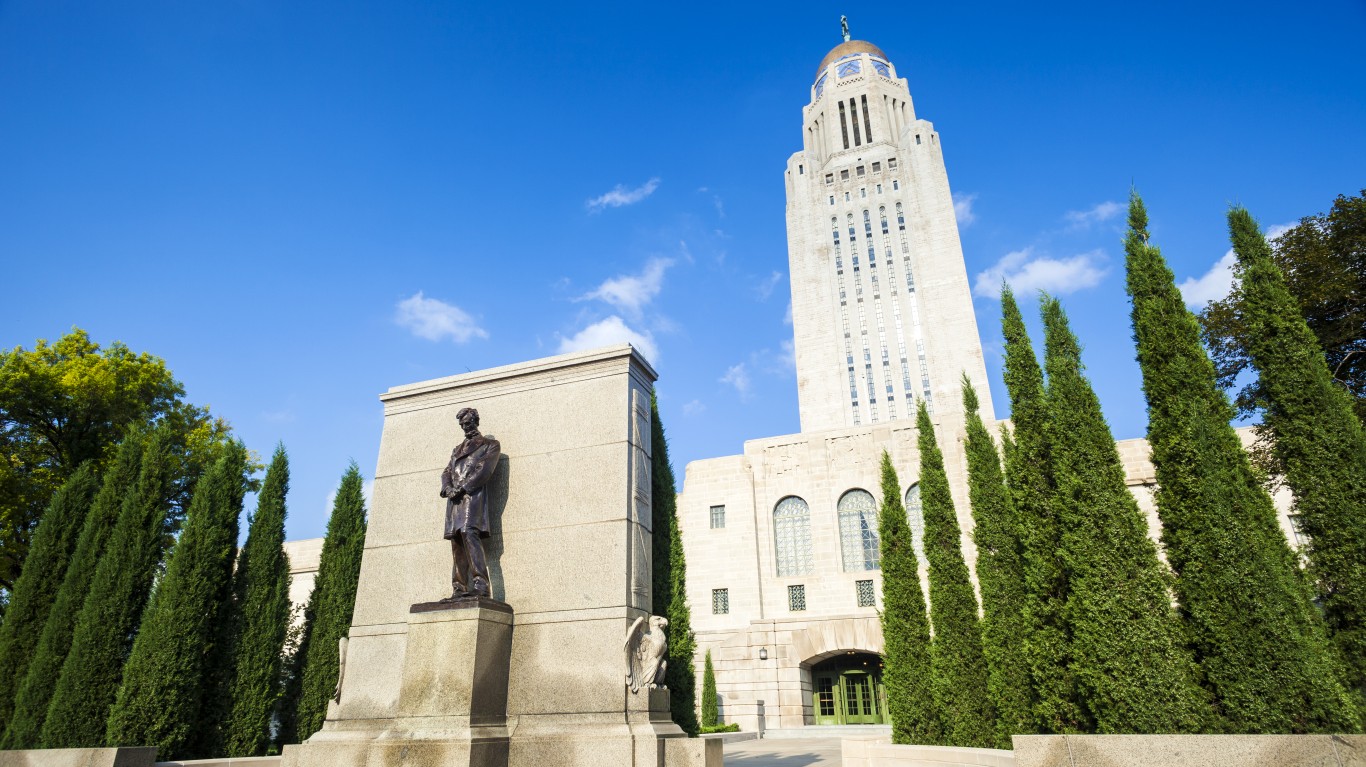
Nebraska: Lincoln
> Concentrated poverty rate: 14.4% of poor pop. live in poor neighborhoods
> Overall poverty rate: 12.4% (state: 11.5%)
> Neighborhoods with concentrated poverty: 4 out of 73
> 2018 Census unemployment rate: 6.1% in poor neighborhoods; 2.8% in all other neighborhoods
Lincoln’s 14.4% concentrated poverty rate is the highest of any metro area in Nebraska. Financial hardship in Lincoln’s concentrated poverty neighborhoods is further evidenced by the share of residents dependent on government assistance. The SNAP recipiency rate in the metro area’s four concentrated poverty neighborhoods stands at 24.1%. Meanwhile, across the rest of the capital city metro area, just 7.3% of households receive SNAP benefits.
[recirclink id=715247]

Nevada: Las Vegas-Henderson-Paradise
> Concentrated poverty rate: 5.1% of poor pop. live in poor neighborhoods
> Overall poverty rate: 14.1% (state: 13.7%)
> Neighborhoods with concentrated poverty: 10 out of 487
> 2018 Census unemployment rate: 13.6% in poor neighborhoods; 7.2% in all other neighborhoods
Of the three metro areas in Nevada — Carson City, Las Vegas, and Reno — Las Vegas is the only one with neighborhoods where poverty rates are 40% or higher. A little over 5% of the nearly 300,000 Las Vegas metropolitan area residents living in poverty are in concentrated poverty neighborhoods, where barriers to upward economic mobility are often higher than normal.
For example, members of the labor force in high poverty neighborhoods in Las Vegas are nearly twice as likely to be unemployed than those in other parts of the city. Additionally, more than one in every three adults in high poverty neighborhoods in Las Vegas have not finished high school, compared to just 14% of adults in the city’s other, less economically challenged areas.
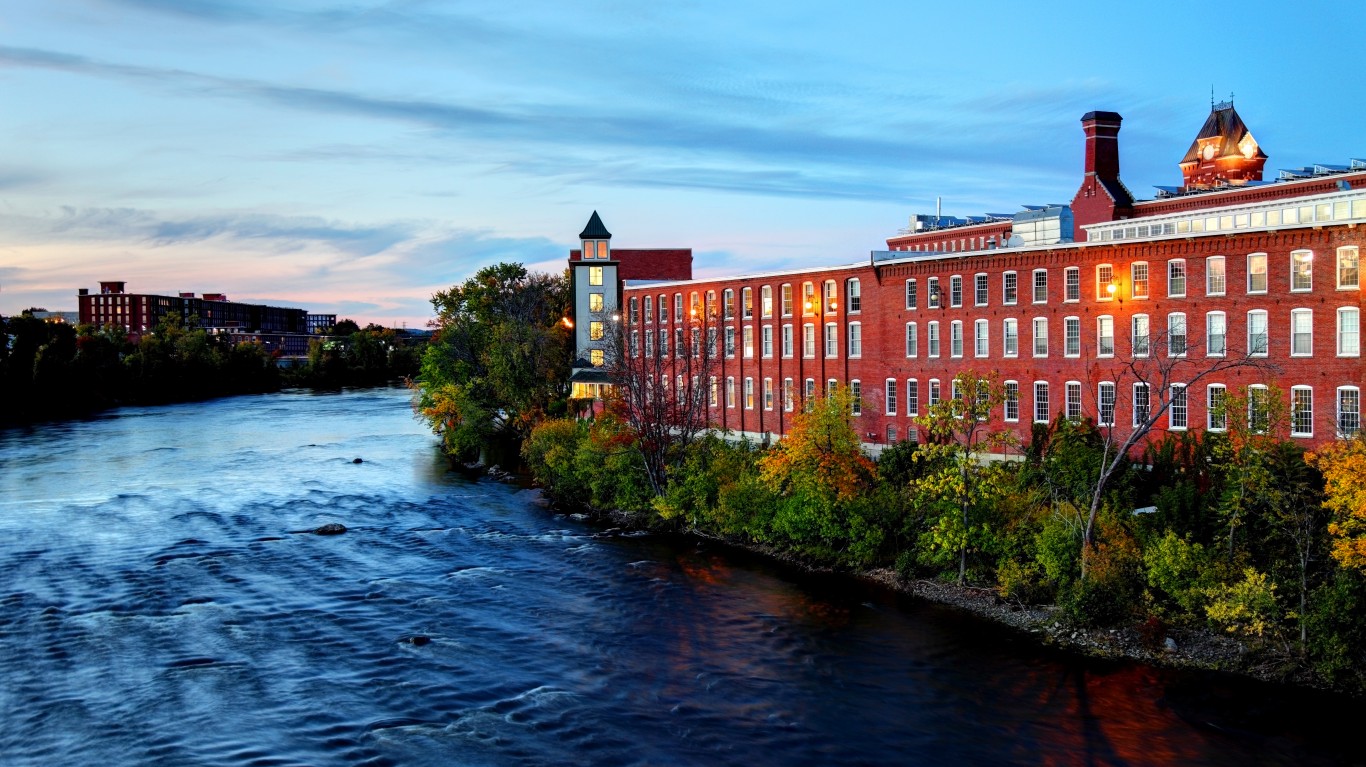
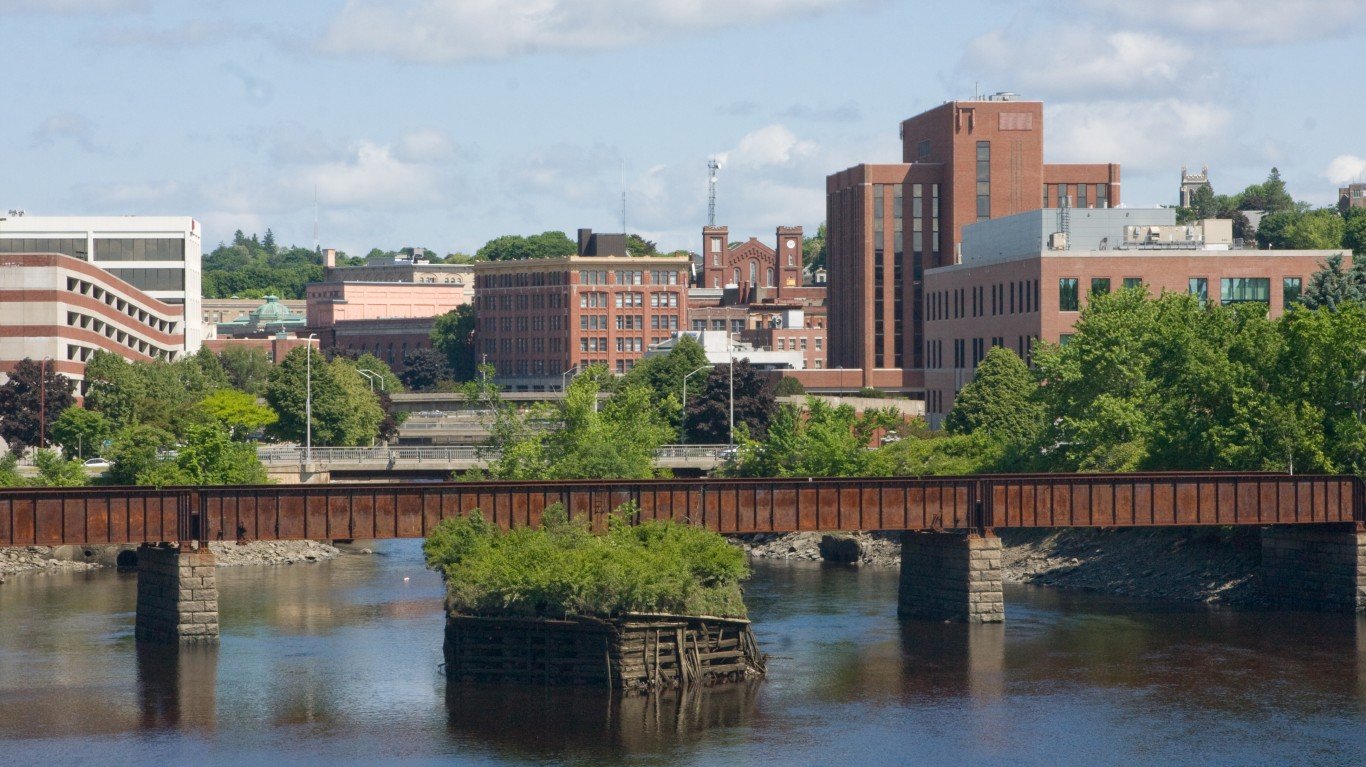
New Hampshire: Manchester-Nashua
> Concentrated poverty rate: 2.9% of poor pop. live in poor neighborhoods
> Overall poverty rate: 8.1% (state: 7.7%)
> Neighborhoods with concentrated poverty: 1 out of 85
> 2018 Census unemployment rate: 10.1% in poor neighborhoods; 4.3% in all other neighborhoods
Manchester is the only metro area in New Hampshire and ranks as having the worst concentrated poverty in the state by default. There is one neighborhood in the city characterized by concentrated poverty, and it is home to 2.9% of the metro area’s 32,560 residents who live below the poverty line. Economic opportunity tends to be scarce in high-poverty communities. Members of the labor force living in Manchester’s poorest neighborhood are more than twice as likely to be unemployed as those in the rest of the metro area.
[in-text-ad-2]

New Jersey: Trenton
> Concentrated poverty rate: 17.2% of poor pop. live in poor neighborhoods
> Overall poverty rate: 11.4% (state: 10.4%)
> Neighborhoods with concentrated poverty: 5 out of 75
> 2018 Census unemployment rate: 18.8% in poor neighborhoods; 6.3% in all other neighborhoods
In Trenton, New Jersey, 39,741 people live in poverty — and 17.2% of them also reside in concentrated poverty neighborhoods where upward economic mobility is especially difficult.
Economic segregation in Trenton is highlighted by disparity in income from neighborhood to neighborhood. Across the metro area’s concentrated poverty neighborhoods, the average annual household income is just $36,121 — a fraction of the average income of $118,989 in the rest of the city.
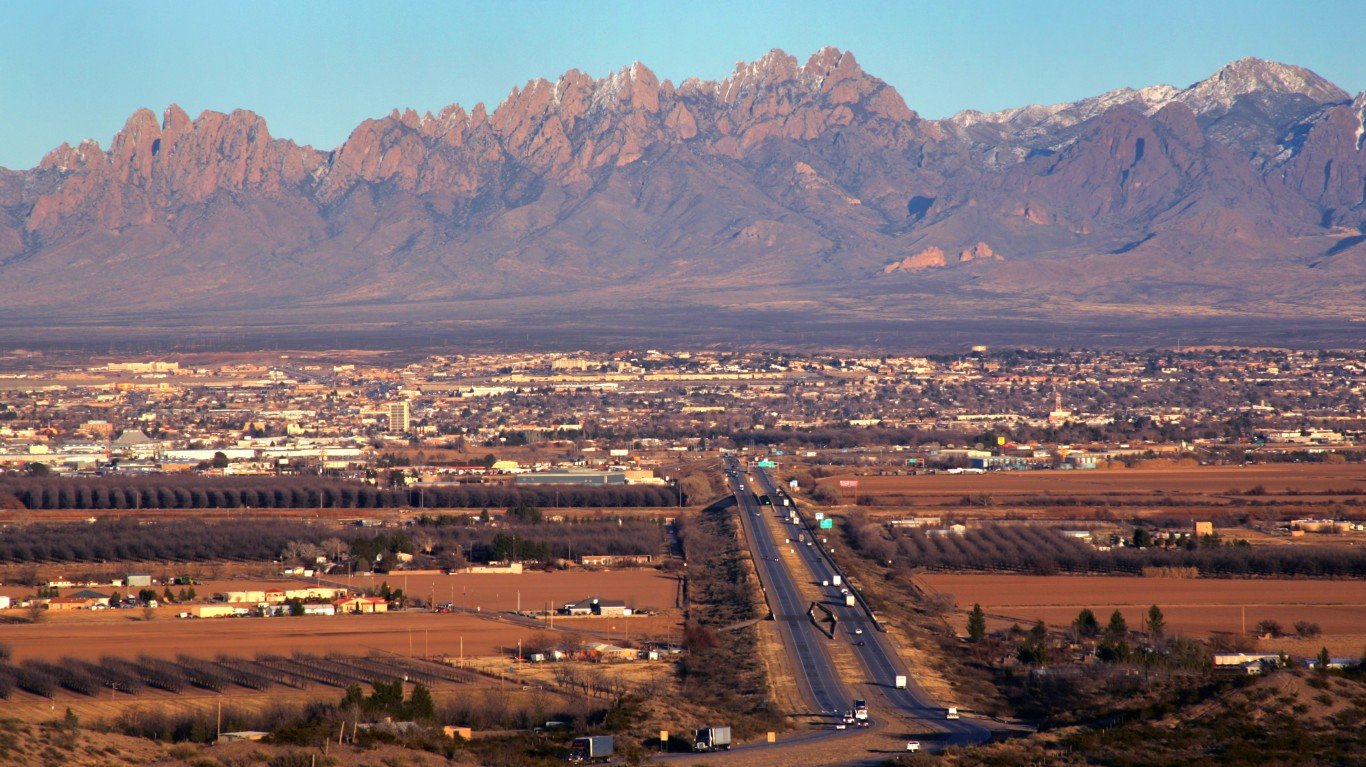
New Mexico: Las Cruces
> Concentrated poverty rate: 25.8% of poor pop. live in poor neighborhoods
> Overall poverty rate: 27.5% (state: 19.8%)
> Neighborhoods with concentrated poverty: 6 out of 40
> 2018 Census unemployment rate: 12.9% in poor neighborhoods; 7.1% in all other neighborhoods
Las Cruces is the poorest metro area in New Mexico and one of the poorest in the United States. The city’s 27.5% poverty rate is well above both the state and national poverty rates of 19.8% and 13.9%, respectively. Those living in poverty in Las Cruces are also far more likely than most Americans living in poverty to be economically segregated from more prosperous neighborhoods. More than one in every four of the 57,456 Las Cruces residents living in poverty reside in neighborhoods with poverty rates of at least 40%.
[in-text-ad]
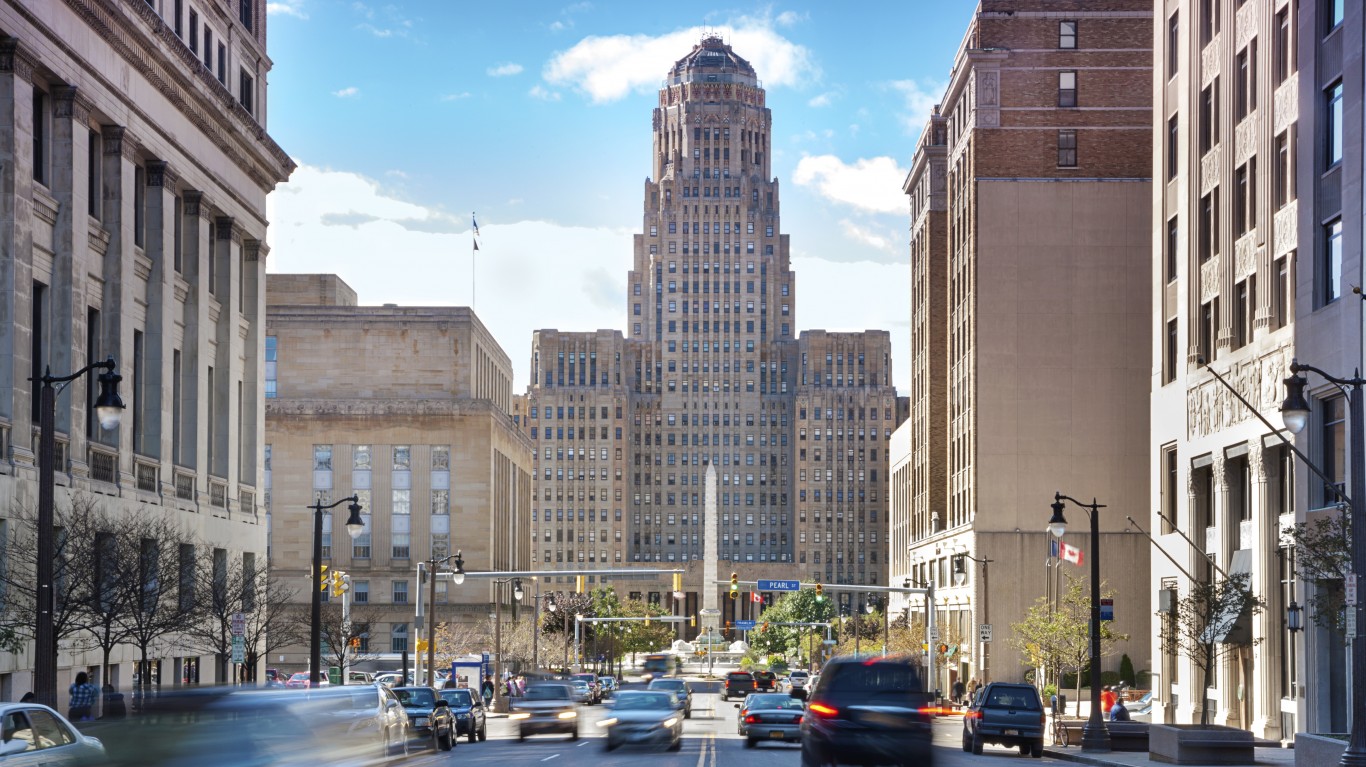
New York: Buffalo-Cheektowaga-Niagara Falls
> Concentrated poverty rate: 23.4% of poor pop. live in poor neighborhoods
> Overall poverty rate: 14.2% (state: 14.6%)
> Neighborhoods with concentrated poverty: 26 out of 291
> 2018 Census unemployment rate: 9.5% in poor neighborhoods; 4.6% in all other neighborhoods
The 14.2% poverty rate in the Buffalo metropolitan area is slightly below the 14.6% poverty rate across all of New York state. While residents of Buffalo, Cheektowaga, and Niagara Falls are less likely to live below the poverty line than most New Yorkers, those who do are more likely to be segregated into predominantly poor communities. Of all people living below the poverty line in the Buffalo metro area, 23.4% also live concentrated-poverty neighborhoods — the largest share of any of the dozen metro areas across the state.
In Buffalo, minority populations disproportionately reside in concentrated poverty neighborhoods. Just 11.8% of metro area residents are Black and just 4.8% are Hispanic or Latino. In the 26 metro area neighborhoods with poverty rates of 40% or higher, 37.6% of residents are Black and 19.6% are Hispanic or Latino.
[recirclink id=723248]
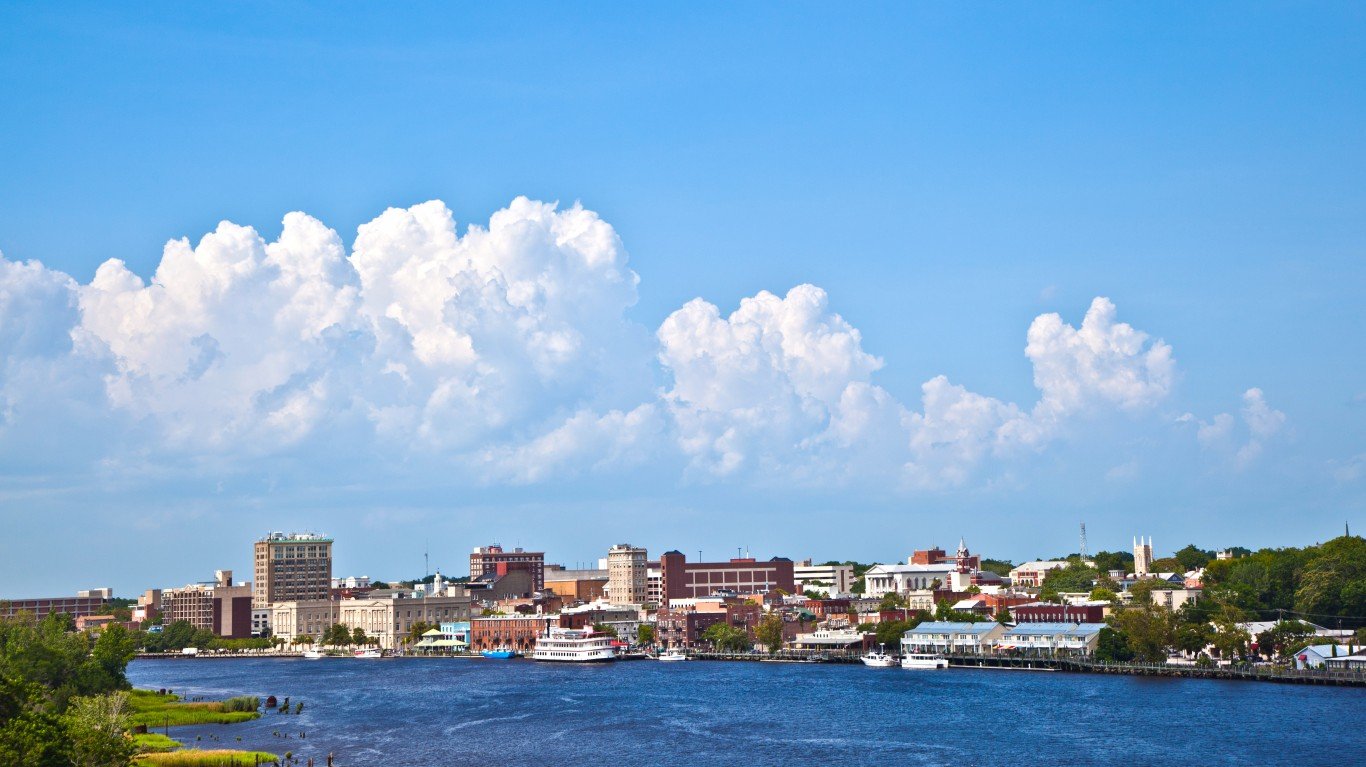
North Carolina: Wilmington
> Concentrated poverty rate: 13.2% of poor pop. live in poor neighborhoods
> Overall poverty rate: 16.4% (state: 15.3%)
> Neighborhoods with concentrated poverty: 4 out of 56
> 2018 Census unemployment rate: 10.9% in poor neighborhoods; 5.9% in all other neighborhoods
In Wilmington, North Carolina, 13.2% of the population who lives below the poverty line resides in concentrated poverty neighborhoods. Climbing out of poverty can be far more difficult for those living in economically disadvantaged communities, in part because of the relative lack of employment opportunities. Unemployment in Wimington’s poorest neighborhoods stands at 10.9%, well above the jobless rate of 5.9% in the rest of the metro area.

North Dakota: No metro area with concentrated poverty
> State poverty rate: 10.5%
None of the three metro areas in North Dakota — Bismarck, Fargo, and Grand Forks — have any neighborhoods with poverty rates of 40% or higher. As recently as 2013, both Bismarck and Fargo each had one neighborhood of concentrated poverty. However, in the years since, the unemployment rate in both cities improved — from 3.2% in 2013 to 2.5% in 2018 in Bismarck and from 4.1% to 2.6% over the same period in Fargo. Over the same five-year stretch, the overall poverty rate in Bismarck fell from 9.5% to 9.3% and in Fargo, from 11.9% to 10.0%.
[in-text-ad-2]
Ohio: Toledo
> Concentrated poverty rate: 29.0% of poor pop. live in poor neighborhoods
> Overall poverty rate: 16.9% (state: 14.3%)
> Neighborhoods with concentrated poverty: 27 out of 161
> 2018 Census unemployment rate: 15.7% in poor neighborhoods; 5.6% in all other neighborhoods
Toledo is the most economically segregated city in Ohio. Of the nearly 100,000 metro area residents living below the poverty line, 29.0% reside in concentrated poverty neighborhoods. Climbing out of poverty is likely far more difficult in Toledo’s poorest communities as the unemployment rate is nearly three times higher in areas of concentrated poverty than in the other parts of the metro area.
Minority groups make up a disproportionately large share of the population in Toledo’s economically disadvantaged neighborhoods. Though Toledo is only 13.9% Black, 42.0% of the population in the metro area’s high poverty neighborhoods is Black.

Oklahoma: Lawton
> Concentrated poverty rate: 15.3% of poor pop. live in poor neighborhoods
> Overall poverty rate: 15.5% (state: 15.8%)
> Neighborhoods with concentrated poverty: 3 out of 33
> 2018 Census unemployment rate: 14.1% in poor neighborhoods; 7.1% in all other neighborhoods
With a poverty rate of 15.5%, Lawton is the poorest metro area in Oklahoma. It is also the most economically segregated metro area in the state, as 15.3% of residents who live below the poverty line live in neighborhoods of concentrated poverty. The kinds of problems associated with poverty can be compounded by living in a largely poor neighborhood, and for many living in these neighborhoods, climbing out of poverty is especially difficult. For example, labor force participants who live in Lawton’s concentrated poverty neighborhoods are about twice as likely as those in other parts of the metro area to be unemployed.
[in-text-ad]

Oregon: Medford
> Concentrated poverty rate: 2.7% of poor pop. live in poor neighborhoods
> Overall poverty rate: 16.3% (state: 13.8%)
> Neighborhoods with concentrated poverty: 1 out of 41
> 2018 Census unemployment rate: 15.9% in poor neighborhoods; 6.4% in all other neighborhoods
There are 34,519 people living below the poverty line in Medford, Oregon, and about 3% of them reside in a community characterized by concentrated poverty. As is often the case in the metro areas on this list, the job market in Medford’s poorest area is suffering tremendously. Nearly 16% of labor force participants living in concentrated poverty in Medford are unemployed, well more than double the 6.4% jobless rate in the rest of the metro area.
[recirclink id=723425]
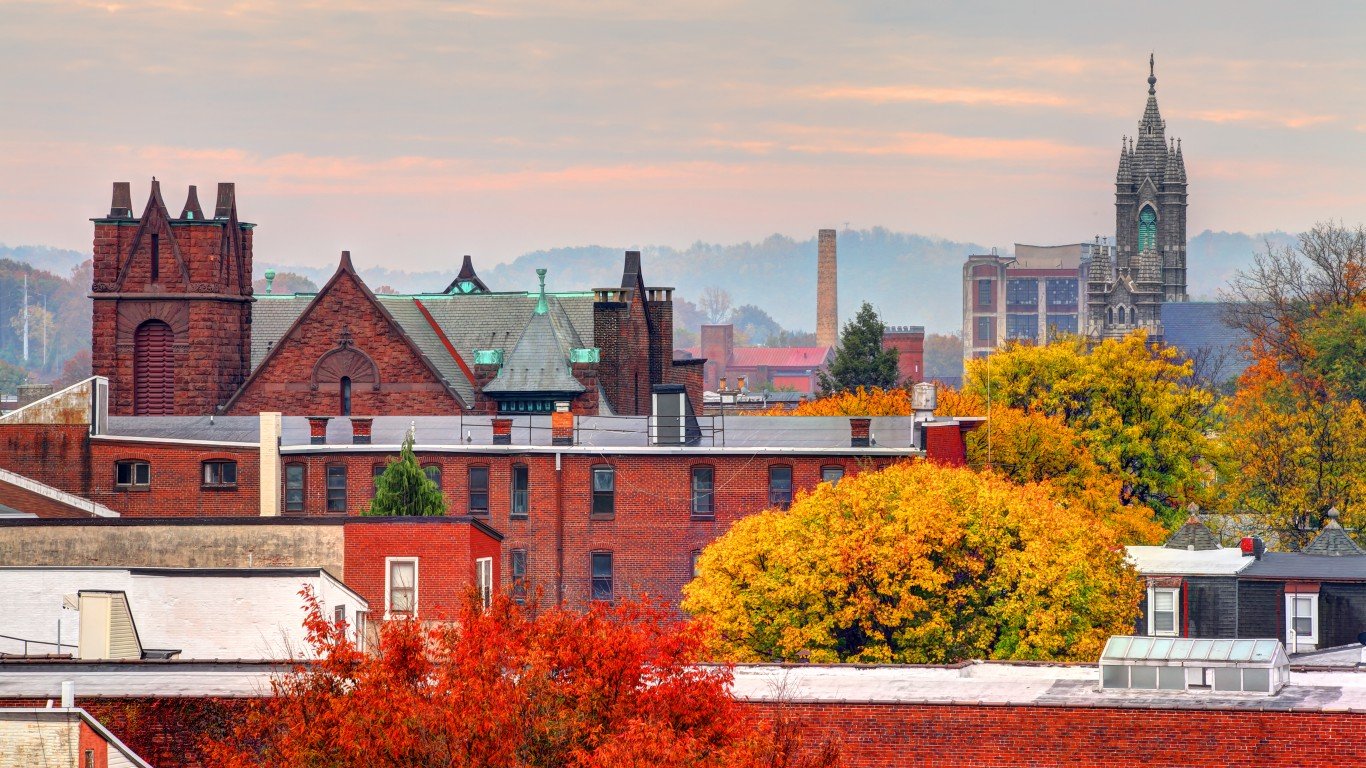
Pennsylvania: Reading
> Concentrated poverty rate: 31.4% of poor pop. live in poor neighborhoods
> Overall poverty rate: 12.8% (state: 12.5%)
> Neighborhoods with concentrated poverty: 10 out of 89
> 2018 Census unemployment rate: 21.0% in poor neighborhoods; 5.6% in all other neighborhoods
Reading is the most economically segregated metro area in Pennsylvania and one of the most economically segregated in the United States. Nearly one-third of the 51,245 metro area residents who live on poverty level incomes reside in neighborhoods where at least 40% of all residents also live below the poverty line. Access to employment opportunities can be relatively limited in poor neighborhoods, and in Reading’s concentrated poverty communities, the unemployment rate stands at 21.0%, nearly four times the 5.6% jobless rate across the rest of the metro area.

Rhode Island: Providence-Warwick
> Concentrated poverty rate: 4.1% of poor pop. live in poor neighborhoods
> Overall poverty rate: 12.5% (state: 13.0%)
> Neighborhoods with concentrated poverty: 5 out of 359
> 2018 Census unemployment rate: 12.7% in poor neighborhoods; 5.9% in all other neighborhoods
Providence is the only metro area in Rhode Island and ranks as having the worst concentrated poverty in the state by default. There are five neighborhoods in greater Providence characterized by concentrated poverty, and they are home to 4.1% of the metro area’s 193,214 residents who live below the poverty line.
Economic opportunity tends to be scarce in high-poverty communities. Members of the labor force living in Providence’s poorest neighborhood are more than twice as likely to be unemployed as those living in the rest of the metro area.
[in-text-ad-2]

South Carolina: Charleston-North Charleston
> Concentrated poverty rate: 10.4% of poor pop. live in poor neighborhoods
> Overall poverty rate: 13.3% (state: 15.8%)
> Neighborhoods with concentrated poverty: 7 out of 151
> 2018 Census unemployment rate: 9.6% in poor neighborhoods; 4.7% in all other neighborhoods
Greater Charleston is the most economically segregated metropolitan area in South Carolina. More than 10% Charleston residents living below the poverty line live in one of seven neighborhoods in the metro area characterized by concentrated poverty.
Though Charleston has the highest concentrated poverty rate in South Carolina, it is not the poorest metropolitan area in the state. Charleston’s overall poverty rate of 13.3% is lower than the statewide poverty rate of 15.8% and lower than several other metropolitan areas in South Carolina, including Florence and Sumpter, which have poverty rates exceeding 20%.
South Dakota: No metro area with concentrated poverty
> State poverty rate: 13.3%
Like its neighbors Montana, North Dakota, and Wyoming, South Dakota is one of a handful of states where no metro areas have neighborhoods characterized by extreme poverty. In both metro areas in the state — Rapid City, where 12.2% of the population lives in poverty, and Sioux Falls, where the poverty rate is 9.2% — serious financial hardship is less common than it is across the state or the country as a whole. In South Dakota, 13.3% of the population lives in poverty, and 13.9% of Americans live in poverty nationwide.
[in-text-ad]

Tennessee: Memphis
> Concentrated poverty rate: 26.6% of poor pop. live in poor neighborhoods
> Overall poverty rate: 18.6% (state: 16.1%)
> Neighborhoods with concentrated poverty: 49 out of 309
> 2018 Census unemployment rate: 15.6% in poor neighborhoods; 6.8% in all other neighborhoods
More than one in every four Memphis residents living on poverty level incomes reside in neighborhoods of concentrated poverty, by far the highest extreme poverty rate of any of the 10 metro areas in Tennessee.
Incomes tend to rise with educational attainment. In Memphis’s poorest communities, just 10.5% of adults have a bachelor’s degree or higher. Meanwhile, across the rest of the metro area, 29.5% of adults have a four-year college education.
[recirclink id=714364]
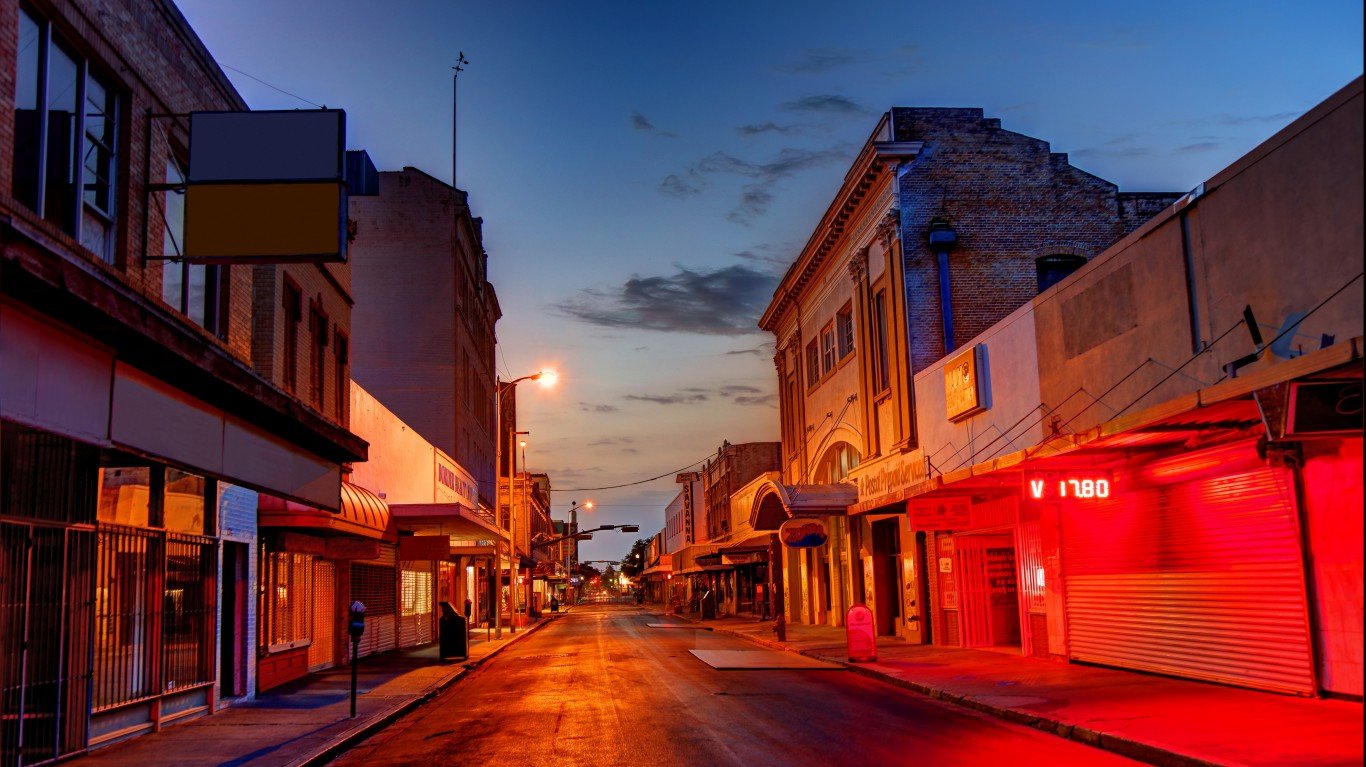
Texas: Laredo
> Concentrated poverty rate: 52.3% of poor pop. live in poor neighborhoods
> Overall poverty rate: 30.1% (state: 15.3%)
> Neighborhoods with concentrated poverty: 25 out of 60
> 2018 Census unemployment rate: 7.0% in poor neighborhoods; 4.5% in all other neighborhoods
Laredo is by far the most economically segregated metropolitan area in Texas and in the United States as a whole. It is the only metro area in the country where over half of the population living below the poverty line resides in neighborhoods characterized by concentrated poverty.
Incomes tend to rise with educational attainment, and only about half of all adults in Laredo’s poorest communities have a high school diploma and just 6.1% of adults have a bachelor’s degree. In the rest of the metro area, nearly three-quarters of adults have completed high school, and 24.2% have a bachelor’s degree. Additionally, households in Laredo’s high poverty neighborhoods are more than twice as likely to rely on SNAP benefits than households in other parts of the city.
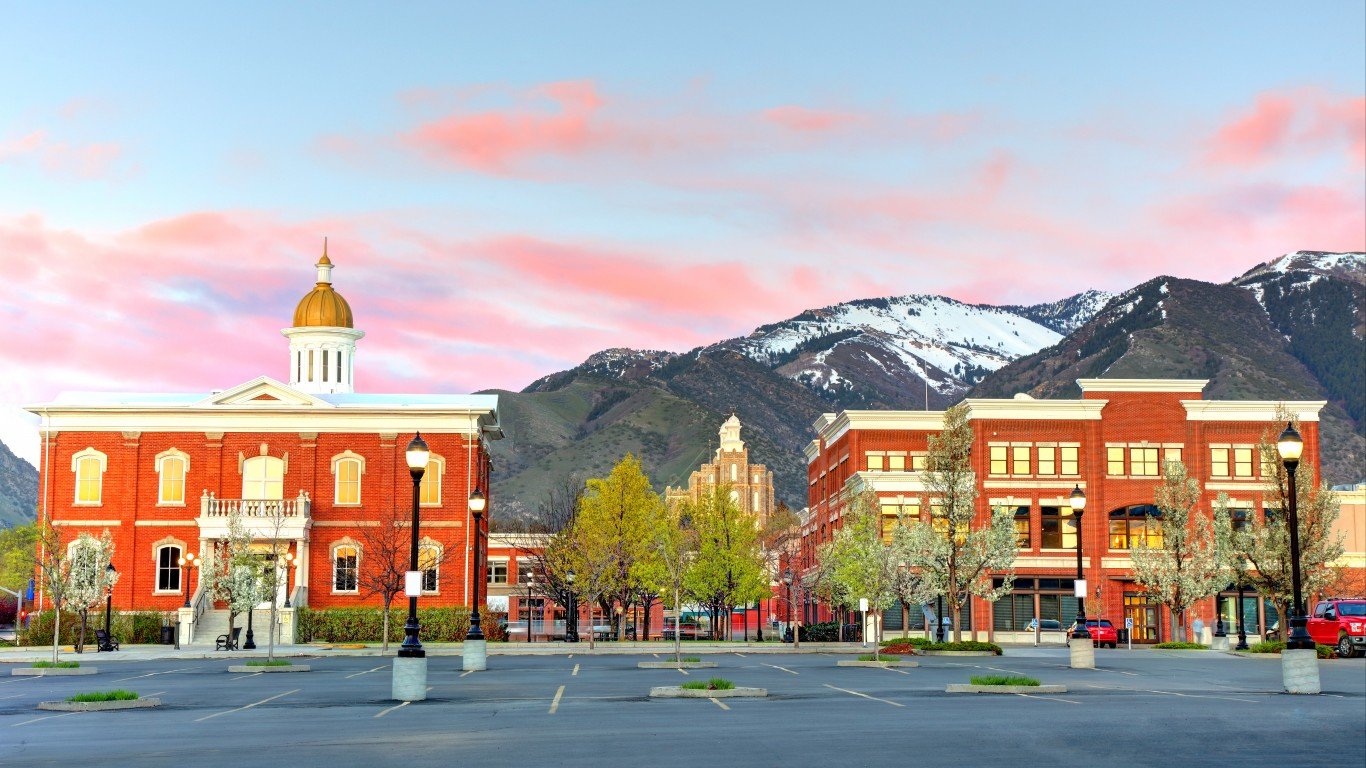
Utah: Ogden-Clearfield
> Concentrated poverty rate: 5.0% of poor pop. live in poor neighborhoods
> Overall poverty rate: 8.0% (state: 9.9%)
> Neighborhoods with concentrated poverty: 2 out of 116
> 2018 Census unemployment rate: 10.3% in poor neighborhoods; 3.7% in all other neighborhoods
Ogden-Clearfield’s concentrated poverty rate of 5.0% is below the concentrated poverty rate in the Logan, Utah metro area. However, Logan is home to Utah State University, and its concentrated poverty neighborhood is home to a large population of college and university students, meaning economic disadvantages are not likely as severe as the data would suggest. Controlling for student populations, Ogden-Clearfield ranks as the city hit hardest by extreme poverty in Utah.
Unlike most metro areas on this list, Ogden-Clearfield does not have a particularly high poverty rate. Just 8.0% of area residents live below the poverty line, compared to 9.9% of Utah’s population and 13.9% of Americans.
[in-text-ad-2]
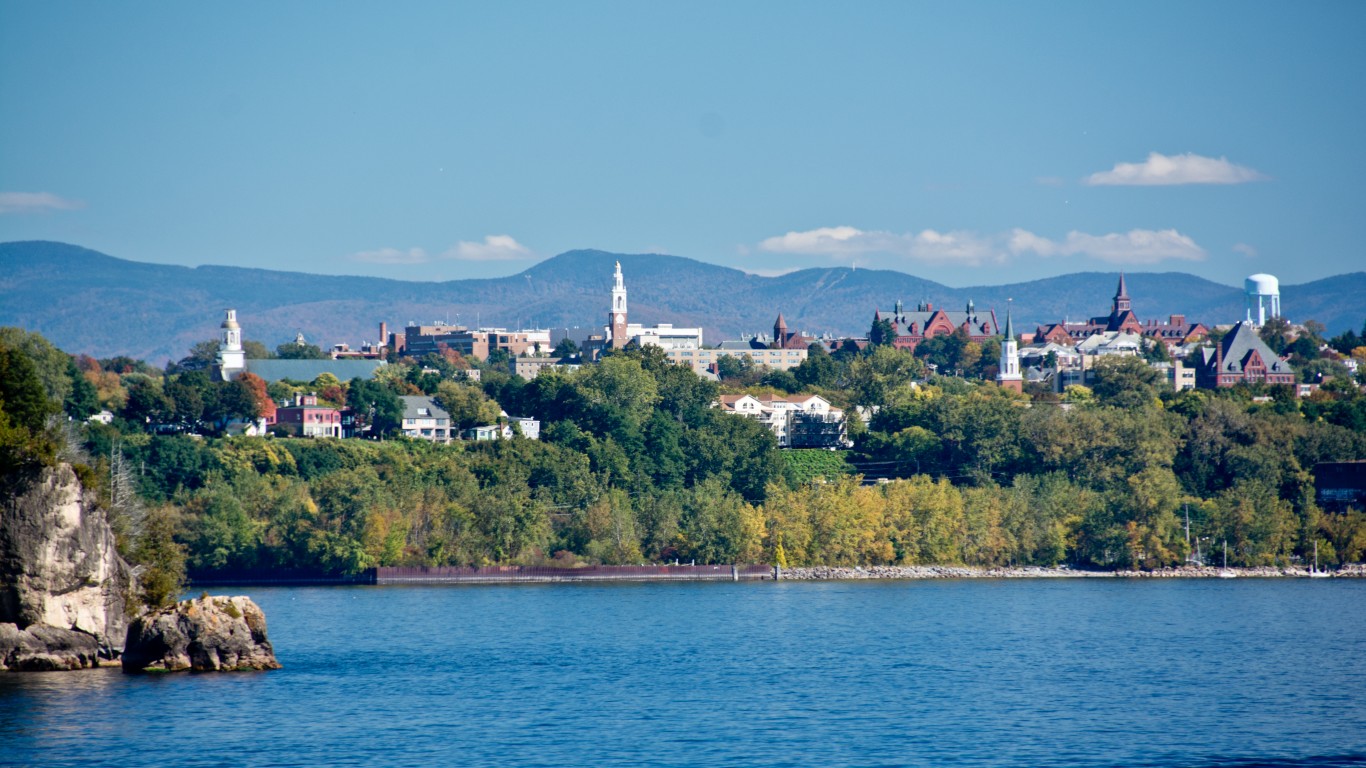
Vermont: No metro area with concentrated poverty
> State poverty rate: 11.1%
Burlington, Vermont’s only metropolitan area, has a concentrated poverty rate of 10.4%. However, Burlington is home to several higher education institutions, including the University of Vermont, and the concentration of college students in the metro area’s high-poverty neighborhoods is likely skewing the severity of economic hardship across the city. As a result, Vermont has no metro areas with concentrated poverty rates that qualify for this list.
Residents of both the greater Burlington area and Vermont as a whole are less likely to face serious economic hardship than Americans nationwide. Burlington’s poverty rate of 10.6% and Vermont’s rate of 11.1% are each well below the national rate of 13.9%.

Virginia: Roanoke
> Concentrated poverty rate: 15.5% of poor pop. live in poor neighborhoods
> Overall poverty rate: 13.4% (state: 10.7%)
> Neighborhoods with concentrated poverty: 3 out of 65
> 2018 Census unemployment rate: 8.6% in poor neighborhoods; 4.9% in all other neighborhoods
Nearly 41,000 Roanoke residents live below the poverty line, and 15.5% of them also reside in concentrated poverty neighborhoods, which can compound economic hardship. Over a third of all households in concentrated poverty neighborhoods in the greater Roanoke area rely on SNAP benefits compared to fewer than one in every 10 households in the rest of the metro area.
Minority populations in Roanoke are disproportionately concentrated in economically disadvantaged neighborhoods. Though only 12.9% of the metro area population is Black, in Roanoke’s concentrated poverty neighborhoods, nearly 60% of the population is Black.
[in-text-ad]

Washington: Kennewick-Richland
> Concentrated poverty rate: 9.3% of poor pop. live in poor neighborhoods
> Overall poverty rate: 13.7% (state: 11.3%)
> Neighborhoods with concentrated poverty: 1 out of 48
> 2018 Census unemployment rate: 8.3% in poor neighborhoods; 5.2% in all other neighborhoods
Though Bellingham, Washington, has a 10.5% concentrated poverty rate, it is also home to several colleges and universities, and enrolled students comprise a large share of those living in the metro area’s concentrated poverty neighborhoods, likely skewing the severity of economic hardship in those neighborhoods. As a result, the Kennewick-Richland metro area, with a concentrated poverty rate of 9.3%, ranks as the worst city for extreme poverty in Washington.
Nearly 40% of households in the poorest neighborhoods in the greater Kennewick area rely on SNAP benefits, more than double the 14.2% share of households in the rest of the metro area.
[recirclink id=715247]
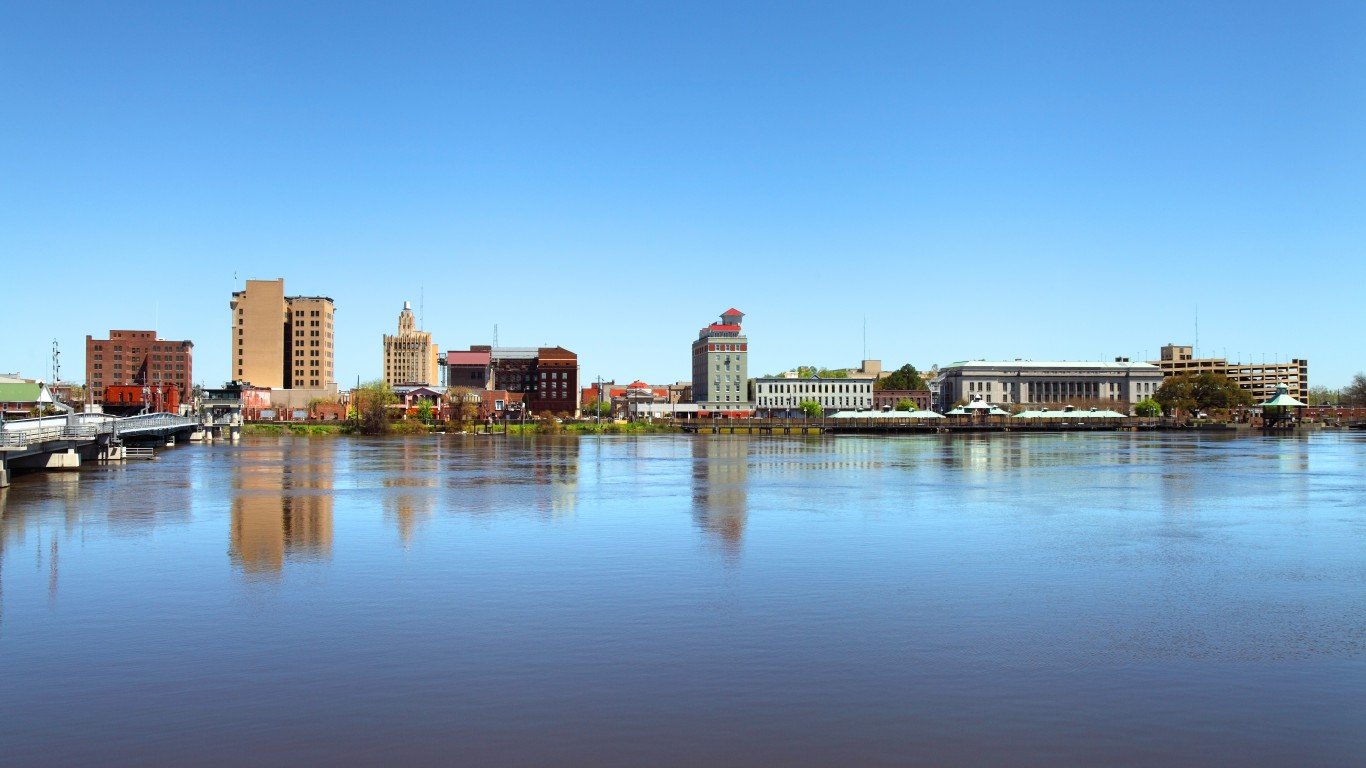
West Virginia: Huntington-Ashland
> Concentrated poverty rate: 11.1% of poor pop. live in poor neighborhoods
> Overall poverty rate: 18.6% (state: 17.5%)
> Neighborhoods with concentrated poverty: 7 out of 92
> 2018 Census unemployment rate: 10.8% in poor neighborhoods; 6.0% in all other neighborhoods
With an 18.6% poverty rate, Huntington-Ashland is the poorest metro area in West Virginia. It also has the worst economic segregation of any metropolitan area in the state as 11.1% of those living below the poverty line also reside in concentrated-poverty communities. As is typically the case, economic opportunities are relatively scarce in the poorer communities across greater Huntington. The unemployment rate stands at 10.8% in concentrated poverty neighborhoods and at just 6.0% in the rest of the metro area.

Wisconsin: Milwaukee-Waukesha-West Allis
> Concentrated poverty rate: 20.1% of poor pop. live in poor neighborhoods
> Overall poverty rate: 13.7% (state: 11.3%)
> Neighborhoods with concentrated poverty: 43 out of 422
> 2018 Census unemployment rate: 12.0% in poor neighborhoods; 4.5% in all other neighborhoods
The Milwaukee metro area’s poverty rate of 13.7% is the highest of any of the dozen metro areas in the state and higher than the 11.3% state poverty rate. Milwaukee also has the highest concentrated poverty rate in the state with more than one in every five residents living on poverty level incomes residing in neighborhoods where at least 40% of residents are also living in poverty.
Minority populations in Milwaukee are disproportionately concentrated in economically disadvantaged neighborhoods. Though only 16.4% of the metro area population is Black, more than half of the population in Milwaukee’s concentrated-poverty neighborhoods is Black.
[in-text-ad-2]

Wyoming: No metro area with concentrated poverty
> State poverty rate: 10.9%
Like its neighbors Idaho, Montana, and South Dakota, Wyoming is one of a handful of states where no metro areas have neighborhoods in which 40% or more of the population lives below the poverty line. Both Casper and Cheyenne, Wyoming’s only metro areas, have poverty rates below the 13.9% national rate, at 9.6% and 10.0%, respectively.
While serious financial hardship is not as common in Wyoming’s metro areas as it is nationwide, incomes tend to be slightly lower than typical. The average annual household incomes in Casper and Cheyenne are $78,892 and $80,350, respectively. Nationwide, the average household income is $85,123.
Methodology
To identify the metropolitan areas hit hardest by extreme poverty, 24/7 Wall St. reviewed five-year data from the U.S. Census Bureau’s 2018 American Community Survey on poverty rates at the Census tract level. The metro area where the largest percentage of poor residents live in extreme poverty neighborhoods — Census tracts where a poverty rate is 40% or higher — has the highest extreme or concentrated poverty rate.
In our analysis, we only considered Census tracts with at least 500 people and college or graduate school enrollment below 50%. Metro areas were also excluded if over 25% of the population in tracts or neighborhoods of concentrated poverty were college or university students.
All other data referenced in the story, including educational attainment, homeownership, SNAP benefit recipiency, average household income, racial composition, and unemployment are also from the U.S. Census Bureau’s 2018 American Community Survey, and were aggregated from the Census tract to the metropolitan level.
Contact [email protected] for any questions or corrections.