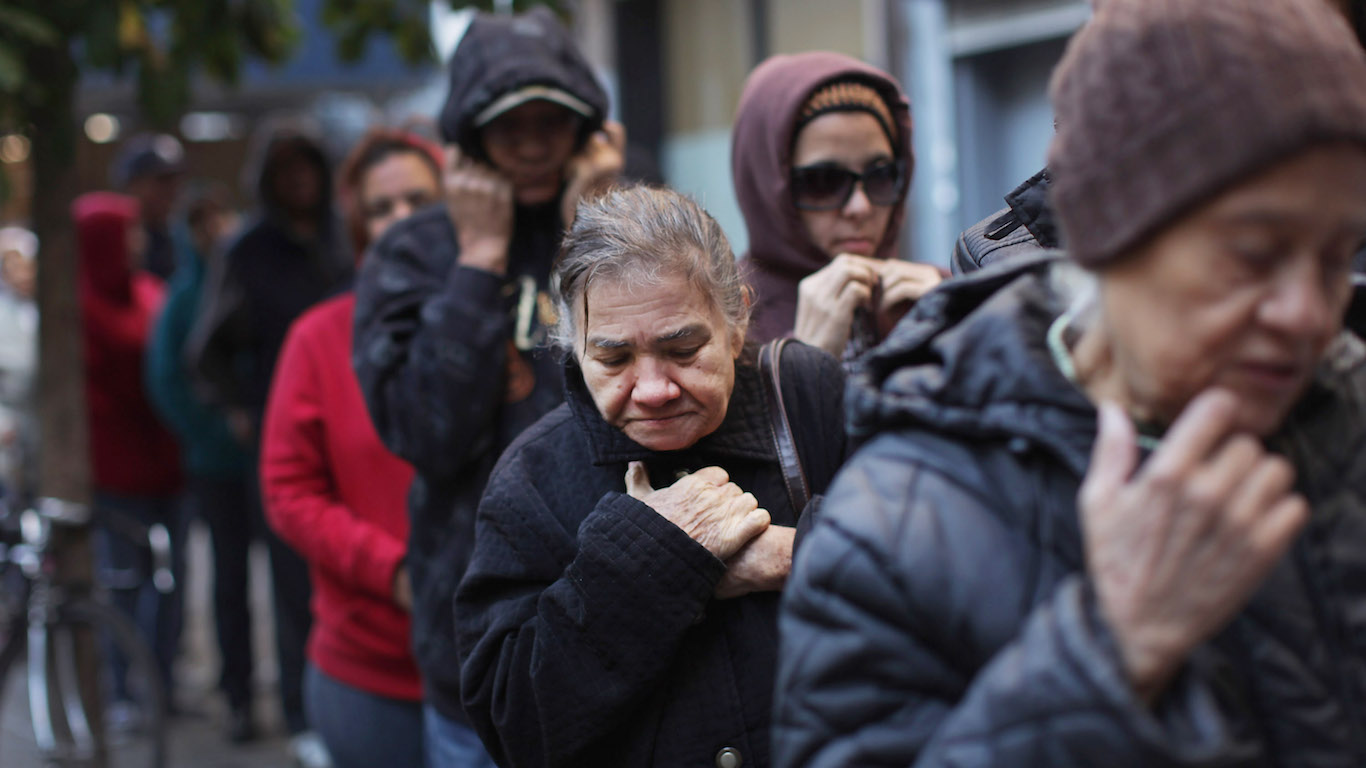
The hardships faced by many of the 38 million Americans living in poverty are difficult to overstate. A poverty-level income is, by definition, insufficient to afford basic necessities, such as clean water, food, medical care, and housing. Many of the poorest Americans also live in neighborhoods of concentrated poverty – and such an environment can compound daily suffering and reduce the likelihood of upward socioeconomic mobility.
High-poverty neighborhoods – defined as those in which 40% or more of the population live below the poverty line – tend to have higher crime rates, poorer health outcomes, lower-quality schools, and fewer employment opportunities than communities with less poverty. These factors impact people of all income levels who reside in high-poverty neighborhoods, but for those who are also poor, the negative effects are even more pronounced.
Using data from the U.S. Census Bureau, 24/7 Wall St. identified the metro area in each state with the highest concentrated poverty. Metro areas are ranked by the share of residents living below the poverty line who also reside in a census tract with a poverty rate of at least 40% – a high-poverty neighborhood. So while two metro areas can have the same poverty rate, in one, residents under the poverty line live throughout the city and may benefit from better services in higher-income neighborhoods, while in the other, they are concentrated in a few neighborhoods where services and conditions tend to also be insufficient.
Among the metro areas on this list, the concentrated, or extreme poverty rate ranges from about 1.5% to over 40%. The places on this list with the worst concentrated poverty tend to be in the South, though many are also in Midwestern cities that have suffered for decades from deindustrialization, automation, and globalization. (Here is a look at America’s fastest dying industries.)
Economic mobility is limited in the high-poverty neighborhoods in many of these metro areas, hindered by low educational attainment levels and high unemployment rates. In most of the cities hit hardest by extreme poverty in each state, the jobless rate in poor neighborhoods is more than double the rate in the rest of the city. (Here is a look at the states where poverty is much worse than you think.)
Click here to see the city hit hardest by extreme poverty in each state
Click here to read our detailed methodology

Alabama: Gadsden
> Concentrated poverty rate: 25.7% of poor pop. living in poor neighborhoods
> Overall poverty rate: 16.0% (state: 15.8%)
> Neighborhoods in extreme poverty: 5 of 33 tracts
> Avg. household income: $30,882 in poor tracts, $64,411 in all others
Gadsden has the highest extreme poverty rate of Alabama’s 12 metro areas. Nearly 26% of Gadsden residents with poverty-level income live in communities where at least 40% of their neighbors also live in poverty.
In communities of concentrated poverty, financial hardship is often attributable in part to a lack of opportunity. In Gadsden’s high-poverty neighborhoods, the unemployment rate is 7.5%, compared to just 5.5% in the parts of the city with no concentrated poverty.
[in-text-ad]
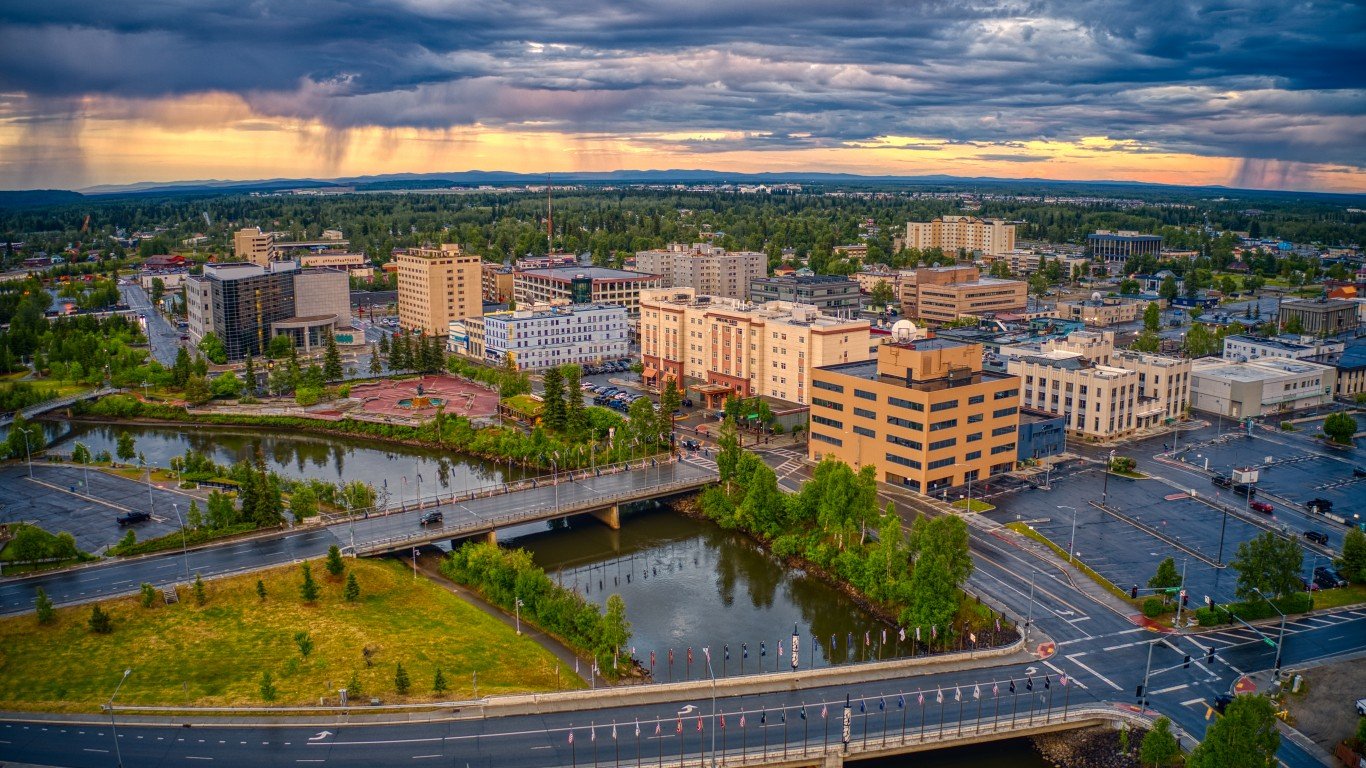
Alaska: No metro area with concentrated poverty
> State poverty rate: 10.3%
Alaska’s two metro areas — Anchorage and Fairbanks — have no neighborhoods in which 40% or more of the population live below the poverty line. In fact, poverty in general is less common in Alaska’s metropolitan areas than it is across the state as a whole. In Anchorage, 9.2% of residents live below the poverty line, and the poverty rate in Fairbanks is even lower, at 6.5%. Meanwhile, 10.3% of all Alaskans live below the poverty line.
Neighborhoods with concentrated poverty often have relatively limited employment opportunities, and both Anchorage and Fairbanks have stronger job markets than Alaska as a whole. Over the five years through 2020, an average of 7.2% of labor force participants in Alaska were unemployed — a larger share than the 6.3% and 7.1% jobless rates in Anchorage and Fairbanks, respectively.
[recirclink id=1144696]

Arizona: Tucson
> Concentrated poverty rate: 8.2% of poor pop. living in poor neighborhoods
> Overall poverty rate: 15.7% (state: 14.0%)
> Neighborhoods in extreme poverty: 8 of 263 tracts
> Avg. household income: $42,196 in poor tracts, $76,872 in all others
There are nearly 157,000 Tucson residents living below the poverty line, and 8.2% of them – around 12,800 people – reside in neighborhoods where 40% or more of the population also live in poverty. The extreme poverty rate of 8.2% in Tucson is the highest of any Arizona metro area by at least 2 percentage points, though it is lower than the 10.5% concentrated poverty rate nationwide..
Upward economic mobility in Tucson’s high-poverty areas is limited by several factors. For one, adult residents in these places are less likely to have completed high school or college than residents in the rest of the city. Additionally, job opportunities are relatively scarce in these places. The unemployment rate in Tucson’s high-poverty neighborhoods stands at 14% – more than double the 6.6% jobless rate across the city’s other communities.
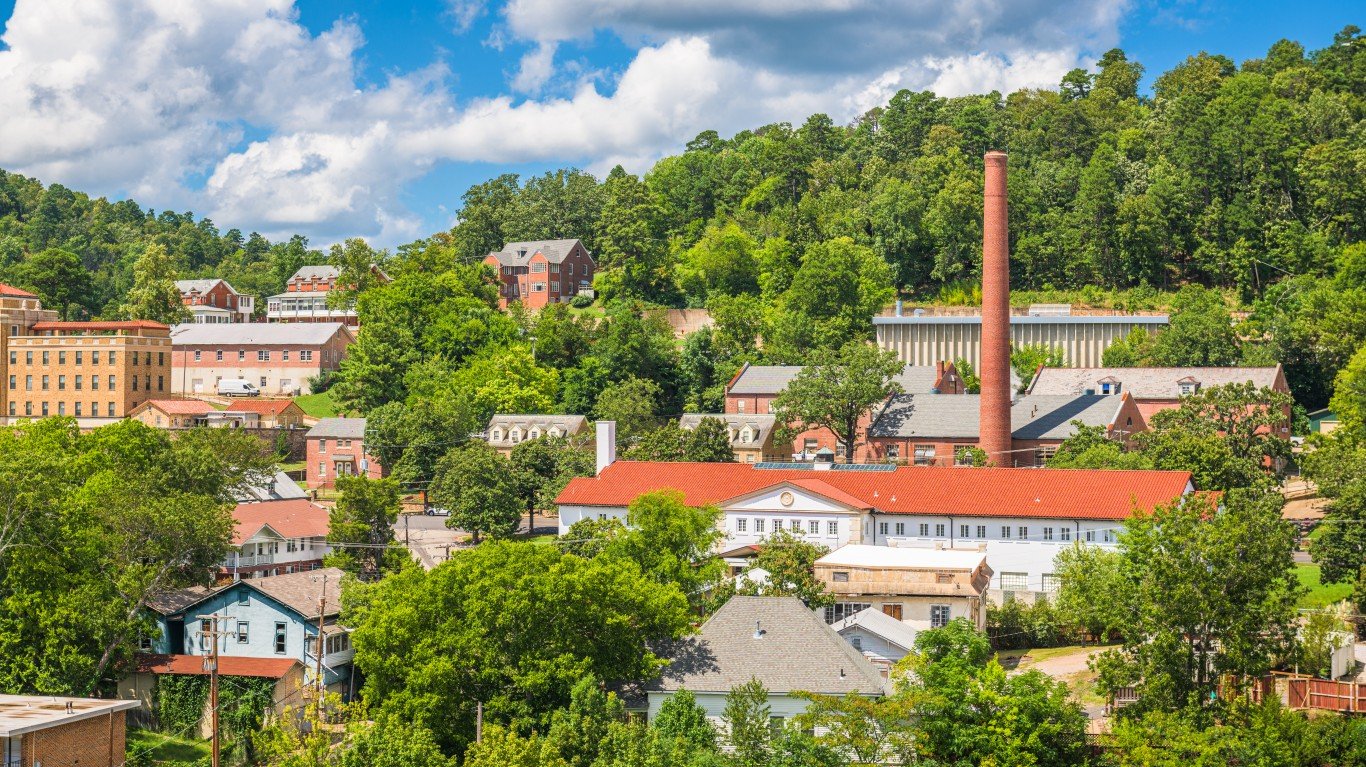
Arkansas: Hot Springs
> Concentrated poverty rate: 12.0% of poor pop. living in poor neighborhoods
> Overall poverty rate: 17.0% (state: 15.9%)
> Neighborhoods in extreme poverty: 2 of 30 tracts
> Avg. household income: $34,933 in poor tracts, $65,108 in all others
In Hot Springs, Arkansas, 12% of the population living below the poverty line resides in neighborhoods of concentrated poverty, a larger share than in any other metro area in the state. Opportunities in the poor neighborhoods of Hot Springs appear to be limited, partly due to education outcomes. Only about 75% of adults in the metro area’s two high-poverty neighborhoods have completed high school, compared to about 90% in the rest of the city.
Low incomes in the poorest Hot Springs’ neighborhoods exacerbate financial hardship. Households in the metro area’s concentrated poverty communities earn less than $35,000 a year on average. Meanwhile, in the rest of the city, households earn over $65,000 on average.
[in-text-ad-2]
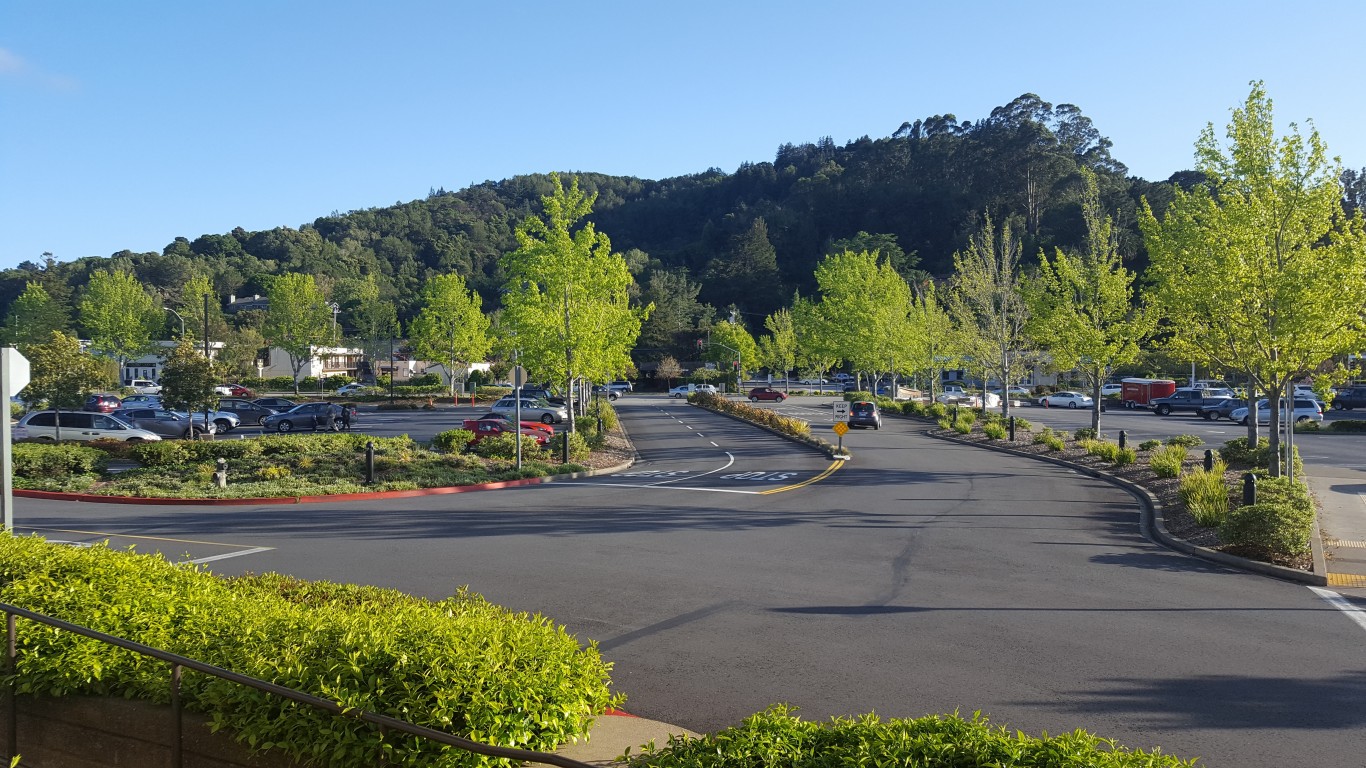
California: Madera
> Concentrated poverty rate: 23.9% of poor pop. living in poor neighborhoods
> Overall poverty rate: 19.0% (state: 12.4%)
> Neighborhoods in extreme poverty: 3 of 34 tracts
> Avg. household income: $53,904 in poor tracts, $80,029 in all others
Nearly 24% of Madera residents living below the poverty line also reside in neighborhoods of highly concentrated poverty – the largest share of any metro area in California. Over 40% of all residents in Madera’s high-poverty neighborhoods depend on SNAP benefits to afford basic necessities, compared to just 15.8% in the rest of the metro area.
Upward economic mobility in poor neighborhoods is often limited by a lack of employment opportunities – and Madera is no exception. Across the metro area’s three high-poverty areas, the unemployment rate is 15.1%, compared to 9.0% in the rest of the city.
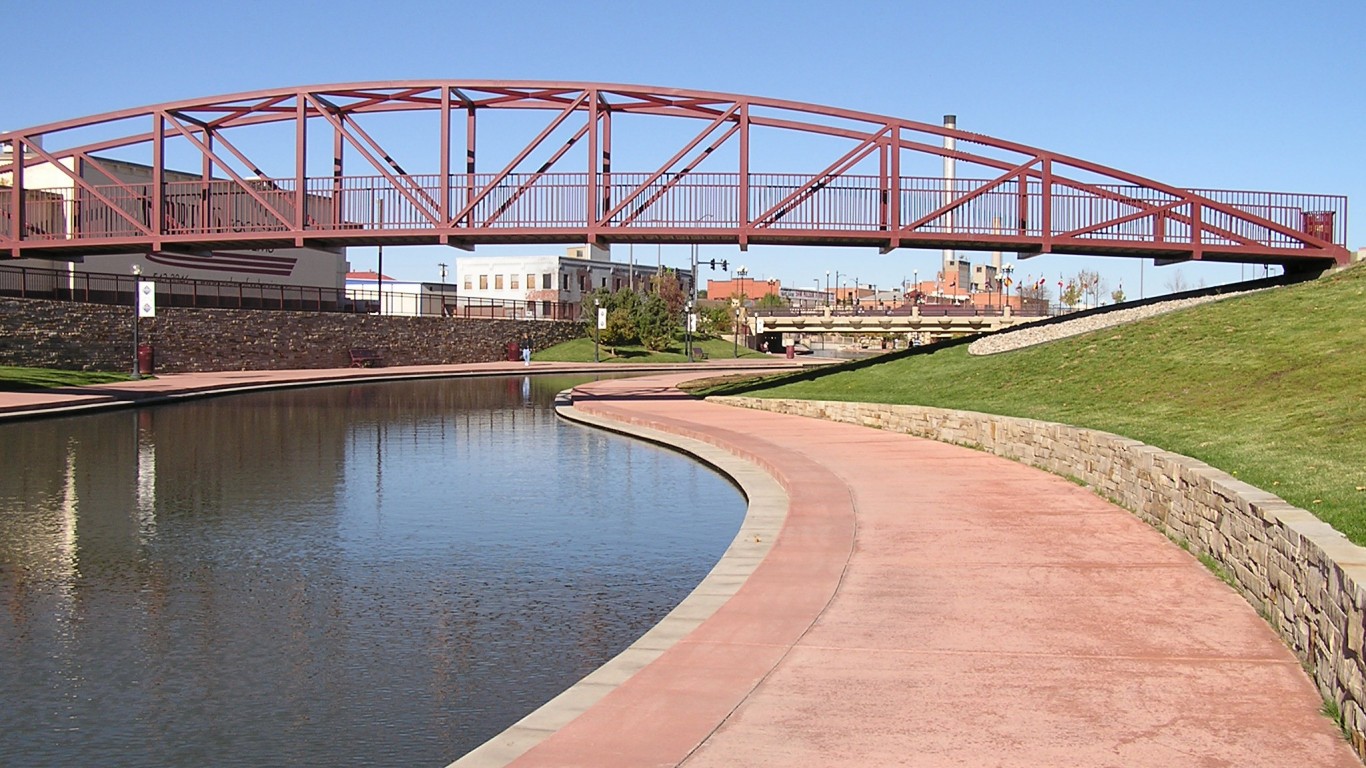
Colorado: Pueblo
> Concentrated poverty rate: 13.5% of poor pop. living in poor neighborhoods
> Overall poverty rate: 17.6% (state: 9.5%)
> Neighborhoods in extreme poverty: 4 of 56 tracts
> Avg. household income: $37,663 in poor tracts, $67,662 in all others
Pueblo has the highest concentrated poverty rate of any metro area in Colorado by a wide margin. A reported 13.5% of Pueblo residents living below the poverty line reside in one of the four high-poverty neighborhoods in the metro area. In Greely, the Colorado metro area with the second highest concentrated poverty rate, only 3.6% of those living in poverty reside in high-poverty neighborhoods.
Upward economic mobility in Pueblo’s poor areas appears limited, in part, by reduced access to basic infrastructure. Only 68.7% of households in poor neighborhoods have broadband internet access, compared to over 80% of households in the rest of the metro area.
[in-text-ad]

Connecticut: Hartford-East Hartford-Middletown
> Concentrated poverty rate: 9.6% of poor pop. living in poor neighborhoods
> Overall poverty rate: 9.9% (state: 9.7%)
> Neighborhoods in extreme poverty: 10 of 299 tracts
> Avg. household income: $42,335 in poor tracts, $106,388 in all others
The Hartford metro area is relatively affluent, with an average household income of over $105,000. There are poor pockets of the city, however, that have high levels of poverty and are isolated from wealthier neighborhoods. In Hartford, 9.6% of the population living on poverty-level incomes reside in high-poverty neighborhoods, the largest share of any Connecticut metro area. Across these communities, the average annual household income is just $42,335.
Over half of all households in Hartford’s high-poverty neighborhoods rely on SNAP benefits to afford basic necessities. Upward economic mobility in these places appears limited, in part, by reduced access to basic infrastructure. Only 71.9% of households in poor neighborhoods have broadband internet access, compared to over 87.1% of households in the rest of the metro area.
[recirclink id=1141638]
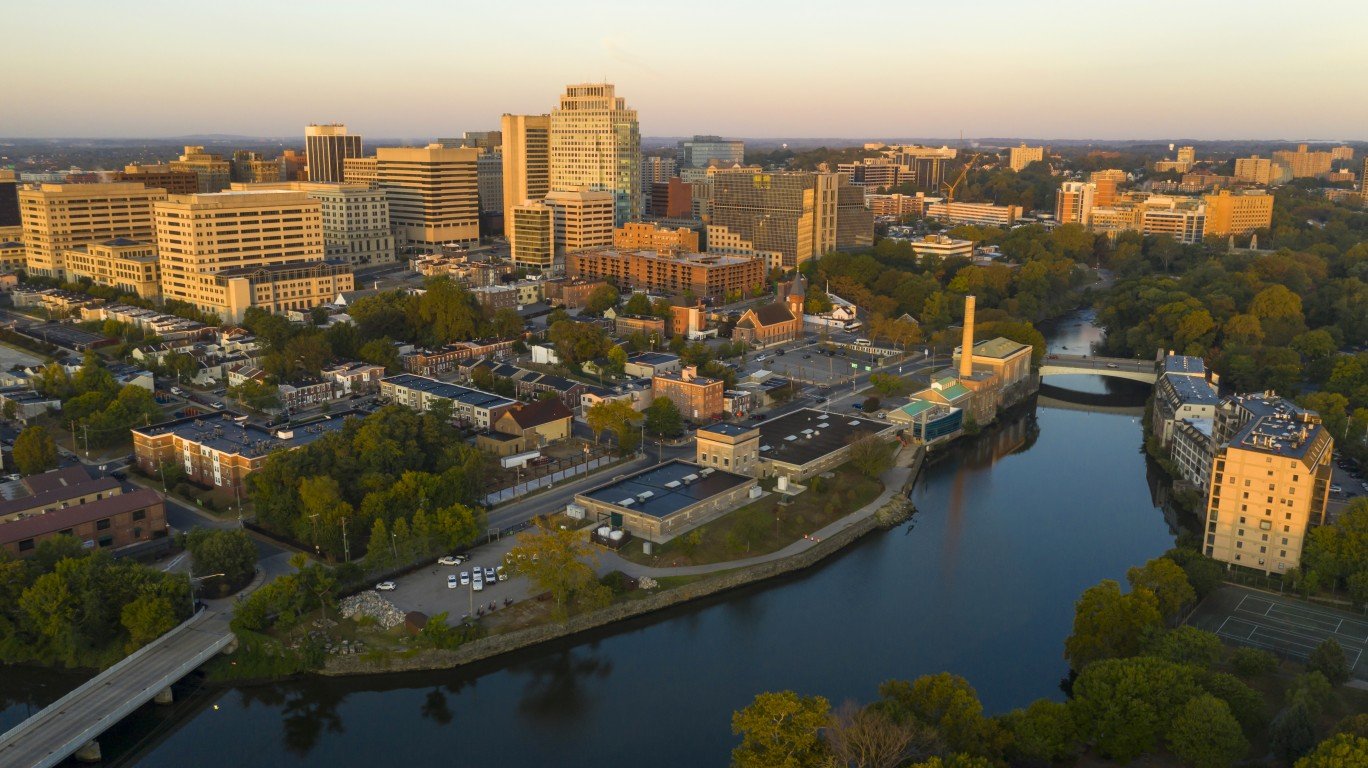
Delaware: No metro area with concentrated poverty
> State poverty rate: 11.2%
Dover is the only metro area in Delaware — and none of the city’s 40 eligible neighborhoods have a poverty rate of 40% or higher. Still, Dover residents are more likely to live below the poverty line than the typical Delaware resident. An estimated 13.2% of people in Dover live below the poverty line compared to 11.2% of Delaware residents.
The greater likelihood of financial hardship in Dover is likely linked, in part, to education outcomes. Adults with a college degree are far less likely to face serious financial hardship than those with lower educational attainment, and across Delaware, 32.5% of adults have a bachelor’s degree, compared to 24.5% of adults in Dover.

Florida: Tallahassee
> Concentrated poverty rate: 19.4% of poor pop. living in poor neighborhoods
> Overall poverty rate: 14.9% (state: 13.2%)
> Neighborhoods in extreme poverty: 7 of 89 tracts
> Avg. household income: $32,346 in poor tracts, $82,182 in all others
Tallahassee has the highest concentrated poverty rate of any metro area in Florida by a wide margin. A reported 19.4% of Tallahassee residents living below the poverty line reside in one of the seven high-poverty neighborhoods in the metro area. In Port St. Lucie, the Florida metro area with the second highest concentrated poverty rate, 10.5% of those living in poverty reside in high-poverty neighborhoods, almost half the concentrated poverty rate in Tallahassee.
Upward economic mobility in Tallahassee’s high-poverty areas is limited by several factors. For one, adult residents in these places are less likely to have completed high school or college than those in the rest of the city. Additionally, job opportunities are relatively scarce in these places, as the unemployment rate in Tallahassee’s high-poverty neighborhoods stands at 13.2% – nearly three times the 4.5% jobless rate across the city’s other communities.
[in-text-ad-2]

Georgia: Albany
> Concentrated poverty rate: 41.9% of poor pop. living in poor neighborhoods
> Overall poverty rate: 23.0% (state: 14.1%)
> Neighborhoods in extreme poverty: 11 of 46 tracts
> Avg. household income: $32,999 in poor tracts, $68,610 in all others
Albany has the highest concentrated poverty rate of any metro area – in Georgia and the U.S. There are over 32,000 Albany residents who live below the poverty line, and nearly 42% of them reside in one of 11 concentrated poverty neighborhoods across the metro area (neighborhoods where 40% of residents live below the poverty line).
Americans who live in such extreme poverty face additional hurdles to upward economic mobility, including usually access to jobs. A staggering 18.6% of workers living in Albany’s concentrated poverty neighborhoods are unemployed, more than triple the 6.1% jobless rate in the rest of the city. Additionally, over a third of households in Albany’s poorest neighborhoods lack broadband internet access, compared to fewer than one in five households in the rest of the metro area.

Hawaii: Urban Honolulu
> Concentrated poverty rate: 6.2% of poor pop. living in poor neighborhoods
> Overall poverty rate: 8.4% (state: 9.3%)
> Neighborhoods in extreme poverty: 5 of 313 tracts
> Avg. household income: $56,549 in poor tracts, $113,236 in all others
Of the two metro areas in Hawaii – Honolulu and Kahului-Wailuku-Lahaina – Honolulu is the only one with neighborhoods where over 40% of the population live below the poverty line. Nearly 5,000 people in Honolulu live below the poverty line in high-poverty areas – or 6.2% of all poor metro area residents. Nationwide, 10.5% of people living in poverty reside in high-poverty areas.
Widespread financial hardship in Honolulu’s poorest communities means a large share of the population depends on government assistance to afford basic necessities. Nearly half of all residents of high-poverty Honolulu communities receive SNAP benefits, compared to 10% of residents in the rest of the metro area.
[in-text-ad]

Idaho: Boise City
> Concentrated poverty rate: 1.5% of poor pop. living in poor neighborhoods
> Overall poverty rate: 10.1% (state: 11.7%)
> Neighborhoods in extreme poverty: 1 of 191 tracts
> Avg. household income: $37,889 in poor tracts, $86,241 in all others
Of the six metropolitan areas in Idaho, Boise is the only one with a neighborhood where 40% or more of the population live in poverty. Boise’s only high-poverty neighborhood is home to 1.5% of the 72,000 metro area residents who live below the poverty line.
Widespread financial hardship in Boise’s poorest communities means a large share of the population depends on government assistance to afford basic necessities. Over a third of all residents of the high-poverty Boise community receive SNAP benefits, compared to less than 10% of residents in the rest of the metro area.
[recirclink id=1135129]

Illinois: Danville
> Concentrated poverty rate: 26.7% of poor pop. living in poor neighborhoods
> Overall poverty rate: 19.0% (state: 11.8%)
> Neighborhoods in extreme poverty: 3 of 24 tracts
> Avg. household income: $38,053 in poor tracts, $64,029 in all others
Of the 10 metropolitan areas in Illinois, Danville has the highest concentrated poverty rate. Nearly 27% of Danville residents living below the poverty line reside in neighborhoods where at least 40% of the population also lives in poverty.
Economic opportunity is typically scarce in areas with concentrated poverty. Across Danville’s poorest neighborhoods, an average of 11.6% of the labor force have been unemployed over the last five years, more than double the 5.4% jobless rate in the rest of the metro area.
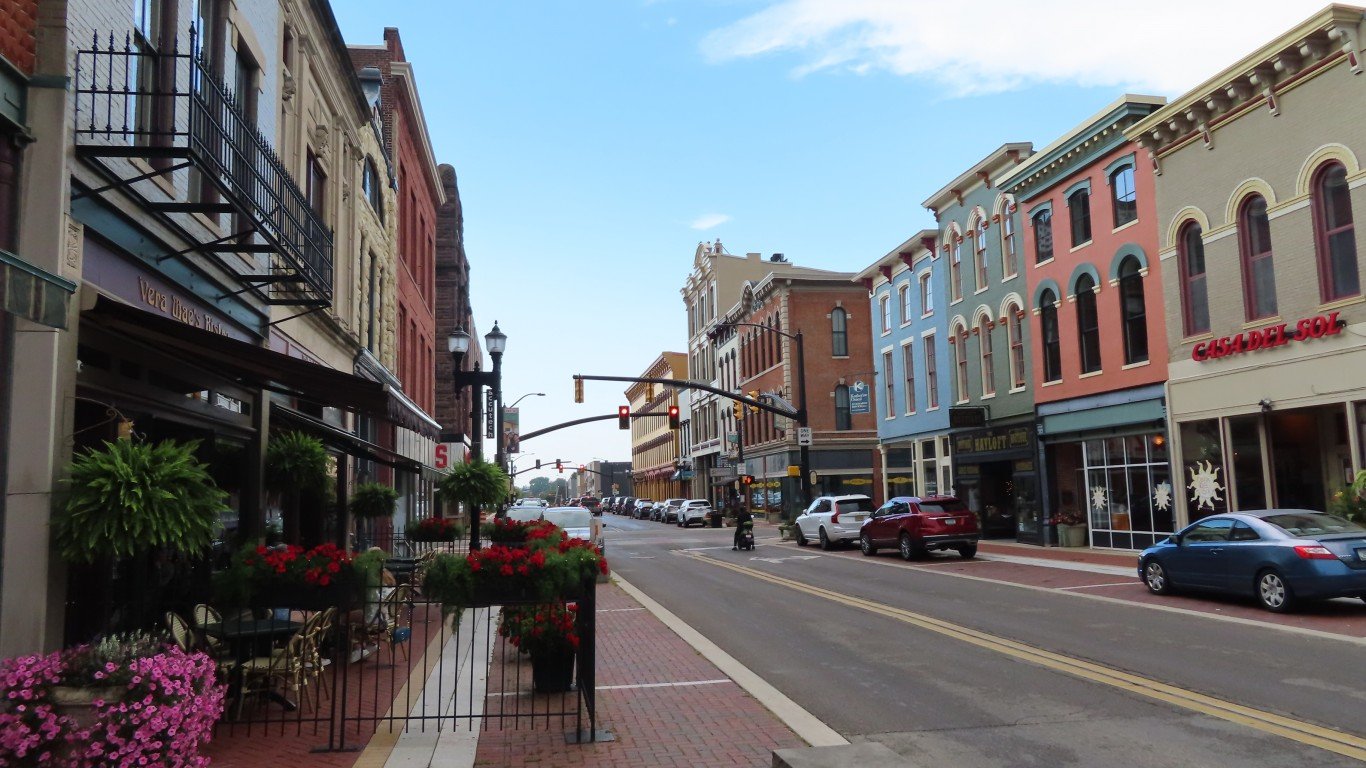
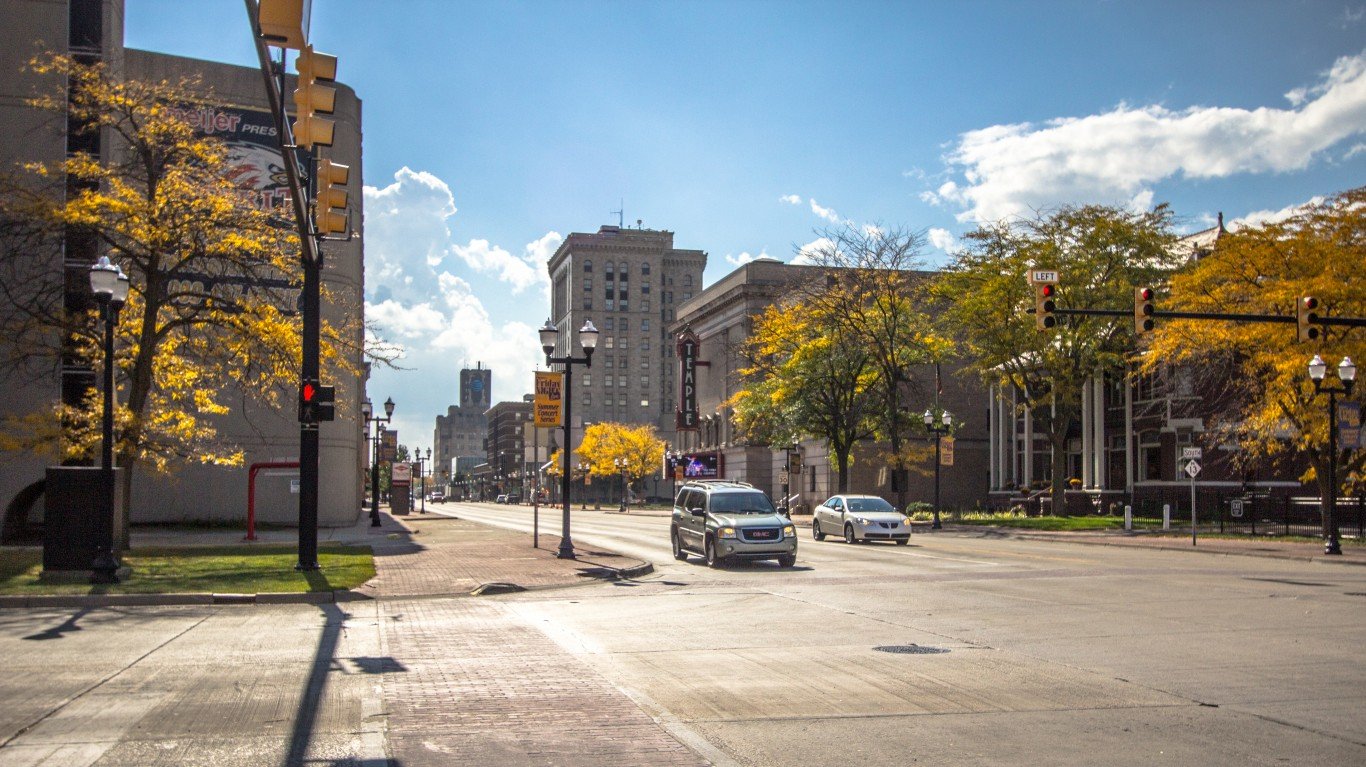
Indiana: Muncie
> Concentrated poverty rate: 26.6% of poor pop. living in poor neighborhoods
> Overall poverty rate: 17.9% (state: 12.6%)
> Neighborhoods in extreme poverty: 5 of 31 tracts
> Avg. household income: $39,382 in poor tracts, $66,633 in all others
In Muncie, Indiana, 26.6% of those living below the poverty line reside in a neighborhood with a poverty rate of 40% or higher — the highest concentrated poverty rate of any metro area in the state.
Americans who live in such extreme poverty face additional hurdles to upward economic mobility, and one of them is often access to jobs. The unemployment rate in Muncie’s poorest neighborhoods is 11.1%, more than double the 4.7% jobless rate in the rest of the city.
[in-text-ad-2]
Iowa: Davenport-Moline-Rock Island, IA-IL
> Concentrated poverty rate: 11.2% of poor pop. living in poor neighborhoods
> Overall poverty rate: 12.6% (state: 10.6%)
> Neighborhoods in extreme poverty: 6 of 109 tracts
> Avg. household income: $38,339 in poor tracts, $79,571 in all others
Iowa’s Davenport metro area has the highest concentrated poverty rate in the state, with 11.2% of poor residents living in neighborhoods where 40% or more of the population live below the poverty line. Across Davenport’s six high-poverty neighborhoods, the average household income is just $38,339, less than half the average income of $79,571 in the rest of the metro area.
Low-income Americans residing in high-poverty neighborhoods tend to have fewer opportunities for upward economic mobility – often partly because of limited access to jobs. In Davenport’s high-poverty neighborhoods, the average unemployment rate stands at 14.5% – more than triple the 4.4% jobless rate in the rest of the metro area.

Kansas: Wichita
> Concentrated poverty rate: 6.1% of poor pop. living in poor neighborhoods
> Overall poverty rate: 12.7% (state: 11.1%)
> Neighborhoods in extreme poverty: 4 of 167 tracts
> Avg. household income: $36,090 in poor tracts, $77,275 in all others
Wichita has the highest concentrated poverty rate of the four metro areas in Kansas. Of the 167 neighborhoods with comparable data in the city, four have poverty rates of at least 40%. These high-poverty neighborhoods are home to 6.1% of the metro area’s poor population, lower than the national concentrated poverty rate of 10.5%..
Across the metro area’s poorest neighborhoods, 12.5% of the labor force are unemployed, more than double the 4.9% unemployment rate in the rest of the metro area. Due in part to the lack of opportunity in these areas, the overall jobless rate in Wichita of 5.0% is the highest of any metro area in the state and well above the 4.0% jobless rate across all of Kansas.
[in-text-ad]
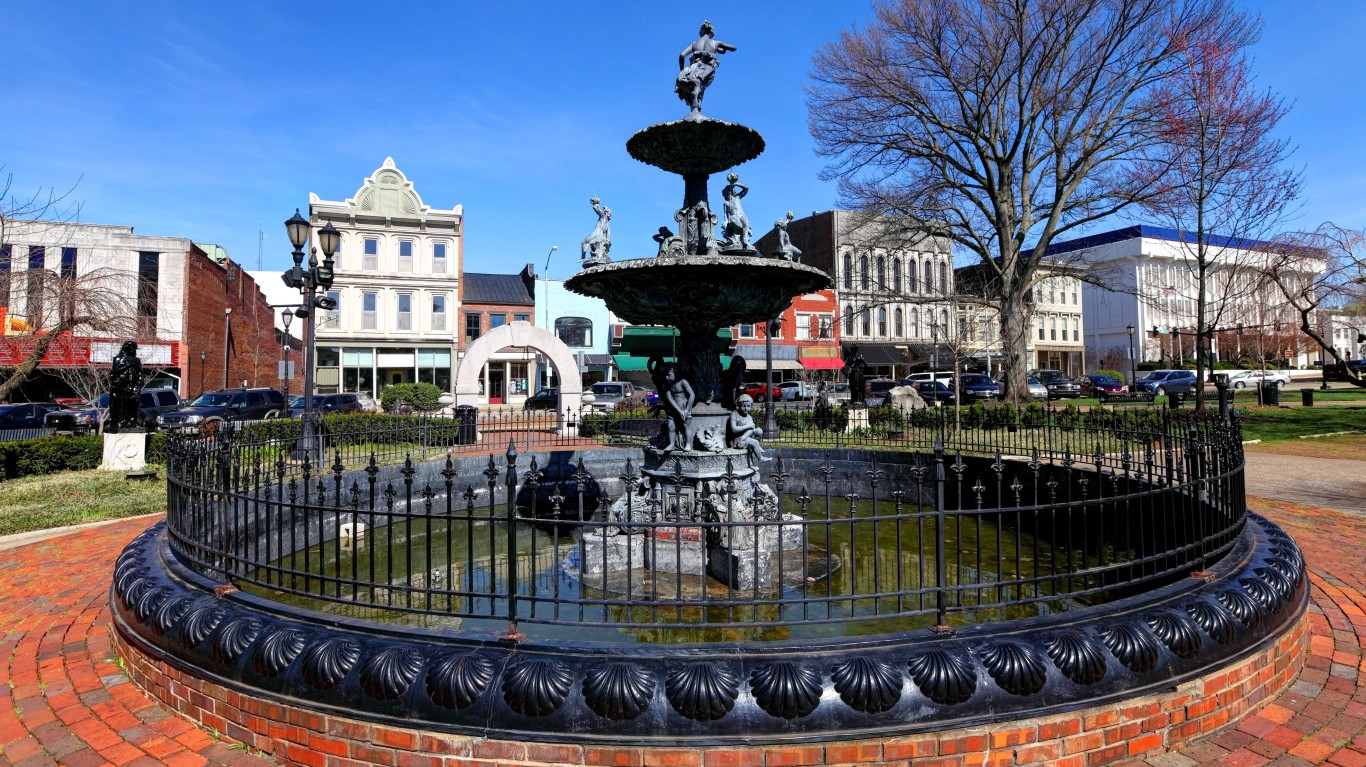
Kentucky: Bowling Green
> Concentrated poverty rate: 20.5% of poor pop. living in poor neighborhoods
> Overall poverty rate: 17.3% (state: 16.4%)
> Neighborhoods in extreme poverty: 4 of 42 tracts
> Avg. household income: $34,400 in poor tracts, $75,728 in all others
Bowling Green has the highest concentrated poverty rate of Kentucky’s five major metropolitan areas, as more than one out of every five poor residents live in neighborhoods where 40% or more of the population live below the poverty line. This amounts to nearly 6,000 residents in total.
Bowling Green has a poverty rate of 17.3%, slightly higher than Kentucky’s overall poverty rate of 16.4%. In Bowling Green’s poor neighborhoods, the average annual household income is $34,400 – less than half of the average income in all other tracts in the metro area.
[recirclink id=1133661]

Louisiana: Monroe
> Concentrated poverty rate: 38.4% of poor pop. living in poor neighborhoods
> Overall poverty rate: 23.4% (state: 18.5%)
> Neighborhoods in extreme poverty: 13 of 59 tracts
> Avg. household income: $31,202 in poor tracts, $69,834 in all others
Monroe has the highest concentrated poverty rate of any metro area in Louisiana, and the third highest of any U.S. metro area. Over 38% of all residents living below the poverty line reside in census tracts in which the poverty rate is 40% or higher. Of the 59 tracts in the Monroe metro area, 13 are considered high-poverty areas – with poverty rates at or above 40%.
Overall, Monroe has the fifth highest poverty rate of all metro areas in the state, at 23.4%. This is well above Louisiana’s 18.5% poverty rate, which itself is the third highest among the 50 states behind Mississippi and New Mexico. Areas with extreme poverty often have limited access to jobs, and Monroe’s poorest areas are no exception. The parts of the metro area with a poverty rate over 40% have an unemployment rate of 14.1%. In the rest of the metro, the unemployment rate is just 3.9%.

Maine: Lewiston-Auburn
> Concentrated poverty rate: 20.3% of poor pop. living in poor neighborhoods
> Overall poverty rate: 11.2% (state: 11.0%)
> Neighborhoods in extreme poverty: 3 of 31 tracts
> Avg. household income: $25,696 in poor tracts, $74,081 in all others
The Lewiston-Auburn metro area is the only major population center in Maine with neighborhoods in which at least 40% of the population live below the poverty line. Though they are larger, the state’s two other metro areas – Portland and Bangor – have no neighborhoods with such concentrated poverty levels.
Even among the cities hit hardest by extreme poverty, Lewiston’s low-income areas have among the most profound economic struggles in the country. In the area’s three neighborhoods with concentrated poverty, the average income is $25,696 – nearly $10,000 lower than the average across all U.S. neighborhoods with at least a 40% poverty rate.
[in-text-ad-2]

Maryland: Baltimore-Columbia-Towson
> Concentrated poverty rate: 9.0% of poor pop. living in poor neighborhoods
> Overall poverty rate: 9.8% (state: 8.9%)
> Neighborhoods in extreme poverty: 20 of 704 tracts
> Avg. household income: $36,237 in poor tracts, $111,105 in all others
The Baltimore area has over 700 total census tracts – just 20 of which have poverty rates of 40% or more. The area’s concentrated poverty rate is relatively low. An estimated 9.0% of residents with poverty-level incomes live in areas with poverty rates of 40% or more. Nationwide, the concentrated poverty rate is 10.5%. Baltimore’s poverty rate of 9.8% is also relatively low compared to the national rate of 13.0%, though it is slightly higher than Maryland’s 8.9% poverty rate.
The difference between incomes in high-poverty parts of Baltimore and the rest of the metro area is stark. The high-poverty tracts have an average annual household income of $36,237, less than a third of the average income across the rest of the metro area of just over $111,000.

Massachusetts: Springfield
> Concentrated poverty rate: 20.6% of poor pop. living in poor neighborhoods
> Overall poverty rate: 14.1% (state: 9.7%)
> Neighborhoods in extreme poverty: 13 of 152 tracts
> Avg. household income: $32,204 in poor tracts, $86,295 in all others
The Springfield area has the highest concentrated poverty rate out of the five major metro areas in Massachusetts. Just over 20% of area residents who live below the poverty line reside in tracts with poverty rates of 40% or more.
Educational attainment levels are highly correlated with income levels, and Springfield’s high-poverty tracts have much lower attainment levels than the rest of the city. In the 13 neighborhoods with extreme poverty, the high school attainment rate is just 62.5%. In tracts with lower poverty rates, almost 90% of adults have at least graduated from high school.
[in-text-ad]
Michigan: Saginaw
> Concentrated poverty rate: 32.4% of poor pop. living in poor neighborhoods
> Overall poverty rate: 17.4% (state: 13.4%)
> Neighborhoods in extreme poverty: 7 of 60 tracts
> Avg. household income: $37,533 in poor tracts, $72,601 in all others
The Saginaw metro area of Central Michigan has a concentrated poverty rate of 32.4% – the highest out of the state’s 13 metro areas with comparable data, and the sixth highest rate in the entire country. Seven of Saginaw’s 60 census tracts have a poverty rate of 40% or more.
Saginaw area households have relatively low incomes, even outside of areas with extreme poverty. The metro area’s average annual household income across all eligible neighborhoods is $68,832, well below the national average of $91,176. In Saginaw neighborhoods with a poverty rate of 40% or greater, the average income is $37,533.
[recirclink id=960630]
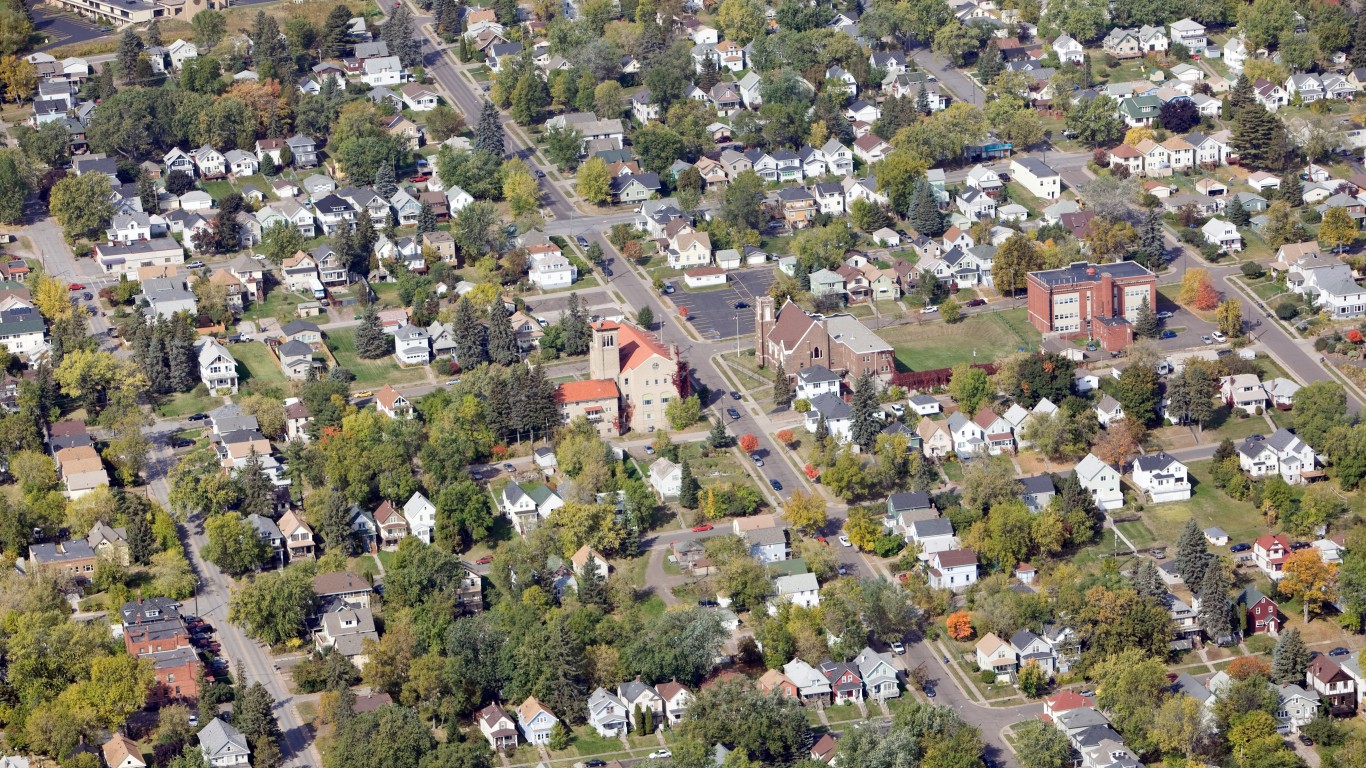
Minnesota: Duluth, MN-WI
> Concentrated poverty rate: 10.9% of poor pop. living in poor neighborhoods
> Overall poverty rate: 12.7% (state: 9.1%)
> Neighborhoods in extreme poverty: 4 of 100 tracts
> Avg. household income: $37,639 in poor tracts, $76,516 in all others
Duluth has the highest concentrated poverty rate of any major metro area in Minnesota, with 10.9% of residents living below the poverty line residing in neighborhoods with poverty rates of 40% or more. There are nearly 35,000 people in Duluth with poverty-level incomes, and almost 3,800 of them live in the four neighborhoods with extreme poverty rates.
Though the 12.7% poverty rate in Duluth is higher than Minnesota’s poverty rate, at 9.1%, it is slightly below the U.S. poverty rate of 13.0%. Poverty and unemployment are closely linked, and in Duluth’s neighborhoods with extreme poverty the unemployment rate is 10.9%, compared to 4.3% unemployment in the rest of the metro area.

Mississippi: Jackson
> Concentrated poverty rate: 24.0% of poor pop. living in poor neighborhoods
> Overall poverty rate: 16.7% (state: 19.4%)
> Neighborhoods in extreme poverty: 19 of 158 tracts
> Avg. household income: $36,281 in poor tracts, $78,557 in all others
Though Jackson has the highest concentrated poverty rate in Mississippi, its overall poverty rate of 16.7% is actually lower than the statewide rate of 19.4%. Nearly a quarter of those with poverty level incomes in Jackson live in neighborhoods with poverty rates of 40% or higher.
Like in most other places, Jackson’s high-poverty tracts tend to have much higher unemployment rates than tracts with poverty rates under 40%. Yet in Jackson, even neighborhoods not struggling with extreme poverty. The unemployment rate is 6.4% in neighborhoods with under 40% poverty rate and 16.8% in neighborhoods with over 40% poverty rate.
[in-text-ad-2]

Missouri: Cape Girardeau, MO-IL
> Concentrated poverty rate: 28.9% of poor pop. living in poor neighborhoods
> Overall poverty rate: 16.3% (state: 12.9%)
> Neighborhoods in extreme poverty: 4 of 25 tracts
> Avg. household income: $32,882 in poor tracts, $70,861 in all others
Cape Girardeau in Missouri’s southeastern corner has the highest concentrated poverty rate of the state’s eight metro areas. Nearly 29% of residents below the poverty line live in neighborhoods with at least a 40% poverty rate. This is the eighth highest concentrated poverty rate in the country, nearly triple the national 10.5% concentrated poverty rate.
Cape Girardeau is one of the smaller metro areas to appear on this list, with 91,525 residents living below the poverty line across the 25 different neighborhoods – four of which have extreme poverty. In these tracts, over 4,000 people live below the poverty line.

Montana: Great Falls
> Concentrated poverty rate: 10.6% of poor pop. living in poor neighborhoods
> Overall poverty rate: 13.5% (state: 12.7%)
> Neighborhoods in extreme poverty: 1 of 25 tracts
> Avg. household income: $35,176 in poor tracts, $71,670 in all others
Of the three metro areas in Montana, Great Falls is the only one with a neighborhood where 40% or more of the population lives below the poverty line. About 11% of the 10,700 people in Great Falls living below the poverty line are concentrated in that single neighborhood.
In the metro area’s single concentrated-poverty area, the five-year average unemployment rate stands at 9.8%, more than double the 3.5% jobless rate in the rest of the metro area.
[in-text-ad]

Nebraska: Lincoln
> Concentrated poverty rate: 9.8% of poor pop. living in poor neighborhoods
> Overall poverty rate: 11.4% (state: 10.3%)
> Neighborhoods in extreme poverty: 2 of 81 tracts
> Avg. household income: $44,992 in poor tracts, $83,848 in all others
Lincoln’s poverty rate of 11.4% is the highest of the three metro areas in Nebraska. Lincoln also has the highest extreme poverty rate in the state, as nearly one in every 10 metro area residents who live below the poverty line reside in a high-poverty neighborhood – where 40% of the total population live in poverty.
Across Lincoln’s two high-poverty neighborhoods, the average household income is just $44,992, well below the average income of $83,848 in the rest of the metro area. Low-income Americans residing in high-poverty neighborhoods tend to be isolated from opportunities for upward mobility – often partly because of limited access to jobs. In Lincoln’s high-poverty neighborhoods, the average unemployment rate is 7.5% – more than double the 3.0% jobless rate in the rest of the metro area.
[recirclink id=1144696]

Nevada: Las Vegas-Henderson-Paradise
> Concentrated poverty rate: 4.7% of poor pop. living in poor neighborhoods
> Overall poverty rate: 13.3% (state: 12.7%)
> Neighborhoods in extreme poverty: 8 of 534 tracts
> Avg. household income: $44,396 in poor tracts, $84,022 in all others
Of the three metropolitan areas in Nevada, Las Vegas is the only one with more than one neighborhood where 40% or more of residents live below the poverty line. The eight neighborhoods in the metro area with concentrated poverty are home to 4.7% of the 293,000 people in Las Vegas who live below the poverty line. Nationwide, 10.5% of the population living in poverty resides in high-poverty areas.
Homeownership is one of the most practical ways to build wealth in the United States. In Las Vegas’ poorest neighborhoods, the homeownership rate is only 13.2%. Meanwhile, across the rest of the city, the homeownership rate stands at 55.5%.

New Hampshire: No metro area with concentrated poverty
> State poverty rate: 7.3%
Manchester-Nashua is the only metropolitan area in New Hampshire, and in every neighborhood in the city, less than 40% of the population live below the poverty line. Manchester’s overall poverty rate of 7.4% is closely in line with the statewide rate of 7.3% – the lowest poverty rate among the 50 states.
The relative lack of financial hardship in Manchester is due in part to a strong job market. Over the last five years, an average of just 4.0% of the labor force were unemployed, below the comparable 5.4% national jobless rate and only slightly higher than the 3.7% rate in New Hampshire. Many employment opportunities in the city appear to be relatively high paying, as the average household income in the area is $104,497.
[in-text-ad-2]

New Jersey: Vineland-Bridgeton
> Concentrated poverty rate: 15.8% of poor pop. living in poor neighborhoods
> Overall poverty rate: 16.0% (state: 9.6%)
> Neighborhoods in extreme poverty: 2 of 41 tracts
> Avg. household income: $39,943 in poor tracts, $81,443 in all others
Vineland-Bridgeton’s poverty rate of 15.8% is the highest of the four metro areas in New Jersey. Vineland also has the highest extreme poverty rate in the state, with 16% of metro area residents who live below the poverty line residing in a high-poverty neighborhood – where 40% of the total population live in poverty.
The income gap between the neighborhood further demonstrates financial hardship in Vineland’s high-poverty neighborhoods. Across the metro area’s two high-poverty neighborhoods, the average household income is just $39,943, less than half the average income of $81,443 in the rest of the metro area.

New Mexico: Las Cruces
> Concentrated poverty rate: 15.9% of poor pop. living in poor neighborhoods
> Overall poverty rate: 24.8% (state: 18.5%)
> Neighborhoods in extreme poverty: 6 of 60 tracts
> Avg. household income: $33,513 in poor tracts, $63,567 in all others
Las Cruces has the highest concentrated poverty rate in New Mexico, at 15.9%. The metro area is one of the poorest in the country, with a 24.8% poverty rate – the third highest in the nation, and nearly double the 13.0% U.S. poverty rate. Of the 60 neighborhoods in the Las Cruces metro area, in six at least 40% of residents live below the poverty line.
Even in Las Cruces neighborhoods without concentrated poverty, incomes are relatively low. These tracts average a $63,567 household income, well below the $92,732 average household income across all U.S. tracts with poverty rates under 40%.
[in-text-ad]

New York: Binghamton
> Concentrated poverty rate: 25.7% of poor pop. living in poor neighborhoods
> Overall poverty rate: 16.5% (state: 13.5%)
> Neighborhoods in extreme poverty: 9 of 67 tracts
> Avg. household income: $47,025 in poor tracts, $75,087 in all others
Binghamton, New York has one of the highest concentrated poverty rates in the U.S. Over one-quarter of residents with poverty-level incomes live in neighborhoods with poverty rates of at least 40%. Out of 67 neighborhoods in the Binghamton area, nine are considered to have extreme poverty levels and are home to nearly 10,000 people living below the poverty line.
Lower-income neighborhoods often have limited access to job opportunities. Binghamton’s neighborhoods with concentrated poverty have an unemployment rate of 15.8%, more than double the unemployment rate across all other neighborhoods in the metro area, at 6.4%.
[recirclink id=1141638]
North Carolina: Goldsboro
> Concentrated poverty rate: 26.3% of poor pop. living in poor neighborhoods
> Overall poverty rate: 18.7% (state: 13.8%)
> Neighborhoods in extreme poverty: 4 of 30 tracts
> Avg. household income: $39,193 in poor tracts, $68,466 in all others
Goldsboro, North Carolina, is one of 18 U.S. metro areas in which more than a quarter of residents live in neighborhoods with at least 40% poverty rates. This 26.3% concentrated poverty rate is by far the highest out of North Carolina’s 13 major metro areas with comparable data. The next closest is Burlington at 15.1%.
Nearly 6,000 residents live below the poverty line in high-poverty neighborhoods in Goldsboro. The metro area has an overall poverty rate of 18.7%, well above the statewide rate of 13.8%. Though Goldsboro’s unemployment rate of 5.4% is in line with the national rate, incomes tend to be much lower. The average household income across all neighborhoods is $65,694, well below the national average of $91,176.
North Dakota: No metro area with concentrated poverty
> State poverty rate: 10.2%
North Dakota has three major metropolitan areas – Bismarck, Fargo, and Grand Forks. These areas combined have over 100 neighborhoods, none of which have a poverty rate of 40% or higher.
Neighborhoods with concentrated poverty often lack job opportunities, but this is not the case in North Dakota’s population centers. Each metro area has an unemployment rate well below the national rate of 5.4%, including Bismarck, which has the lowest unemployment rate of any major metro area in the country, at 2.4%.
[in-text-ad-2]

Ohio: Toledo
> Concentrated poverty rate: 25.8% of poor pop. living in poor neighborhoods
> Overall poverty rate: 16.0% (state: 13.4%)
> Neighborhoods in extreme poverty: 26 of 220 tracts
> Avg. household income: $31,407 in poor tracts, $77,701 in all others
Multiple metropolitan areas in Ohio have some of the highest rates of concentrated poverty. But of the 11 metro areas in the state, Toledo has the highest rate of concentrated poverty. Over a quarter of the area’s poor population reside in neighborhoods where 40% or more of the population live below the poverty line.
Once an industrial powerhouse, Toledo has been hit hard by deindustrialization and globalization – and the impact of these economic trends is evidenced in the metro area’s 26 high-poverty neighborhoods. In these places, the average household earns just $31,407 a year, less than half the $77,701 average in the rest of the city. Additionally, the unemployment rate in Toledo’s high-poverty areas stands at 14%, compared to 5.5% in the metro area’s remaining neighborhoods.

Oklahoma: Oklahoma City
> Concentrated poverty rate: 7.7% of poor pop. living in poor neighborhoods
> Overall poverty rate: 13.3% (state: 15.1%)
> Neighborhoods in extreme poverty: 12 of 403 tracts
> Avg. household income: $40,296 in poor tracts, $83,134 in all others
Of the four metro areas in Oklahoma, Oklahoma City has the lowest overall poverty rate. However, those who do live below the poverty line in Oklahoma City are more likely to also live in high-poverty areas than low-income residents of the state’s three other metro areas. Oklahoma City’s concentrated poverty rate of 7.7% is the highest in Oklahoma, though it is lower than the comparable national rate of 10.5%.
Lower-income neighborhoods often have limited access to job opportunities. Oklahoma City’s neighborhoods with concentrated poverty have an unemployment rate of 10.1%, more than double the unemployment rate across all other neighborhoods in the metro area, at 4.5%.
[in-text-ad]

Oregon: Salem
> Concentrated poverty rate: 4.3% of poor pop. living in poor neighborhoods
> Overall poverty rate: 13.1% (state: 12.1%)
> Neighborhoods in extreme poverty: 1 of 81 tracts
> Avg. household income: $34,451 in poor tracts, $80,944 in all others
In Salem, Oregon, 4.3% of the population living below the poverty line reside in a high-poverty neighborhood, the largest share of any metro area in the state but well below the national concentrated poverty rate of 10.5%. In Salem’s neighborhood where at least 40% of the population lives below the poverty line, the average household income is just $34,451, less than half the average of $80,944 in the rest of the metro area.
Limited economic opportunities for residents of Salem’s high-poverty neighborhood are attributable in part to poor education outcomes. Fewer than 70% of adults in the area have a high school diploma, compared to nearly 87% of adults in the metro areas’ 80 census tracts where there is no concentrated poverty.
[recirclink id=1135129]

Pennsylvania: Reading
> Concentrated poverty rate: 22.5% of poor pop. living in poor neighborhoods
> Overall poverty rate: 11.7% (state: 11.7%)
> Neighborhoods in extreme poverty: 7 of 106 tracts
> Avg. household income: $38,468 in poor tracts, $88,415 in all others
Of the 18 metropolitan areas spread across Pennsylvania, Reading has the highest concentrated poverty rate. There are 47,500 people in Reading living below the poverty line, and 22.5% of them reside in high-poverty neighborhoods – Reading is the only Pennsylvania metro area with a concentrated poverty rate above 20%.
Despite having the worst economic segregation in the state, Reading does not have an especially large poor population. An estimated 11.7% of metro area residents live below the poverty line, in line with the statewide poverty rate. Additionally, five other metro areas in the state – including Erie, Johnstown, and Scranton – have poverty rates above 13%.

Rhode Island: Providence-Warwick, RI-MA
> Concentrated poverty rate: 2.8% of poor pop. living in poor neighborhoods
> Overall poverty rate: 11.2% (state: 11.5%)
> Neighborhoods in extreme poverty: 4 of 370 tracts
> Avg. household income: $30,999 in poor tracts, $92,952 in all others
Though the Providence metro area ranks as the city with the highest extreme poverty rate in Rhode Island, this is only because it is the state’s only major metropolitan area. Only four of its 370 tracts of land have poverty rates of 40% or higher.
Just 2.8% of total area residents with incomes below the poverty line live in these lower-income tracts – well below the national concentrated poverty rate of 10.5%. Providence’s overall poverty rate of 11.2% is also slightly lower than the state rate of 11.5%.
[in-text-ad-2]

South Carolina: Sumter
> Concentrated poverty rate: 21.3% of poor pop. living in poor neighborhoods
> Overall poverty rate: 19.0% (state: 14.5%)
> Neighborhoods in extreme poverty: 4 of 38 tracts
> Avg. household income: $39,483 in poor tracts, $62,752 in all others
With a poverty rate of 19%, Sumter is the poorest metro area in South Carolina. It also has the highest concentrated poverty rate in the state, at 21.3%.
Upward economic mobility is often more difficult in high-poverty areas, and in Sumter’s four neighborhoods where 40% or more of the population live below the poverty line, unemployment stands at 15.4%, compared to 8.6% in the rest of the metro area. As is often the case in high-poverty areas, Sumter’s poor neighborhoods have below-average educational outcomes. Only about 11% of adults in the metro area’s high poverty neighborhoods have a bachelor’s degree or higher, compared to over 20% of adults in the rest of the city.
South Dakota: No metro area with concentrated poverty
> State poverty rate: 12.6%
Neither of South Dakota’s two metro areas, Rapid City and Sioux Falls, have a single neighborhood with poverty rates of at least 40%. Neighborhoods with concentrated poverty often have few job opportunities, but Rapid City and Sioux Falls both have among the lowest unemployment rates in the country – 3.7% and 2.6%, respectively. The comparable nationwide unemployment rate is 5.4%.
Though South Dakota has no major metro areas with concentrated poverty, it is home to several of the poorest counties in the U.S. These rural counties often cover parts of Native American reservations, home to some of the most economically marginalized groups, where poverty rates sometimes exceed 50% for the entire county.
[in-text-ad]
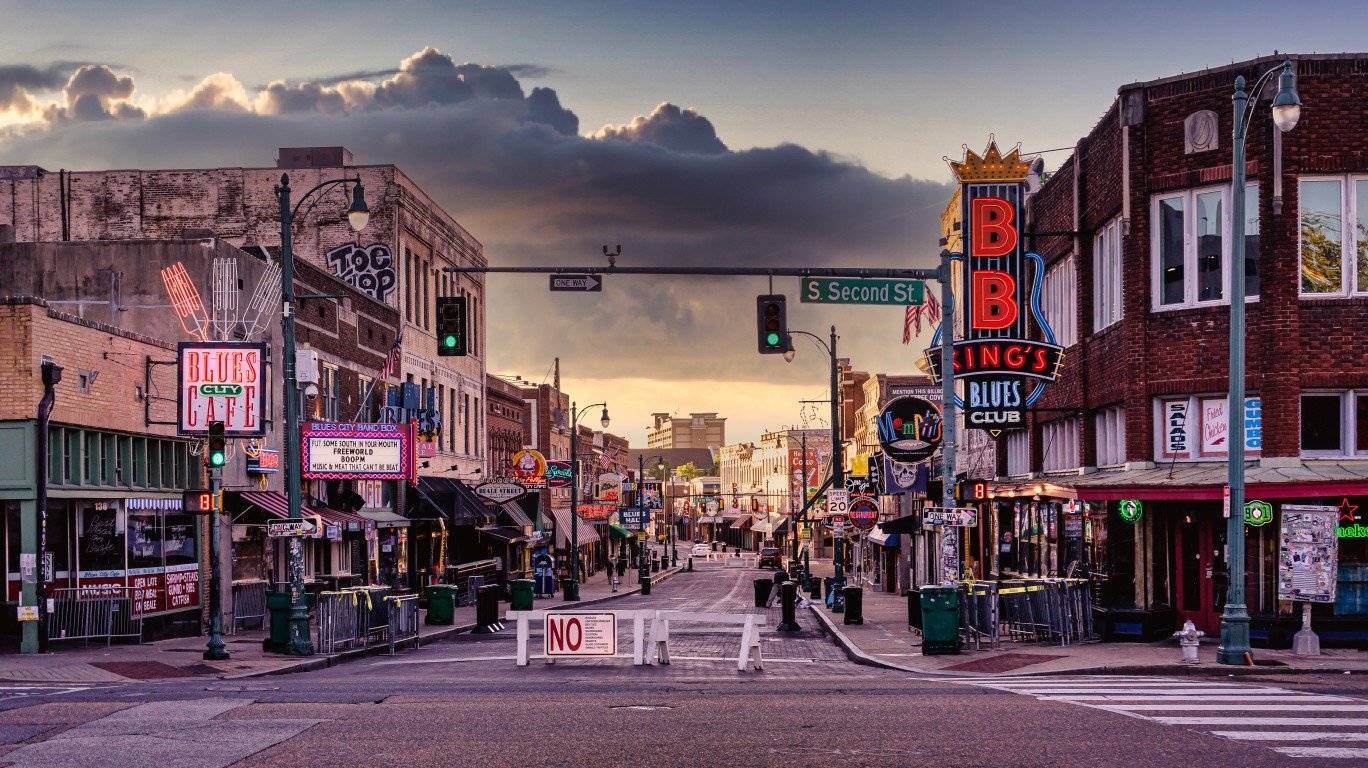
Tennessee: Memphis, TN-MS-AR
> Concentrated poverty rate: 23.8% of poor pop. living in poor neighborhoods
> Overall poverty rate: 17.3% (state: 14.5%)
> Neighborhoods in extreme poverty: 44 of 348 tracts
> Avg. household income: $33,324 in poor tracts, $82,044 in all others
Memphis has the highest concentrated poverty rate among the nine Tennessee metro areas with comparable data. Nearly 24% of impoverished Memphis residents live in high-poverty neighborhoods – more than double the national concentrated poverty rate, 10.5%.
Memphis has 44 neighborhoods with poverty rates of at least 40%, the eighth highest total in the country. Over 110,000 residents with poverty-level incomes live in these tracts. Like many other areas, the Memphis neighborhoods with high poverty levels have high rates of unemployment. The 16.5% average jobless rate across these tracts in Memphis is more than double the 6.2% unemployment rate across the rest of the metro area’s neighborhoods.
[recirclink id=1133661]
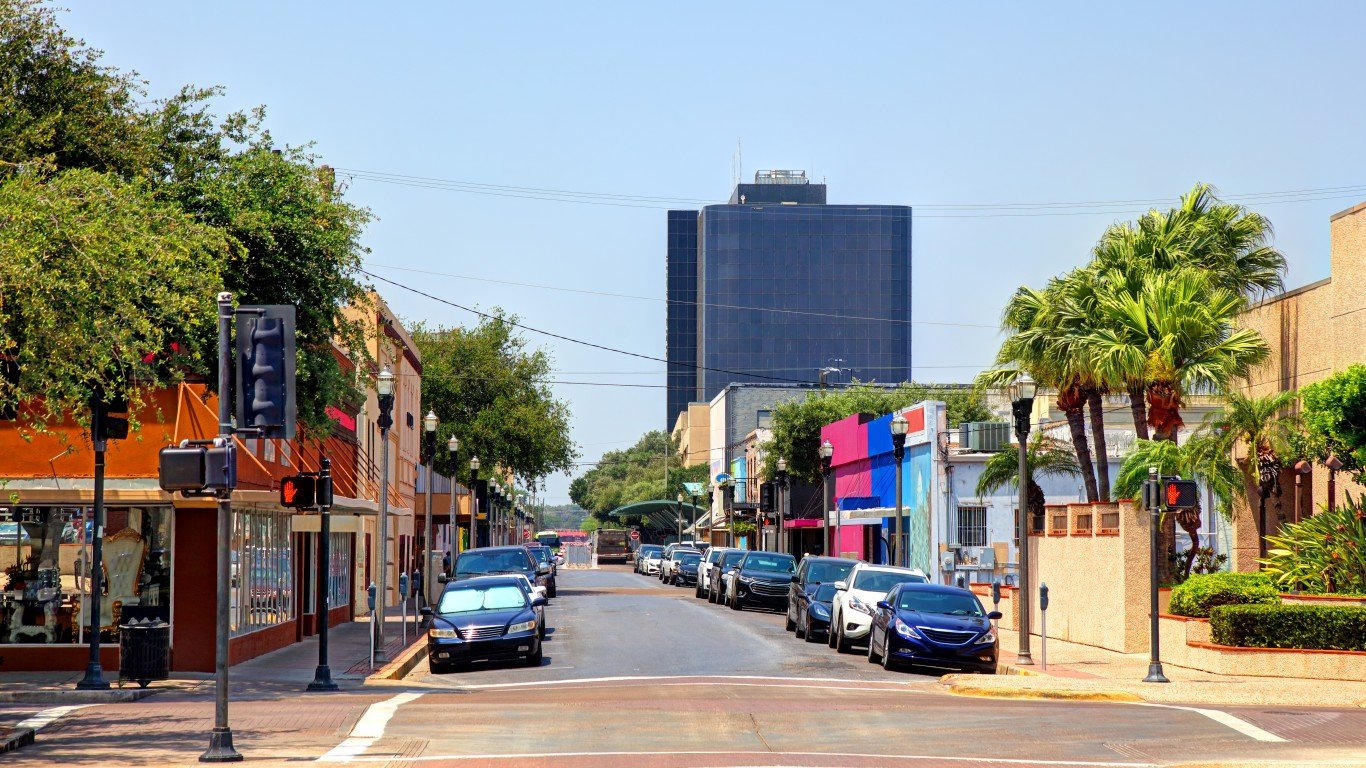
Texas: McAllen-Edinburg-Mission
> Concentrated poverty rate: 35.3% of poor pop. living in poor neighborhoods
> Overall poverty rate: 28.4% (state: 14.1%)
> Neighborhoods in extreme poverty: 45 of 210 tracts
> Avg. household income: $40,943 in poor tracts, $63,944 in all others
The McAllen metro area near the southern tip of Texas is one of just four major metro areas in the U.S. in which more than one-third of people living below the poverty line are concentrated in neighborhoods with poverty rates of 40% or more. More than one in five neighborhoods in the area are in extreme poverty, and over 85,000 people live below the poverty line in these neighborhoods.
The McAllen metro area has by far the highest poverty rate in the country at 28.4% – more than double the U.S. poverty rate of 13.0%. It is one of the only four major metro areas with an average household income under $60,000 per year. Employment and poverty are closely linked, and the McAllen metro area has an unemployment rate of 7.3% – nearly 2 percentage points higher than the U.S. unemployment rate.

Utah: No metro area with concentrated poverty
> State poverty rate: 8.6%
None of Utah’s four metro areas with comparable data have even one neighborhood with a poverty rate of 40% or higher. The state’s fifth metro area, Logan, was not considered because it is home to Utah State University. Students living there and attending class full time instead of working would technically have poverty-level incomes, so such areas were excluded from consideration.
Overall, average household incomes in Utah’s metro areas are not especially low, and all five metro areas have an unemployment rate of less than 4.0%. The national unemployment rate is 5.4%. All five major metro areas also have poverty rates lower than the 13.0% national rate.
[in-text-ad-2]
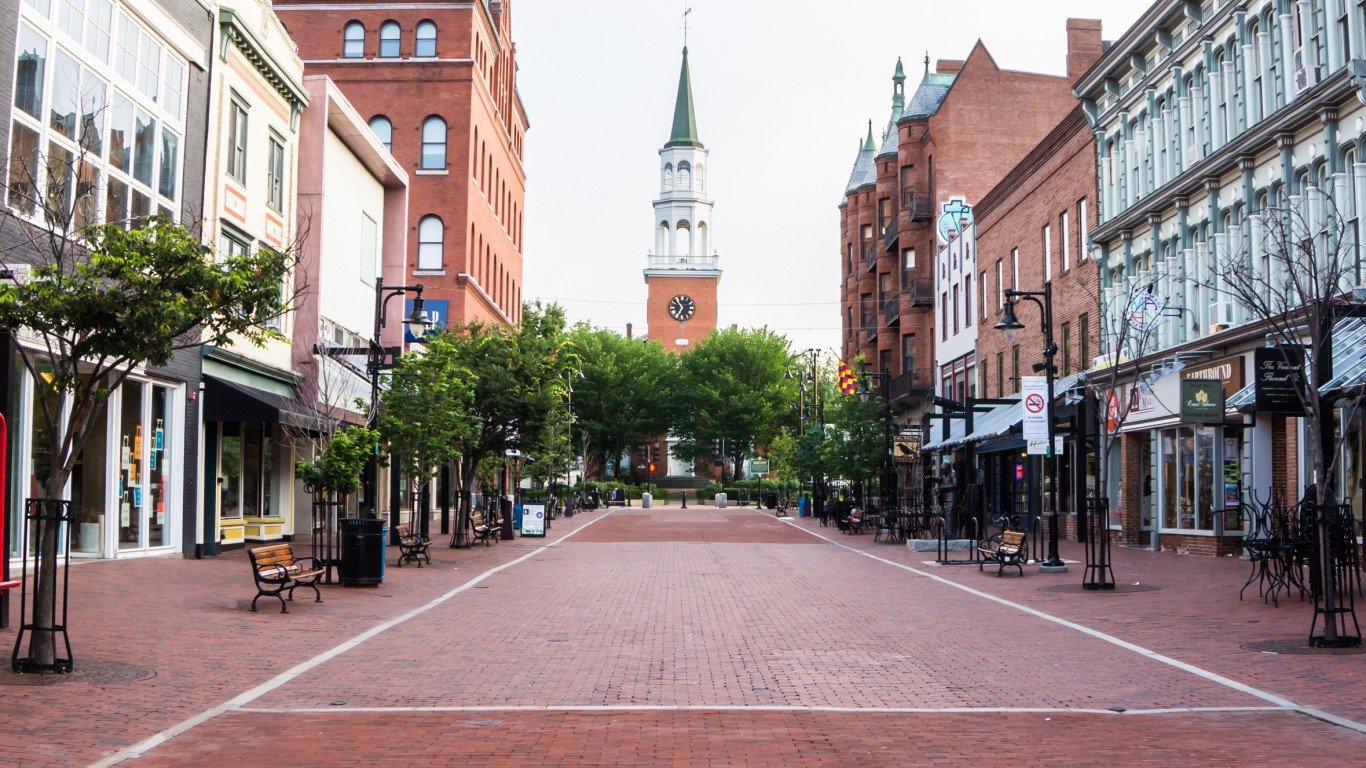
Vermont: No metro area with concentrated poverty
> State poverty rate: 10.4%
Vermont’s only major metro area is the Burlington metro area. None of its 50 neighborhoods have poverty rates of 40% or above. Burlington’s poverty rate of 9.7% is lower than both Vermont’s poverty rate of 10.4%, and the national poverty rate of 13.0%.
Educational attainment levels are closely associated with income and poverty levels, and Burlington area residents have some of the highest educational attainment levels in the nation. An estimated 46.1% of area residents 25 and older hold at least a bachelor’s degree, the 17th highest share of U.S. metro areas.

Virginia: Roanoke
> Concentrated poverty rate: 14.0% of poor pop. living in poor neighborhoods
> Overall poverty rate: 12.5% (state: 9.8%)
> Neighborhoods in extreme poverty: 3 of 78 tracts
> Avg. household income: $36,667 in poor tracts, $79,844 in all others
There are three neighborhoods in Roanoke, Virginia, where 40% or more of the population lives below the poverty line. These places are home to 14% of the 38,000 metro area residents living in poverty. High poverty in these neighborhoods is partially attributable to poor education outcomes, as fewer than three in every four adults have a high school diploma, compared to more than nine in every 10 adults in the rest of the metro area.
High poverty in these places is also attributable to a lack of economic opportunity. Roanoke’s neighborhoods with concentrated poverty have an unemployment rate of 8.4%, compared to the unemployment rate across all other neighborhoods in the metro area of 4.5%.
[in-text-ad]

Washington: Spokane-Spokane Valley
> Concentrated poverty rate: 6.8% of poor pop. living in poor neighborhoods
> Overall poverty rate: 12.7% (state: 10.0%)
> Neighborhoods in extreme poverty: 4 of 143 tracts
> Avg. household income: $43,113 in poor tracts, $80,821 in all others
Poverty is more highly concentrated in Spokane than any other metropolitan area with comparable data in Washington state. There are some 68,000 metro area residents living below the poverty line, and 6.8% of them reside in high-poverty neighborhoods, a lower rate than the national concentrated poverty rate of 10.5%.
Historically, homeownership has been one of the most practical ways to build wealth in the United States, but in Spokane’s poorest neighborhoods, few residents own their home. The average homeownership rate in concentrated poverty neighborhoods in the city is just 15.6%, compared to the 65.8% homeownership rate across the metro area’s other neighborhoods.
[recirclink id=960630]

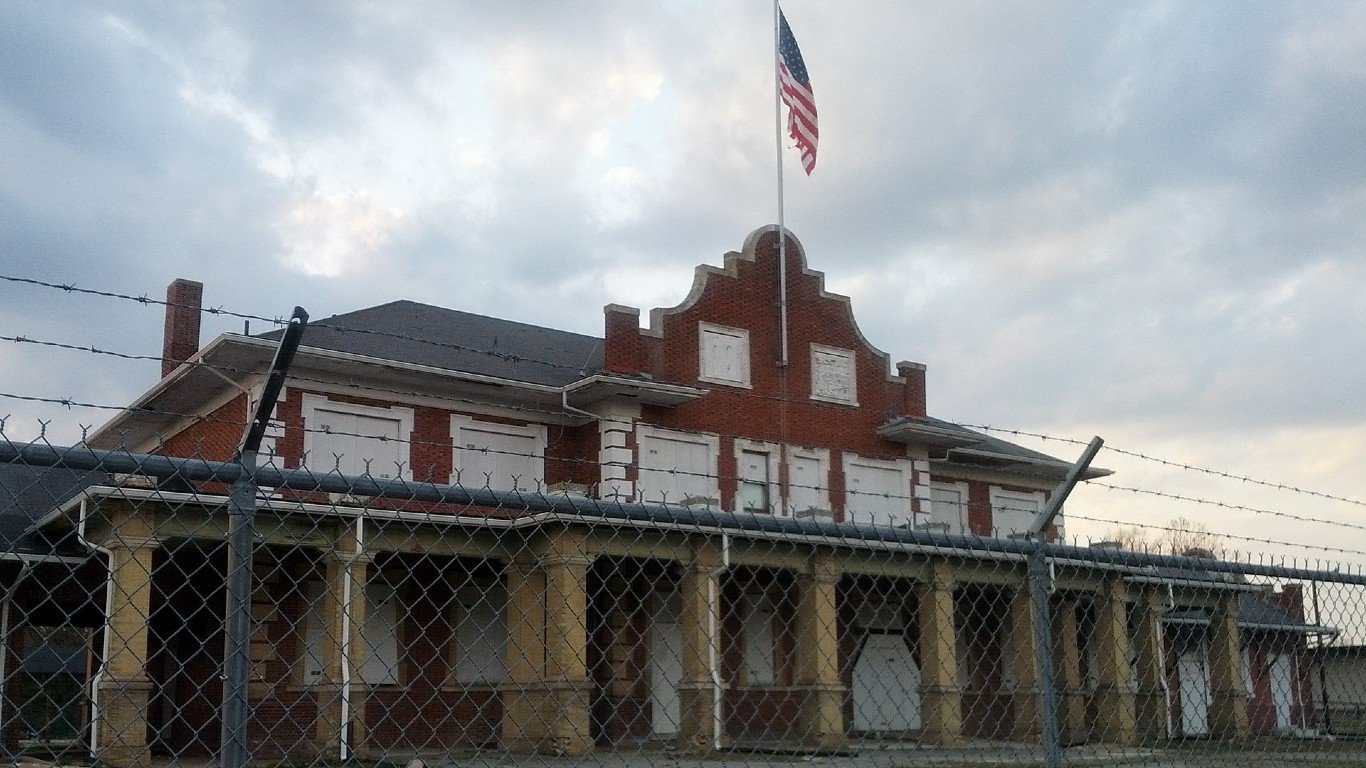
West Virginia: Huntington-Ashland, WV-KY-OH
> Concentrated poverty rate: 11.7% of poor pop. living in poor neighborhoods
> Overall poverty rate: 18.3% (state: 16.8%)
> Neighborhoods in extreme poverty: 8 of 106 tracts
> Avg. household income: $34,885 in poor tracts, $66,448 in all others
West Virginia’s Huntington-Ashland metro area has the highest concentrated poverty rate in the state. An estimated 11.7% of the local population living below the poverty line reside in one of eight area neighborhoods in which 40% of the population or more also live in poverty. The Charleston metro area has the second highest concentrated poverty rate in the state, at 8.5%.
Widespread financial hardship in Huntington-Ashland’s poorest communities means a large share of the population depend on government assistance to afford basic necessities. Over a quarter of all residents of high poverty communities in the metro area receive SNAP benefits, compared to 16.4% of residents in the rest of the metro area.

Wisconsin: Milwaukee-Waukesha
> Concentrated poverty rate: 17.4% of poor pop. living in poor neighborhoods
> Overall poverty rate: 12.8% (state: 10.5%)
> Neighborhoods in extreme poverty: 34 of 444 tracts
> Avg. household income: $34,850 in poor tracts, $90,808 in all others
There are a dozen metro areas in Wisconsin, and most of them have no neighborhoods with poverty rates of 40% or higher. Of those that do, Milwaukee has the worst economic segregation, with 17.4% of the poor population living in high-poverty neighborhoods. Overall, 34 of the 444 neighborhoods with comparable data in Milwaukee have poverty rates of 40% or higher.
Areas with high concentrations of poverty typically have fewer opportunities for local residents to improve their financial situation. In Milwaukee’s poorest communities, 9.6% of the labor force are unemployed, more than double the 4.0% jobless rate in the rest of the metro area.
[in-text-ad-2]
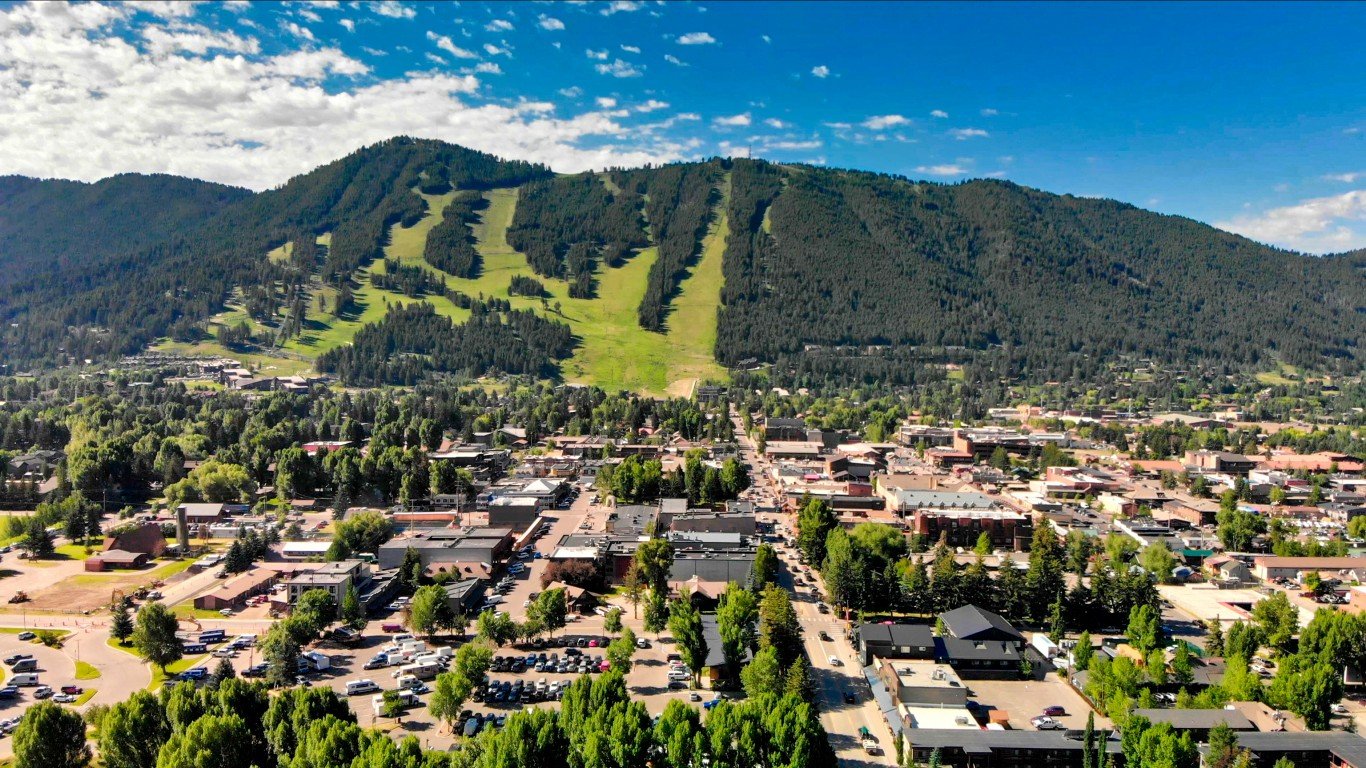
Wyoming: No metro area with concentrated poverty
> State poverty rate: 10.7%
Wyoming has two metro areas, Casper and Cheyenne. Neither population center has a single neighborhood with a 40% or higher poverty rate.
Both Wyoming metro areas have relatively strong job markets, with unemployment rates under 5.0%. Casper and Cheyenne have average incomes slightly lower than the national mean of $91,176, but both metro areas also have poverty rates of less than 10%.
Methodology
To identify the city hit hardest by extreme poverty in every state, 24/7 Wall St. reviewed five-year data on concentrated poverty from the U.S. Census Bureau’s 2020 American Community Survey. Metropolitan areas were ranked based on the share of poor residents who live in extreme poverty neighborhoods — census tracts with a poverty rate of 40% or higher. This measure is called the extreme or concentrated poverty rate and is calculated by aggregating data from the census tract level to the metropolitan area level.
In our analysis, we only considered census tracts with at least 500 people and college or graduate school enrollment below 50%. Metro areas were also excluded if over 25% of the population in tracts or neighborhoods of concentrated poverty were college or university students. Data was aggregated using boundary definitions for March 2020 from the Census Bureau.
All other data referenced, including educational attainment, homeownership, internet access, SNAP benefit recipiency, average household income, and unemployment are also from the 2020 ACS. Figures were aggregated from the census tract to the metropolitan level.
Contact [email protected] for any questions or corrections.