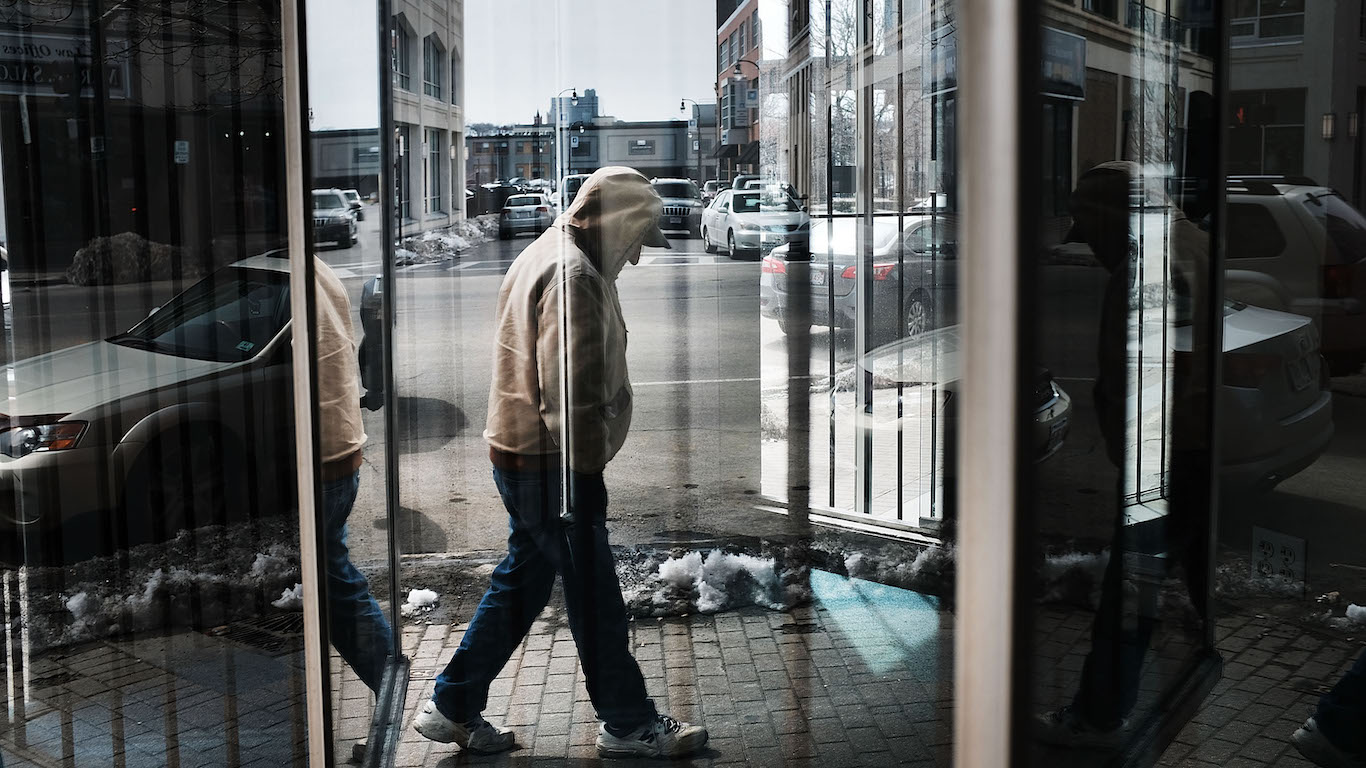
An estimated 41 million Americans are living below the poverty line, and the economic pressures they face impact nearly all aspects of day-to-day life. The hardships associated with poverty – which, in the continental U.S., is defined as an income of under $30,000 a year for a family of four – can harm everything, from relationships with friends and family to mental and physical health outcomes.
Fortunately, millions of Americans escape poverty each year. But for those suffering from serious financial hardship, and also residing within a high-poverty community, opportunities for upward mobility are strikingly limited.
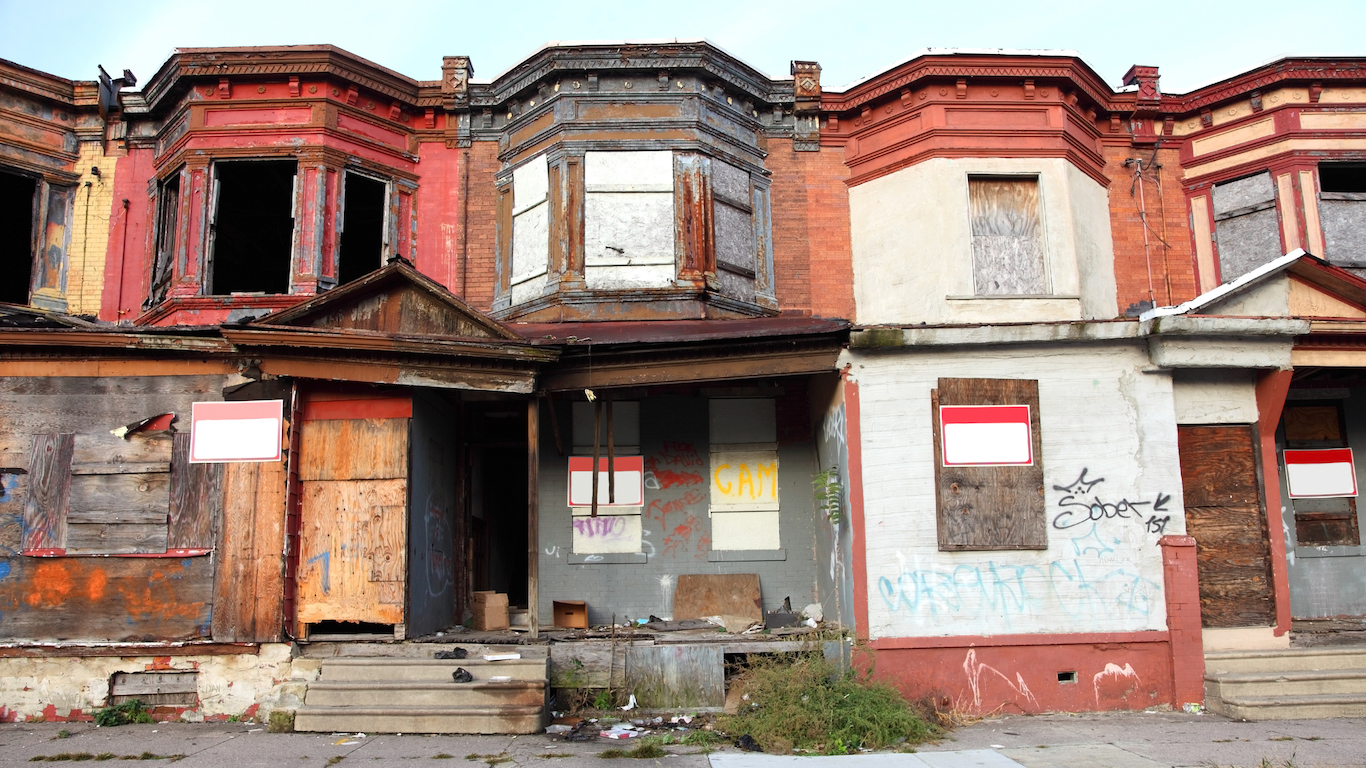
Neighborhoods or tracts with poverty rates of 40% or higher typically report widespread unemployment, high crime rates, substandard schools, and limited access to quality health care and other essential services. For the poorest residents of these areas, the personal hardships associated with poverty are compounded by the broader, communal effects of geographically concentrated poverty.
Using data from the U.S. Census Bureau, 24/7 Wall St. identified the metro area in each state hit hardest by extreme poverty. Metro areas within each state were ranked based on the share of residents with poverty-level incomes who also live in concentrated poverty neighborhoods — census tracts with poverty rates of 40% or higher. Due to data limitations, extreme poverty rates were not calculable for metro areas within Connecticut.
In all but six states, there is at least one metro area with a neighborhood where the poverty rate exceeds 40%. It is important to note that Rhode Island is home to only one metro area, which ranks as having the highest extreme poverty rate in the state by default only.
Not only do the metro areas on this list have a relatively high degree of economic segregation, but they also tend to have larger poor populations overall. In 36 of the 43 metro areas on this list, the overall poverty rate exceeds the poverty rate statewide. (Here is a look at the American cities with the highest poverty rates.)
In some of these metro areas, more than one in every four people living on poverty-level incomes reside in a concentrated poverty neighborhood. In over a dozen metro areas on this list, the typical household within a high-poverty neighborhood earns over $50,000 less per year than a typical household across the rest of the city. (Here is a look at the city with the poorest middle class in every state.)
Here is the city hit hardest by extreme poverty in every state.
Alabama: Gadsden, AL
- Concentrated poverty rate: 19.9% of poor pop. living in poor neighborhoods
- Overall poverty rate: 16.0% (state: 15.8%)
- Neighborhoods in extreme poverty: 4 of 33 tracts
- Avg. household income: $34,569 in poor tracts, $66,224 in all others
Alaska: Anchorage, AK

- Concentrated poverty rate: 6.3% of poor pop. living in poor neighborhoods
- Overall poverty rate: 9.6% (state: 10.4%)
- Neighborhoods in extreme poverty: 1 of 83 tracts
- Avg. household income: $53,753 in poor tracts, $110,504 in all others
Arizona: Flagstaff, AZ
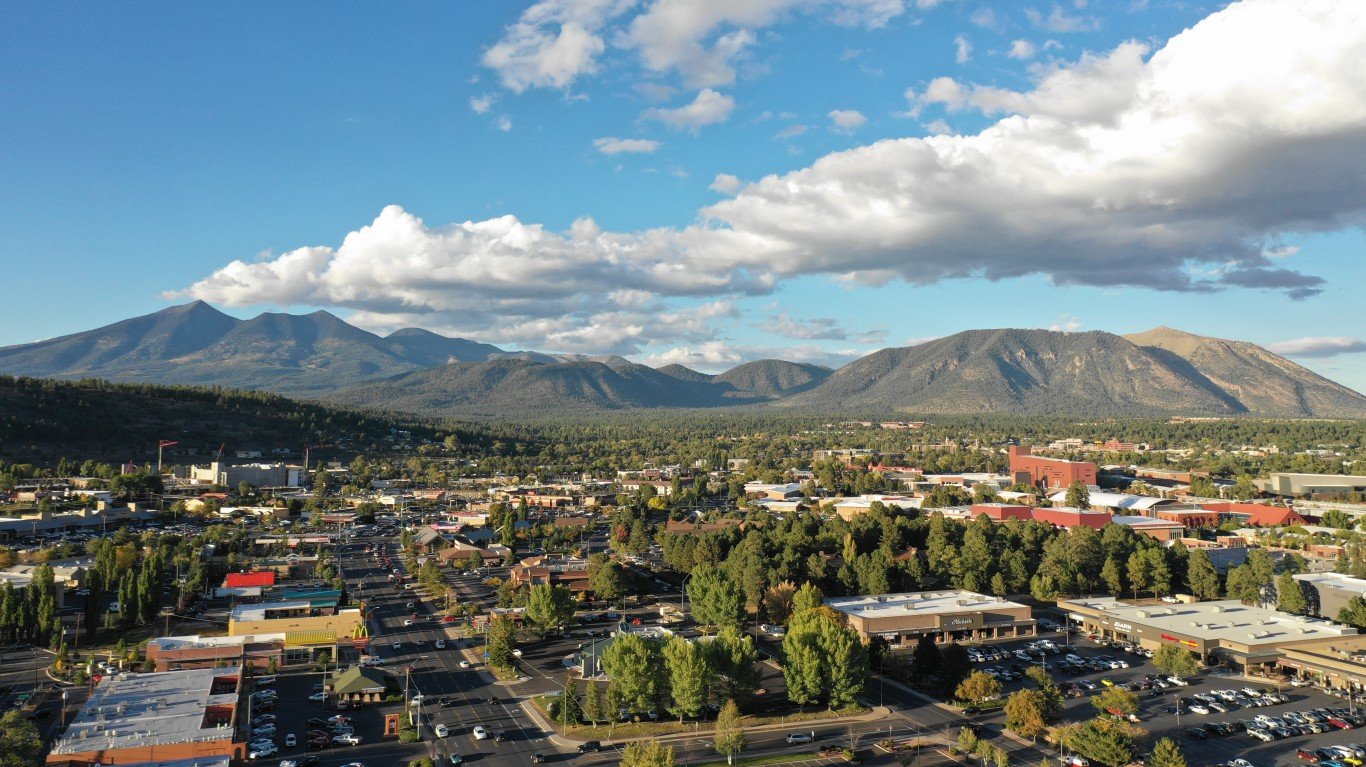
- Concentrated poverty rate: 13.9% of poor pop. living in poor neighborhoods
- Overall poverty rate: 17.6% (state: 13.5%)
- Neighborhoods in extreme poverty: 1 of 35 tracts
- Avg. household income: $48,360 in poor tracts, $87,302 in all others
Arkansas: Jonesboro, AR

- Concentrated poverty rate: 13.3% of poor pop. living in poor neighborhoods
- Overall poverty rate: 18.3% (state: 16.0%)
- Neighborhoods in extreme poverty: 2 of 30 tracts
- Avg. household income: $43,045 in poor tracts, $73,125 in all others
California: Chico, CA
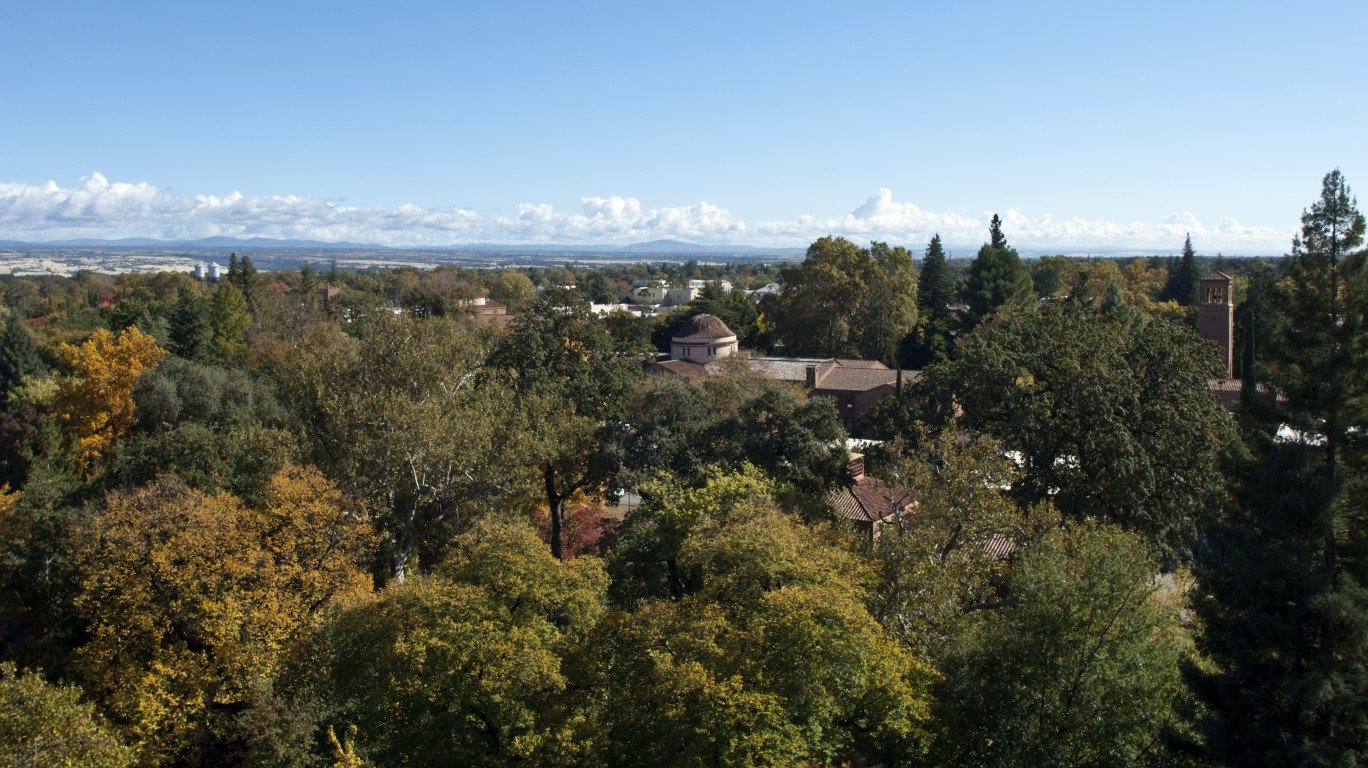
- Concentrated poverty rate: 22.2% of poor pop. living in poor neighborhoods
- Overall poverty rate: 17.7% (state: 12.3%)
- Neighborhoods in extreme poverty: 4 of 53 tracts
- Avg. household income: $55,484 in poor tracts, $88,233 in all others
Colorado: Pueblo, CO
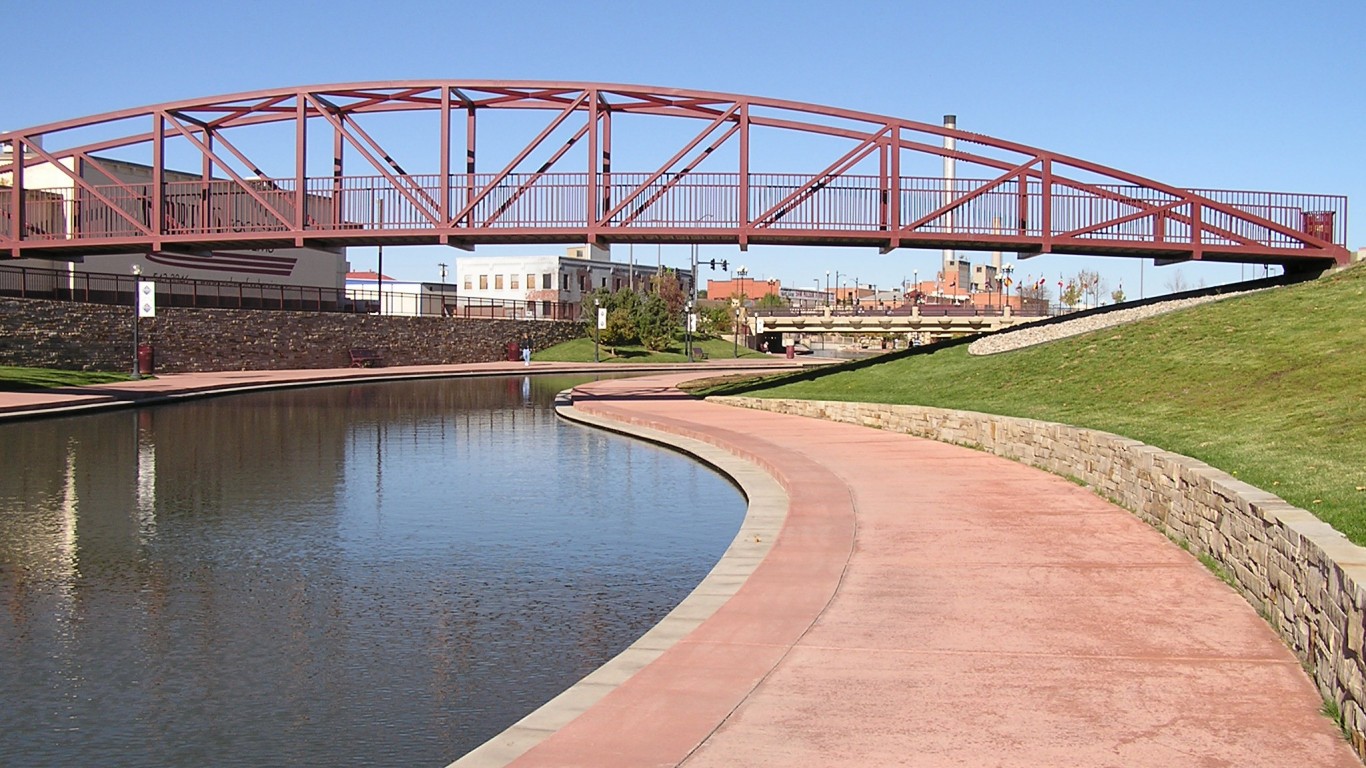
- Concentrated poverty rate: 11.8% of poor pop. living in poor neighborhoods
- Overall poverty rate: 17.2% (state: 9.6%)
- Neighborhoods in extreme poverty: 3 of 56 tracts
- Avg. household income: $36,620 in poor tracts, $71,277 in all others
Connecticut: No eligible metro area with concentrated poverty

- State poverty rate: 10.0%
Delaware: No eligible metro area with concentrated poverty

- State poverty rate: 11.5%
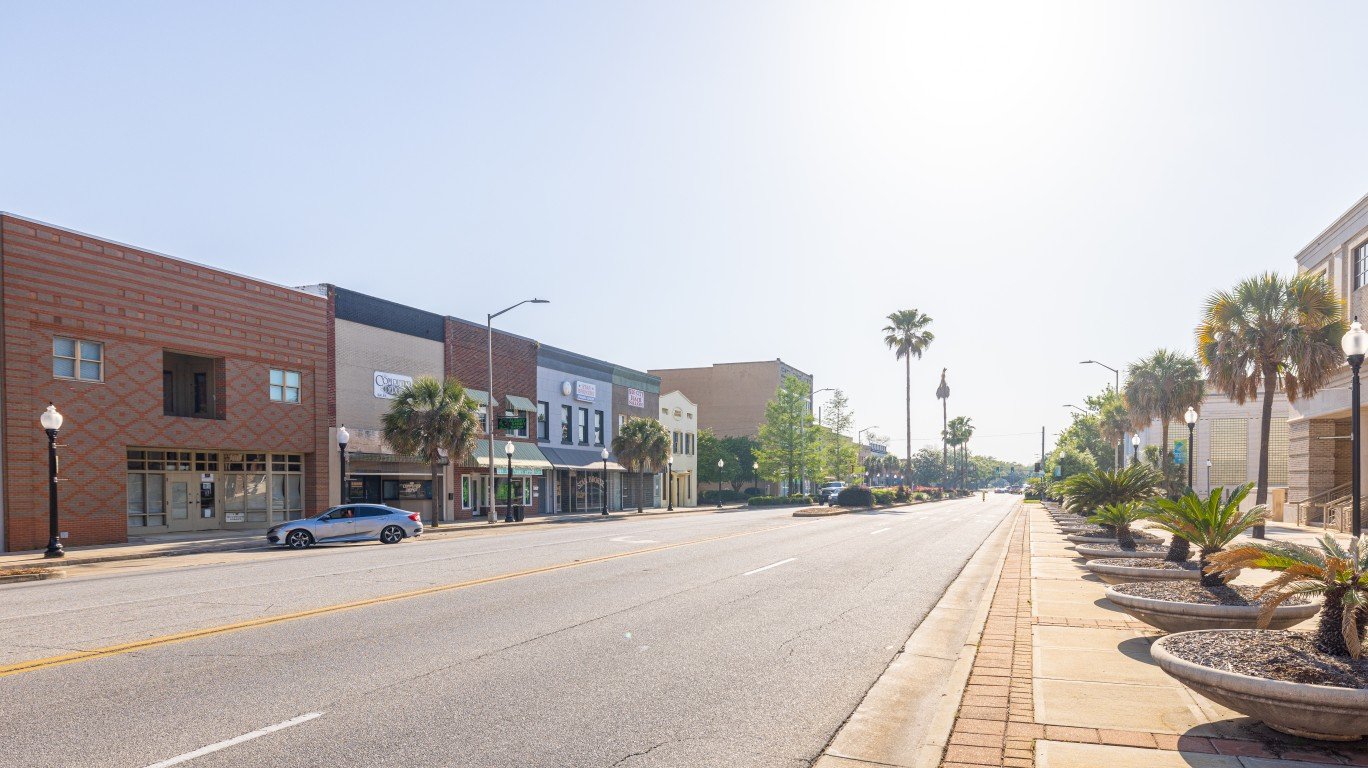
Florida: Tallahassee, FL

- Concentrated poverty rate: 30.6% of poor pop. living in poor neighborhoods
- Overall poverty rate: 18.7% (state: 13.1%)
- Neighborhoods in extreme poverty: 11 of 92 tracts
- Avg. household income: $35,695 in poor tracts, $87,928 in all others
Georgia: Albany, GA
- Concentrated poverty rate: 38.4% of poor pop. living in poor neighborhoods
- Overall poverty rate: 21.9% (state: 13.9%)
- Neighborhoods in extreme poverty: 10 of 46 tracts
- Avg. household income: $33,560 in poor tracts, $71,859 in all others
Hawaii: Urban Honolulu, HI
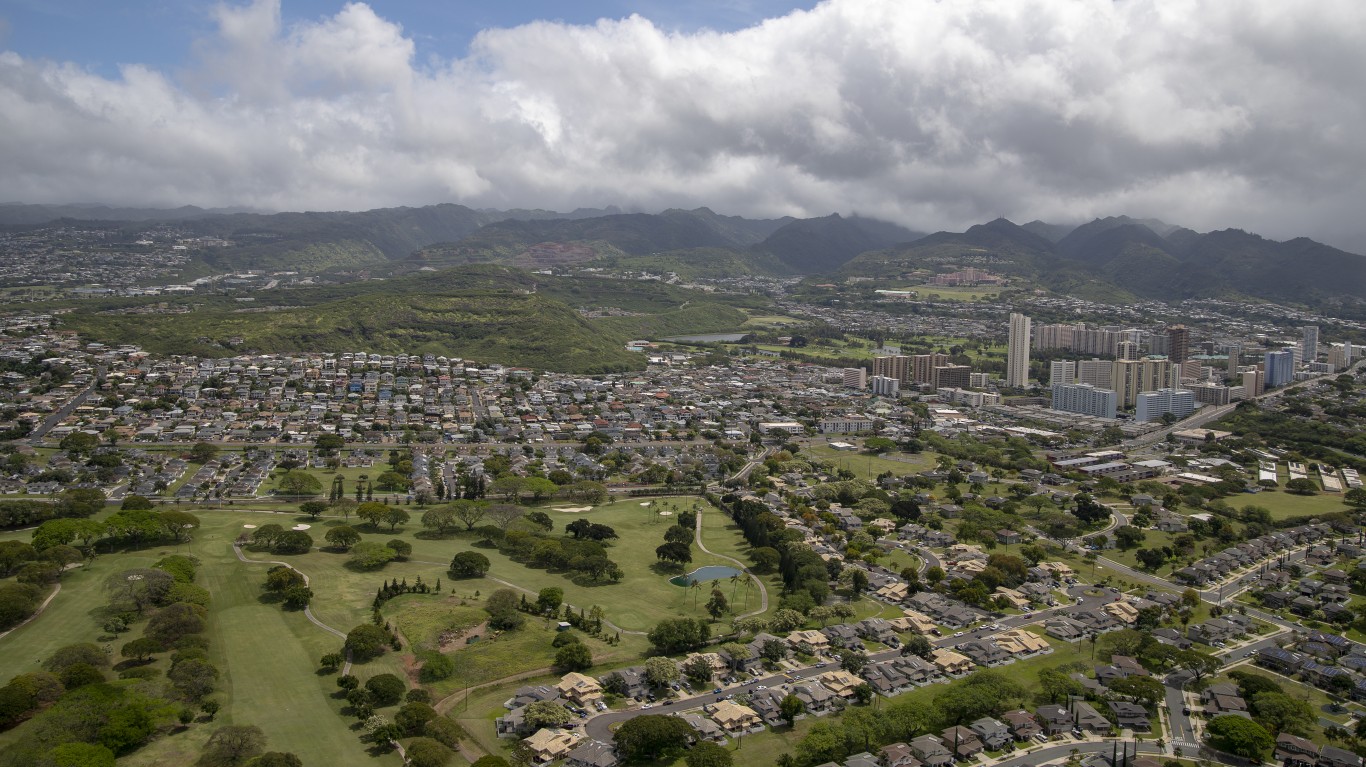
- Concentrated poverty rate: 3.3% of poor pop. living in poor neighborhoods
- Overall poverty rate: 8.6% (state: 9.5%)
- Neighborhoods in extreme poverty: 4 of 313 tracts
- Avg. household income: $55,186 in poor tracts, $118,783 in all others
Idaho: Boise City, ID

- Concentrated poverty rate: 0.8% of poor pop. living in poor neighborhoods
- Overall poverty rate: 9.9% (state: 11.4%)
- Neighborhoods in extreme poverty: 1 of 191 tracts
- Avg. household income: $41,766 in poor tracts, $93,380 in all others
Illinois: Decatur, IL

- Concentrated poverty rate: 24.3% of poor pop. living in poor neighborhoods
- Overall poverty rate: 15.3% (state: 11.8%)
- Neighborhoods in extreme poverty: 6 of 37 tracts
- Avg. household income: $36,175 in poor tracts, $79,668 in all others
Indiana: Muncie, IN
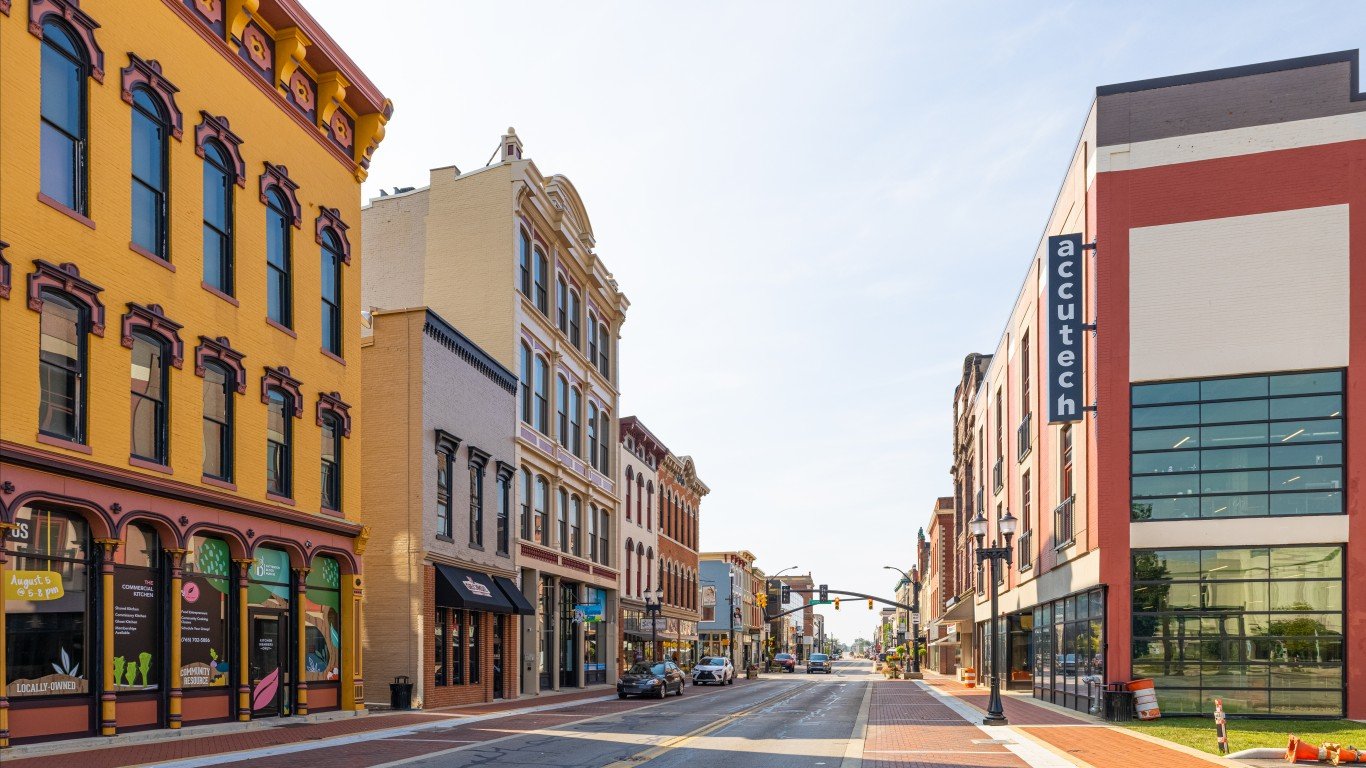
- Concentrated poverty rate: 22.3% of poor pop. living in poor neighborhoods
- Overall poverty rate: 20.6% (state: 12.5%)
- Neighborhoods in extreme poverty: 4 of 31 tracts
- Avg. household income: $37,009 in poor tracts, $70,075 in all others
Iowa: Iowa City, IA
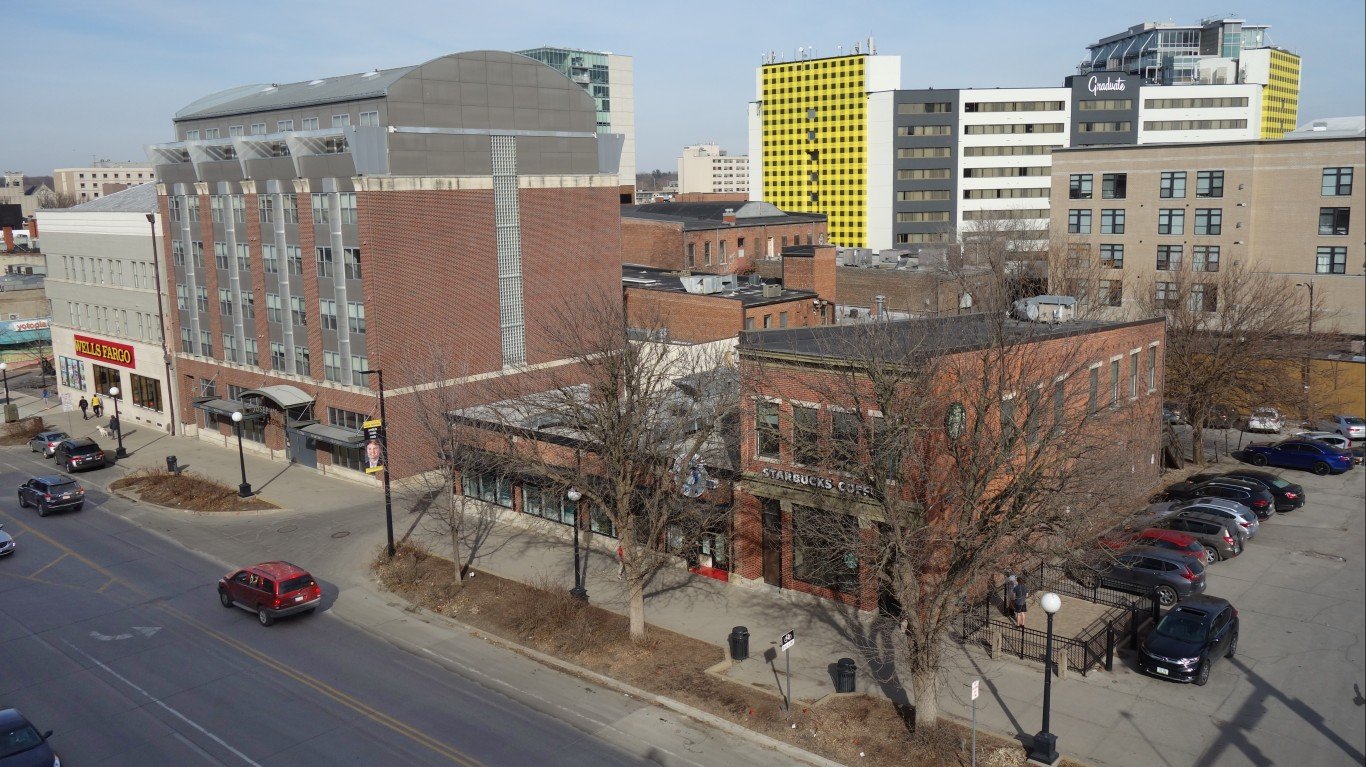
- Concentrated poverty rate: 9.5% of poor pop. living in poor neighborhoods
- Overall poverty rate: 15.4% (state: 11.0%)
- Neighborhoods in extreme poverty: 1 of 37 tracts
- Avg. household income: $53,317 in poor tracts, $99,772 in all others
Kansas: Wichita, KS

- Concentrated poverty rate: 8.6% of poor pop. living in poor neighborhoods
- Overall poverty rate: 12.6% (state: 11.5%)
- Neighborhoods in extreme poverty: 6 of 167 tracts
- Avg. household income: $34,868 in poor tracts, $82,361 in all others
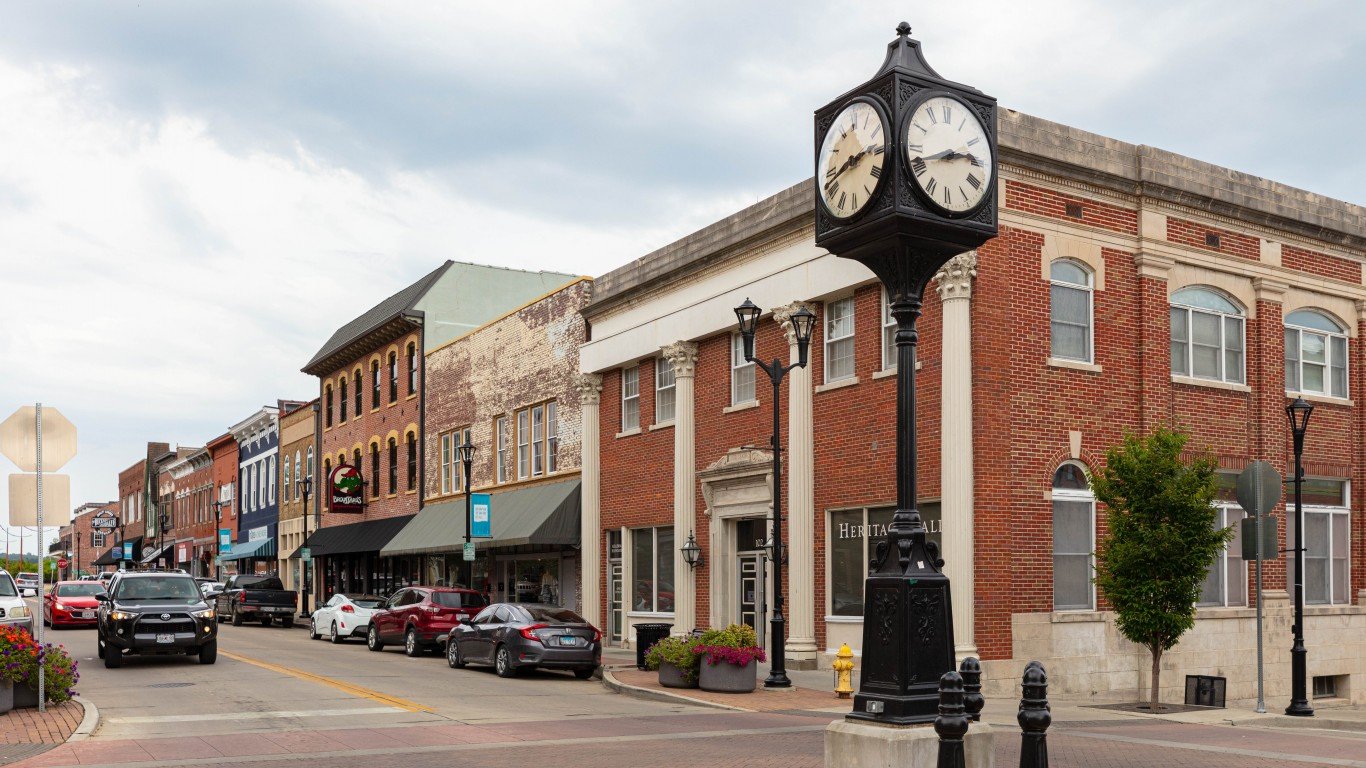
Kentucky: Bowling Green, KY
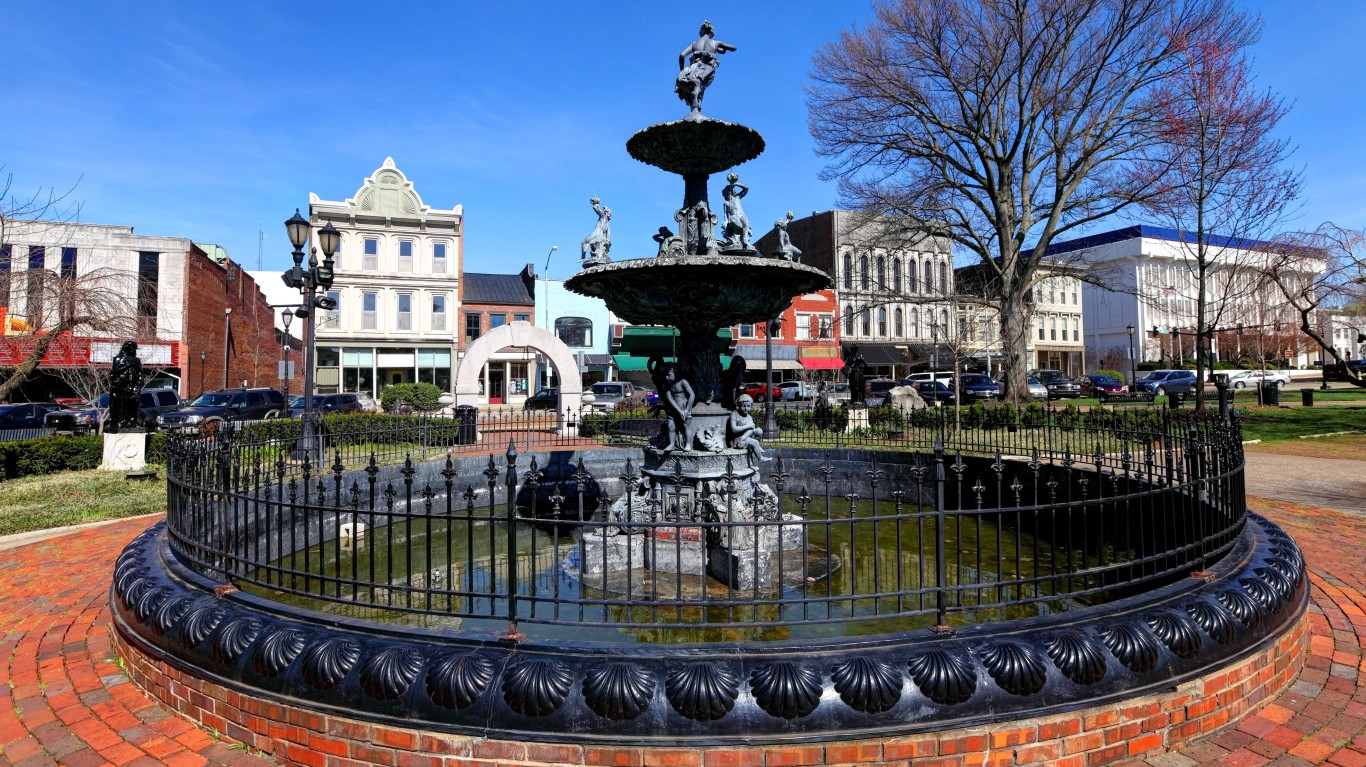
- Concentrated poverty rate: 15.7% of poor pop. living in poor neighborhoods
- Overall poverty rate: 17.0% (state: 16.3%)
- Neighborhoods in extreme poverty: 3 of 42 tracts
- Avg. household income: $36,175 in poor tracts, $78,501 in all others
Louisiana: Monroe, LA
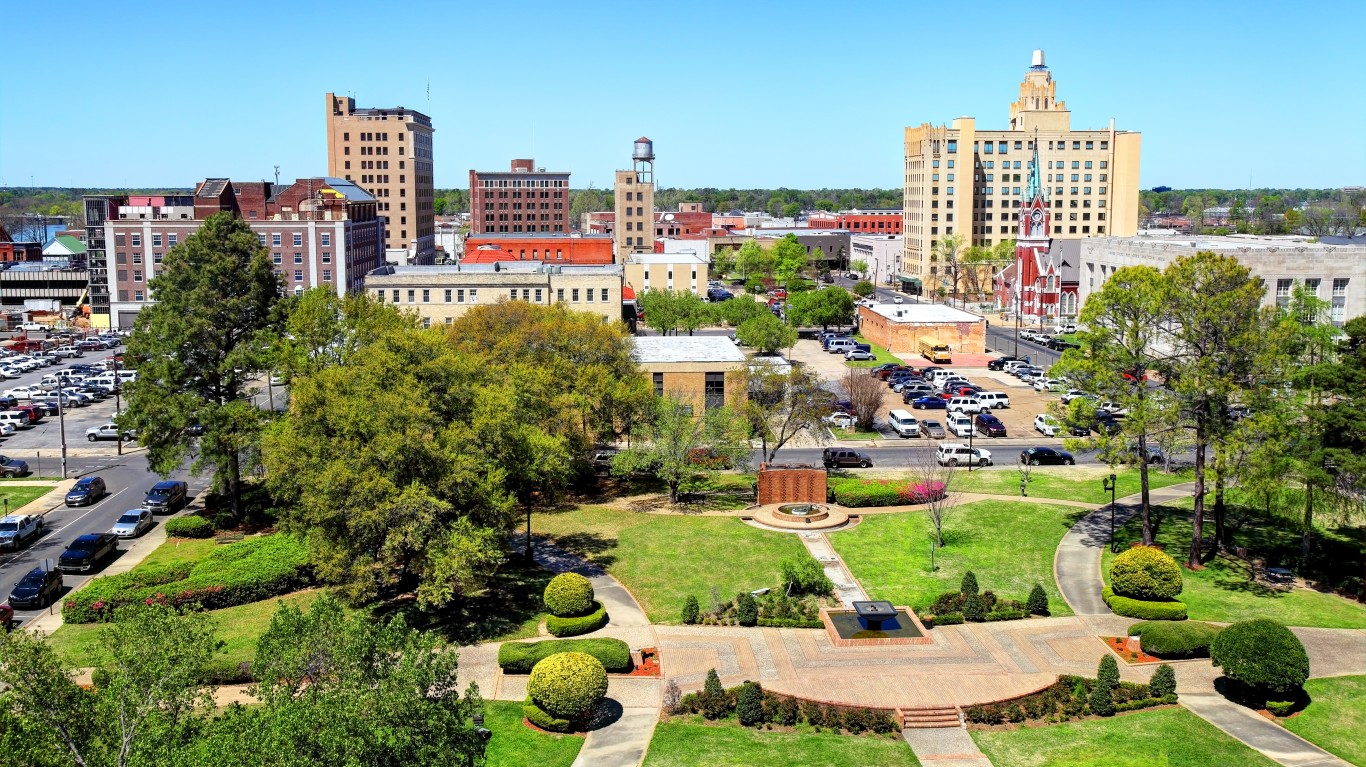
- Concentrated poverty rate: 44.9% of poor pop. living in poor neighborhoods
- Overall poverty rate: 25.0% (state: 18.8%)
- Neighborhoods in extreme poverty: 18 of 65 tracts
- Avg. household income: $33,808 in poor tracts, $75,359 in all others
Maine: Lewiston-Auburn, ME

- Concentrated poverty rate: 17.3% of poor pop. living in poor neighborhoods
- Overall poverty rate: 11.9% (state: 11.0%)
- Neighborhoods in extreme poverty: 3 of 31 tracts
- Avg. household income: $29,781 in poor tracts, $79,148 in all others
Maryland: Baltimore-Columbia-Towson, MD

- Concentrated poverty rate: 10.0% of poor pop. living in poor neighborhoods
- Overall poverty rate: 9.8% (state: 9.2%)
- Neighborhoods in extreme poverty: 24 of 703 tracts
- Avg. household income: $39,035 in poor tracts, $116,996 in all others
Massachusetts: Springfield, MA

- Concentrated poverty rate: 22.8% of poor pop. living in poor neighborhoods
- Overall poverty rate: 14.2% (state: 9.9%)
- Neighborhoods in extreme poverty: 10 of 103 tracts
- Avg. household income: $31,781 in poor tracts, $87,442 in all others
Michigan: Saginaw, MI
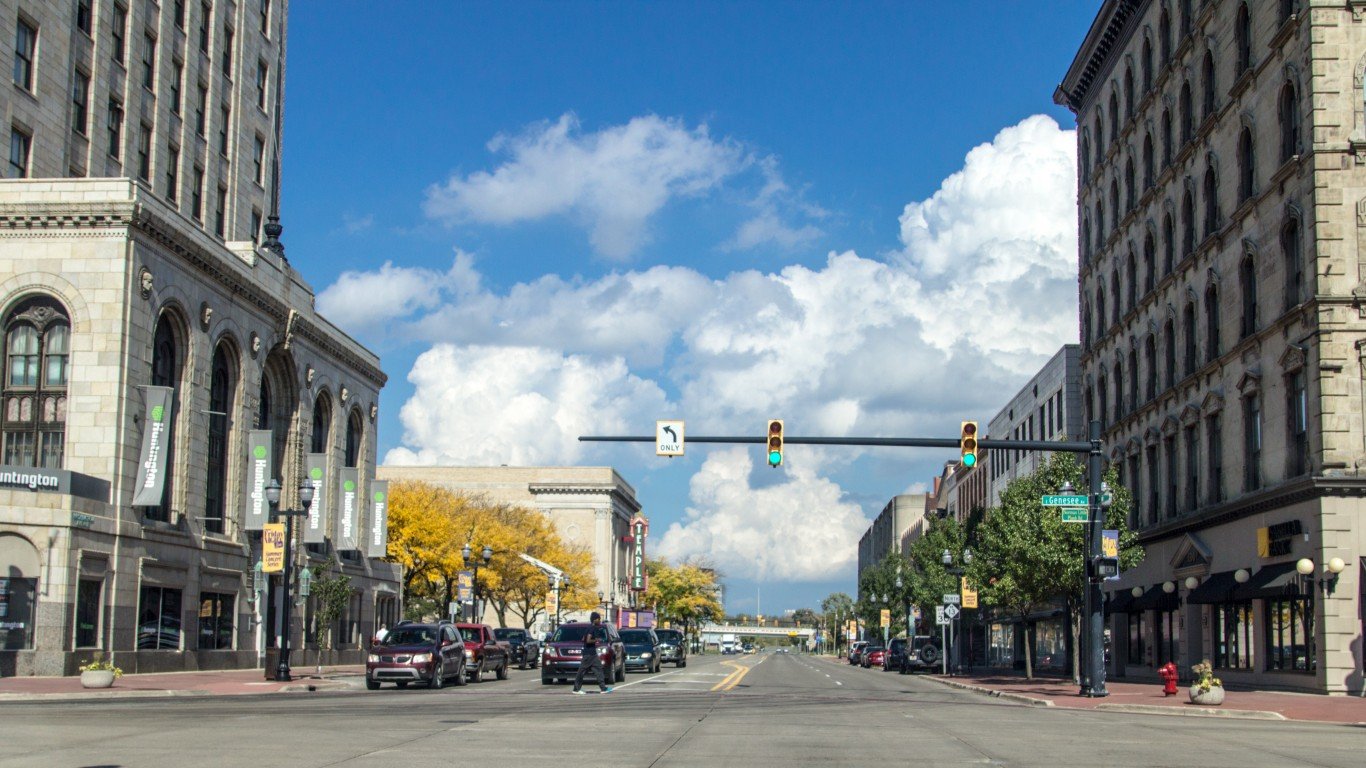
- Concentrated poverty rate: 32.0% of poor pop. living in poor neighborhoods
- Overall poverty rate: 18.0% (state: 13.3%)
- Neighborhoods in extreme poverty: 8 of 60 tracts
- Avg. household income: $39,503 in poor tracts, $76,900 in all others
Minnesota: St. Cloud, MN
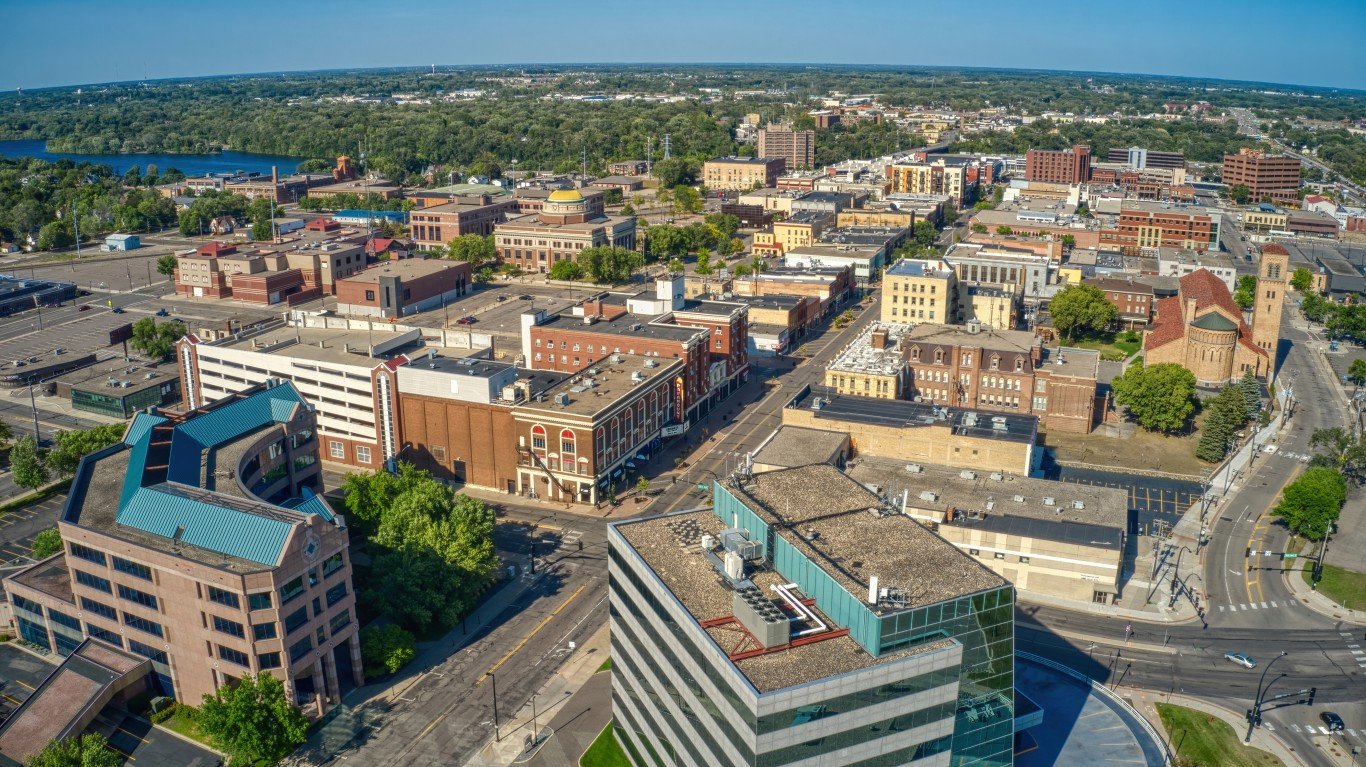
- Concentrated poverty rate: 14.4% of poor pop. living in poor neighborhoods
- Overall poverty rate: 12.1% (state: 9.2%)
- Neighborhoods in extreme poverty: 1 of 45 tracts
- Avg. household income: $56,755 in poor tracts, $86,334 in all others
Mississippi: Hattiesburg, MS

- Concentrated poverty rate: 25.6% of poor pop. living in poor neighborhoods
- Overall poverty rate: 20.8% (state: 19.4%)
- Neighborhoods in extreme poverty: 5 of 40 tracts
- Avg. household income: $55,054 in poor tracts, $78,031 in all others
Missouri: Cape Girardeau, MO-IL
- Concentrated poverty rate: 16.5% of poor pop. living in poor neighborhoods
- Overall poverty rate: 15.0% (state: 12.8%)
- Neighborhoods in extreme poverty: 2 of 25 tracts
- Avg. household income: $36,298 in poor tracts, $74,217 in all others
Montana: Great Falls, MT

- Concentrated poverty rate: 10.2% of poor pop. living in poor neighborhoods
- Overall poverty rate: 12.9% (state: 12.5%)
- Neighborhoods in extreme poverty: 1 of 25 tracts
- Avg. household income: $36,545 in poor tracts, $75,425 in all others
Nebraska: Omaha, NE-IA

- Concentrated poverty rate: 5.8% of poor pop. living in poor neighborhoods
- Overall poverty rate: 9.3% (state: 10.3%)
- Neighborhoods in extreme poverty: 5 of 265 tracts
- Avg. household income: $39,120 in poor tracts, $97,881 in all others
Nevada: Reno, NV
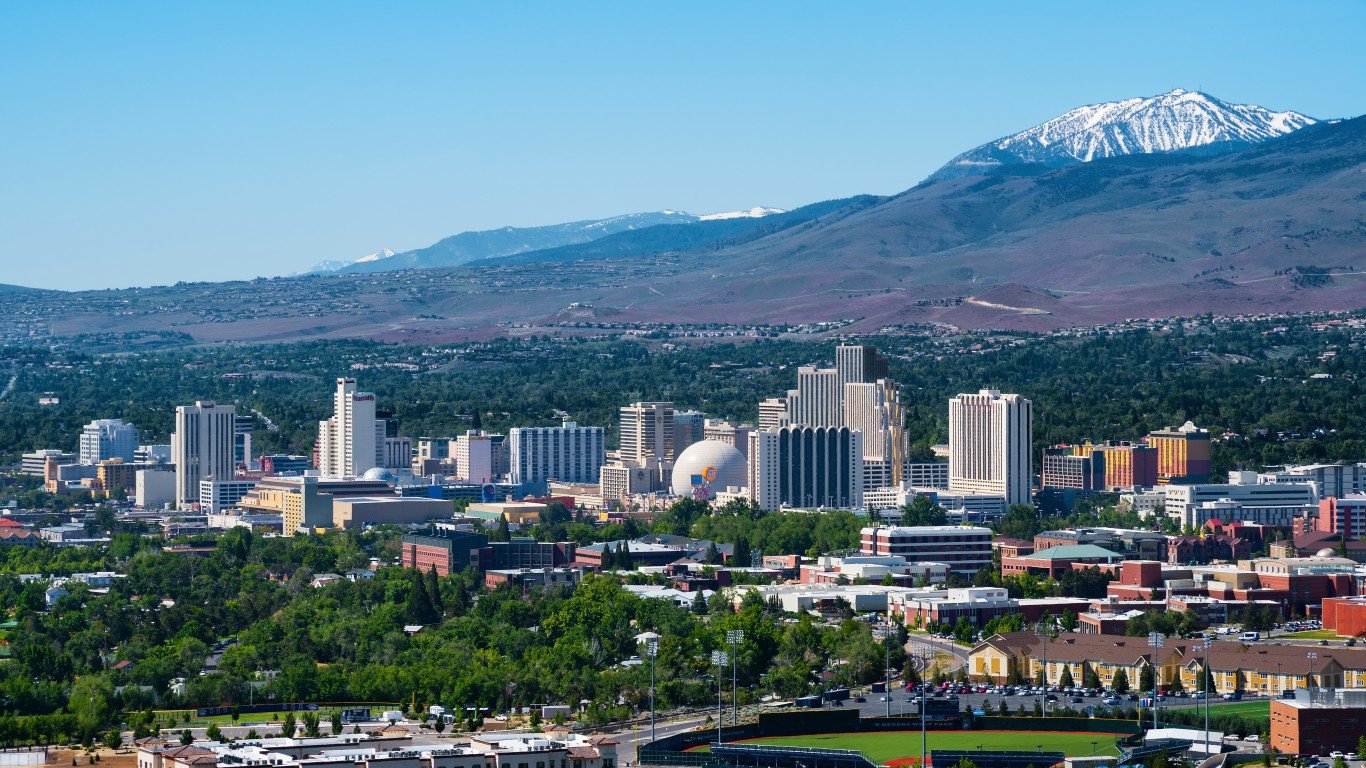
- Concentrated poverty rate: 4.7% of poor pop. living in poor neighborhoods
- Overall poverty rate: 11.0% (state: 12.9%)
- Neighborhoods in extreme poverty: 2 of 151 tracts
- Avg. household income: $41,414 in poor tracts, $99,409 in all others
New Hampshire: No eligible metro area with concentrated poverty

- State poverty rate: 7.4%
New Jersey: Vineland, NJ

- Concentrated poverty rate: 16.7% of poor pop. living in poor neighborhoods
- Overall poverty rate: 15.7% (state: 9.8%)
- Neighborhoods in extreme poverty: 3 of 41 tracts
- Avg. household income: $43,048 in poor tracts, $85,885 in all others
New Mexico: Las Cruces, NM
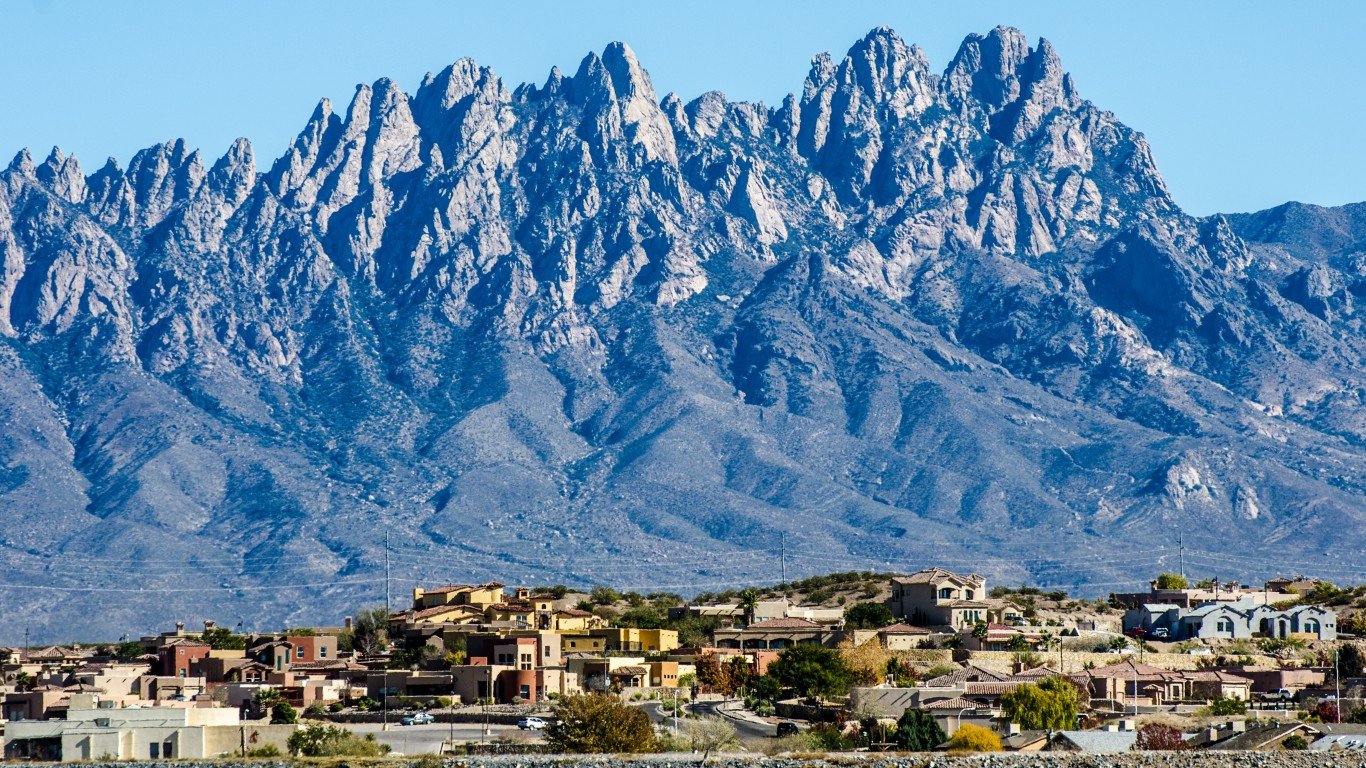
- Concentrated poverty rate: 11.0% of poor pop. living in poor neighborhoods
- Overall poverty rate: 23.2% (state: 18.3%)
- Neighborhoods in extreme poverty: 5 of 60 tracts
- Avg. household income: $33,128 in poor tracts, $67,091 in all others
New York: Binghamton, NY

- Concentrated poverty rate: 27.1% of poor pop. living in poor neighborhoods
- Overall poverty rate: 16.8% (state: 13.5%)
- Neighborhoods in extreme poverty: 9 of 67 tracts
- Avg. household income: $49,127 in poor tracts, $79,318 in all others
North Carolina: Greenville, NC

- Concentrated poverty rate: 27.1% of poor pop. living in poor neighborhoods
- Overall poverty rate: 20.7% (state: 13.7%)
- Neighborhoods in extreme poverty: 6 of 40 tracts
- Avg. household income: $42,389 in poor tracts, $75,780 in all others
North Dakota: No eligible metro area with concentrated poverty
- State poverty rate: 10.7%
Ohio: Toledo, OH

- Concentrated poverty rate: 26.2% of poor pop. living in poor neighborhoods
- Overall poverty rate: 15.4% (state: 13.4%)
- Neighborhoods in extreme poverty: 23 of 206 tracts
- Avg. household income: $34,663 in poor tracts, $82,651 in all others
Oklahoma: Enid, OK

- Concentrated poverty rate: 21.8% of poor pop. living in poor neighborhoods
- Overall poverty rate: 13.5% (state: 15.2%)
- Neighborhoods in extreme poverty: 1 of 17 tracts
- Avg. household income: $35,869 in poor tracts, $78,155 in all others
Oregon: Salem, OR

- Concentrated poverty rate: 4.3% of poor pop. living in poor neighborhoods
- Overall poverty rate: 13.1% (state: 12.1%)
- Neighborhoods in extreme poverty: 1 of 81 tracts
- Avg. household income: $39,867 in poor tracts, $86,119 in all others
Pennsylvania: Reading, PA

- Concentrated poverty rate: 17.6% of poor pop. living in poor neighborhoods
- Overall poverty rate: 11.8% (state: 11.8%)
- Neighborhoods in extreme poverty: 5 of 106 tracts
- Avg. household income: $35,004 in poor tracts, $92,372 in all others
Rhode Island: Providence-Warwick, RI-MA

- Concentrated poverty rate: 5.0% of poor pop. living in poor neighborhoods
- Overall poverty rate: 11.2% (state: 11.3%)
- Neighborhoods in extreme poverty: 7 of 371 tracts
- Avg. household income: $38,098 in poor tracts, $98,217 in all others
South Carolina: Sumter, SC

- Concentrated poverty rate: 23.6% of poor pop. living in poor neighborhoods
- Overall poverty rate: 18.5% (state: 14.5%)
- Neighborhoods in extreme poverty: 3 of 26 tracts
- Avg. household income: $38,894 in poor tracts, $66,562 in all others
South Dakota: No eligible metro area with concentrated poverty
- State poverty rate: 12.5%
Tennessee: Memphis, TN-MS-AR

- Concentrated poverty rate: 24.7% of poor pop. living in poor neighborhoods
- Overall poverty rate: 16.9% (state: 14.3%)
- Neighborhoods in extreme poverty: 47 of 352 tracts
- Avg. household income: $35,391 in poor tracts, $87,008 in all others
Texas: McAllen-Edinburg-Mission, TX
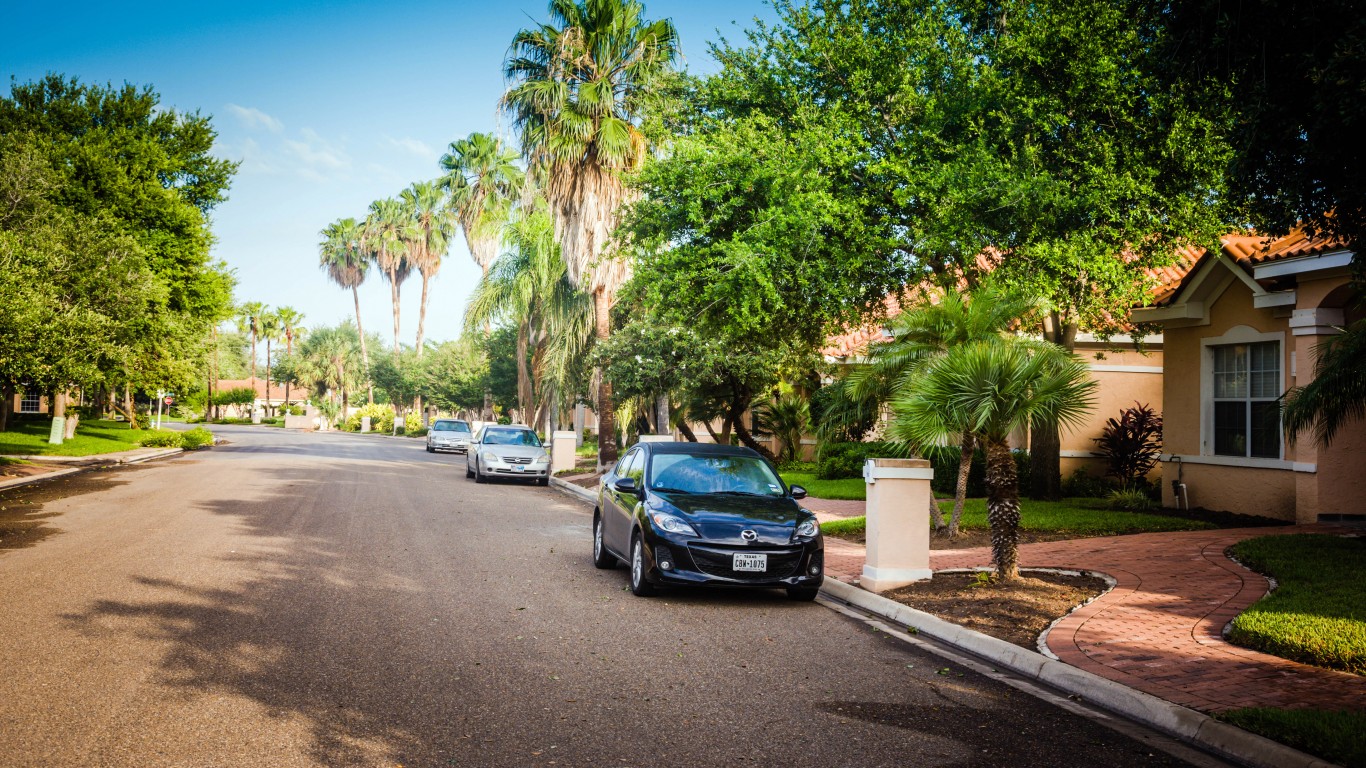
- Concentrated poverty rate: 32.5% of poor pop. living in poor neighborhoods
- Overall poverty rate: 28.1% (state: 14.0%)
- Neighborhoods in extreme poverty: 40 of 211 tracts
- Avg. household income: $42,172 in poor tracts, $66,455 in all others
Utah: Logan, UT-ID
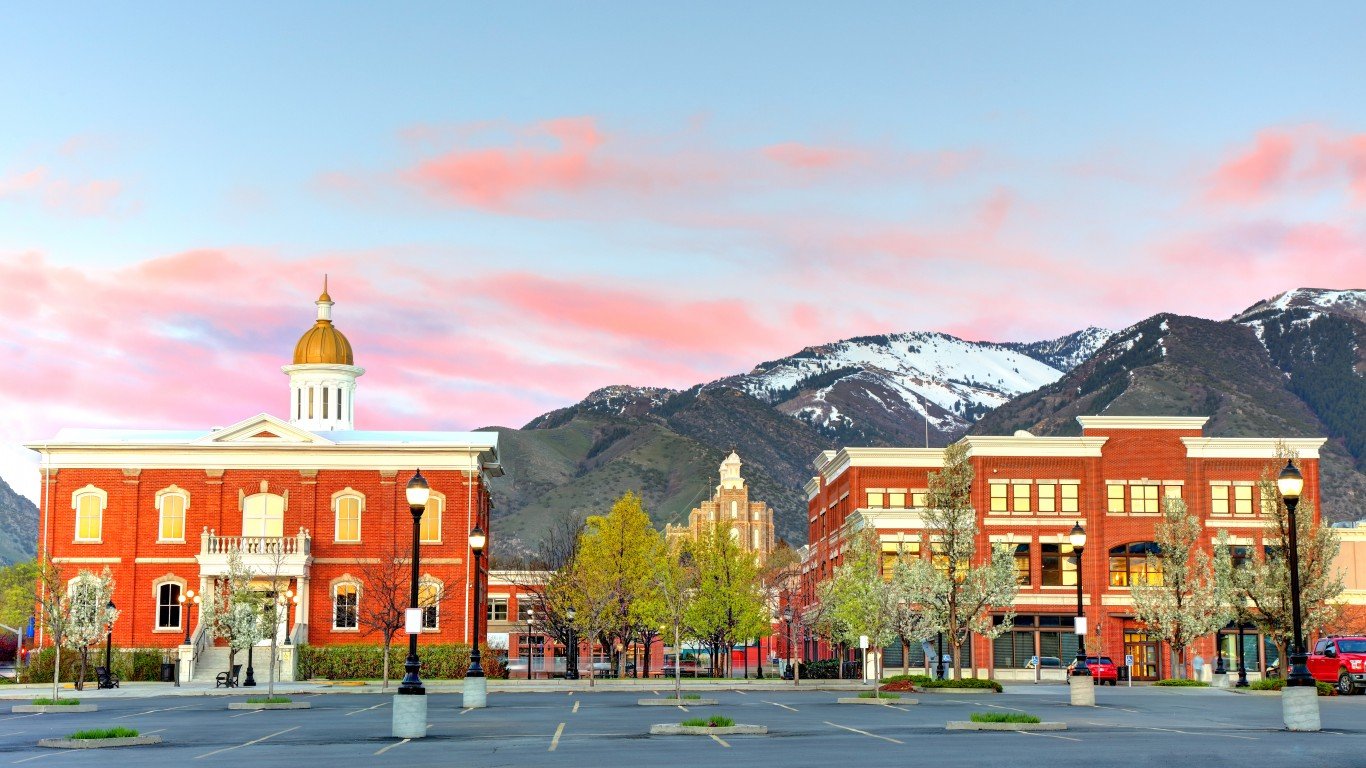
- Concentrated poverty rate: 8.8% of poor pop. living in poor neighborhoods
- Overall poverty rate: 13.6% (state: 8.8%)
- Neighborhoods in extreme poverty: 1 of 27 tracts
- Avg. household income: $54,695 in poor tracts, $84,417 in all others
Vermont: No eligible metro area with concentrated poverty

- State poverty rate: 10.5%
Virginia: Virginia Beach-Chesapeake-Norfolk, VA-NC
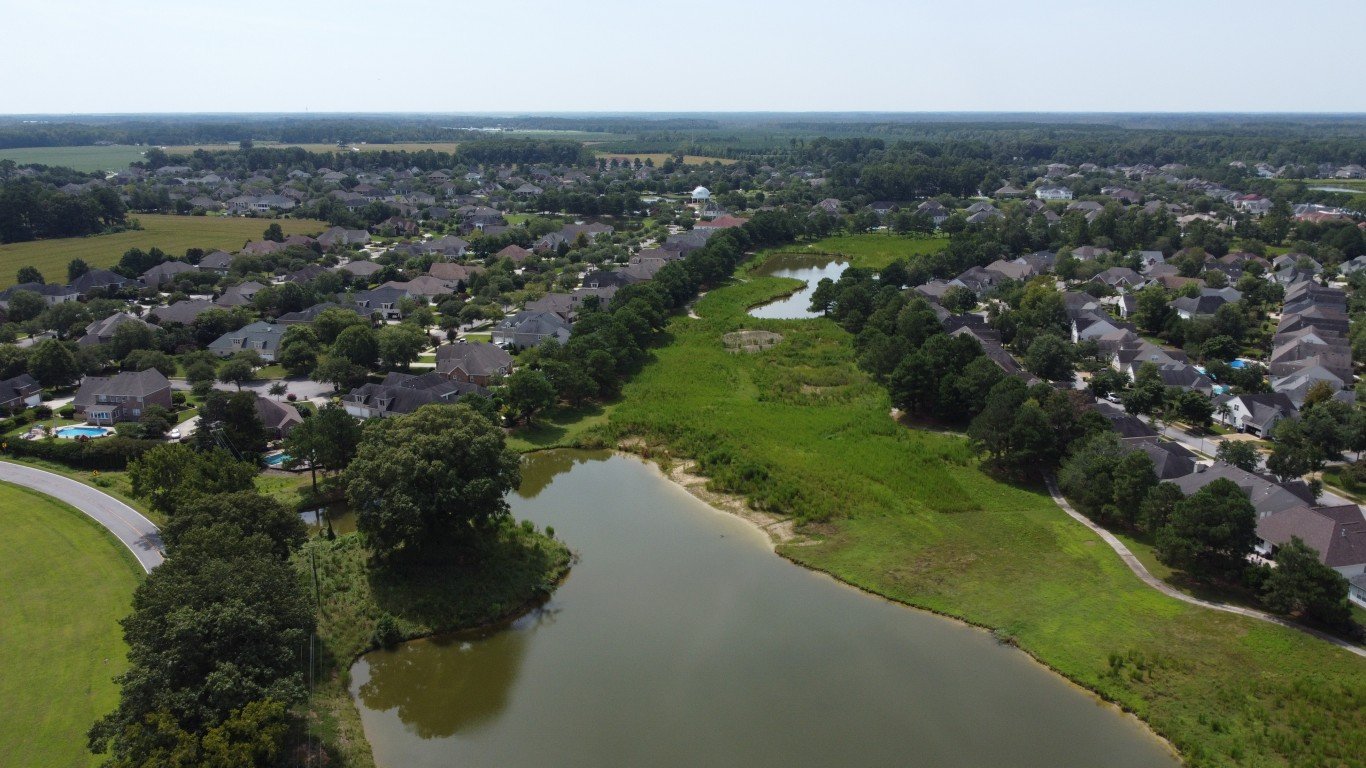
- Concentrated poverty rate: 8.9% of poor pop. living in poor neighborhoods
- Overall poverty rate: 10.9% (state: 9.9%)
- Neighborhoods in extreme poverty: 14 of 468 tracts
- Avg. household income: $39,051 in poor tracts, $95,046 in all others
Washington: Bellingham, WA
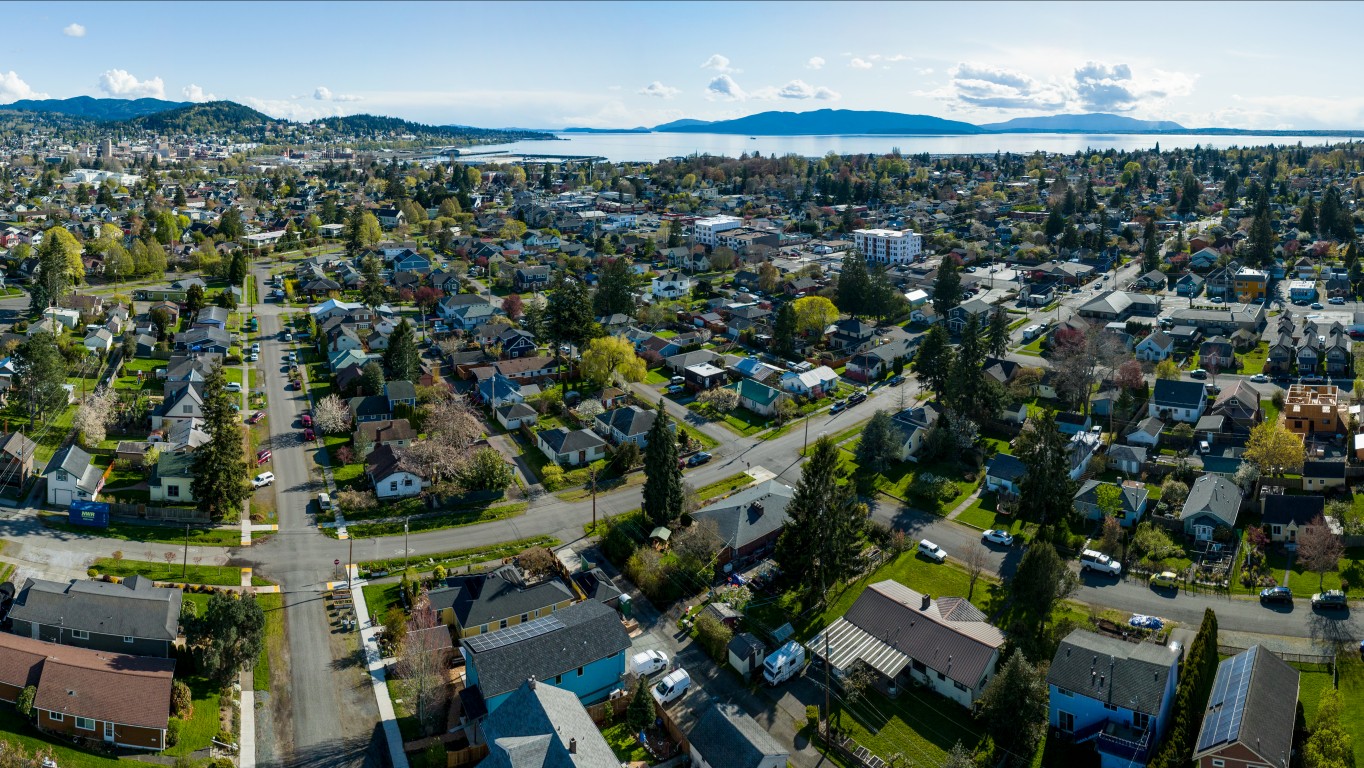
- Concentrated poverty rate: 11.2% of poor pop. living in poor neighborhoods
- Overall poverty rate: 13.4% (state: 10.0%)
- Neighborhoods in extreme poverty: 2 of 53 tracts
- Avg. household income: $52,900 in poor tracts, $91,998 in all others
West Virginia: Charleston, WV

- Concentrated poverty rate: 11.8% of poor pop. living in poor neighborhoods
- Overall poverty rate: 17.4% (state: 16.9%)
- Neighborhoods in extreme poverty: 4 of 68 tracts
- Avg. household income: $39,280 in poor tracts, $72,188 in all others
Wisconsin: Milwaukee-Waukesha, WI

- Concentrated poverty rate: 19.8% of poor pop. living in poor neighborhoods
- Overall poverty rate: 12.6% (state: 10.7%)
- Neighborhoods in extreme poverty: 37 of 444 tracts
- Avg. household income: $37,781 in poor tracts, $95,278 in all others
Wyoming: No eligible metro area with concentrated poverty
- State poverty rate: 10.7%
Methodology
To identify the city hit hardest by extreme poverty in each state, 24/7 Wall St. reviewed five-year data on concentrated poverty from the U.S. Census Bureau’s 2021 American Community Survey. Metropolitan areas were ranked based on the share of poor residents who live in extreme poverty neighborhoods — census tracts with a poverty rate of 40% or higher. This measure is called the extreme or concentrated poverty rate, and is calculated by aggregating data from the census tract level to the metropolitan area level.
In our analysis, we only considered census tracts with at least 500 people and college or graduate school enrollment below 50%. Metro areas were also excluded if over 20% of the population in tracts or neighborhoods of concentrated poverty were college or university students, as large undergraduate populations can skew data on financial hardship. Data was aggregated using boundary definitions for July 2023 from the Census Bureau.
All other data referenced — homeownership, average household income, and unemployment — are also from the 2021 ACS. Figures were aggregated from the census tract to the metropolitan level. Note that MSA boundary definitions for Connecticut metro areas are composed of planning regions, not counties, as of June 2022, and were not aggregated from the census tract level. In six states, no metro areas contain eligible census tracts where at least 40% of the population lives in poverty.
Contact [email protected] for any questions or corrections.