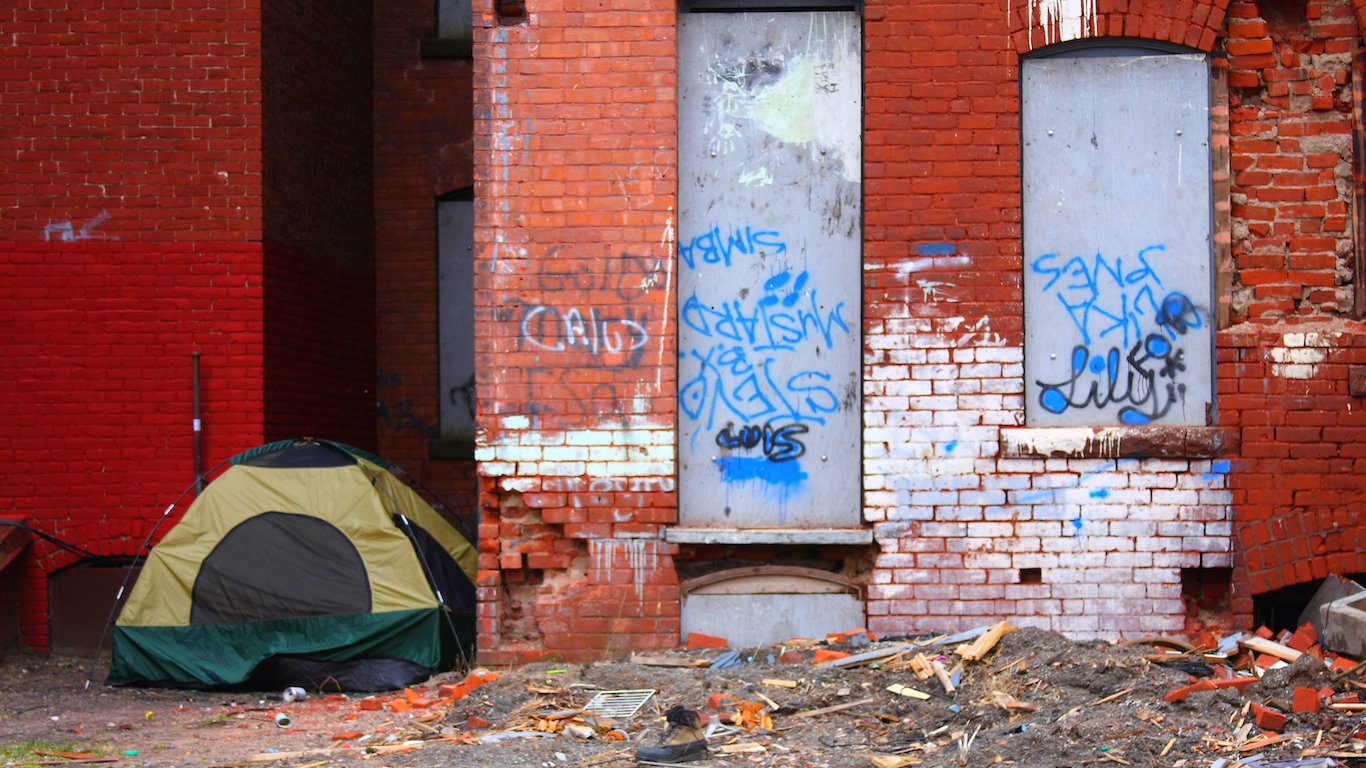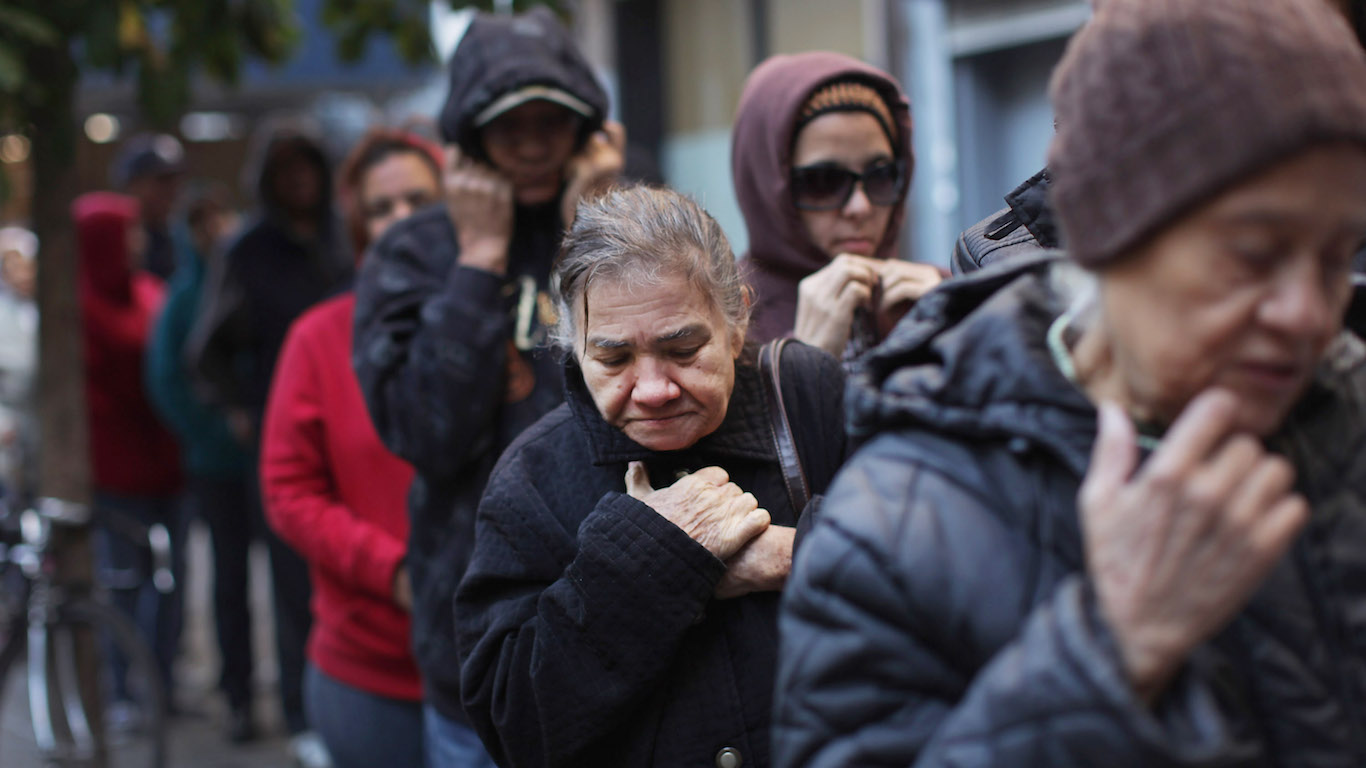
The latest estimates from the U.S. Census Bureau show that nearly 41 million Americans live below the poverty line, which is currently set at an annual income of $30,000 for a family of four, with slightly higher thresholds in Alaska and Hawaii. Living in poverty negatively impacts nearly all aspects of everyday life, from housing stability and family relationships to education outcomes and physical and mental health.
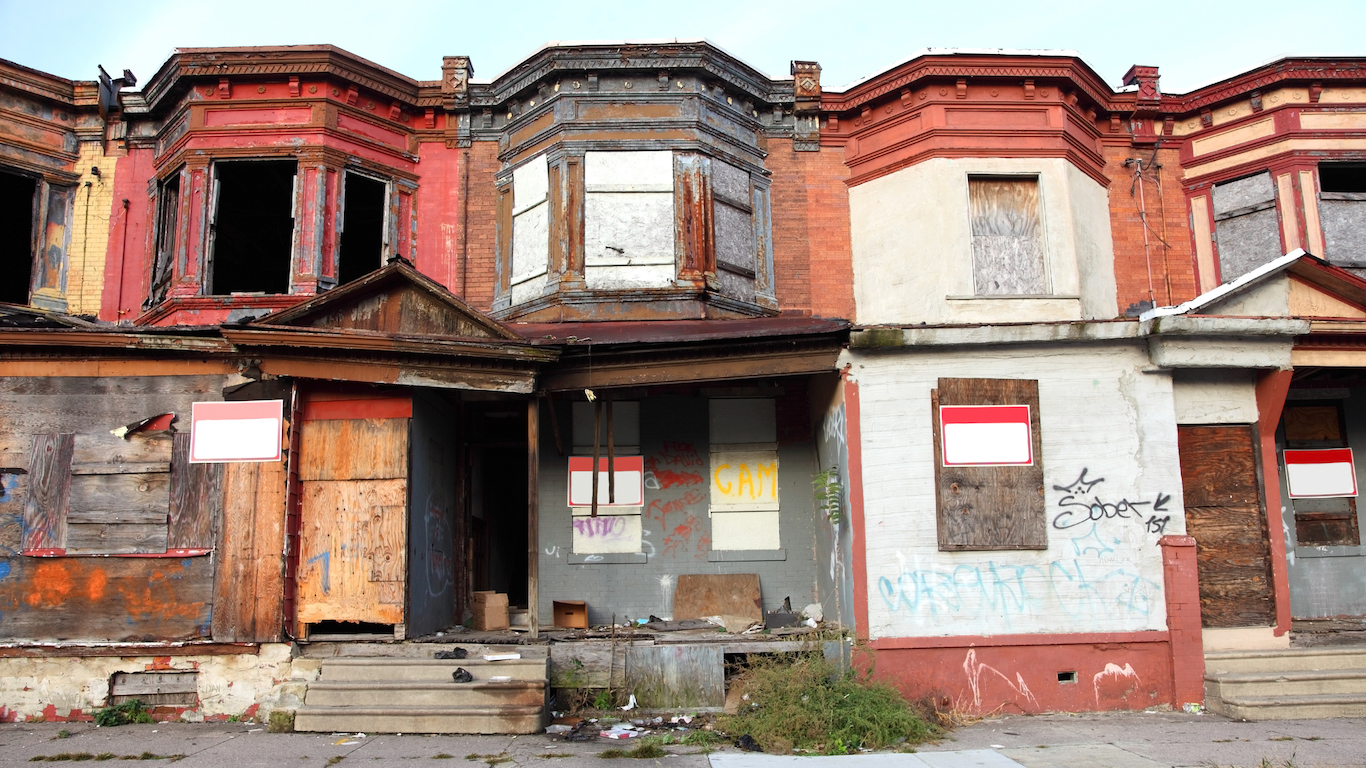
When large numbers of people with poverty-level incomes live in close proximity to one another, these problems can compound and have broader, communal effects. Neighborhoods or tracts with poverty rates of 40% or higher typically report widespread unemployment, high crime rates, substandard schools, and limited access to quality health care and other essential services.
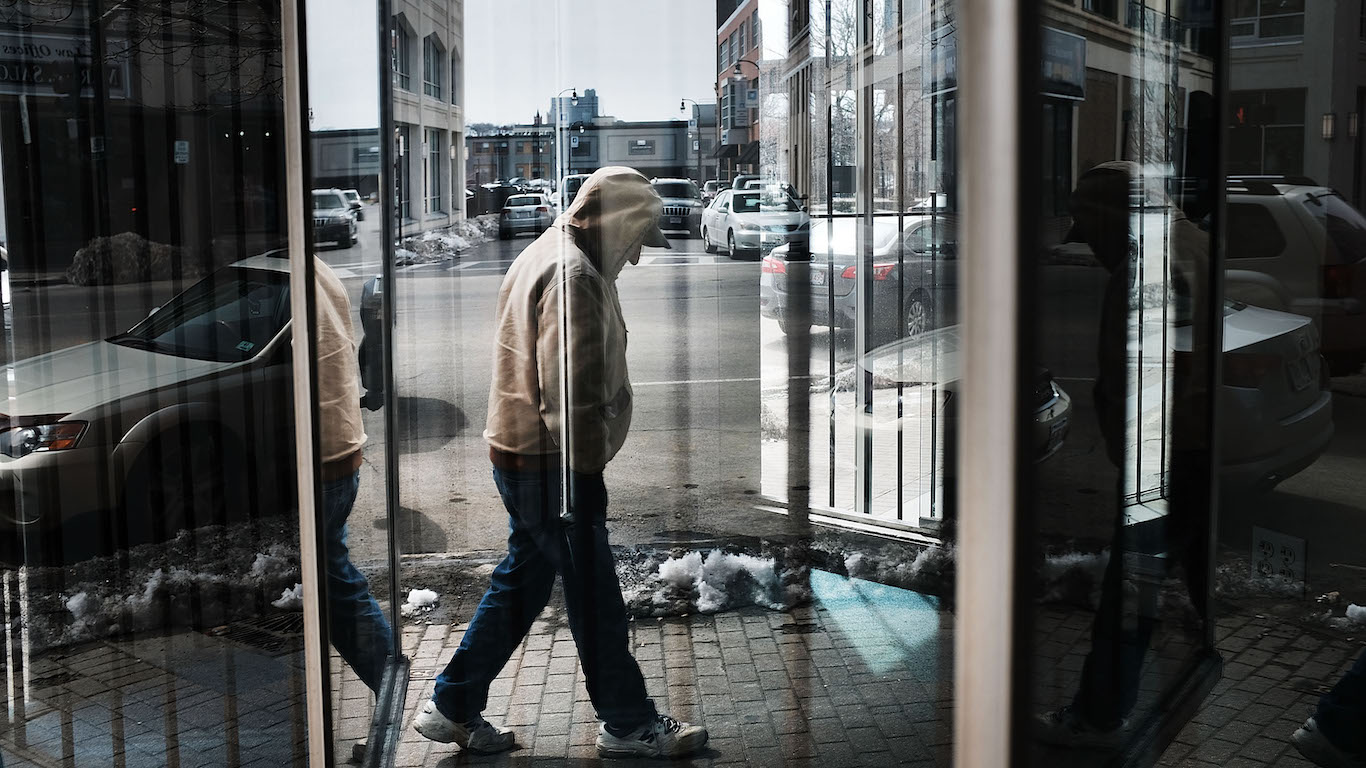
Cities and suburbs across the country are home to pockets of such concentrated poverty. But in some major metropolitan areas, economic segregation and isolation are far more common than in others.
Using data from the U.S. Census Bureau, 24/7 Wall St. identified the 25 U.S. metro areas hit hardest by extreme poverty. Metro areas were ranked based on the share of residents with poverty-level incomes who also live in concentrated poverty neighborhoods — census tracts with poverty rates of 40% or higher.
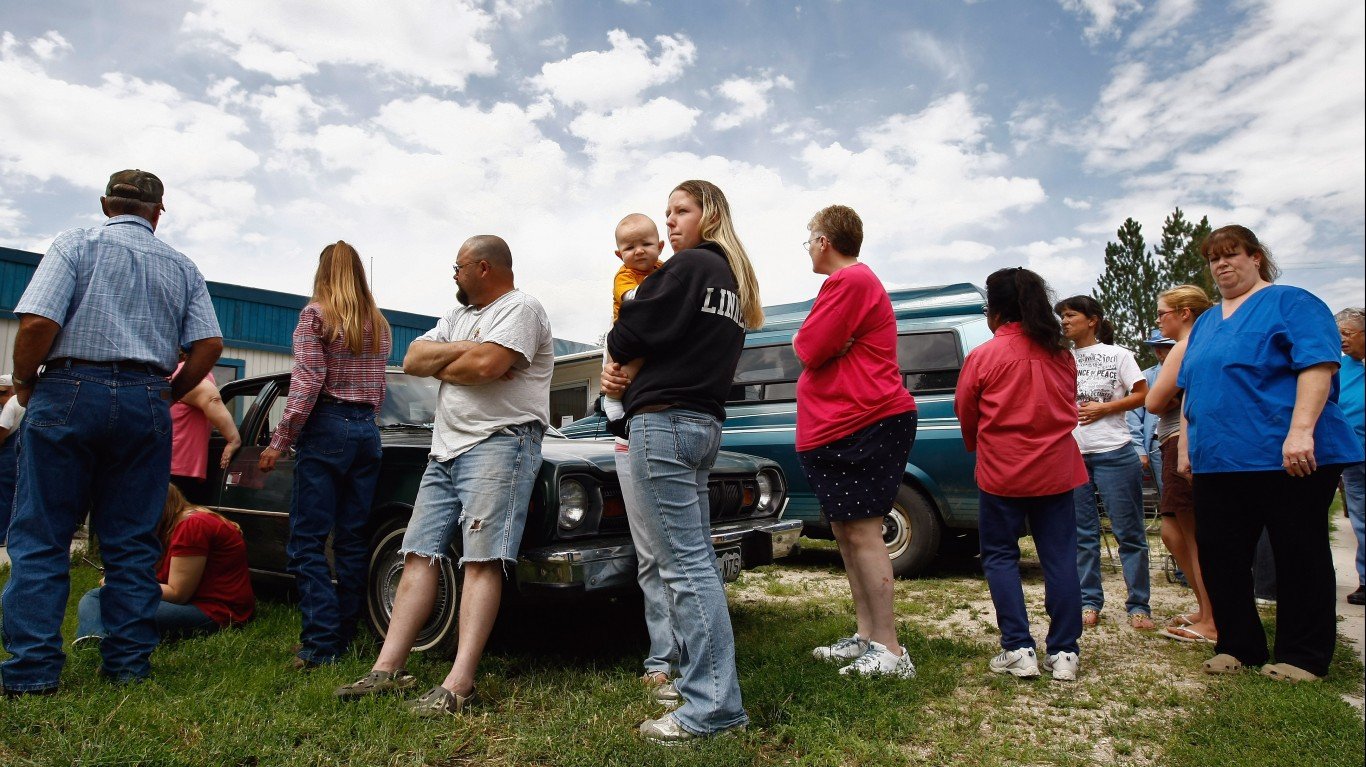
Among the metro areas on this list, the share of the population living below the poverty line who also reside in concentrated poverty neighborhoods ranges from about 22% to nearly 45%. The metro areas on this include several Rust Belt cities in the Midwest. Only two are located in the Northeast, and most are in the South. (Here is a look at America’s 26 poorest cities.)
In all but a handful of these metro areas, unemployment rates in concentrated poverty areas are in the double digits and are often at least twice as high as the jobless rate across the rest of the metro area. Homeownership – a common way to build wealth – is also far less common in the concentrated-poverty neighborhoods within these metro areas. (Here is a look at the cheapest city to buy a home in each state.)
Here are the cities hit hardest by extreme poverty.
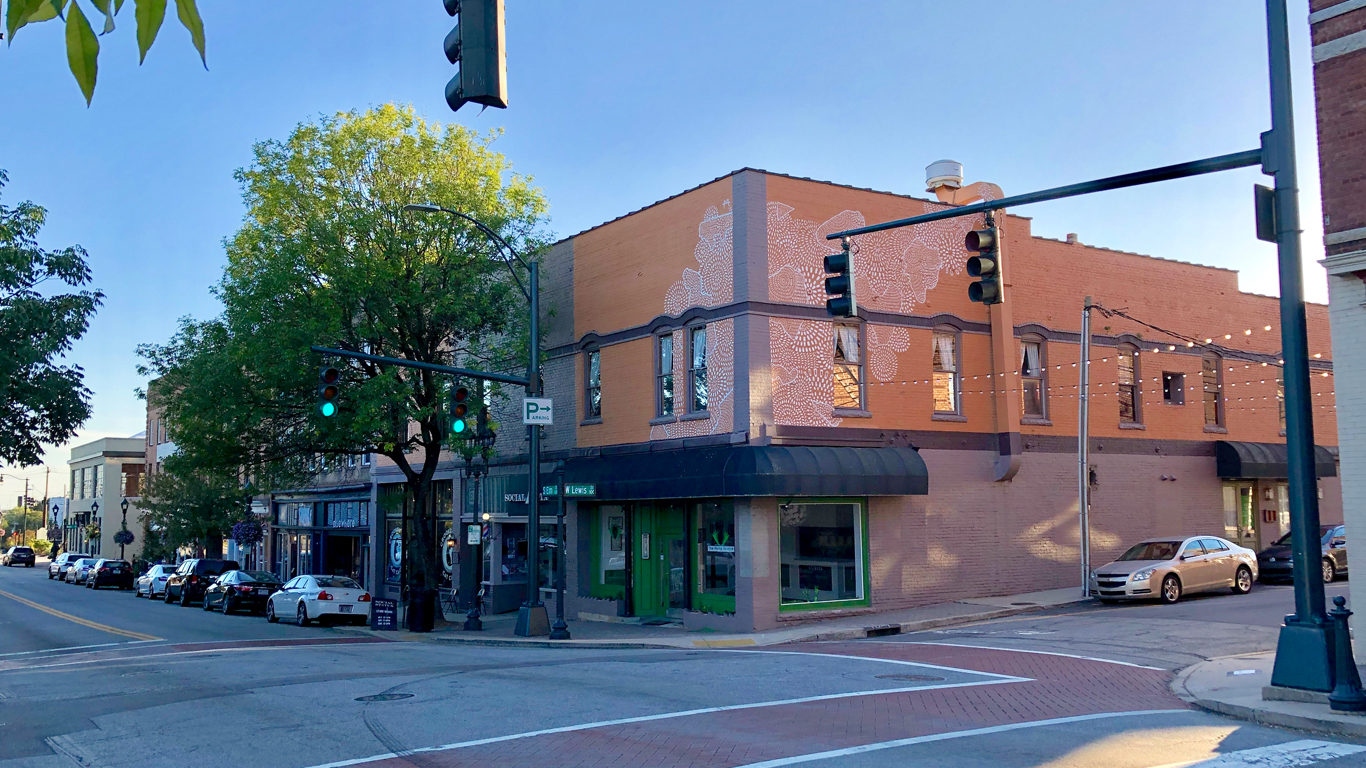
25. Muncie, IN
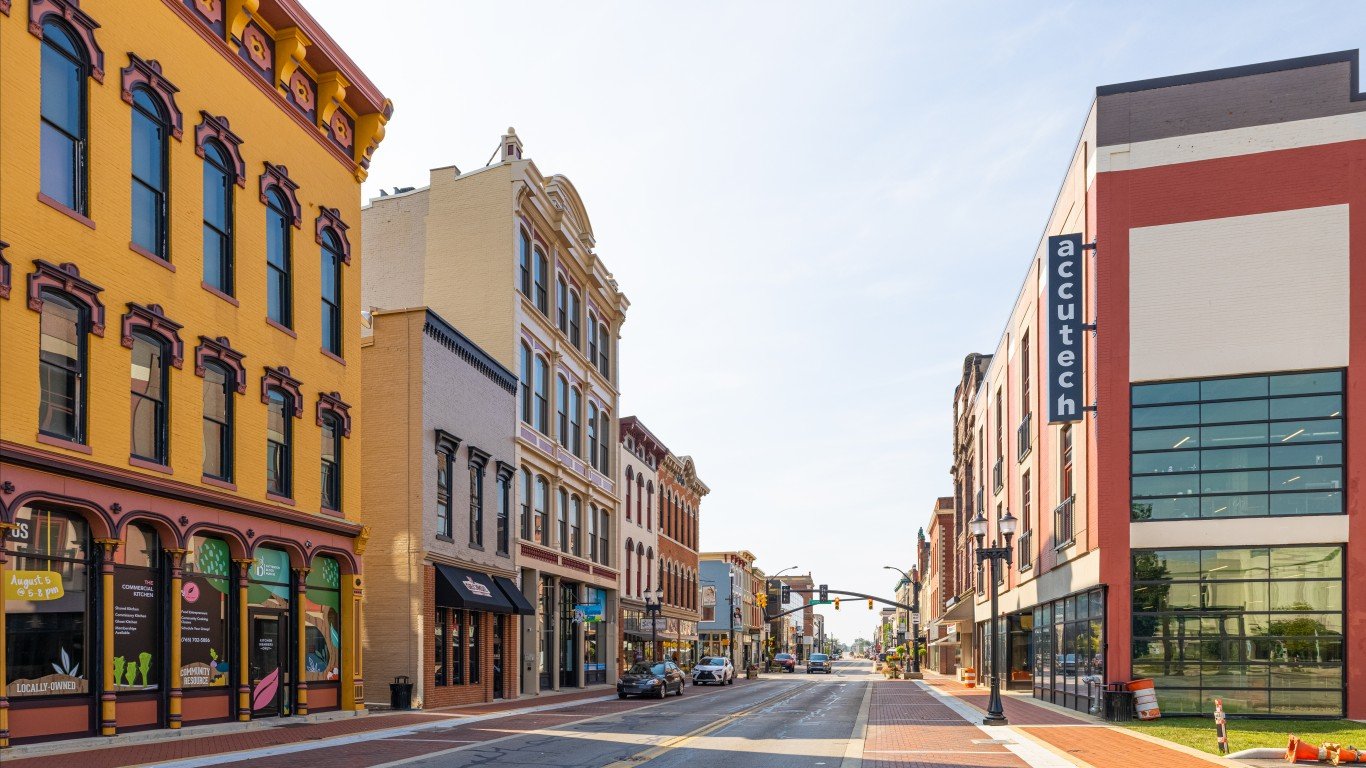
- Concentrated poverty rate: 22.3% of poor pop. living in poor neighborhoods
- Overall poverty rate: 20.6%
- Neighborhoods in extreme poverty: 4 of 31 tracts
- Avg. household income: $37,009 in poor tracts, $70,075 in all others
24. Youngstown-Warren, OH
- Concentrated poverty rate: 22.5% of poor pop. living in poor neighborhoods
- Overall poverty rate: 16.5%
- Neighborhoods in extreme poverty: 15 of 129 tracts
- Avg. household income: $32,335 in poor tracts, $70,763 in all others
23. Columbus, GA-AL

- Concentrated poverty rate: 22.5% of poor pop. living in poor neighborhoods
- Overall poverty rate: 18.4%
- Neighborhoods in extreme poverty: 14 of 96 tracts
- Avg. household income: $32,246 in poor tracts, $74,700 in all others
22. Springfield, MA

- Concentrated poverty rate: 22.8% of poor pop. living in poor neighborhoods
- Overall poverty rate: 14.2%
- Neighborhoods in extreme poverty: 10 of 103 tracts
- Avg. household income: $31,781 in poor tracts, $87,442 in all others
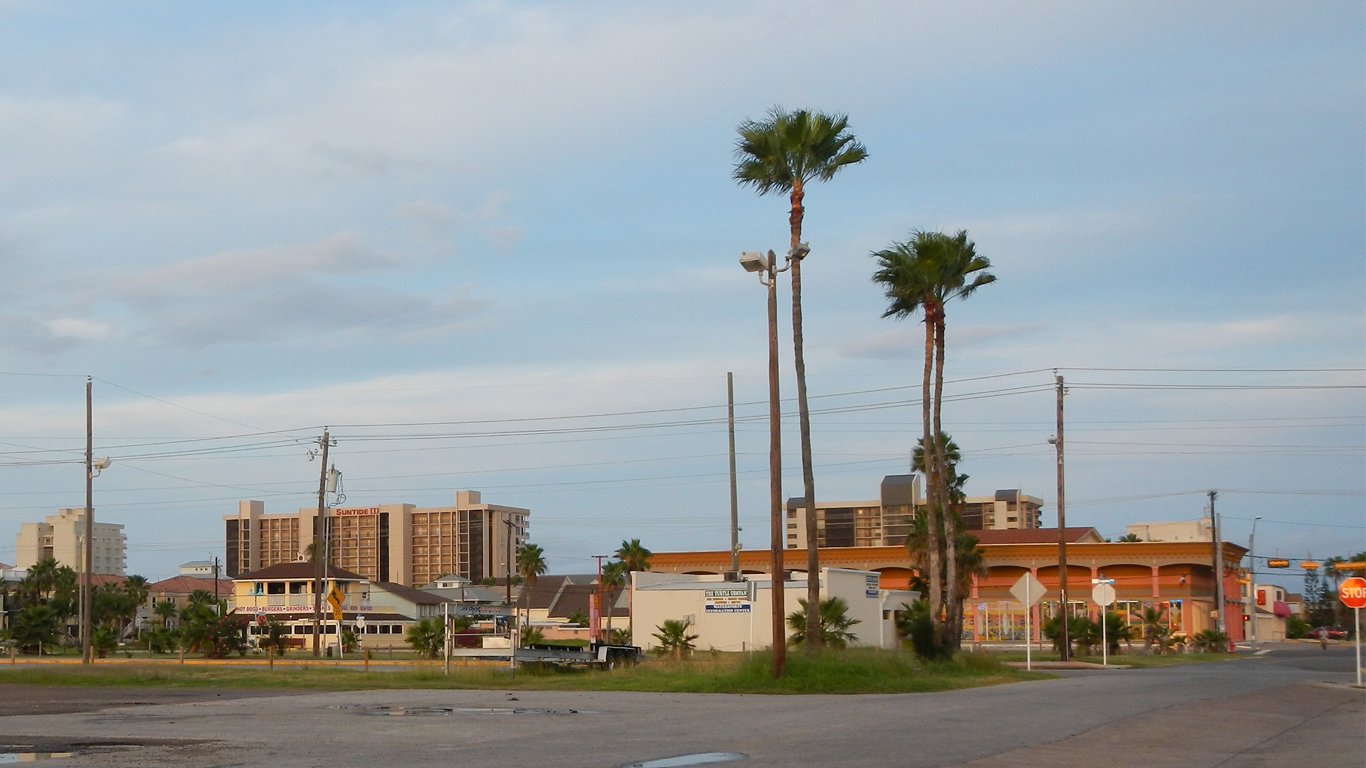
21. Laredo, TX
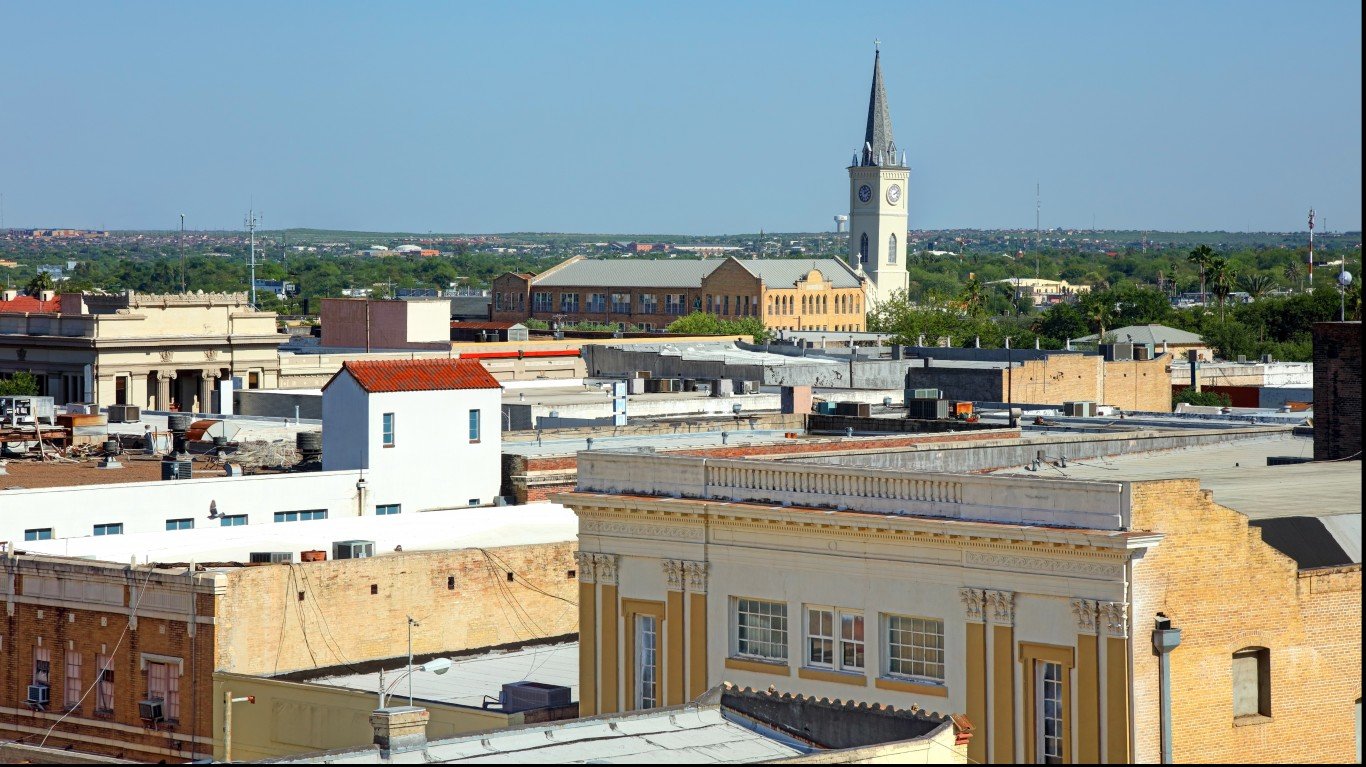
- Concentrated poverty rate: 23.1% of poor pop. living in poor neighborhoods
- Overall poverty rate: 22.9%
- Neighborhoods in extreme poverty: 11 of 68 tracts
- Avg. household income: $41,925 in poor tracts, $74,889 in all others
20. Waco, TX
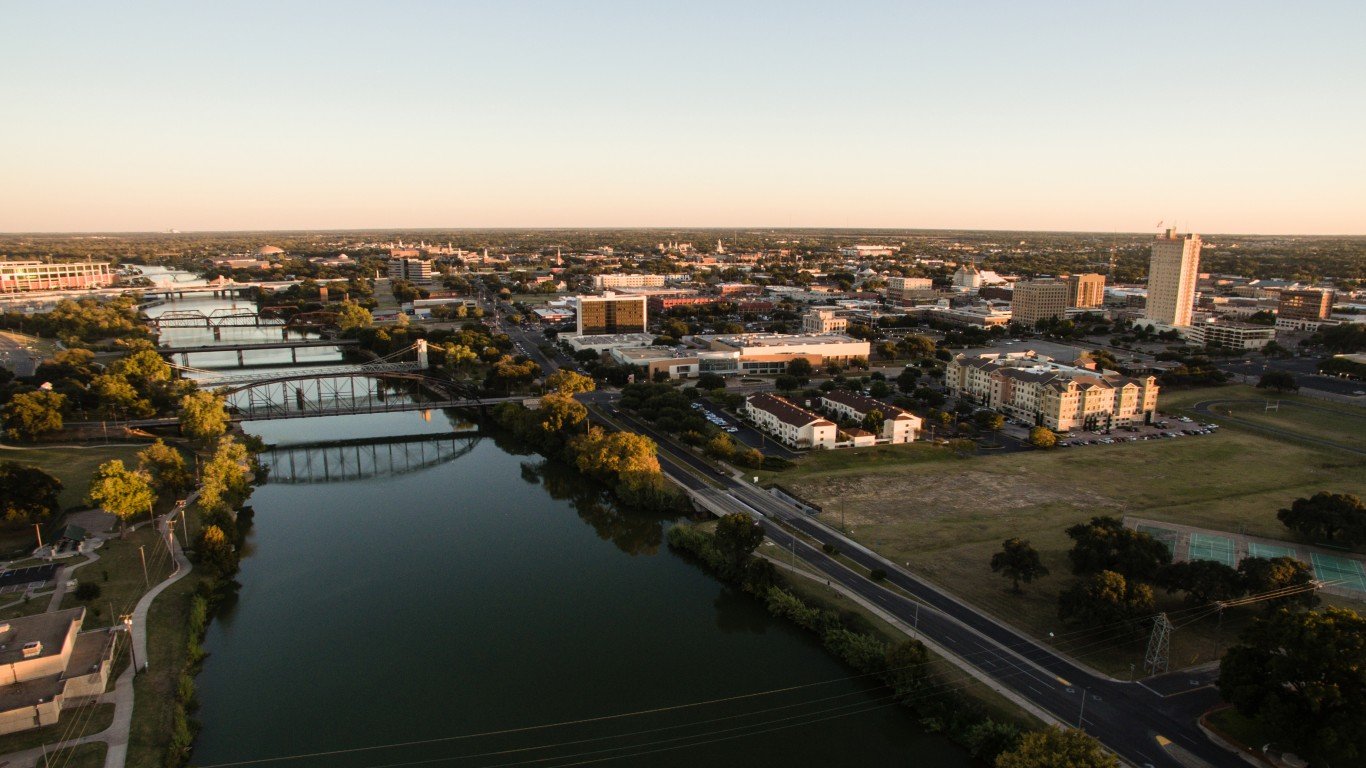
- Concentrated poverty rate: 23.2% of poor pop. living in poor neighborhoods
- Overall poverty rate: 18.1%
- Neighborhoods in extreme poverty: 5 of 66 tracts
- Avg. household income: $30,121 in poor tracts, $80,386 in all others
19. Sumter, SC

- Concentrated poverty rate: 23.6% of poor pop. living in poor neighborhoods
- Overall poverty rate: 18.5%
- Neighborhoods in extreme poverty: 3 of 26 tracts
- Avg. household income: $38,894 in poor tracts, $66,562 in all others
18. Canton-Massillon, OH

- Concentrated poverty rate: 23.7% of poor pop. living in poor neighborhoods
- Overall poverty rate: 13.3%
- Neighborhoods in extreme poverty: 9 of 97 tracts
- Avg. household income: $36,712 in poor tracts, $78,258 in all others
17. Kankakee, IL
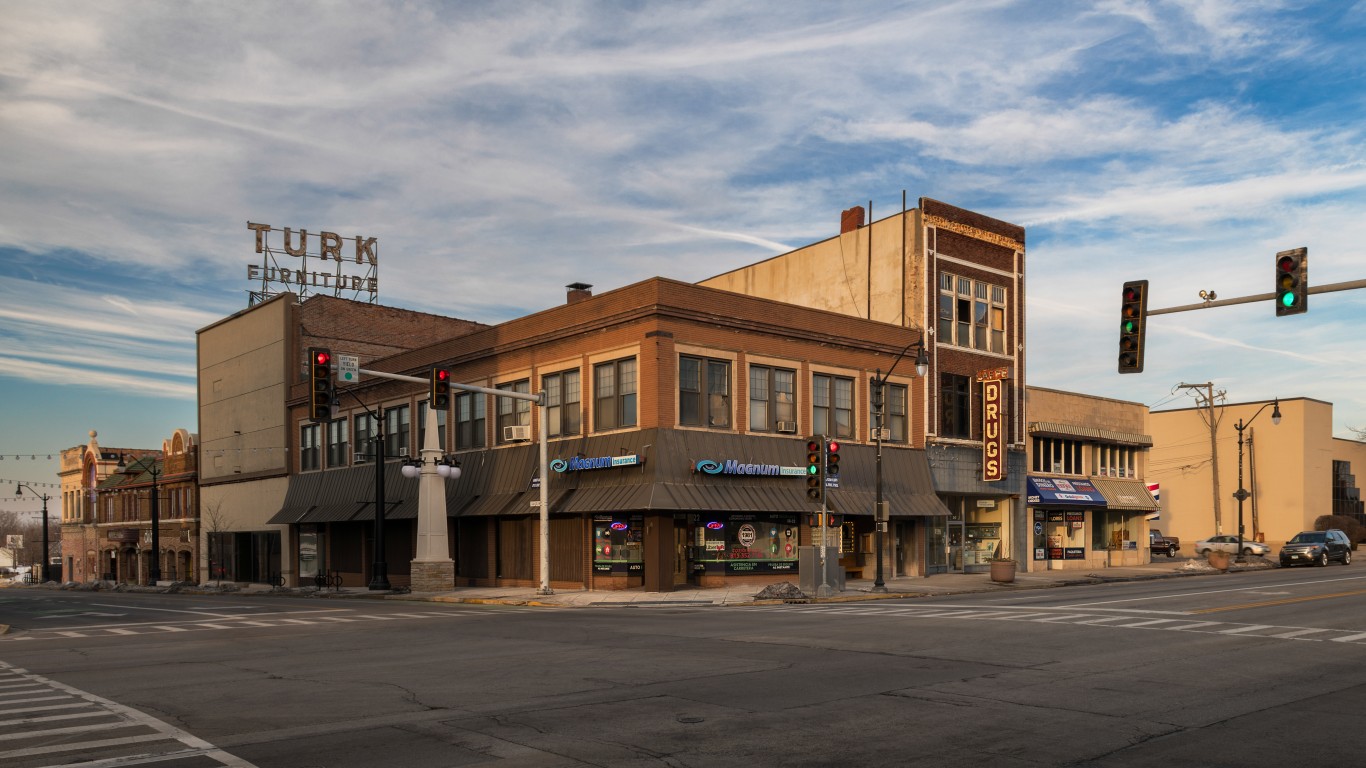
- Concentrated poverty rate: 24.2% of poor pop. living in poor neighborhoods
- Overall poverty rate: 13.2%
- Neighborhoods in extreme poverty: 3 of 30 tracts
- Avg. household income: $46,343 in poor tracts, $81,002 in all others
16. Niles, MI
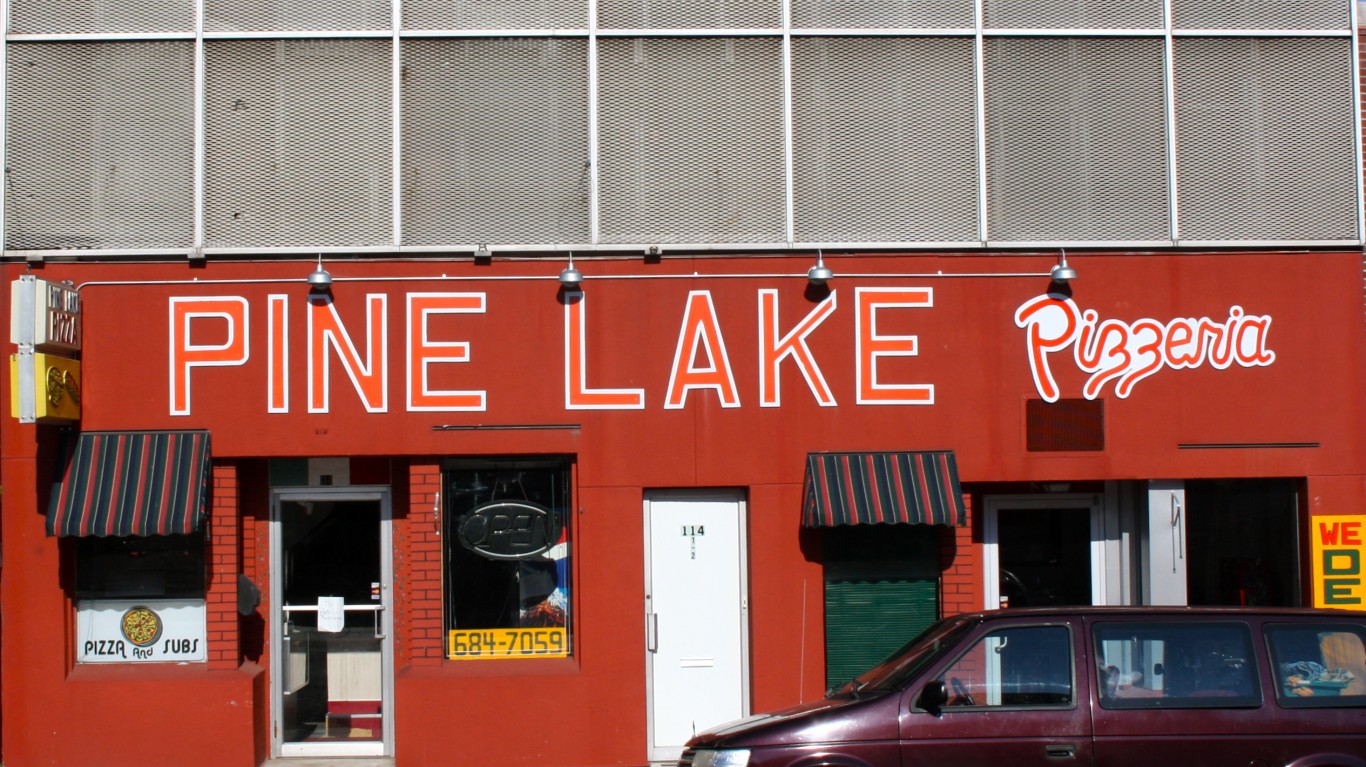
- Concentrated poverty rate: 24.2% of poor pop. living in poor neighborhoods
- Overall poverty rate: 15.9%
- Neighborhoods in extreme poverty: 5 of 53 tracts
- Avg. household income: $32,956 in poor tracts, $83,093 in all others
15. Decatur, IL

- Concentrated poverty rate: 24.3% of poor pop. living in poor neighborhoods
- Overall poverty rate: 15.3%
- Neighborhoods in extreme poverty: 6 of 37 tracts
- Avg. household income: $36,175 in poor tracts, $79,668 in all others
14. Memphis, TN-MS-AR

- Concentrated poverty rate: 24.7% of poor pop. living in poor neighborhoods
- Overall poverty rate: 16.9%
- Neighborhoods in extreme poverty: 47 of 352 tracts
- Avg. household income: $35,391 in poor tracts, $87,008 in all others
13. Hattiesburg, MS

- Concentrated poverty rate: 25.6% of poor pop. living in poor neighborhoods
- Overall poverty rate: 20.8%
- Neighborhoods in extreme poverty: 5 of 40 tracts
- Avg. household income: $55,054 in poor tracts, $78,031 in all others
12. Toledo, OH

- Concentrated poverty rate: 26.2% of poor pop. living in poor neighborhoods
- Overall poverty rate: 15.4%
- Neighborhoods in extreme poverty: 23 of 206 tracts
- Avg. household income: $34,663 in poor tracts, $82,651 in all others
11. Goldsboro, NC
- Concentrated poverty rate: 26.2% of poor pop. living in poor neighborhoods
- Overall poverty rate: 18.6%
- Neighborhoods in extreme poverty: 4 of 30 tracts
- Avg. household income: $40,622 in poor tracts, $71,048 in all others
10. Brownsville-Harlingen, TX
- Concentrated poverty rate: 27.0% of poor pop. living in poor neighborhoods
- Overall poverty rate: 26.3%
- Neighborhoods in extreme poverty: 22 of 118 tracts
- Avg. household income: $41,820 in poor tracts, $63,460 in all others
9. Binghamton, NY
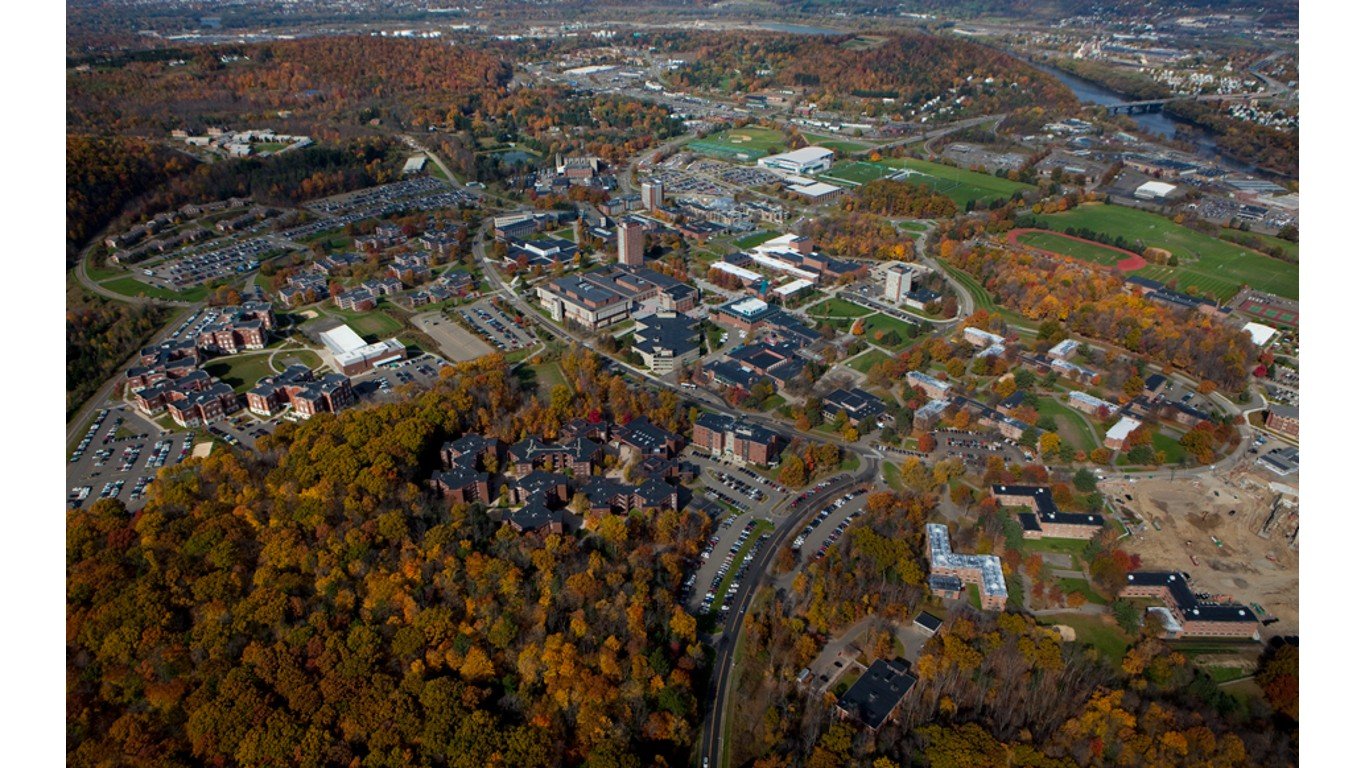
- Concentrated poverty rate: 27.1% of poor pop. living in poor neighborhoods
- Overall poverty rate: 16.8%
- Neighborhoods in extreme poverty: 9 of 67 tracts
- Avg. household income: $49,127 in poor tracts, $79,318 in all others
8. Greenville, NC
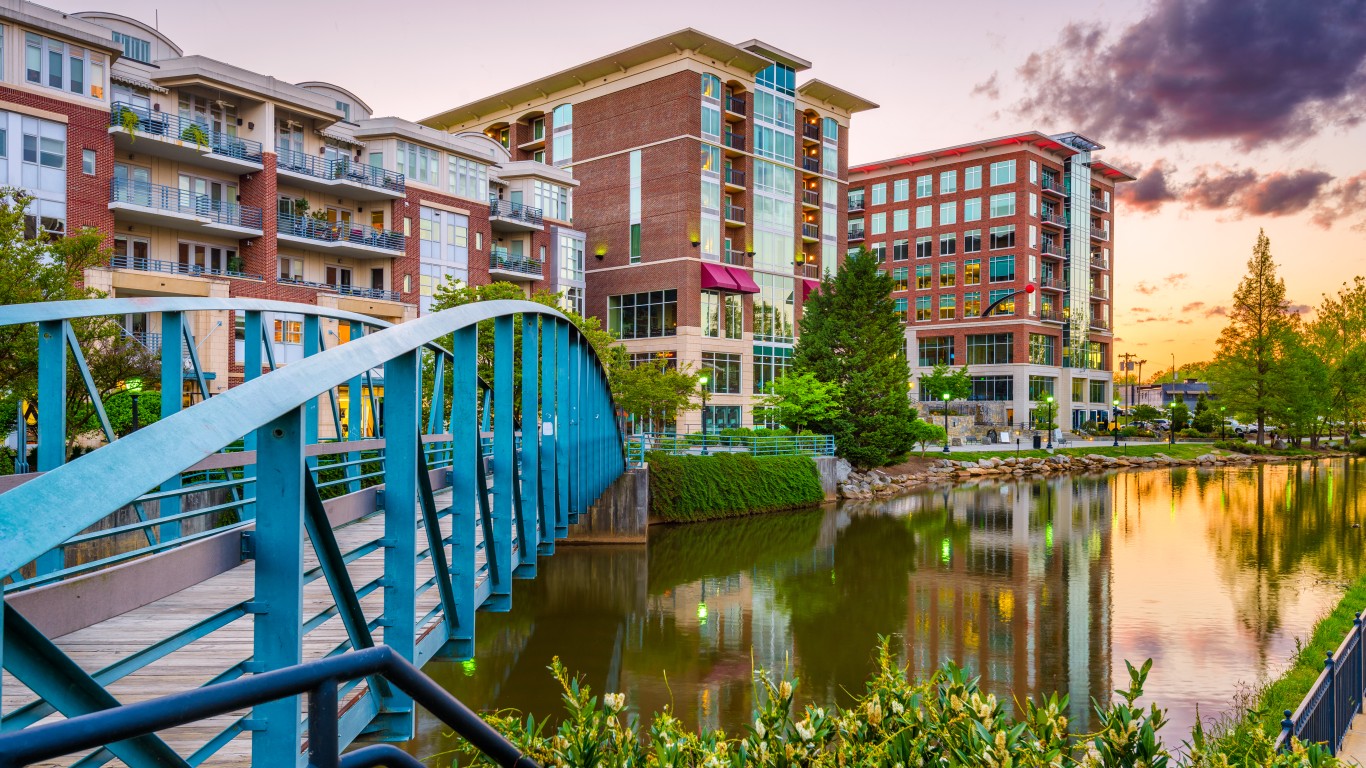
- Concentrated poverty rate: 27.1% of poor pop. living in poor neighborhoods
- Overall poverty rate: 20.7%
- Neighborhoods in extreme poverty: 6 of 40 tracts
- Avg. household income: $42,389 in poor tracts, $75,780 in all others
7. Shreveport-Bossier City, LA

- Concentrated poverty rate: 27.7% of poor pop. living in poor neighborhoods
- Overall poverty rate: 20.9%
- Neighborhoods in extreme poverty: 16 of 115 tracts
- Avg. household income: $35,065 in poor tracts, $76,596 in all others
6. Tallahassee, FL
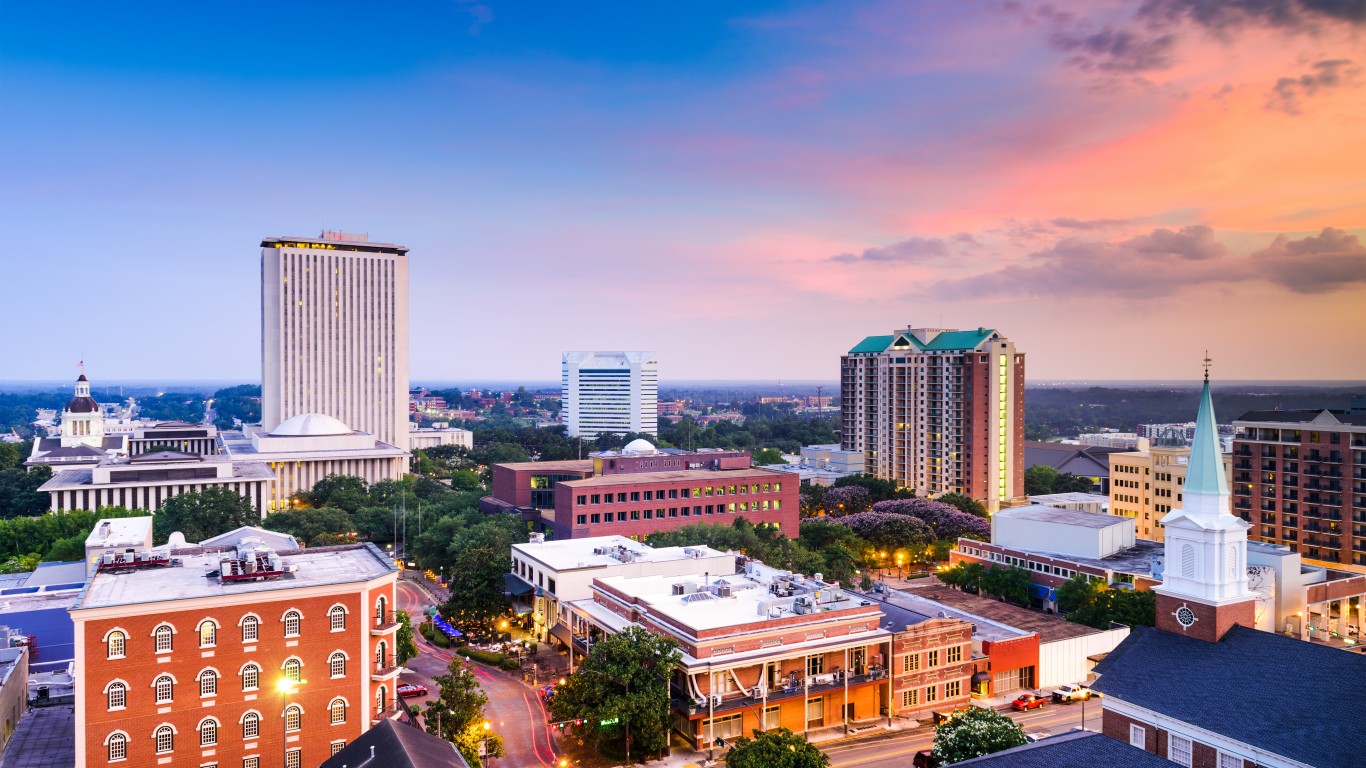
- Concentrated poverty rate: 30.6% of poor pop. living in poor neighborhoods
- Overall poverty rate: 18.7%
- Neighborhoods in extreme poverty: 11 of 92 tracts
- Avg. household income: $35,695 in poor tracts, $87,928 in all others
5. Saginaw, MI
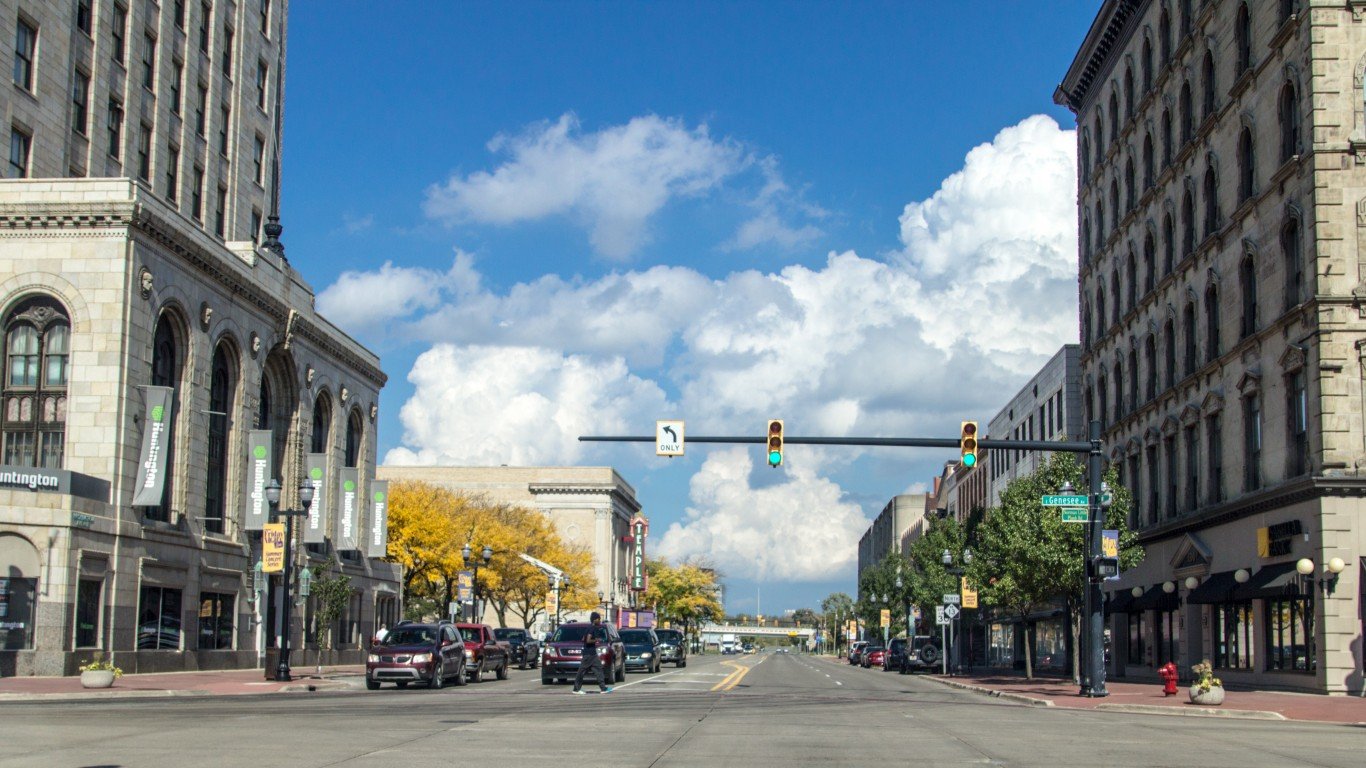
- Concentrated poverty rate: 32.0% of poor pop. living in poor neighborhoods
- Overall poverty rate: 18.0%
- Neighborhoods in extreme poverty: 8 of 60 tracts
- Avg. household income: $39,503 in poor tracts, $76,900 in all others
4. McAllen-Edinburg-Mission, TX
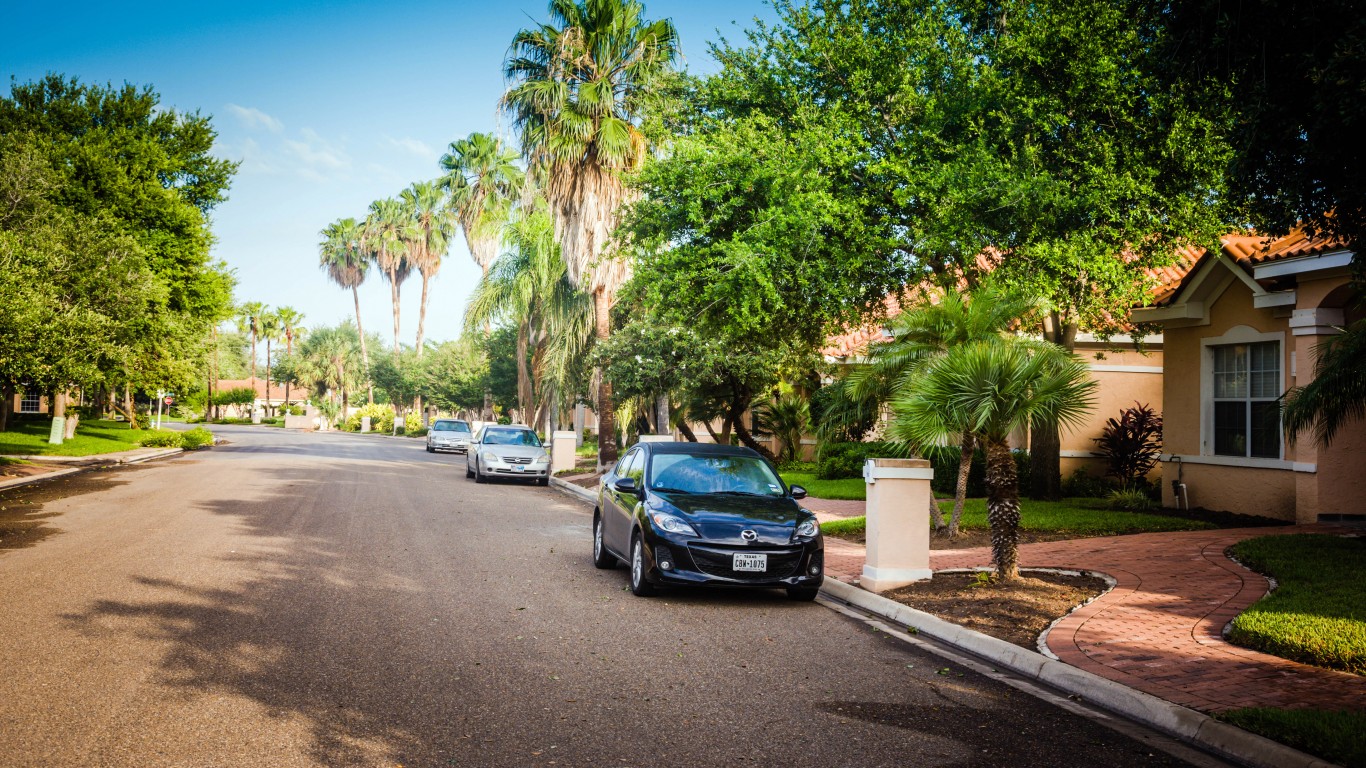
- Concentrated poverty rate: 32.5% of poor pop. living in poor neighborhoods
- Overall poverty rate: 28.1%
- Neighborhoods in extreme poverty: 40 of 211 tracts
- Avg. household income: $42,172 in poor tracts, $66,455 in all others
3. Macon-Bibb County, GA

- Concentrated poverty rate: 37.5% of poor pop. living in poor neighborhoods
- Overall poverty rate: 21.6%
- Neighborhoods in extreme poverty: 14 of 67 tracts
- Avg. household income: $33,764 in poor tracts, $79,706 in all others
2. Albany, GA
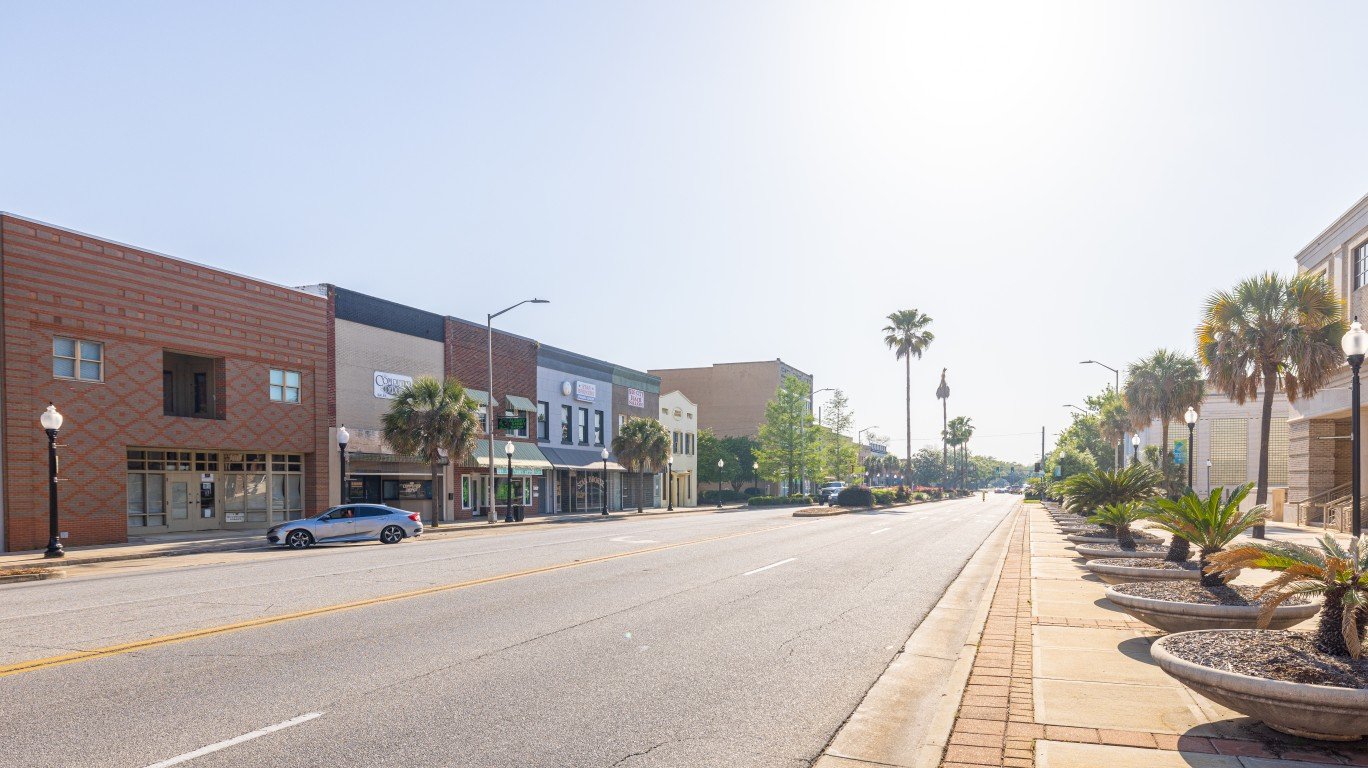
- Concentrated poverty rate: 38.4% of poor pop. living in poor neighborhoods
- Overall poverty rate: 21.9%
- Neighborhoods in extreme poverty: 10 of 46 tracts
- Avg. household income: $33,560 in poor tracts, $71,859 in all others
1. Monroe, LA
- Concentrated poverty rate: 44.9% of poor pop. living in poor neighborhoods
- Overall poverty rate: 25.0%
- Neighborhoods in extreme poverty: 18 of 65 tracts
- Avg. household income: $33,808 in poor tracts, $75,359 in all others
Methodology
To identify the 25 cities hit hardest by extreme poverty, 24/7 Wall St. reviewed five-year data on concentrated poverty from the U.S. Census Bureau’s 2021 American Community Survey. Metropolitan areas were ranked based on the share of residents with poverty level incomes living in extreme poverty neighborhoods — census tracts with a poverty rate of 40% or higher. This measure is called the extreme or concentrated poverty rate and is calculated by aggregating data from the census tract level to the metropolitan area level.
In our analysis, we only considered census tracts with at least 500 people and college or graduate school enrollment below 50%. Metro areas were also excluded if over 20% of the population in tracts or neighborhoods of concentrated poverty were college or university students, as large undergraduate populations can skew data on financial hardship. Data was aggregated using boundary definitions for July 2023 from the Census Bureau.
All other data referenced — homeownership, average household income, and unemployment — are also from the 2021 ACS. Figures were aggregated from the census tract to the metropolitan level.
Contact [email protected] for any questions or corrections.