
Over 720,000 cars were stolen in the United States in 2019, or 220 motor vehicle thefts for every 100,000 Americans. Those thefts disproportionately occurred in the nation’s urban areas. In some cities, the motor vehicle theft rate was well over 1,000 per 100,000 residents, and in nearly every state, there was at least one city with a higher rate than the national average.
24/7 Wall St. reviewed property crime data from the FBI’s 2019 Uniform Crime Report to identify the American cities with the highest motor vehicle theft rate — the number of car thefts per 100,000 residents — in every state. We considered all cities, towns, villages, and Census designated places home to at least 20,000 people in our analysis. The most stolen vehicle in the state came from data compiled by insurance analytics group, the National Insurance Crime Bureau, and is for 2018.
In general, the cities on this list with the highest motor vehicle theft rates — not just in their state, but nationwide — are in states with high auto theft rates. There are exceptions, though. Michigan falls among the lower half of states with a motor vehicle theft rate of 178 per 100,000 residents, but Detroit has over 1,000 motor vehicle thefts per 100,000 residents, one of the highest figures of any large city in the country.
To give more perspective on how much of a vehicle theft hot spot some of the cities on this list are, 12 cities accounted for more than 25% of the motor vehicle theft in their state in 2019, and three of the cities on this list accounted for more than half the auto theft in their respective states.
Motor vehicle theft, along with burglary and larceny, make up the broader property crime category as measured by law enforcement agencies and compiled by the FBI. Motor vehicle theft is the least common of the three. Still, many of the cities on this list also rank as having among the highest property crime rates in their state. While property crime does not necessarily occur in places with high violent crime, many of these cities also have among the highest violent crime rates in their state. These are the most dangerous cities in America.
Click here to see where your car is most likely to be stolen in every state.

Alabama: Hoover
> Vehicle theft rate, Hoover (2019): 117 per 100,000 residents
> Vehicle theft rate, Alabama (2019): 257 per 100,000 residents
> Total vehicles stolen, Hoover (2019): 100
> Total vehicles stolen, Alabama (2019): 12,577
> Property crime rate, Hoover (2019): 2,243 per 100,000 residents
> Property crime rate, Alabama (2019): 2,674 per 100,000 residents
> Most stolen vehicle, Alabama (2018): Chevrolet Pickup
[in-text-ad]
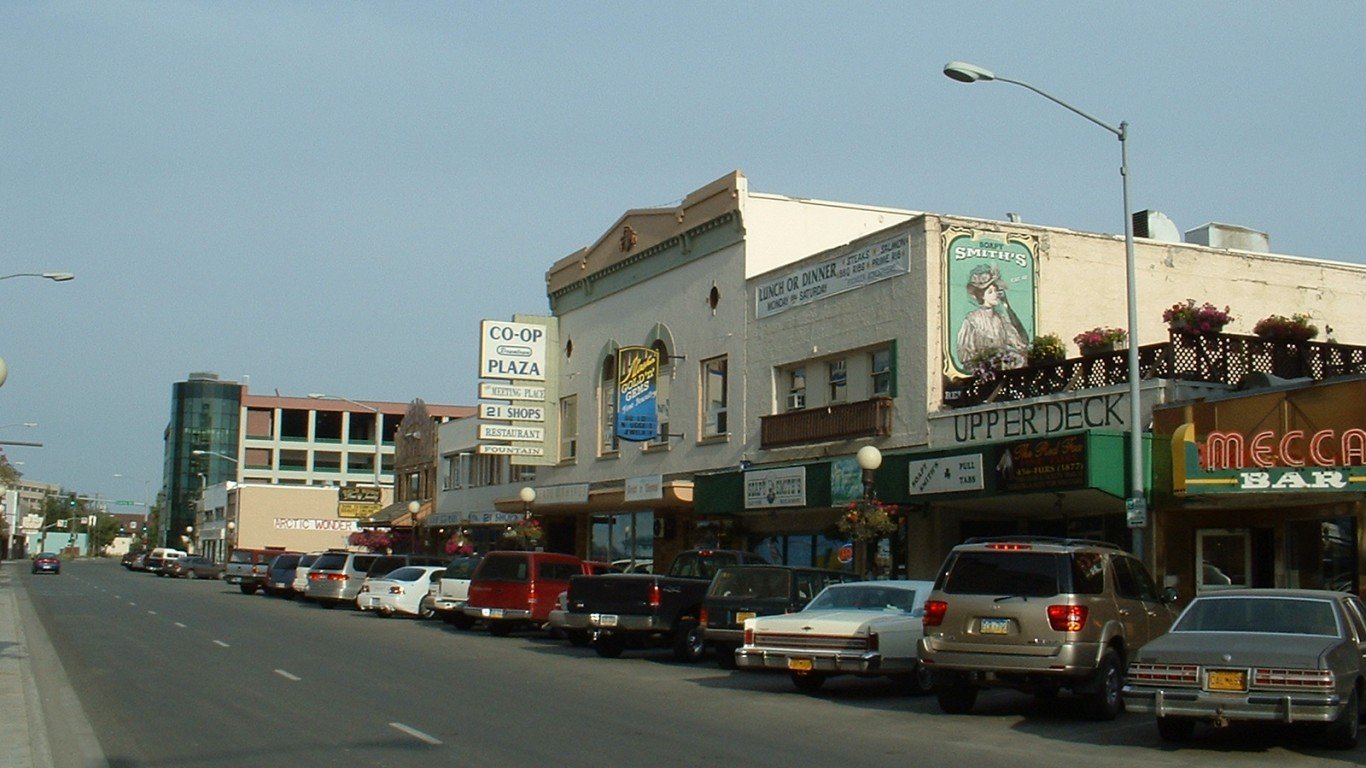
Alaska: Fairbanks
> Vehicle theft rate, Fairbanks (2019): 584 per 100,000 residents
> Vehicle theft rate, Alaska (2019): 358 per 100,000 residents
> Total vehicles stolen, Fairbanks (2019): 184
> Total vehicles stolen, Alaska (2019): 2,617
> Property crime rate, Fairbanks (2019): 4,296 per 100,000 residents
> Property crime rate, Alaska (2019): 2,911 per 100,000 residents
> Most stolen vehicle, Alaska (2018): Chevrolet Pickup
[recirclink id=769750]

Arizona: Nogales
> Vehicle theft rate, Nogales (2019): 661 per 100,000 residents
> Vehicle theft rate, Arizona (2019): 249 per 100,000 residents
> Total vehicles stolen, Nogales (2019): 133
> Total vehicles stolen, Arizona (2019): 18,151
> Property crime rate, Nogales (2019): 3,023 per 100,000 residents
> Property crime rate, Arizona (2019): 2,441 per 100,000 residents
> Most stolen vehicle, Arizona (2018): Chevrolet Pickup
Arkansas: Pine Bluff
> Vehicle theft rate, Pine Bluff (2019): 653 per 100,000 residents
> Vehicle theft rate, Arkansas (2019): 246 per 100,000 residents
> Total vehicles stolen, Pine Bluff (2019): 271
> Total vehicles stolen, Arkansas (2019): 7,420
> Property crime rate, Pine Bluff (2019): 00 per 100,000 residents
> Property crime rate, Arkansas (2019): 2,858 per 100,000 residents
> Most stolen vehicle, Arkansas (2018): Chevrolet Pickup
[in-text-ad-2]

California: Oakland
> Vehicle theft rate, Oakland (2019): 1,161 per 100,000 residents
> Vehicle theft rate, California (2019): 359 per 100,000 residents
> Total vehicles stolen, Oakland (2019): 5,041
> Total vehicles stolen, California (2019): 141,757
> Property crime rate, Oakland (2019): 6,421 per 100,000 residents
> Property crime rate, California (2019): 2,331 per 100,000 residents
> Most stolen vehicle, California (2018): Honda Civic
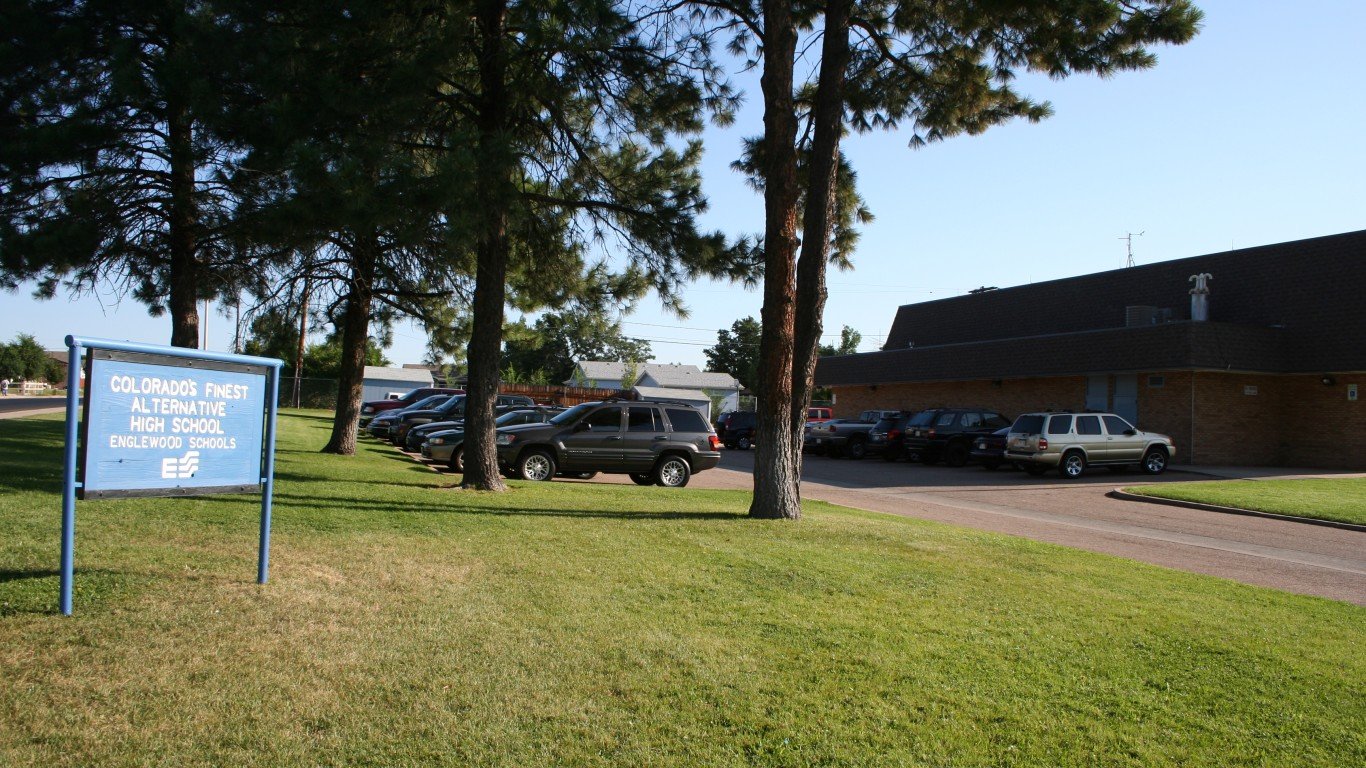
Colorado: Englewood
> Vehicle theft rate, Englewood (2019): 859 per 100,000 residents
> Vehicle theft rate, Colorado (2019): 384 per 100,000 residents
> Total vehicles stolen, Englewood (2019): 303
> Total vehicles stolen, Colorado (2019): 22,113
> Property crime rate, Englewood (2019): 5,225 per 100,000 residents
> Property crime rate, Colorado (2019): 2,591 per 100,000 residents
> Most stolen vehicle, Colorado (2018): Ford Pickup
[in-text-ad]

Connecticut: New Haven
> Vehicle theft rate, New Haven (2019): 551 per 100,000 residents
> Vehicle theft rate, Connecticut (2019): 167 per 100,000 residents
> Total vehicles stolen, New Haven (2019): 719
> Total vehicles stolen, Connecticut (2019): 5,964
> Property crime rate, New Haven (2019): 3,799 per 100,000 residents
> Property crime rate, Connecticut (2019): 1,427 per 100,000 residents
> Most stolen vehicle, Connecticut (2018): Honda Civic
[recirclink id=799927]

Delaware: Wilmington
> Vehicle theft rate, Wilmington (2019): 651 per 100,000 residents
> Vehicle theft rate, Delaware (2019): 165 per 100,000 residents
> Total vehicles stolen, Wilmington (2019): 460
> Total vehicles stolen, Delaware (2019): 1,604
> Property crime rate, Wilmington (2019): 4,460 per 100,000 residents
> Property crime rate, Delaware (2019): 2,252 per 100,000 residents
> Most stolen vehicle, Delaware (2018): Honda Accord

Florida: Panama City
> Vehicle theft rate, Panama City (2019): 597 per 100,000 residents
> Vehicle theft rate, Florida (2019): 182 per 100,000 residents
> Total vehicles stolen, Panama City (2019): 222
> Total vehicles stolen, Florida (2019): 39,048
> Property crime rate, Panama City (2019): 5,145 per 100,000 residents
> Property crime rate, Florida (2019): 2,146 per 100,000 residents
> Most stolen vehicle, Florida (2018): Ford Pickup
[in-text-ad-2]

Georgia: Forest Park
> Vehicle theft rate, Forest Park (2019): 582 per 100,000 residents
> Vehicle theft rate, Georgia (2019): 224 per 100,000 residents
> Total vehicles stolen, Forest Park (2019): 118
> Total vehicles stolen, Georgia (2019): 23,776
> Property crime rate, Forest Park (2019): 4,454 per 100,000 residents
> Property crime rate, Georgia (2019): 2,376 per 100,000 residents
> Most stolen vehicle, Georgia (2018): Ford Pickup

Hawaii: Honolulu
> Vehicle theft rate, Honolulu (2019): 394 per 100,000 residents
> Vehicle theft rate, Hawaii (2019): 371 per 100,000 residents
> Total vehicles stolen, Honolulu (2019): 3,837
> Total vehicles stolen, Hawaii (2019): 5,254
> Property crime rate, Honolulu (2019): 3,002 per 100,000 residents
> Property crime rate, Hawaii (2019): 2,841 per 100,000 residents
> Most stolen vehicle, Hawaii (2018): Honda Civic
[in-text-ad]

Idaho: Caldwell
> Vehicle theft rate, Caldwell (2019): 216 per 100,000 residents
> Vehicle theft rate, Idaho (2019): 88 per 100,000 residents
> Total vehicles stolen, Caldwell (2019): 125
> Total vehicles stolen, Idaho (2019): 1,571
> Property crime rate, Caldwell (2019): 1,721 per 100,000 residents
> Property crime rate, Idaho (2019): 1,220 per 100,000 residents
> Most stolen vehicle, Idaho (2018): Ford Pickup
[recirclink id=800100]

Illinois: South Holland
> Vehicle theft rate, South Holland (2019): 616 per 100,000 residents
> Vehicle theft rate, Illinois (2019): 148 per 100,000 residents
> Total vehicles stolen, South Holland (2019): 132
> Total vehicles stolen, Illinois (2019): 18,775
> Property crime rate, South Holland (2019): 2,677 per 100,000 residents
> Property crime rate, Illinois (2019): 1,847 per 100,000 residents
> Most stolen vehicle, Illinois (2018): Chevrolet Impala

Indiana: Gary
> Vehicle theft rate, Gary (2019): 656 per 100,000 residents
> Vehicle theft rate, Indiana (2019): 204 per 100,000 residents
> Total vehicles stolen, Gary (2019): 490
> Total vehicles stolen, Indiana (2019): 13,723
> Property crime rate, Gary (2019): 3,556 per 100,000 residents
> Property crime rate, Indiana (2019): 1,971 per 100,000 residents
> Most stolen vehicle, Indiana (2018): Ford Pickup
[in-text-ad-2]

Iowa: Council Bluffs
> Vehicle theft rate, Council Bluffs (2019): 787 per 100,000 residents
> Vehicle theft rate, Iowa (2019): 163 per 100,000 residents
> Total vehicles stolen, Council Bluffs (2019): 491
> Total vehicles stolen, Iowa (2019): 5,142
> Property crime rate, Council Bluffs (2019): 5,845 per 100,000 residents
> Property crime rate, Iowa (2019): 1,734 per 100,000 residents
> Most stolen vehicle, Iowa (2018): Chevrolet Pickup

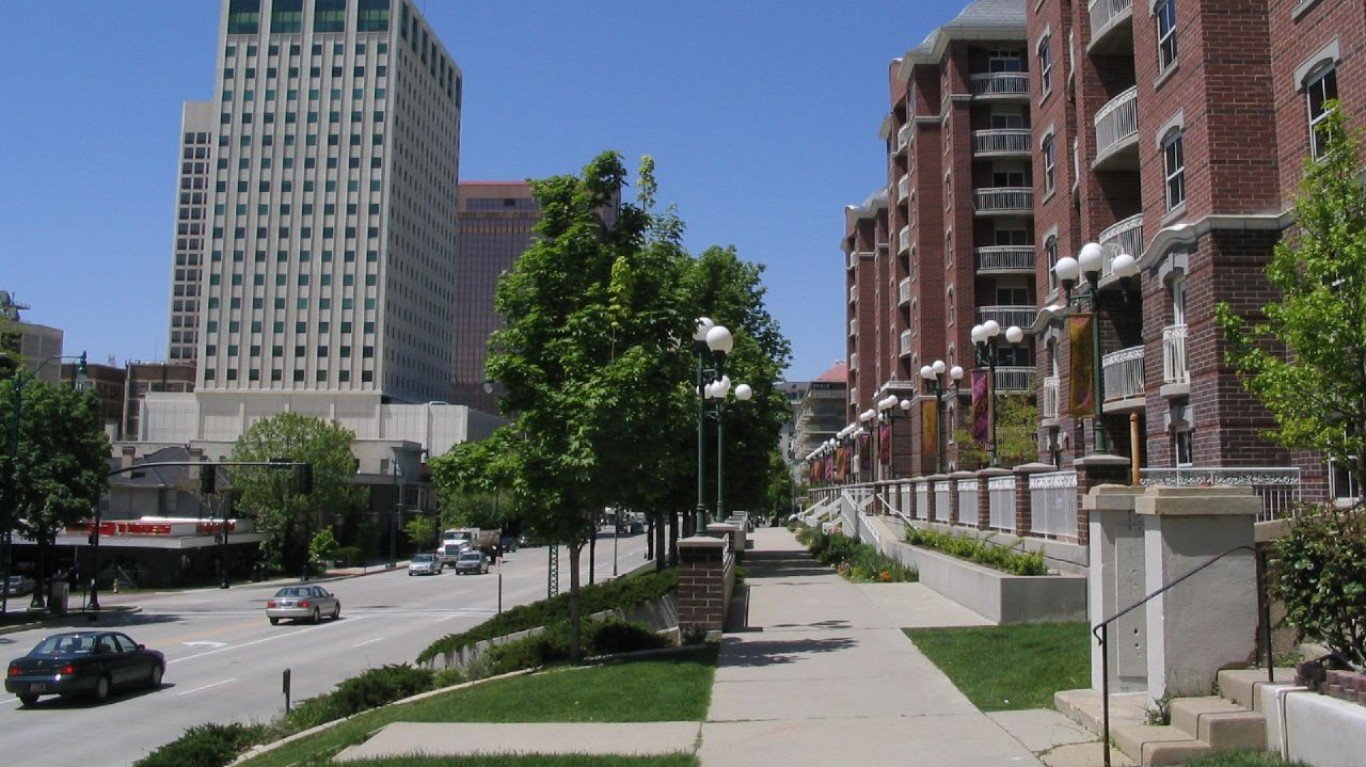
Kansas: Topeka
> Vehicle theft rate, Topeka (2019): 766 per 100,000 residents
> Vehicle theft rate, Kansas (2019): 250 per 100,000 residents
> Total vehicles stolen, Topeka (2019): 962
> Total vehicles stolen, Kansas (2019): 7,279
> Property crime rate, Topeka (2019): 4,991 per 100,000 residents
> Property crime rate, Kansas (2019): 2,315 per 100,000 residents
> Most stolen vehicle, Kansas (2018): Ford Pickup
[in-text-ad]
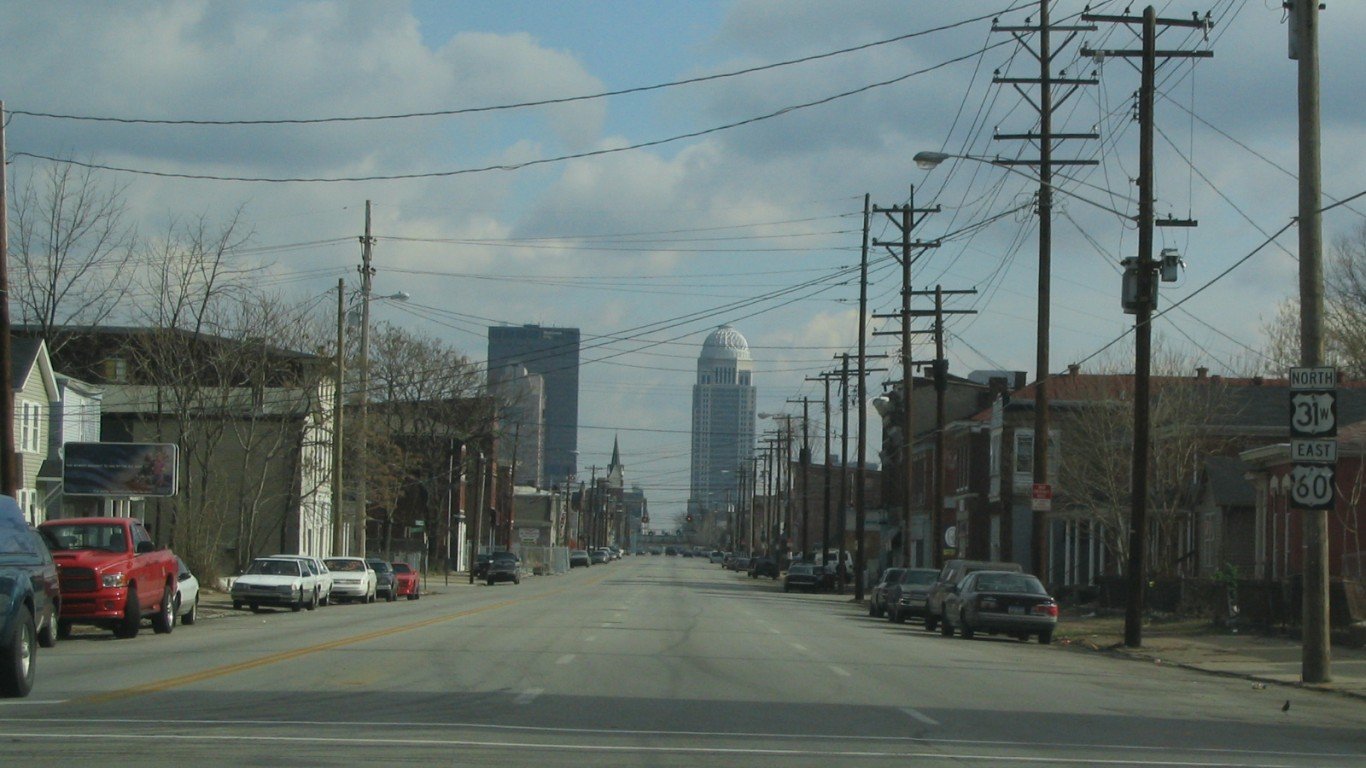
Kentucky: Louisville Metro
> Vehicle theft rate, Louisville Metro (2019): 582 per 100,000 residents
> Vehicle theft rate, Kentucky (2019): 228 per 100,000 residents
> Total vehicles stolen, Louisville Metro (2019): 3,934
> Total vehicles stolen, Kentucky (2019): 10,196
> Property crime rate, Louisville Metro (2019): 3,891 per 100,000 residents
> Property crime rate, Kentucky (2019): 1,897 per 100,000 residents
> Most stolen vehicle, Kentucky (2018): Chevrolet Pickup
[recirclink id=788083]

Louisiana: New Orleans
> Vehicle theft rate, New Orleans (2019): 748 per 100,000 residents
> Vehicle theft rate, Louisiana (2019): 231 per 100,000 residents
> Total vehicles stolen, New Orleans (2019): 2,951
> Total vehicles stolen, Louisiana (2019): 10,716
> Property crime rate, New Orleans (2019): 5,293 per 100,000 residents
> Property crime rate, Louisiana (2019): 3,162 per 100,000 residents
> Most stolen vehicle, Louisiana (2018): Ford Pickup

Maine: Portland
> Vehicle theft rate, Portland (2019): 111 per 100,000 residents
> Vehicle theft rate, Maine (2019): 54 per 100,000 residents
> Total vehicles stolen, Portland (2019): 74
> Total vehicles stolen, Maine (2019): 726
> Property crime rate, Portland (2019): 2,581 per 100,000 residents
> Property crime rate, Maine (2019): 1,246 per 100,000 residents
> Most stolen vehicle, Maine (2018): Chevrolet Pickup
[in-text-ad-2]

Maryland: Baltimore
> Vehicle theft rate, Baltimore (2019): 660 per 100,000 residents
> Vehicle theft rate, Maryland (2019): 186 per 100,000 residents
> Total vehicles stolen, Baltimore (2019): 3,939
> Total vehicles stolen, Maryland (2019): 11,259
> Property crime rate, Baltimore (2019): 4,311 per 100,000 residents
> Property crime rate, Maryland (2019): 1,950 per 100,000 residents
> Most stolen vehicle, Maryland (2018): Honda Accord

Massachusetts: Springfield
> Vehicle theft rate, Springfield (2019): 319 per 100,000 residents
> Vehicle theft rate, Massachusetts (2019): 89 per 100,000 residents
> Total vehicles stolen, Springfield (2019): 493
> Total vehicles stolen, Massachusetts (2019): 6,132
> Property crime rate, Springfield (2019): 2,595 per 100,000 residents
> Property crime rate, Massachusetts (2019): 1,180 per 100,000 residents
> Most stolen vehicle, Massachusetts (2018): Honda Accord
[in-text-ad]

Michigan: Detroit
> Vehicle theft rate, Detroit (2019): 1,038 per 100,000 residents
> Vehicle theft rate, Michigan (2019): 178 per 100,000 residents
> Total vehicles stolen, Detroit (2019): 6,886
> Total vehicles stolen, Michigan (2019): 17,744
> Property crime rate, Detroit (2019): 4,303 per 100,000 residents
> Property crime rate, Michigan (2019): 1,585 per 100,000 residents
> Most stolen vehicle, Michigan (2018): Chevrolet Impala
[recirclink id=800463]

Minnesota: St. Paul
> Vehicle theft rate, St. Paul (2019): 780 per 100,000 residents
> Vehicle theft rate, Minnesota (2019): 199 per 100,000 residents
> Total vehicles stolen, St. Paul (2019): 2,419
> Total vehicles stolen, Minnesota (2019): 11,217
> Property crime rate, St. Paul (2019): 3,612 per 100,000 residents
> Property crime rate, Minnesota (2019): 2,079 per 100,000 residents
> Most stolen vehicle, Minnesota (2018): Honda Civic

Mississippi: Jackson
> Vehicle theft rate, Jackson (2019): 558 per 100,000 residents
> Vehicle theft rate, Mississippi (2019): 193 per 100,000 residents
> Total vehicles stolen, Jackson (2019): 912
> Total vehicles stolen, Mississippi (2019): 5,747
> Property crime rate, Jackson (2019): 4,538 per 100,000 residents
> Property crime rate, Mississippi (2019): 2,376 per 100,000 residents
> Most stolen vehicle, Mississippi (2018): Ford Pickup
[in-text-ad-2]

Missouri: St. Louis
> Vehicle theft rate, St. Louis (2019): 998 per 100,000 residents
> Vehicle theft rate, Missouri (2019): 343 per 100,000 residents
> Total vehicles stolen, St. Louis (2019): 2,998
> Total vehicles stolen, Missouri (2019): 21,072
> Property crime rate, St. Louis (2019): 6,183 per 100,000 residents
> Property crime rate, Missouri (2019): 2,639 per 100,000 residents
> Most stolen vehicle, Missouri (2018): Ford Pickup
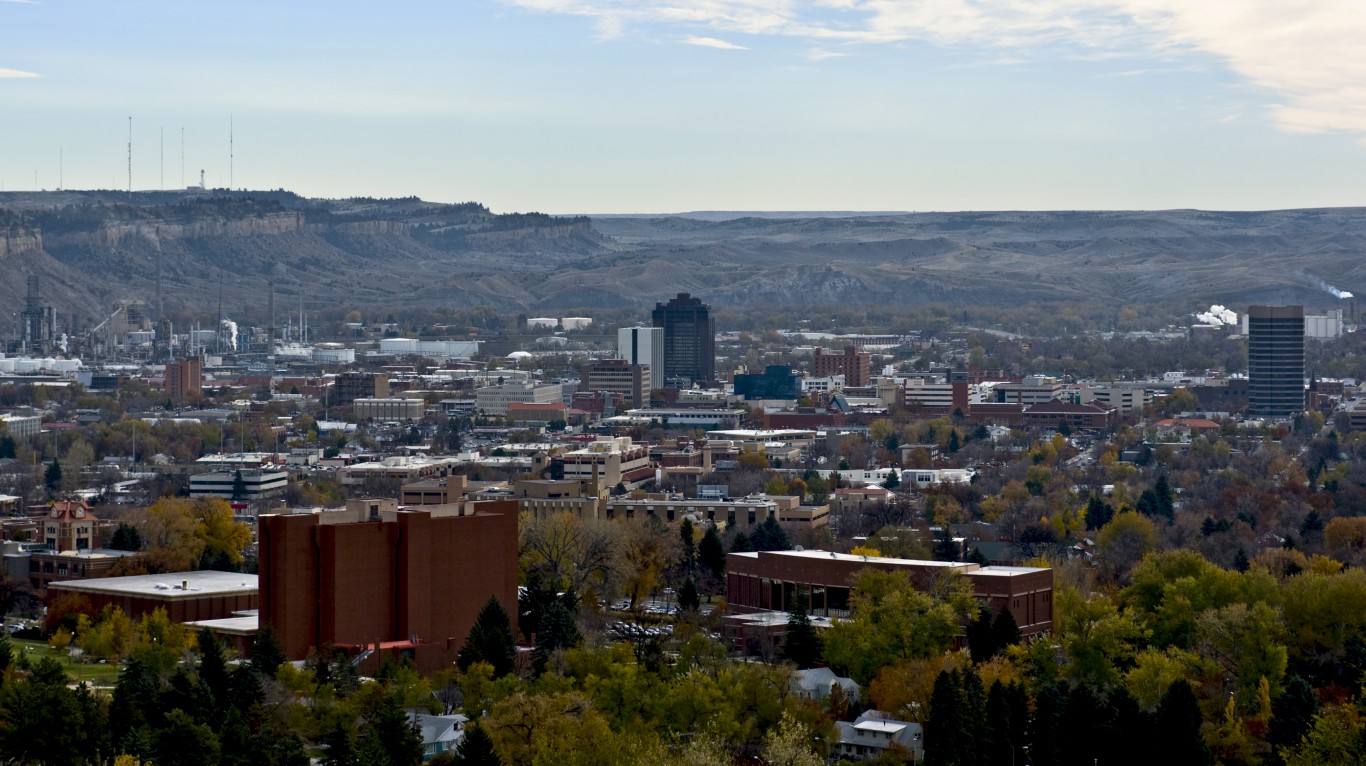
Montana: Billings
> Vehicle theft rate, Billings (2019): 567 per 100,000 residents
> Vehicle theft rate, Montana (2019): 222 per 100,000 residents
> Total vehicles stolen, Billings (2019): 625
> Total vehicles stolen, Montana (2019): 2,377
> Property crime rate, Billings (2019): 4,083 per 100,000 residents
> Property crime rate, Montana (2019): 2,193 per 100,000 residents
> Most stolen vehicle, Montana (2018): Ford Pickup
[in-text-ad]

Nebraska: Omaha
> Vehicle theft rate, Omaha (2019): 670 per 100,000 residents
> Vehicle theft rate, Nebraska (2019): 258 per 100,000 residents
> Total vehicles stolen, Omaha (2019): 3,153
> Total vehicles stolen, Nebraska (2019): 4,985
> Property crime rate, Omaha (2019): 3,644 per 100,000 residents
> Property crime rate, Nebraska (2019): 2,039 per 100,000 residents
> Most stolen vehicle, Nebraska (2018): Chevrolet Pickup
[recirclink id=769750]

Nevada: Reno
> Vehicle theft rate, Reno (2019): 464 per 100,000 residents
> Vehicle theft rate, Nevada (2019): 366 per 100,000 residents
> Total vehicles stolen, Reno (2019): 1,179
> Total vehicles stolen, Nevada (2019): 11,260
> Property crime rate, Reno (2019): 2,101 per 100,000 residents
> Property crime rate, Nevada (2019): 2,322 per 100,000 residents
> Most stolen vehicle, Nevada (2018): Honda Civic

New Hampshire: Manchester
> Vehicle theft rate, Manchester (2019): 136 per 100,000 residents
> Vehicle theft rate, New Hampshire (2019): 66 per 100,000 residents
> Total vehicles stolen, Manchester (2019): 154
> Total vehicles stolen, New Hampshire (2019): 893
> Property crime rate, Manchester (2019): 2,372 per 100,000 residents
> Property crime rate, New Hampshire (2019): 1,209 per 100,000 residents
> Most stolen vehicle, New Hampshire (2018): Honda Civic
[in-text-ad-2]

New Jersey: Camden
> Vehicle theft rate, Camden (2019): 730 per 100,000 residents
> Vehicle theft rate, New Jersey (2019): 116 per 100,000 residents
> Total vehicles stolen, Camden (2019): 535
> Total vehicles stolen, New Jersey (2019): 10,336
> Property crime rate, Camden (2019): 2,867 per 100,000 residents
> Property crime rate, New Jersey (2019): 1,336 per 100,000 residents
> Most stolen vehicle, New Jersey (2018): Honda Accord
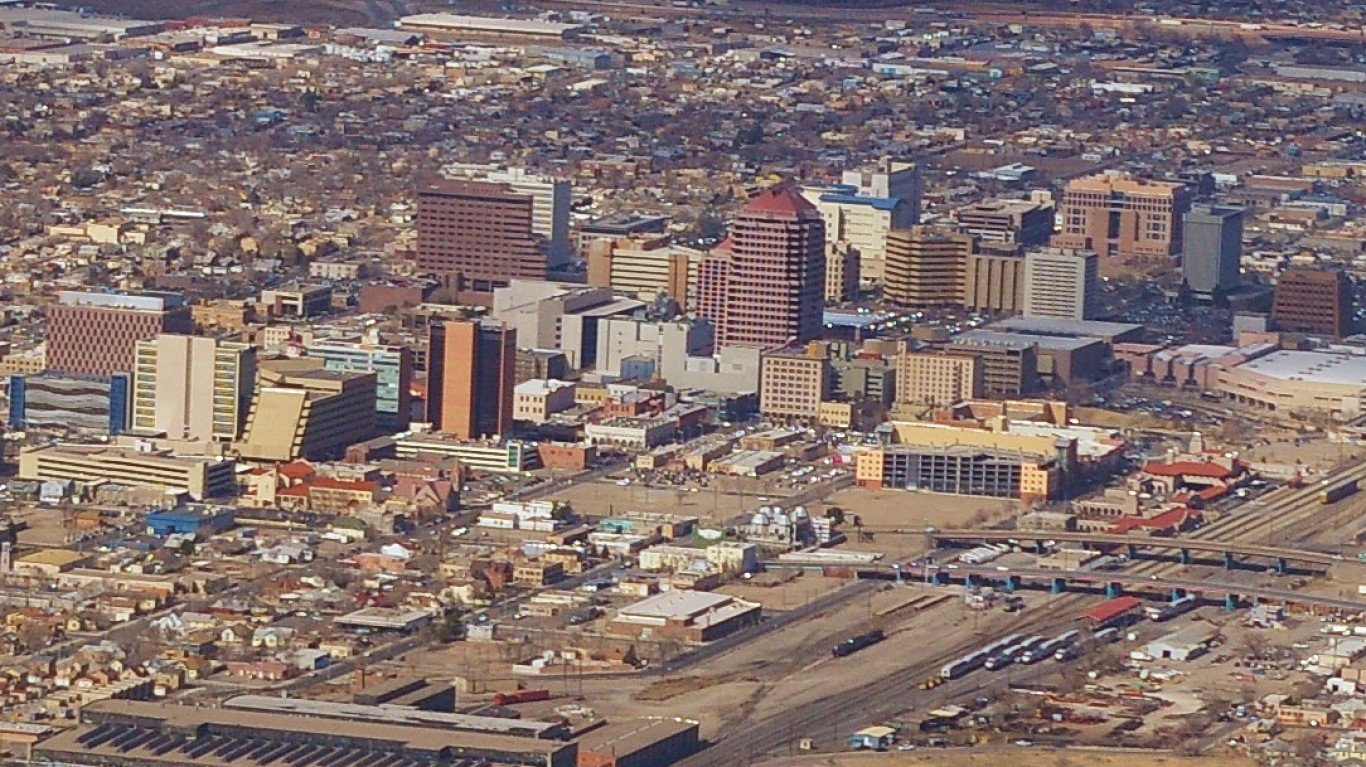
New Mexico: Albuquerque
> Vehicle theft rate, Albuquerque (2019): 965 per 100,000 residents
> Vehicle theft rate, New Mexico (2019): 427 per 100,000 residents
> Total vehicles stolen, Albuquerque (2019): 5,425
> Total vehicles stolen, New Mexico (2019): 8,957
> Property crime rate, Albuquerque (2019): 00 per 100,000 residents
> Property crime rate, New Mexico (2019): 3,113 per 100,000 residents
> Most stolen vehicle, New Mexico (2018): Chevrolet Pickup
[in-text-ad]

New York: Syracuse
> Vehicle theft rate, Syracuse (2019): 395 per 100,000 residents
> Vehicle theft rate, New York (2019): 65 per 100,000 residents
> Total vehicles stolen, Syracuse (2019): 563
> Total vehicles stolen, New York (2019): 12,704
> Property crime rate, Syracuse (2019): 3,134 per 100,000 residents
> Property crime rate, New York (2019): 1,373 per 100,000 residents
> Most stolen vehicle, New York (2018): Honda Accord
[recirclink id=799927]

North Carolina: Asheville
> Vehicle theft rate, Asheville (2019): 575 per 100,000 residents
> Vehicle theft rate, North Carolina (2019): 172 per 100,000 residents
> Total vehicles stolen, Asheville (2019): 538
> Total vehicles stolen, North Carolina (2019): 18,061
> Property crime rate, Asheville (2019): 6,325 per 100,000 residents
> Property crime rate, North Carolina (2019): 2,357 per 100,000 residents
> Most stolen vehicle, North Carolina (2018): Honda Accord
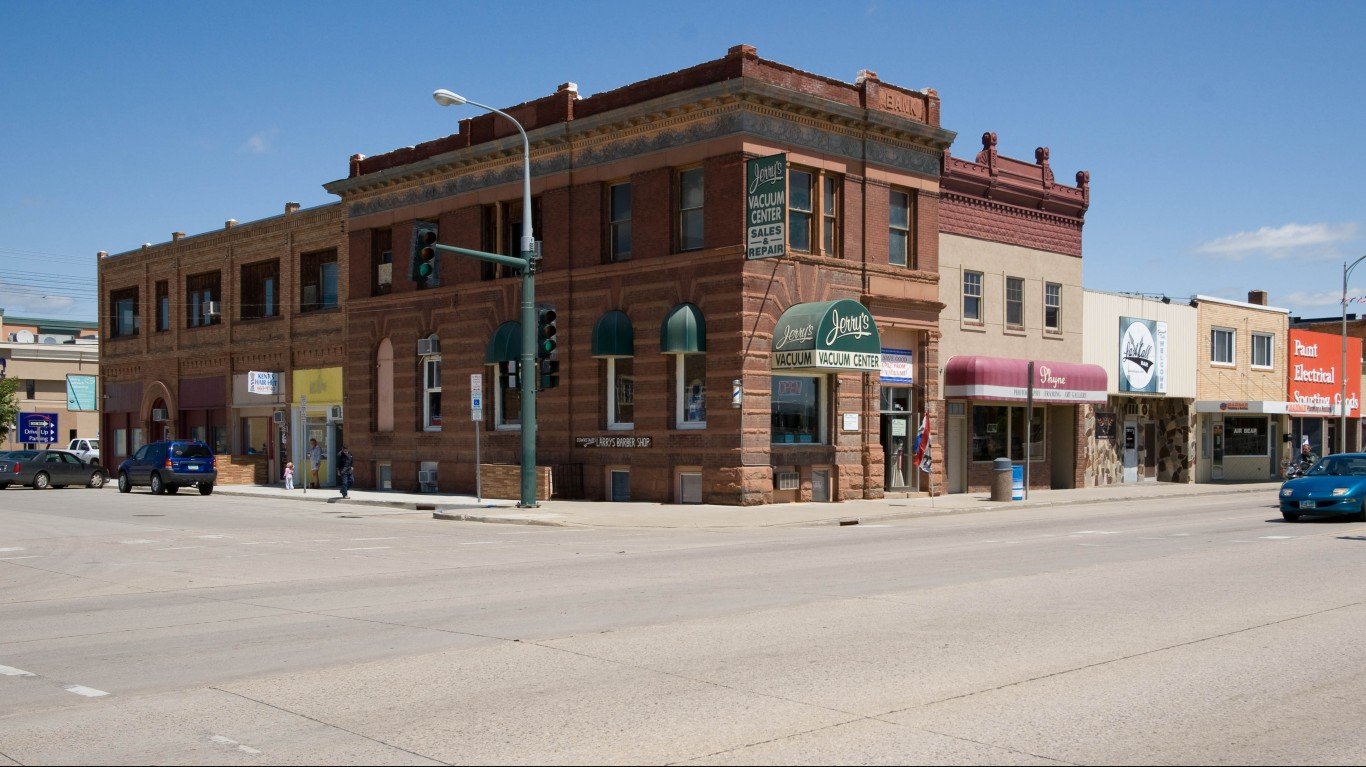
North Dakota: Mandan
> Vehicle theft rate, Mandan (2019): 426 per 100,000 residents
> Vehicle theft rate, North Dakota (2019): 235 per 100,000 residents
> Total vehicles stolen, Mandan (2019): 98
> Total vehicles stolen, North Dakota (2019): 1,792
> Property crime rate, Mandan (2019): 2,868 per 100,000 residents
> Property crime rate, North Dakota (2019): 1,977 per 100,000 residents
> Most stolen vehicle, North Dakota (2018): Chevrolet Pickup
[in-text-ad-2]

Ohio: Cleveland
> Vehicle theft rate, Cleveland (2019): 728 per 100,000 residents
> Vehicle theft rate, Ohio (2019): 160 per 100,000 residents
> Total vehicles stolen, Cleveland (2019): 2,778
> Total vehicles stolen, Ohio (2019): 18,672
> Property crime rate, Cleveland (2019): 4,467 per 100,000 residents
> Property crime rate, Ohio (2019): 2,056 per 100,000 residents
> Most stolen vehicle, Ohio (2018): Ford Pickup

Oklahoma: Tulsa
> Vehicle theft rate, Tulsa (2019): 755 per 100,000 residents
> Vehicle theft rate, Oklahoma (2019): 338 per 100,000 residents
> Total vehicles stolen, Tulsa (2019): 3,033
> Total vehicles stolen, Oklahoma (2019): 13,378
> Property crime rate, Tulsa (2019): 5,311 per 100,000 residents
> Property crime rate, Oklahoma (2019): 2,845 per 100,000 residents
> Most stolen vehicle, Oklahoma (2018): Chevrolet Pickup
[in-text-ad]

Oregon: Portland
> Vehicle theft rate, Portland (2019): 971 per 100,000 residents
> Vehicle theft rate, Oregon (2019): 360 per 100,000 residents
> Total vehicles stolen, Portland (2019): 6,432
> Total vehicles stolen, Oregon (2019): 15,185
> Property crime rate, Portland (2019): 5,203 per 100,000 residents
> Property crime rate, Oregon (2019): 2,731 per 100,000 residents
> Most stolen vehicle, Oregon (2018): Honda Civic
[recirclink id=800100]

Pennsylvania: Chester
> Vehicle theft rate, Chester (2019): 496 per 100,000 residents
> Vehicle theft rate, Pennsylvania (2019): 97 per 100,000 residents
> Total vehicles stolen, Chester (2019): 168
> Total vehicles stolen, Pennsylvania (2019): 12,390
> Property crime rate, Chester (2019): 3,005 per 100,000 residents
> Property crime rate, Pennsylvania (2019): 1,403 per 100,000 residents
> Most stolen vehicle, Pennsylvania (2018): Honda Civic

Rhode Island: Providence
> Vehicle theft rate, Providence (2019): 264 per 100,000 residents
> Vehicle theft rate, Rhode Island (2019): 128 per 100,000 residents
> Total vehicles stolen, Providence (2019): 474
> Total vehicles stolen, Rhode Island (2019): 1,358
> Property crime rate, Providence (2019): 3,011 per 100,000 residents
> Property crime rate, Rhode Island (2019): 1,535 per 100,000 residents
> Most stolen vehicle, Rhode Island (2018): Honda Accord
[in-text-ad-2]
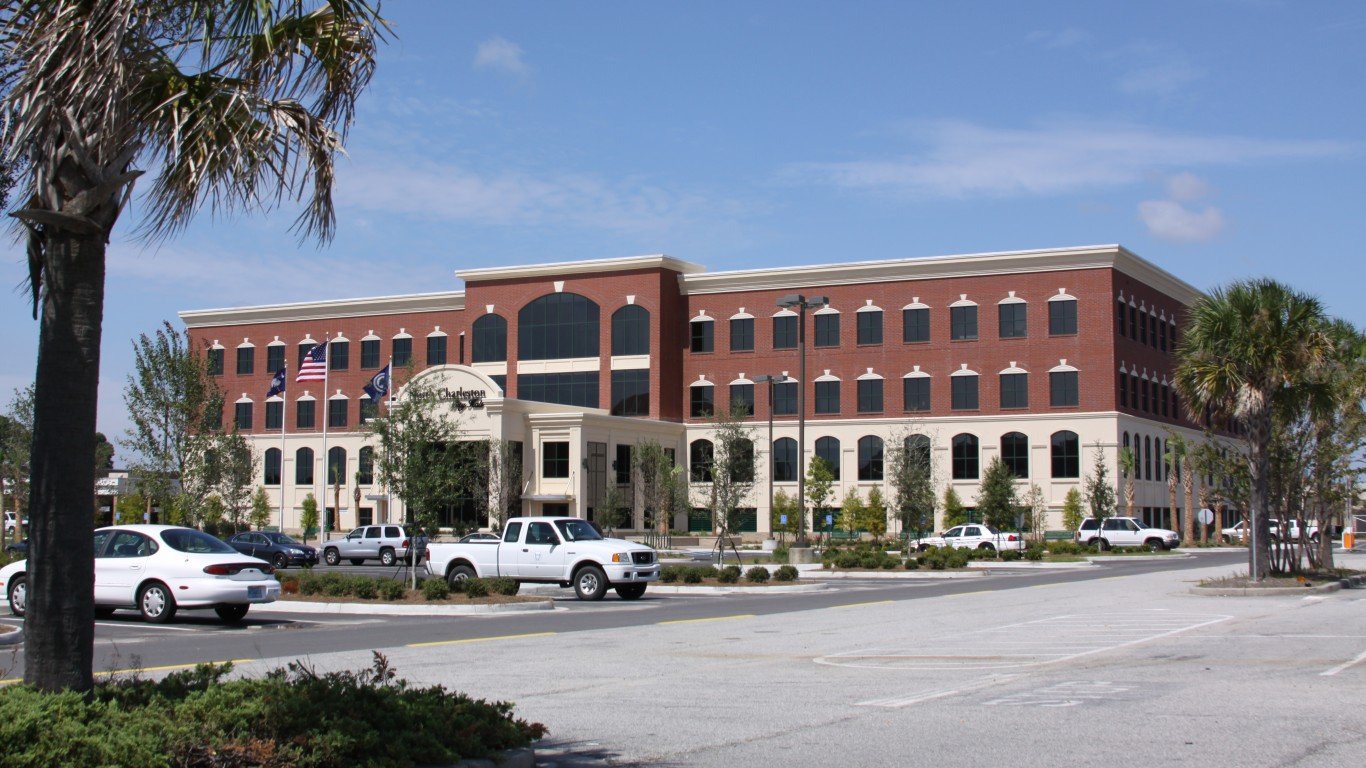
South Carolina: North Charleston
> Vehicle theft rate, North Charleston (2019): 837 per 100,000 residents
> Vehicle theft rate, South Carolina (2019): 291 per 100,000 residents
> Total vehicles stolen, North Charleston (2019): 965
> Total vehicles stolen, South Carolina (2019): 14,975
> Property crime rate, North Charleston (2019): 6,019 per 100,000 residents
> Property crime rate, South Carolina (2019): 2,940 per 100,000 residents
> Most stolen vehicle, South Carolina (2018): Ford Pickup

South Dakota: Rapid City
> Vehicle theft rate, Rapid City (2019): 419 per 100,000 residents
> Vehicle theft rate, South Dakota (2019): 199 per 100,000 residents
> Total vehicles stolen, Rapid City (2019): 320
> Total vehicles stolen, South Dakota (2019): 1,756
> Property crime rate, Rapid City (2019): 3,214 per 100,000 residents
> Property crime rate, South Dakota (2019): 1,771 per 100,000 residents
> Most stolen vehicle, South Dakota (2018): Chevrolet Pickup
[in-text-ad]

Tennessee: Chattanooga
> Vehicle theft rate, Chattanooga (2019): 723 per 100,000 residents
> Vehicle theft rate, Tennessee (2019): 281 per 100,000 residents
> Total vehicles stolen, Chattanooga (2019): 1,314
> Total vehicles stolen, Tennessee (2019): 19,180
> Property crime rate, Chattanooga (2019): 5,557 per 100,000 residents
> Property crime rate, Tennessee (2019): 2,653 per 100,000 residents
> Most stolen vehicle, Tennessee (2018): Chevrolet Pickup
[recirclink id=788083]
Texas: Balch Springs
> Vehicle theft rate, Balch Springs (2019): 878 per 100,000 residents
> Vehicle theft rate, Texas (2019): 267 per 100,000 residents
> Total vehicles stolen, Balch Springs (2019): 224
> Total vehicles stolen, Texas (2019): 77,489
> Property crime rate, Balch Springs (2019): 3,547 per 100,000 residents
> Property crime rate, Texas (2019): 2,391 per 100,000 residents
> Most stolen vehicle, Texas (2018): Ford Pickup
Utah: South Salt Lake
> Vehicle theft rate, South Salt Lake (2019): 1,367 per 100,000 residents
> Vehicle theft rate, Utah (2019): 210 per 100,000 residents
> Total vehicles stolen, South Salt Lake (2019): 350
> Total vehicles stolen, Utah (2019): 6,738
> Property crime rate, South Salt Lake (2019): 7,285 per 100,000 residents
> Property crime rate, Utah (2019): 2,169 per 100,000 residents
> Most stolen vehicle, Utah (2018): Honda Civic
[in-text-ad-2]

Vermont: Burlington
> Vehicle theft rate, Burlington (2019): 58 per 100,000 residents
> Vehicle theft rate, Vermont (2019): 48 per 100,000 residents
> Total vehicles stolen, Burlington (2019): 25
> Total vehicles stolen, Vermont (2019): 298
> Property crime rate, Burlington (2019): 2,584 per 100,000 residents
> Property crime rate, Vermont (2019): 1,424 per 100,000 residents
> Most stolen vehicle, Vermont (2018): Toyota Tacoma
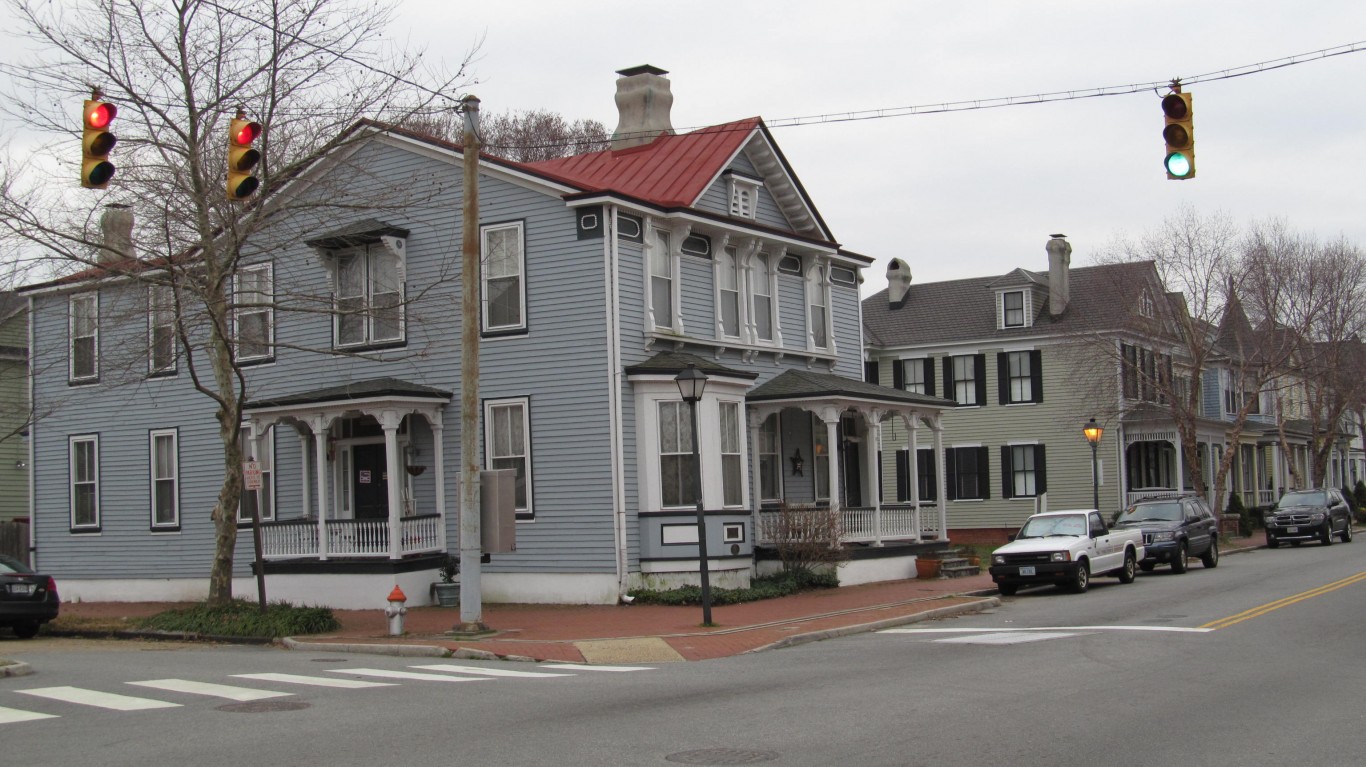
Virginia: Portsmouth
> Vehicle theft rate, Portsmouth (2019): 504 per 100,000 residents
> Vehicle theft rate, Virginia (2019): 120 per 100,000 residents
> Total vehicles stolen, Portsmouth (2019): 474
> Total vehicles stolen, Virginia (2019): 10,269
> Property crime rate, Portsmouth (2019): 5,861 per 100,000 residents
> Property crime rate, Virginia (2019): 1,643 per 100,000 residents
> Most stolen vehicle, Virginia (2018): Honda Accord
[in-text-ad]
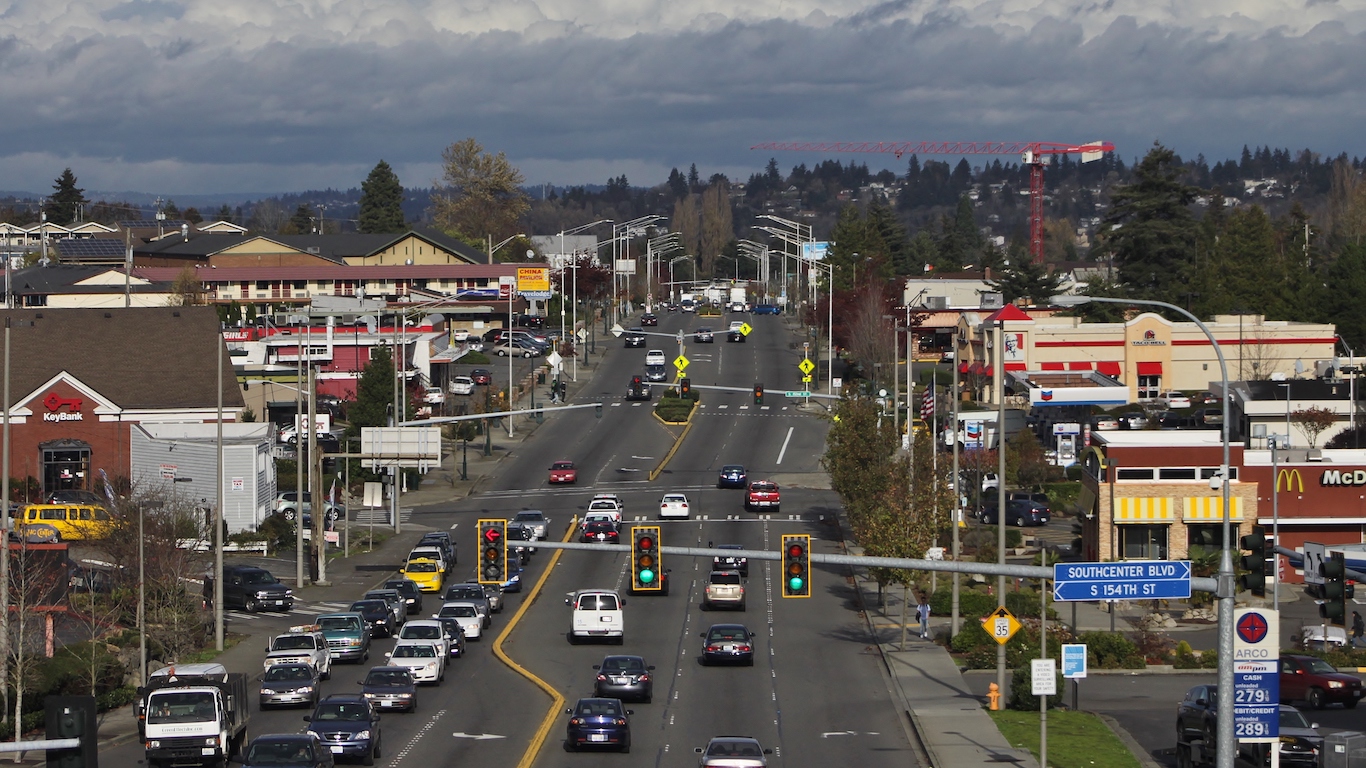
Washington: Tukwila
> Vehicle theft rate, Tukwila (2019): 2,348 per 100,000 residents
> Vehicle theft rate, Washington (2019): 321 per 100,000 residents
> Total vehicles stolen, Tukwila (2019): 480
> Total vehicles stolen, Washington (2019): 24,402
> Property crime rate, Tukwila (2019): 16,390 per 100,000 residents
> Property crime rate, Washington (2019): 2,682 per 100,000 residents
> Most stolen vehicle, Washington (2018): Honda Civic
[recirclink id=800463]

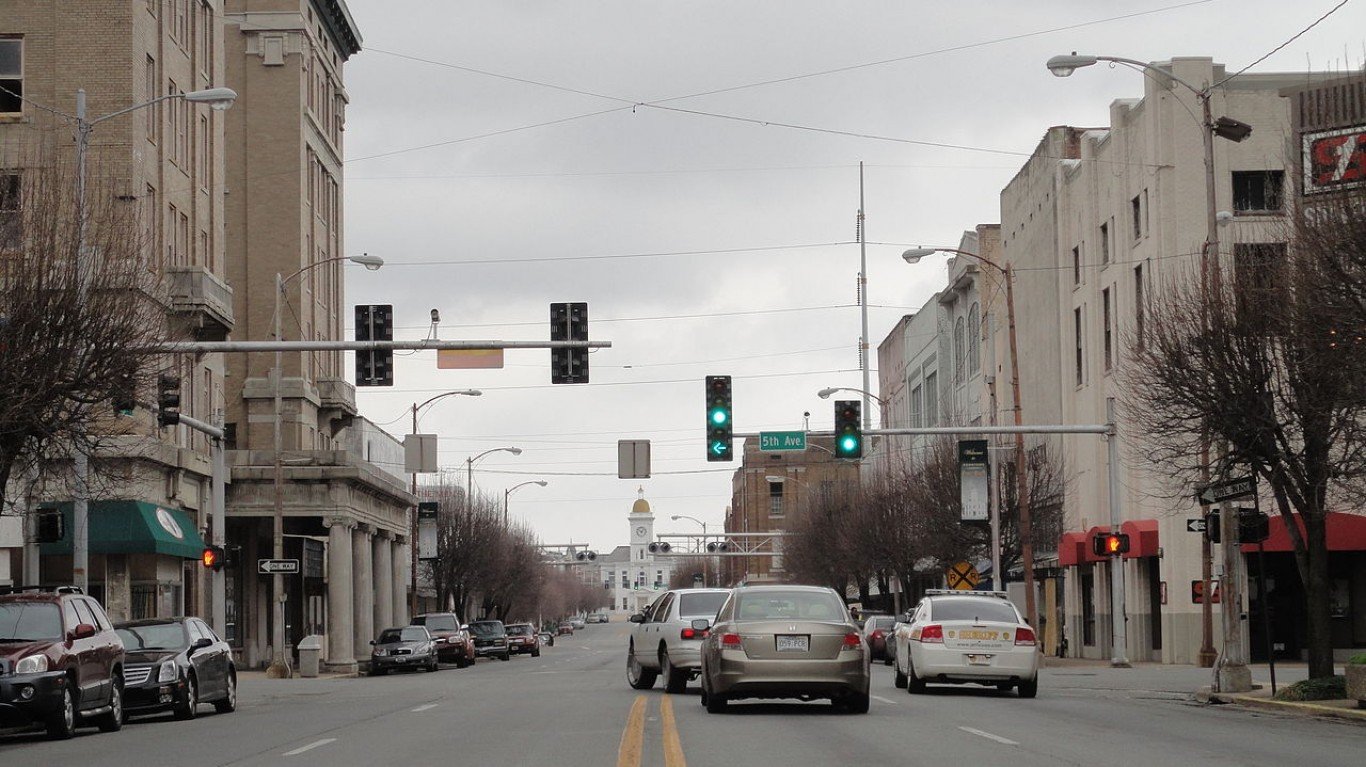
West Virginia: Huntington
> Vehicle theft rate, Huntington (2019): 414 per 100,000 residents
> Vehicle theft rate, West Virginia (2019): 135 per 100,000 residents
> Total vehicles stolen, Huntington (2019): 189
> Total vehicles stolen, West Virginia (2019): 2,419
> Property crime rate, Huntington (2019): 3,923 per 100,000 residents
> Property crime rate, West Virginia (2019): 1,583 per 100,000 residents
> Most stolen vehicle, West Virginia (2018): Ford Pickup

Wisconsin: Milwaukee
> Vehicle theft rate, Milwaukee (2019): 584 per 100,000 residents
> Vehicle theft rate, Wisconsin (2019): 127 per 100,000 residents
> Total vehicles stolen, Milwaukee (2019): 3,450
> Total vehicles stolen, Wisconsin (2019): 7,385
> Property crime rate, Milwaukee (2019): 2,555 per 100,000 residents
> Property crime rate, Wisconsin (2019): 1,471 per 100,000 residents
> Most stolen vehicle, Wisconsin (2018): Dodge Caravan
[in-text-ad-2]

Wyoming: Cheyenne
> Vehicle theft rate, Cheyenne (2019): 271 per 100,000 residents
> Vehicle theft rate, Wyoming (2019): 123 per 100,000 residents
> Total vehicles stolen, Cheyenne (2019): 175
> Total vehicles stolen, Wyoming (2019): 713
> Property crime rate, Cheyenne (2019): 3,099 per 100,000 residents
> Property crime rate, Wyoming (2019): 1,571 per 100,000 residents
> Most stolen vehicle, Wyoming (2018): Ford Pickup
Contact [email protected] for any questions or corrections.