On Dec. 30, the United Kingdom became the first country to approve for use a vaccine developed jointly by AstraZeneca and the University of Oxford. This approval in the U.K. comes as the country faces an outbreak of a new, more easily spread strain of the virus. It remains to be seen whether the vaccine will receive approval in the United States — the Food and Drug Administration will likely not make a decision on the vaccine until February.
If the vaccine received approval in the United States, it would be the third to be approved, following those developed by Pfizer and BioNTech and Moderna. Unlike the other two, which showed to be over 90% effective, this vaccine was only shown to have an efficacy of 70%. However, the AstraZeneca/Oxford has the added benefit of being comparatively easy to produce and transport.
This latest vaccination news comes as nations race to inoculate as much of their populations as is possible as the virus continues to infect hundreds of thousands every day. In the U.S., while the number of new daily reported cases has fallen from over 200,000 per day reported in mid-December, new daily cases remain still extremely high — nearly 180,000 new cases were confirmed in the U.S. on Dec. 29. That same day, over 3,200 Americans died from the illness, one of the worst daily totals since the outbreak began.
Using data from state and local health departments, 24/7 Wall St. compiled and reviewed county-level COVID-19 data. We compared the average of daily new confirmed COVID-19 cases for the week ending Dec. 29 to the average in the previous week to determine the county in each state where the virus is spreading the fastest, adjusted for the population. Though the number of new daily cases has been falling nationwide and in most states, all but six states have at least one county or county equivalent in which cases have grown at a faster rate over the past week compared to the week before. We excluded counties with populations of fewer than 5,000 people as well as those with fewer than 20 reported new cases in the past 14 days.
Nationwide, the number of new daily cases per 100,000 residents fell by 10, from roughly 68 per 100,000 in the week ending Dec. 22 to 65 per 100,000 in the week ending Dec. 29. In 21 states, at least one county reported a weekly increase of at least 30 cases per 100,000. In eight states, the county with the largest increase in cases reported a weekly surge of more than 50 COVID-19 cases per 100,000 residents. These are the states where the spread of the virus is declining the fastest, and where it is still getting worse.
Click here to see the places in every state where COVID-19 is growing the fastest right now.

Alabama: Bullock County
> Change in daily avg. new COVID-19 cases, week over week: +43 per 100,000 people
> Avg. new daily cases in Bullock County in 7 days ending Dec. 29: 76 per 100,000
> Avg. new daily cases in Bullock County in 7 days ending Dec. 22: 33 per 100,000
> Avg. new daily cases in Alabama in 7 days ending Dec. 29: 78 per 100,000 (4th most)
> Cumulative confirmed COVID-19 cases in Bullock County as of Dec. 29: 8,056 per 100,000 people (total: 834)
> Population: 10,352
> Largest place in Bullock County: Union Springs
[in-text-ad]

Alaska: No large county with increase
> Avg. new daily cases in Alaska in 7 days ending Dec. 29: 42 per 100,000 (10th fewest)
[recirclink id=826484]

Arizona: La Paz County
> Change in daily avg. new COVID-19 cases, week over week: +48 per 100,000 people
> Avg. new daily cases in La Paz County in 7 days ending Dec. 29: 107 per 100,000
> Avg. new daily cases in La Paz County in 7 days ending Dec. 22: 59 per 100,000
> Avg. new daily cases in Arizona in 7 days ending Dec. 29: 86 per 100,000 (3rd most)
> Cumulative confirmed COVID-19 cases in La Paz County as of Dec. 29: 6,507 per 100,000 people (total: 1,347)
> Population: 20,701
> Largest place in La Paz County: Quartzsite

Arkansas: Prairie County
> Change in daily avg. new COVID-19 cases, week over week: +61 per 100,000 people
> Avg. new daily cases in Prairie County in 7 days ending Dec. 29: 170 per 100,000
> Avg. new daily cases in Prairie County in 7 days ending Dec. 22: 109 per 100,000
> Avg. new daily cases in Arkansas in 7 days ending Dec. 29: 72 per 100,000 (7th most)
> Cumulative confirmed COVID-19 cases in Prairie County as of Dec. 29: 8,066 per 100,000 people (total: 665)
> Population: 8,244
> Largest place in Prairie County: Des Arc
[in-text-ad-2]

California: San Benito County
> Change in daily avg. new COVID-19 cases, week over week: +23 per 100,000 people
> Avg. new daily cases in San Benito County in 7 days ending Dec. 29: 123 per 100,000
> Avg. new daily cases in San Benito County in 7 days ending Dec. 22: 100 per 100,000
> Avg. new daily cases in California in 7 days ending Dec. 29: 103 per 100,000 (2nd most)
> Cumulative confirmed COVID-19 cases in San Benito County as of Dec. 29: 5,771 per 100,000 people (total: 3,429)
> Population: 59,416
> Largest place in San Benito County: Hollister
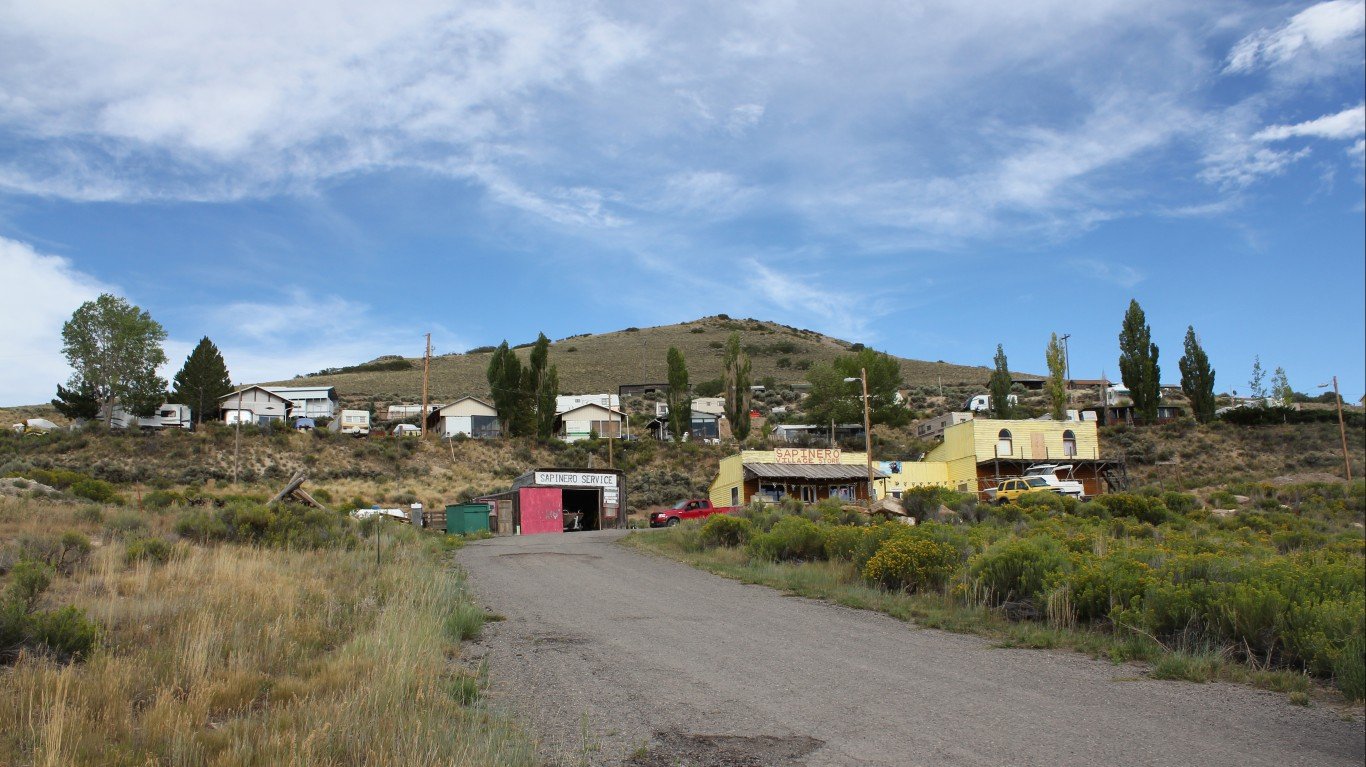
Colorado: Gunnison County
> Change in daily avg. new COVID-19 cases, week over week: +22 per 100,000 people
> Avg. new daily cases in Gunnison County in 7 days ending Dec. 29: 69 per 100,000
> Avg. new daily cases in Gunnison County in 7 days ending Dec. 22: 46 per 100,000
> Avg. new daily cases in Colorado in 7 days ending Dec. 29: 47 per 100,000 (17th fewest)
> Cumulative confirmed COVID-19 cases in Gunnison County as of Dec. 29: 4,148 per 100,000 people (total: 686)
> Population: 16,537
> Largest place in Gunnison County: Gunnison
[in-text-ad]

Connecticut: No large county with increase
> Avg. new daily cases in Connecticut in 7 days ending Dec. 29: 47 per 100,000 (16th fewest)
[recirclink id=826475]

Delaware: No large county with increase
> Avg. new daily cases in Delaware in 7 days ending Dec. 29: 65 per 100,000 (14th most)

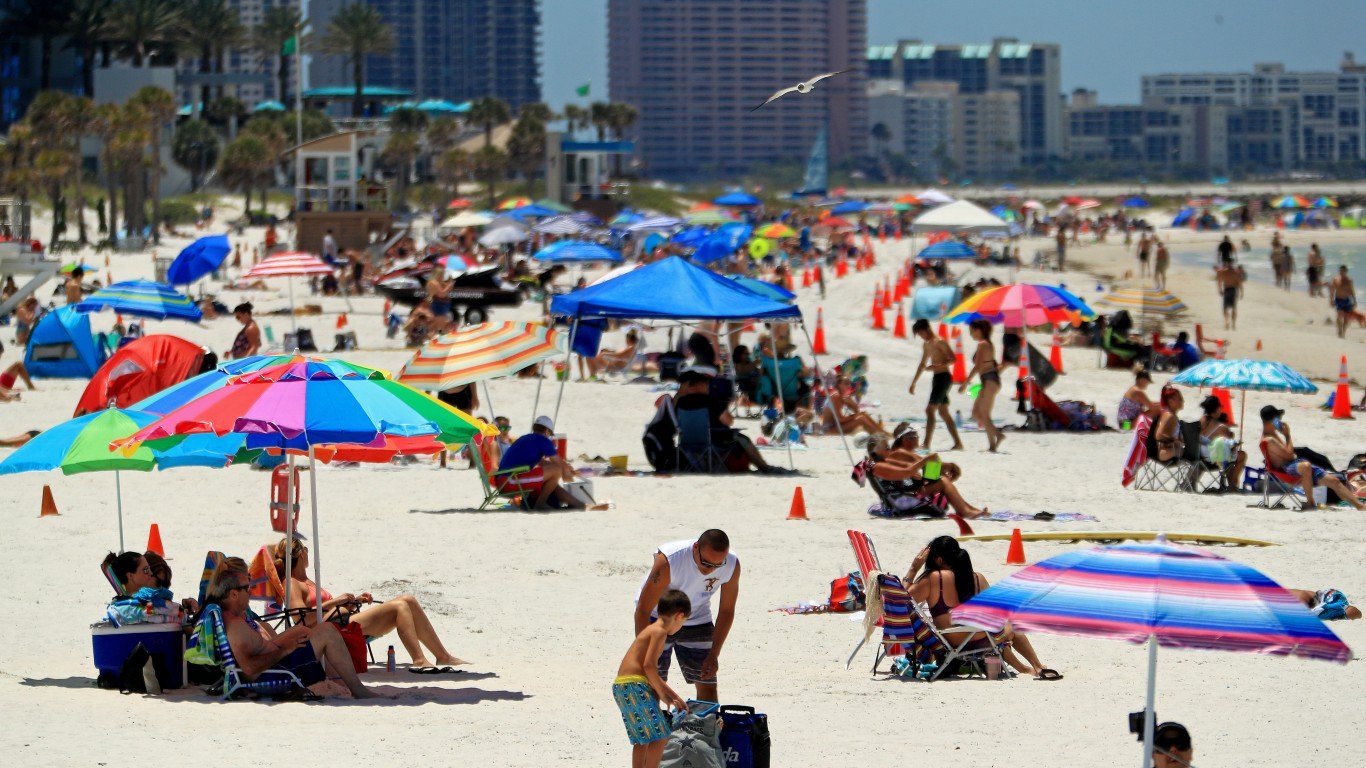
Florida: Bradford County
> Change in daily avg. new COVID-19 cases, week over week: +64 per 100,000 people
> Avg. new daily cases in Bradford County in 7 days ending Dec. 29: 173 per 100,000
> Avg. new daily cases in Bradford County in 7 days ending Dec. 22: 108 per 100,000
> Avg. new daily cases in Florida in 7 days ending Dec. 29: 50 per 100,000 (25th fewest)
> Cumulative confirmed COVID-19 cases in Bradford County as of Dec. 29: 7,921 per 100,000 people (total: 2,137)
> Population: 26,979
> Largest place in Bradford County: Starke
[in-text-ad-2]

Georgia: Montgomery County
> Change in daily avg. new COVID-19 cases, week over week: +48 per 100,000 people
> Avg. new daily cases in Montgomery County in 7 days ending Dec. 29: 87 per 100,000
> Avg. new daily cases in Montgomery County in 7 days ending Dec. 22: 39 per 100,000
> Avg. new daily cases in Georgia in 7 days ending Dec. 29: 48 per 100,000 (20th fewest)
> Cumulative confirmed COVID-19 cases in Montgomery County as of Dec. 29: 5,688 per 100,000 people (total: 514)
> Population: 9,036
> Largest place in Montgomery County: Mount Vernon

Hawaii: No large county with increase
> Avg. new daily cases in Hawaii in 7 days ending Dec. 29: 09 per 100,000 (the fewest)
[in-text-ad]
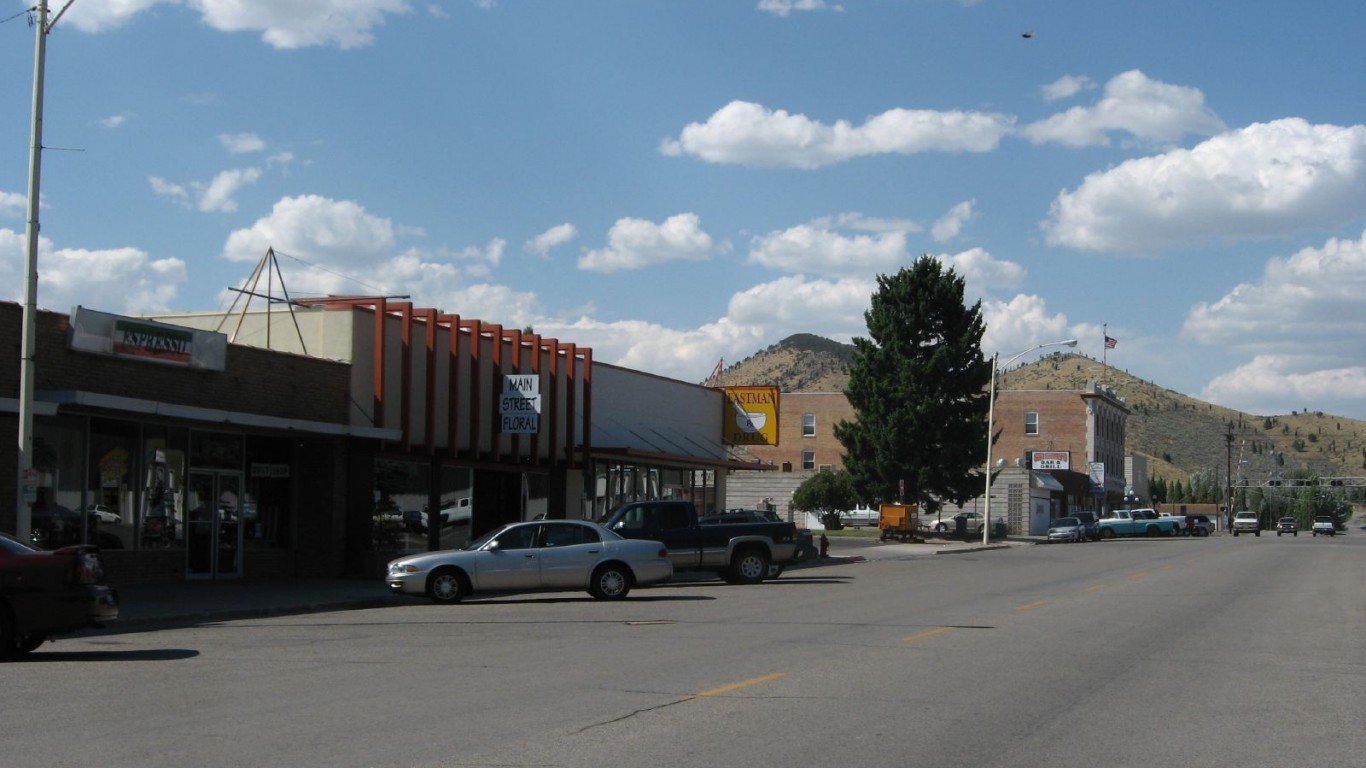
Idaho: Caribou County
> Change in daily avg. new COVID-19 cases, week over week: +27 per 100,000 people
> Avg. new daily cases in Caribou County in 7 days ending Dec. 29: 52 per 100,000
> Avg. new daily cases in Caribou County in 7 days ending Dec. 22: 25 per 100,000
> Avg. new daily cases in Idaho in 7 days ending Dec. 29: 63 per 100,000 (16th most)
> Cumulative confirmed COVID-19 cases in Caribou County as of Dec. 29: 7,632 per 100,000 people (total: 528)
> Population: 6,918
> Largest place in Caribou County: Soda Springs
[recirclink id=826277]

Illinois: Montgomery County
> Change in daily avg. new COVID-19 cases, week over week: +81 per 100,000 people
> Avg. new daily cases in Montgomery County in 7 days ending Dec. 29: 156 per 100,000
> Avg. new daily cases in Montgomery County in 7 days ending Dec. 22: 75 per 100,000
> Avg. new daily cases in Illinois in 7 days ending Dec. 29: 50 per 100,000 (24th fewest)
> Cumulative confirmed COVID-19 cases in Montgomery County as of Dec. 29: 7,132 per 100,000 people (total: 2,069)
> Population: 29,009
> Largest place in Montgomery County: Hillsboro

Indiana: Martin County
> Change in daily avg. new COVID-19 cases, week over week: +10 per 100,000 people
> Avg. new daily cases in Martin County in 7 days ending Dec. 29: 62 per 100,000
> Avg. new daily cases in Martin County in 7 days ending Dec. 22: 53 per 100,000
> Avg. new daily cases in Indiana in 7 days ending Dec. 29: 73 per 100,000 (6th most)
> Cumulative confirmed COVID-19 cases in Martin County as of Dec. 29: 5,514 per 100,000 people (total: 563)
> Population: 10,210
> Largest place in Martin County: Loogootee
[in-text-ad-2]
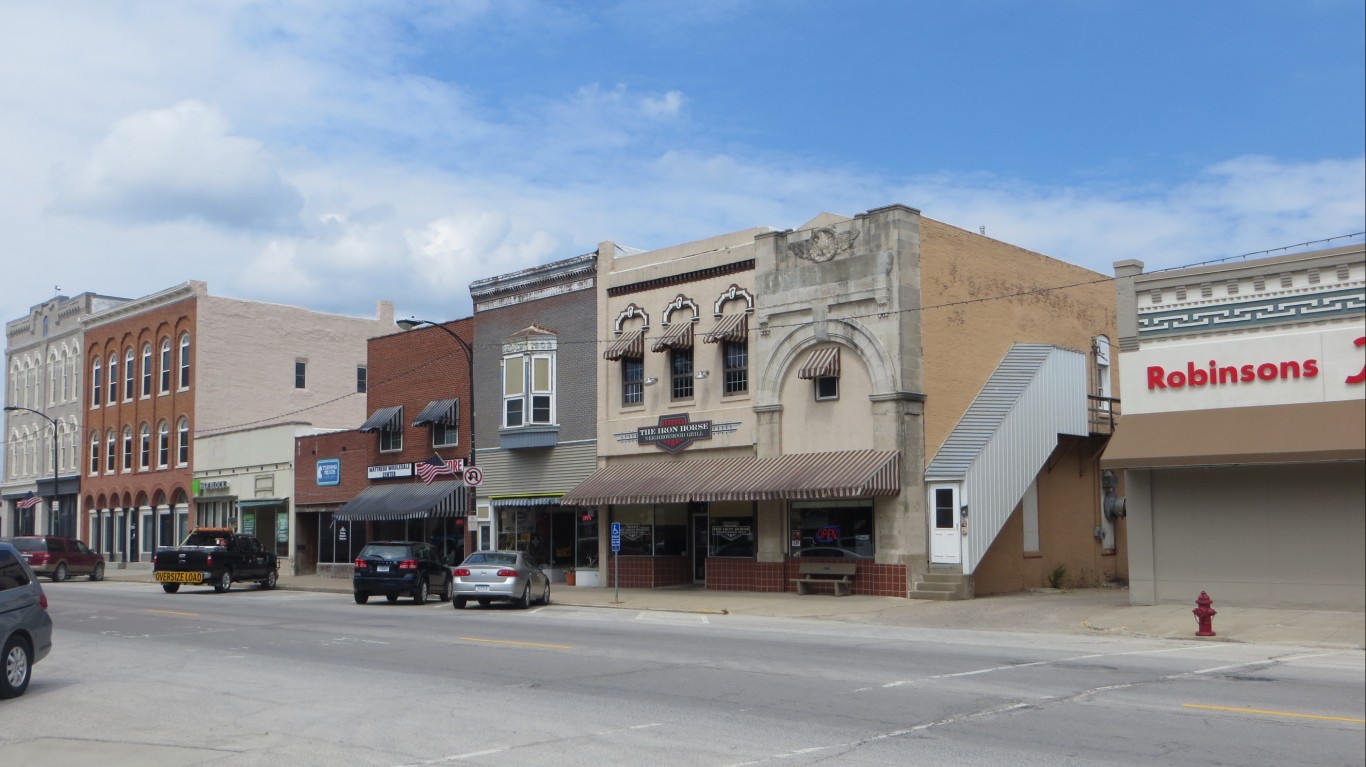
Iowa: Clarke County
> Change in daily avg. new COVID-19 cases, week over week: +40 per 100,000 people
> Avg. new daily cases in Clarke County in 7 days ending Dec. 29: 96 per 100,000
> Avg. new daily cases in Clarke County in 7 days ending Dec. 22: 56 per 100,000
> Avg. new daily cases in Iowa in 7 days ending Dec. 29: 45 per 100,000 (13th fewest)
> Cumulative confirmed COVID-19 cases in Clarke County as of Dec. 29: 7,207 per 100,000 people (total: 669)
> Population: 9,282
> Largest place in Clarke County: Osceola

Kansas: Wabaunsee County
> Change in daily avg. new COVID-19 cases, week over week: +18 per 100,000 people
> Avg. new daily cases in Wabaunsee County in 7 days ending Dec. 29: 54 per 100,000
> Avg. new daily cases in Wabaunsee County in 7 days ending Dec. 22: 36 per 100,000
> Avg. new daily cases in Kansas in 7 days ending Dec. 29: 61 per 100,000 (18th most)
> Cumulative confirmed COVID-19 cases in Wabaunsee County as of Dec. 29: 5,299 per 100,000 people (total: 365)
> Population: 6,888
> Largest place in Wabaunsee County: Alma
[in-text-ad]

Kentucky: Owen County
> Change in daily avg. new COVID-19 cases, week over week: +39 per 100,000 people
> Avg. new daily cases in Owen County in 7 days ending Dec. 29: 92 per 100,000
> Avg. new daily cases in Owen County in 7 days ending Dec. 22: 53 per 100,000
> Avg. new daily cases in Kentucky in 7 days ending Dec. 29: 54 per 100,000 (22nd most)
> Cumulative confirmed COVID-19 cases in Owen County as of Dec. 29: 3,947 per 100,000 people (total: 424)
> Population: 10,741
> Largest place in Owen County: Owenton
[recirclink id=826128]

Louisiana: Assumption Parish
> Change in daily avg. new COVID-19 cases, week over week: +15 per 100,000 people
> Avg. new daily cases in Assumption Parish in 7 days ending Dec. 29: 52 per 100,000
> Avg. new daily cases in Assumption Parish in 7 days ending Dec. 22: 37 per 100,000
> Avg. new daily cases in Louisiana in 7 days ending Dec. 29: 50 per 100,000 (23rd fewest)
> Cumulative confirmed COVID-19 cases in Assumption Parish as of Dec. 29: 5,789 per 100,000 people (total: 1,315)
> Population: 22,714
> Largest place in Assumption Parish: Pierre Part CDP

Maine: Androscoggin County
> Change in daily avg. new COVID-19 cases, week over week: +10 per 100,000 people
> Avg. new daily cases in Androscoggin County in 7 days ending Dec. 29: 39 per 100,000
> Avg. new daily cases in Androscoggin County in 7 days ending Dec. 22: 29 per 100,000
> Avg. new daily cases in Maine in 7 days ending Dec. 29: 26 per 100,000 (4th fewest)
> Cumulative confirmed COVID-19 cases in Androscoggin County as of Dec. 29: 2,358 per 100,000 people (total: 2,533)
> Population: 107,444
> Largest place in Androscoggin County: Lewiston
[in-text-ad-2]
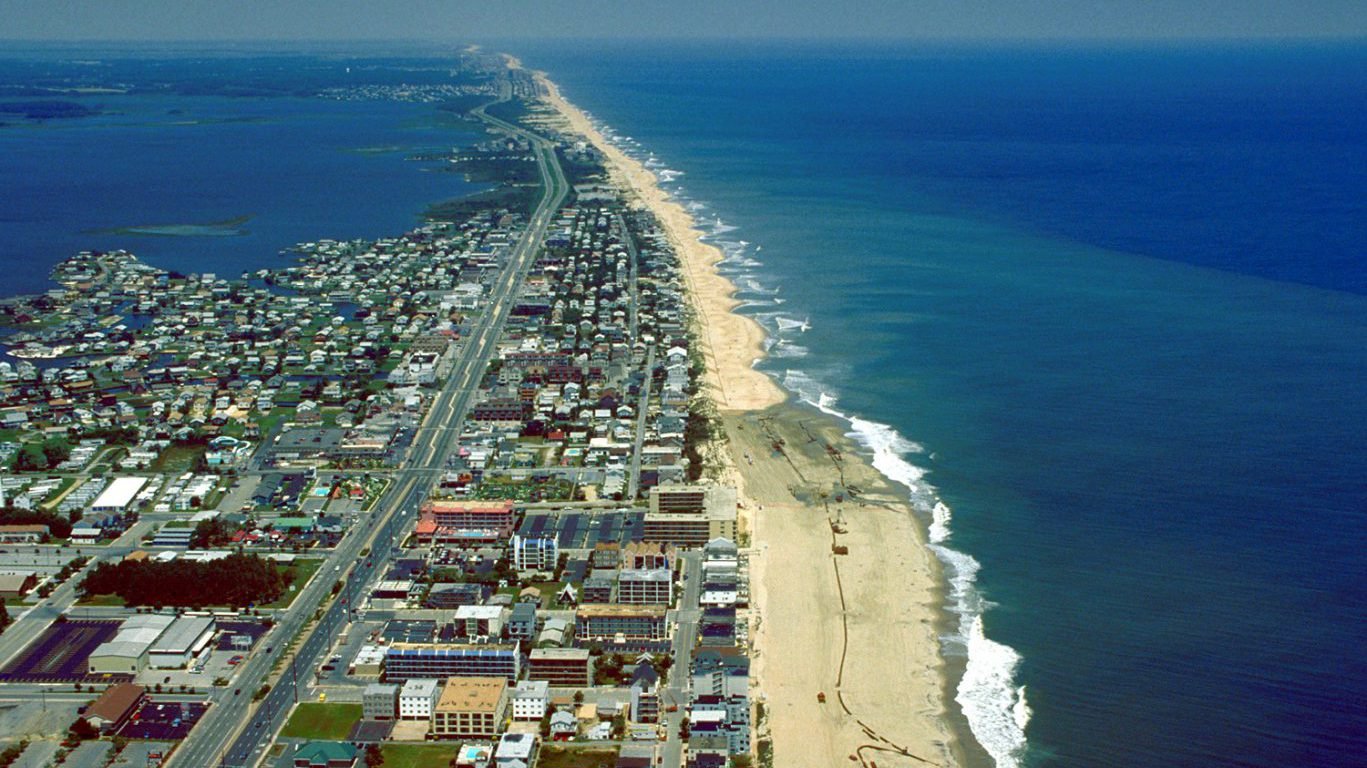
Maryland: Worcester County
> Change in daily avg. new COVID-19 cases, week over week: +10 per 100,000 people
> Avg. new daily cases in Worcester County in 7 days ending Dec. 29: 51 per 100,000
> Avg. new daily cases in Worcester County in 7 days ending Dec. 22: 42 per 100,000
> Avg. new daily cases in Maryland in 7 days ending Dec. 29: 39 per 100,000 (8th fewest)
> Cumulative confirmed COVID-19 cases in Worcester County as of Dec. 29: 4,047 per 100,000 people (total: 2,087)
> Population: 51,564
> Largest place in Worcester County: Ocean Pines CDP

Massachusetts: Berkshire County
> Change in daily avg. new COVID-19 cases, week over week: +4 per 100,000 people
> Avg. new daily cases in Berkshire County in 7 days ending Dec. 29: 27 per 100,000
> Avg. new daily cases in Berkshire County in 7 days ending Dec. 22: 23 per 100,000
> Avg. new daily cases in Massachusetts in 7 days ending Dec. 29: 64 per 100,000 (15th most)
> Cumulative confirmed COVID-19 cases in Berkshire County as of Dec. 29: 2,189 per 100,000 people (total: 2,787)
> Population: 127,328
> Largest place in Berkshire County: Pittsfield
[in-text-ad]
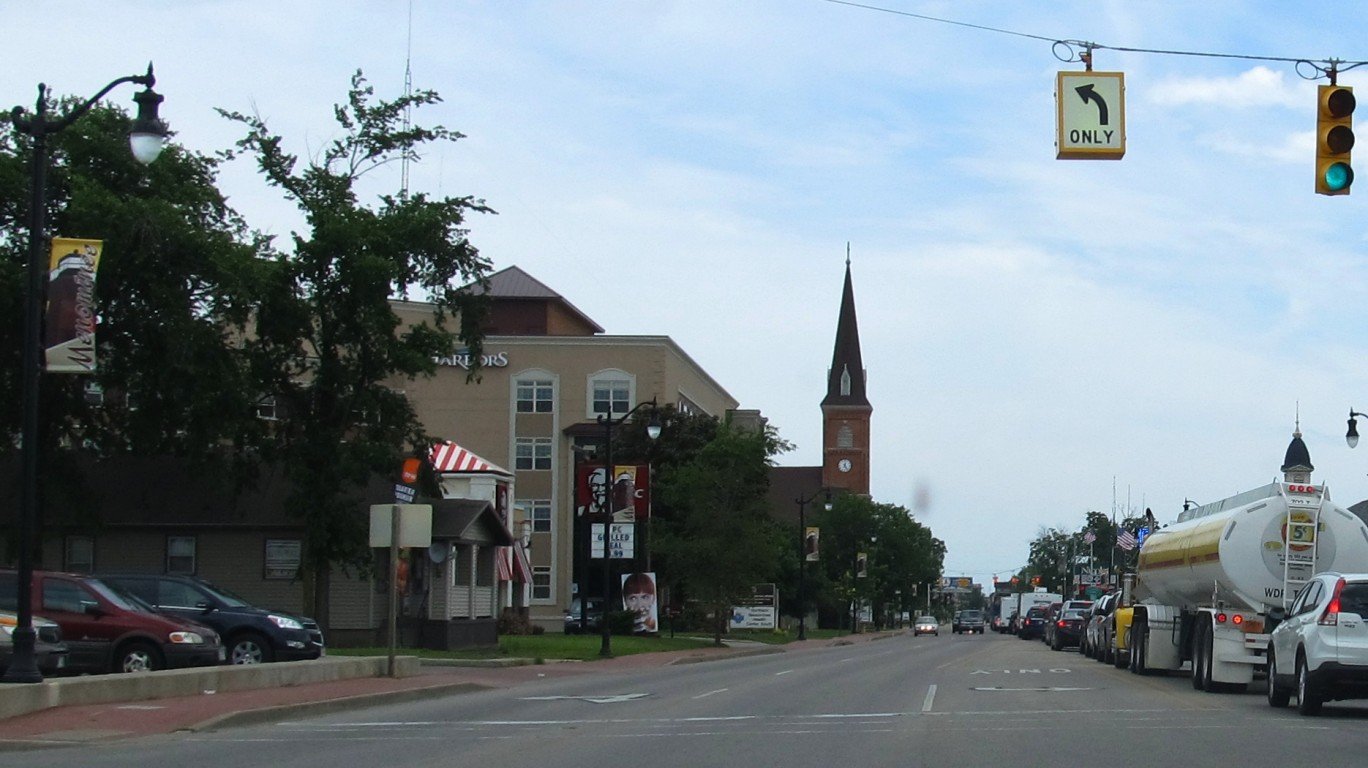
Michigan: Menominee County
> Change in daily avg. new COVID-19 cases, week over week: +9 per 100,000 people
> Avg. new daily cases in Menominee County in 7 days ending Dec. 29: 49 per 100,000
> Avg. new daily cases in Menominee County in 7 days ending Dec. 22: 41 per 100,000
> Avg. new daily cases in Michigan in 7 days ending Dec. 29: 33 per 100,000 (5th fewest)
> Cumulative confirmed COVID-19 cases in Menominee County as of Dec. 29: 7,192 per 100,000 people (total: 1,671)
> Population: 23,234
> Largest place in Menominee County: Menominee
[recirclink id=825898]
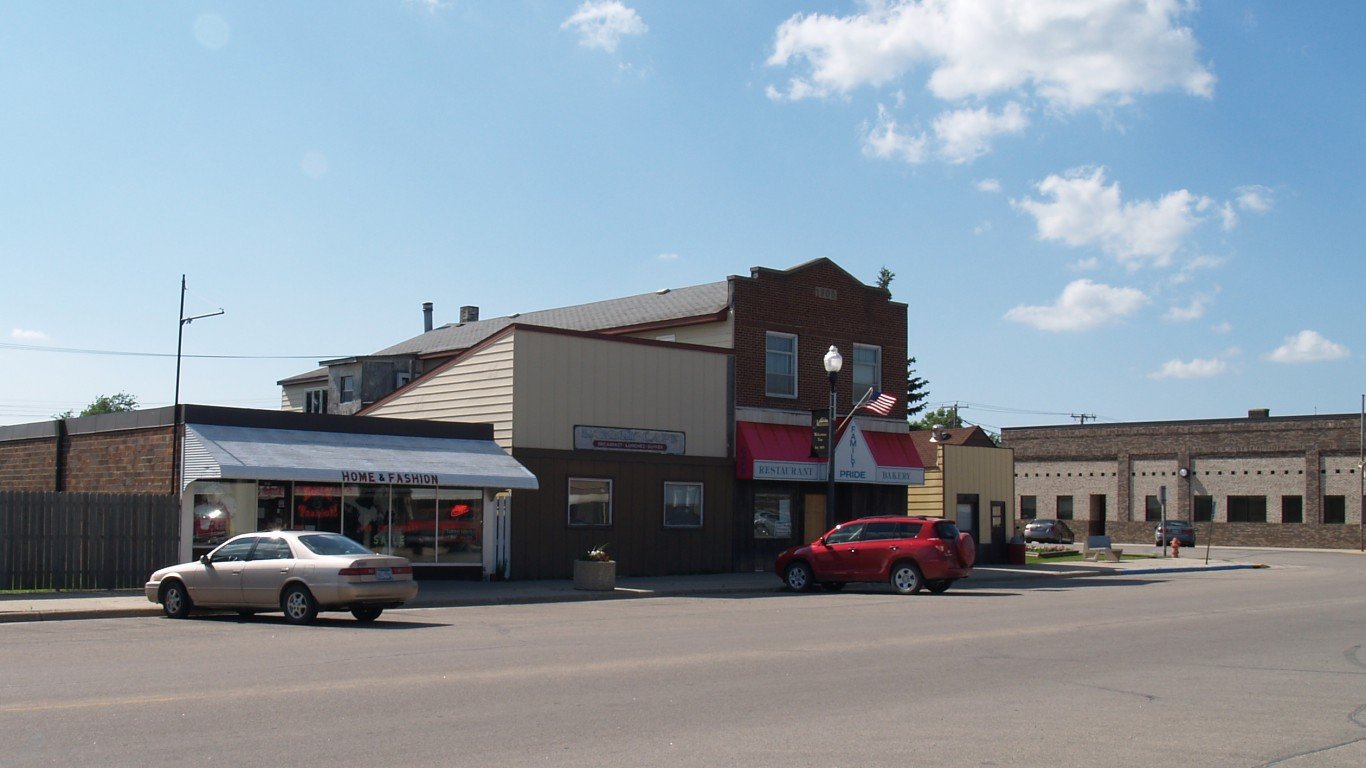
Minnesota: Mahnomen County
> Change in daily avg. new COVID-19 cases, week over week: +10 per 100,000 people
> Avg. new daily cases in Mahnomen County in 7 days ending Dec. 29: 46 per 100,000
> Avg. new daily cases in Mahnomen County in 7 days ending Dec. 22: 36 per 100,000
> Avg. new daily cases in Minnesota in 7 days ending Dec. 29: 37 per 100,000 (6th fewest)
> Cumulative confirmed COVID-19 cases in Mahnomen County as of Dec. 29: 7,083 per 100,000 people (total: 390)
> Population: 5,506
> Largest place in Mahnomen County: Mahnomen

Mississippi: Calhoun County
> Change in daily avg. new COVID-19 cases, week over week: +39 per 100,000 people
> Avg. new daily cases in Calhoun County in 7 days ending Dec. 29: 114 per 100,000
> Avg. new daily cases in Calhoun County in 7 days ending Dec. 22: 75 per 100,000
> Avg. new daily cases in Mississippi in 7 days ending Dec. 29: 66 per 100,000 (13th most)
> Cumulative confirmed COVID-19 cases in Calhoun County as of Dec. 29: 7,789 per 100,000 people (total: 1,135)
> Population: 14,571
> Largest place in Calhoun County: Calhoun City
[in-text-ad-2]

Missouri: St. Louis city
> Change in daily avg. new COVID-19 cases, week over week: +31 per 100,000 people
> Avg. new daily cases in St. Louis city in 7 days ending Dec. 29: 33 per 100,000
> Avg. new daily cases in St. Louis city in 7 days ending Dec. 22: 02 per 100,000
> Avg. new daily cases in Missouri in 7 days ending Dec. 29: 45 per 100,000 (12th fewest)
> Cumulative confirmed COVID-19 cases in St. Louis city as of Dec. 29: 5,020 per 100,000 people (total: 15,625)
> Population: 311,273
> Largest place in St. Louis city: St. Louis

Montana: Deer Lodge County
> Change in daily avg. new COVID-19 cases, week over week: +4 per 100,000 people
> Avg. new daily cases in Deer Lodge County in 7 days ending Dec. 29: 32 per 100,000
> Avg. new daily cases in Deer Lodge County in 7 days ending Dec. 22: 28 per 100,000
> Avg. new daily cases in Montana in 7 days ending Dec. 29: 45 per 100,000 (15th fewest)
> Cumulative confirmed COVID-19 cases in Deer Lodge County as of Dec. 29: 9,231 per 100,000 people (total: 840)
> Population: 9,100
> Largest place in Deer Lodge County: Anaconda-Deer Lodge County
[in-text-ad]

Nebraska: Richardson County
> Change in daily avg. new COVID-19 cases, week over week: +40 per 100,000 people
> Avg. new daily cases in Richardson County in 7 days ending Dec. 29: 64 per 100,000
> Avg. new daily cases in Richardson County in 7 days ending Dec. 22: 24 per 100,000
> Avg. new daily cases in Nebraska in 7 days ending Dec. 29: 52 per 100,000 (24th most)
> Cumulative confirmed COVID-19 cases in Richardson County as of Dec. 29: 6,181 per 100,000 people (total: 495)
> Population: 8,009
> Largest place in Richardson County: Falls City
[recirclink id=826484]
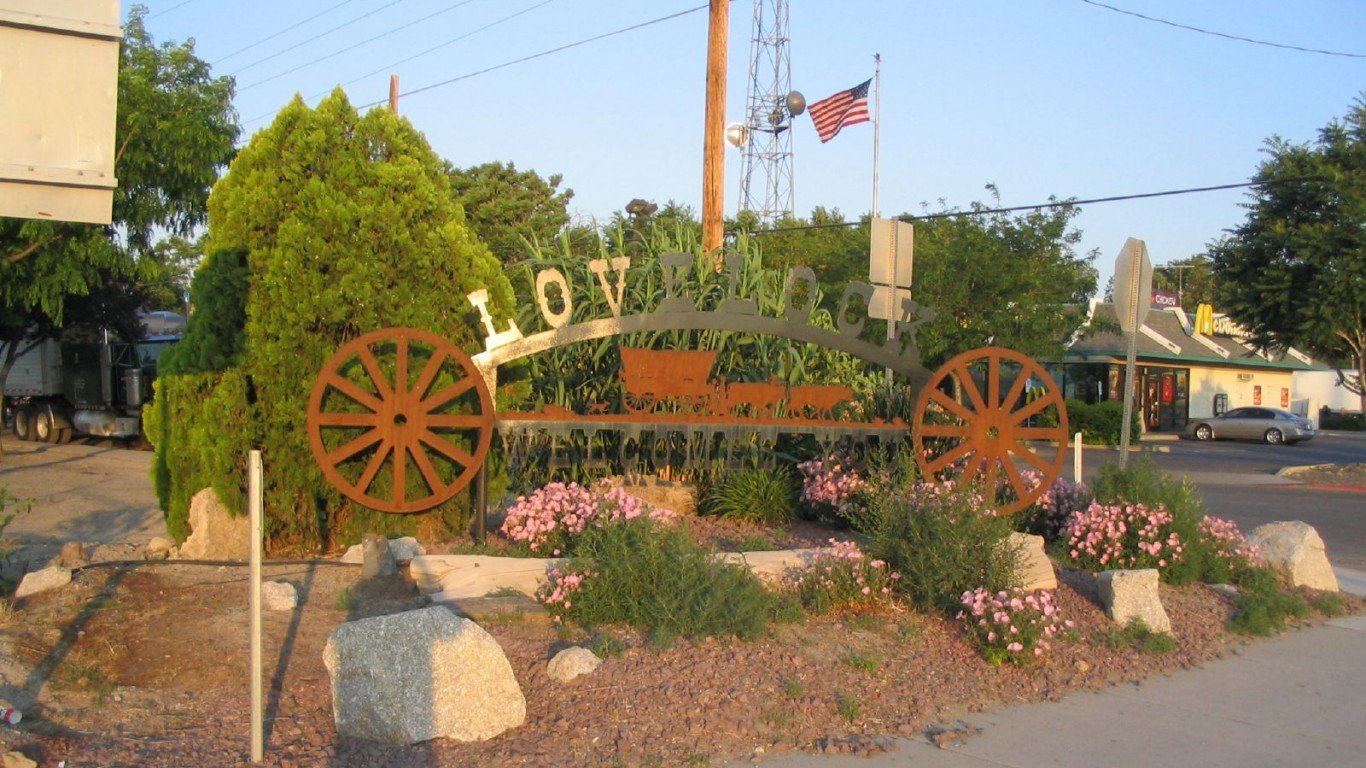
Nevada: Pershing County
> Change in daily avg. new COVID-19 cases, week over week: +100 per 100,000 people
> Avg. new daily cases in Pershing County in 7 days ending Dec. 29: 196 per 100,000
> Avg. new daily cases in Pershing County in 7 days ending Dec. 22: 97 per 100,000
> Avg. new daily cases in Nevada in 7 days ending Dec. 29: 71 per 100,000 (8th most)
> Cumulative confirmed COVID-19 cases in Pershing County as of Dec. 29: 12,494 per 100,000 people (total: 826)
> Population: 6,611
> Largest place in Pershing County: Lovelock

New Hampshire: Coos County
> Change in daily avg. new COVID-19 cases, week over week: +11 per 100,000 people
> Avg. new daily cases in Coos County in 7 days ending Dec. 29: 44 per 100,000
> Avg. new daily cases in Coos County in 7 days ending Dec. 22: 33 per 100,000
> Avg. new daily cases in New Hampshire in 7 days ending Dec. 29: 49 per 100,000 (21st fewest)
> Cumulative confirmed COVID-19 cases in Coos County as of Dec. 29: 1,973 per 100,000 people (total: 632)
> Population: 32,038
> Largest place in Coos County: Berlin
[in-text-ad-2]

New Jersey: Cape May County
> Change in daily avg. new COVID-19 cases, week over week: +42 per 100,000 people
> Avg. new daily cases in Cape May County in 7 days ending Dec. 29: 68 per 100,000
> Avg. new daily cases in Cape May County in 7 days ending Dec. 22: 26 per 100,000
> Avg. new daily cases in New Jersey in 7 days ending Dec. 29: 49 per 100,000 (22nd fewest)
> Cumulative confirmed COVID-19 cases in Cape May County as of Dec. 29: 4,673 per 100,000 people (total: 4,379)
> Population: 93,705
> Largest place in Cape May County: Ocean City

New Mexico: Cibola County
> Change in daily avg. new COVID-19 cases, week over week: +34 per 100,000 people
> Avg. new daily cases in Cibola County in 7 days ending Dec. 29: 94 per 100,000
> Avg. new daily cases in Cibola County in 7 days ending Dec. 22: 59 per 100,000
> Avg. new daily cases in New Mexico in 7 days ending Dec. 29: 61 per 100,000 (19th most)
> Cumulative confirmed COVID-19 cases in Cibola County as of Dec. 29: 8,218 per 100,000 people (total: 2,217)
> Population: 26,978
> Largest place in Cibola County: Grants
[in-text-ad]
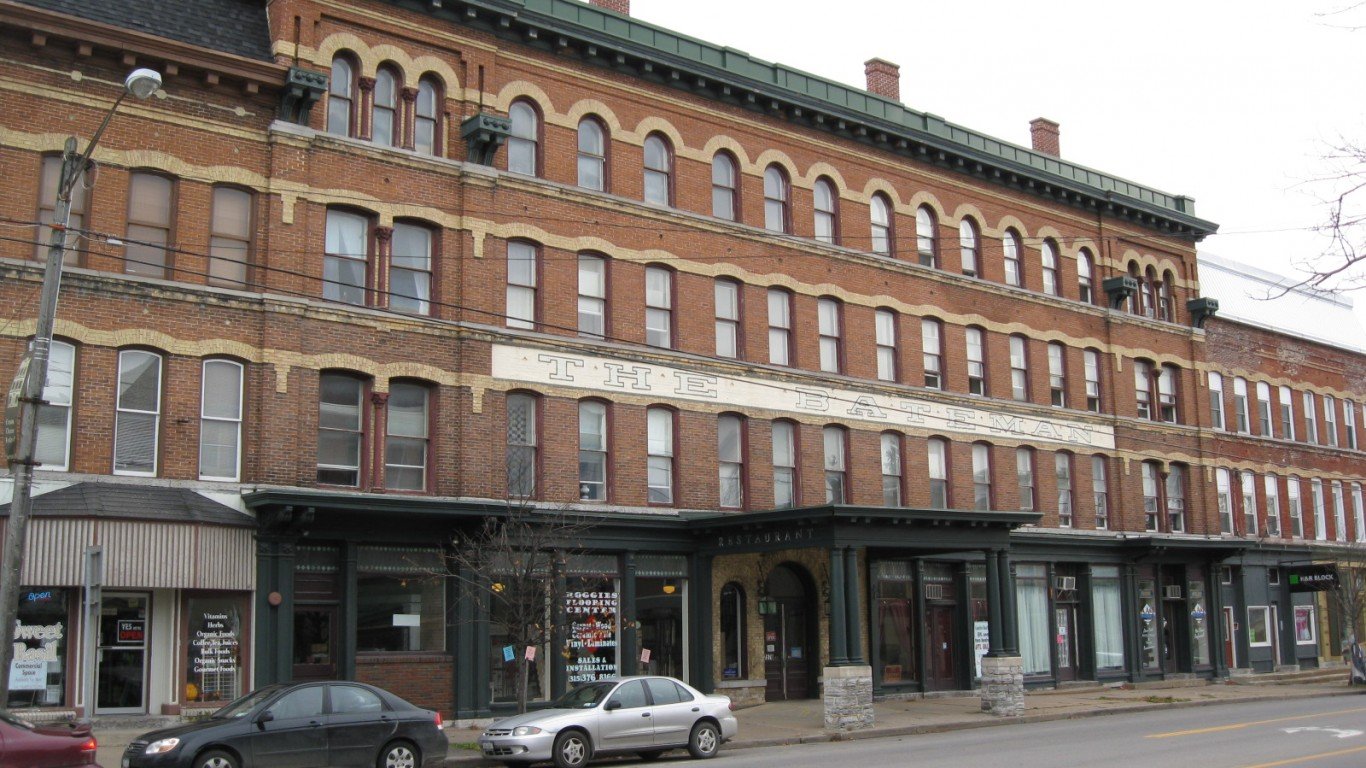
New York: Lewis County
> Change in daily avg. new COVID-19 cases, week over week: +29 per 100,000 people
> Avg. new daily cases in Lewis County in 7 days ending Dec. 29: 79 per 100,000
> Avg. new daily cases in Lewis County in 7 days ending Dec. 22: 50 per 100,000
> Avg. new daily cases in New York in 7 days ending Dec. 29: 54 per 100,000 (21st most)
> Cumulative confirmed COVID-19 cases in Lewis County as of Dec. 29: 3,148 per 100,000 people (total: 841)
> Population: 26,719
> Largest place in Lewis County: Lowville
[recirclink id=826475]
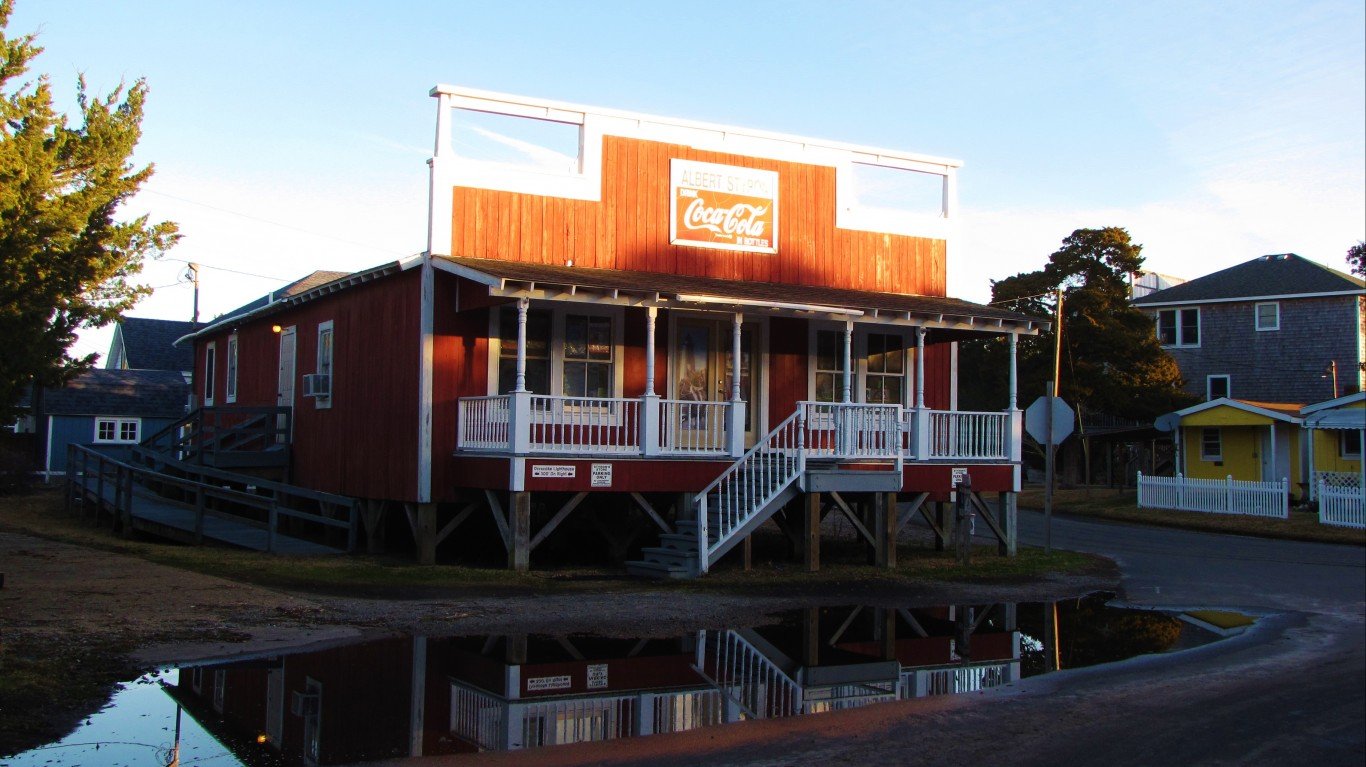
North Carolina: Hyde County
> Change in daily avg. new COVID-19 cases, week over week: +38 per 100,000 people
> Avg. new daily cases in Hyde County in 7 days ending Dec. 29: 121 per 100,000
> Avg. new daily cases in Hyde County in 7 days ending Dec. 22: 82 per 100,000
> Avg. new daily cases in North Carolina in 7 days ending Dec. 29: 53 per 100,000 (23rd most)
> Cumulative confirmed COVID-19 cases in Hyde County as of Dec. 29: 5,600 per 100,000 people (total: 302)
> Population: 5,393
> Largest place in Hyde County: Ocracoke CDP

North Dakota: No large county with increase
> Avg. new daily cases in North Dakota in 7 days ending Dec. 29: 48 per 100,000 (18th fewest)
[in-text-ad-2]

Ohio: Pickaway County
> Change in daily avg. new COVID-19 cases, week over week: +12 per 100,000 people
> Avg. new daily cases in Pickaway County in 7 days ending Dec. 29: 113 per 100,000
> Avg. new daily cases in Pickaway County in 7 days ending Dec. 22: 102 per 100,000
> Avg. new daily cases in Ohio in 7 days ending Dec. 29: 66 per 100,000 (12th most)
> Cumulative confirmed COVID-19 cases in Pickaway County as of Dec. 29: 10,477 per 100,000 people (total: 6,016)
> Population: 57,420
> Largest place in Pickaway County: Circleville

Oklahoma: Woods County
> Change in daily avg. new COVID-19 cases, week over week: +77 per 100,000 people
> Avg. new daily cases in Woods County in 7 days ending Dec. 29: 194 per 100,000
> Avg. new daily cases in Woods County in 7 days ending Dec. 22: 117 per 100,000
> Avg. new daily cases in Oklahoma in 7 days ending Dec. 29: 74 per 100,000 (5th most)
> Cumulative confirmed COVID-19 cases in Woods County as of Dec. 29: 10,332 per 100,000 people (total: 943)
> Population: 9,127
> Largest place in Woods County: Alva
[in-text-ad]

Oregon: Jefferson County
> Change in daily avg. new COVID-19 cases, week over week: +19 per 100,000 people
> Avg. new daily cases in Jefferson County in 7 days ending Dec. 29: 84 per 100,000
> Avg. new daily cases in Jefferson County in 7 days ending Dec. 22: 64 per 100,000
> Avg. new daily cases in Oregon in 7 days ending Dec. 29: 18 per 100,000 (3rd fewest)
> Cumulative confirmed COVID-19 cases in Jefferson County as of Dec. 29: 5,967 per 100,000 people (total: 1,381)
> Population: 23,143
> Largest place in Jefferson County: Madras
[recirclink id=826277]

Pennsylvania: Forest County
> Change in daily avg. new COVID-19 cases, week over week: +37 per 100,000 people
> Avg. new daily cases in Forest County in 7 days ending Dec. 29: 129 per 100,000
> Avg. new daily cases in Forest County in 7 days ending Dec. 22: 92 per 100,000
> Avg. new daily cases in Pennsylvania in 7 days ending Dec. 29: 67 per 100,000 (11th most)
> Cumulative confirmed COVID-19 cases in Forest County as of Dec. 29: 4,013 per 100,000 people (total: 295)
> Population: 7,351
> Largest place in Forest County: Tionesta

Rhode Island: Bristol County
> Change in daily avg. new COVID-19 cases, week over week: +5 per 100,000 people
> Avg. new daily cases in Bristol County in 7 days ending Dec. 29: 73 per 100,000
> Avg. new daily cases in Bristol County in 7 days ending Dec. 22: 68 per 100,000
> Avg. new daily cases in Rhode Island in 7 days ending Dec. 29: 69 per 100,000 (10th most)
> Cumulative confirmed COVID-19 cases in Bristol County as of Dec. 29: 4,223 per 100,000 people (total: 2,065)
> Population: 48,900
> Largest place in Bristol County: Bristol CDP
[in-text-ad-2]

South Carolina: Clarendon County
> Change in daily avg. new COVID-19 cases, week over week: +18 per 100,000 people
> Avg. new daily cases in Clarendon County in 7 days ending Dec. 29: 57 per 100,000
> Avg. new daily cases in Clarendon County in 7 days ending Dec. 22: 39 per 100,000
> Avg. new daily cases in South Carolina in 7 days ending Dec. 29: 58 per 100,000 (20th most)
> Cumulative confirmed COVID-19 cases in Clarendon County as of Dec. 29: 5,286 per 100,000 people (total: 1,798)
> Population: 34,017
> Largest place in Clarendon County: Manning

South Dakota: Bon Homme County
> Change in daily avg. new COVID-19 cases, week over week: +19 per 100,000 people
> Avg. new daily cases in Bon Homme County in 7 days ending Dec. 29: 56 per 100,000
> Avg. new daily cases in Bon Homme County in 7 days ending Dec. 22: 36 per 100,000
> Avg. new daily cases in South Dakota in 7 days ending Dec. 29: 42 per 100,000 (11th fewest)
> Cumulative confirmed COVID-19 cases in Bon Homme County as of Dec. 29: 21,122 per 100,000 people (total: 1,472)
> Population: 6,969
> Largest place in Bon Homme County: Tyndall
[in-text-ad]

Tennessee: No large county with increase
> Avg. new daily cases in Tennessee in 7 days ending Dec. 29: 111 per 100,000 (the most)
[recirclink id=826128]
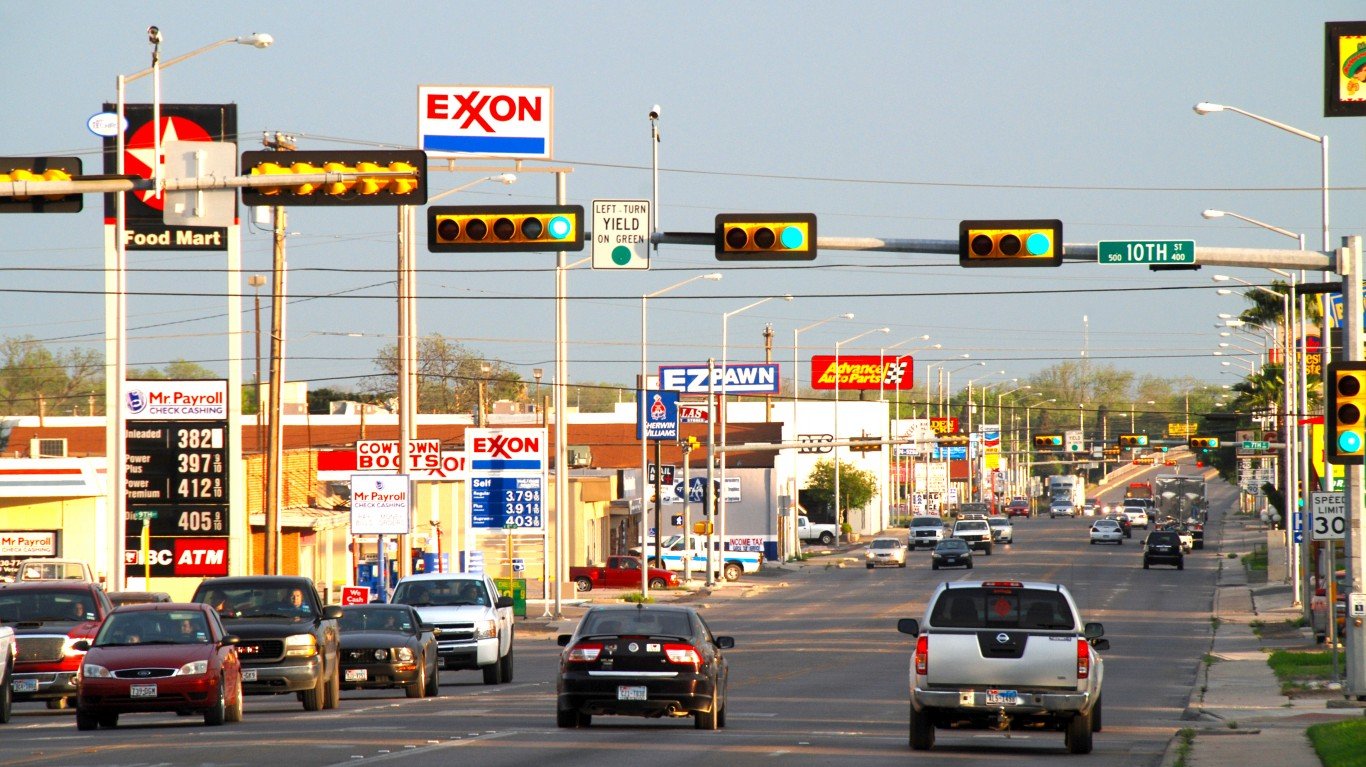
Texas: Val Verde County
> Change in daily avg. new COVID-19 cases, week over week: +44 per 100,000 people
> Avg. new daily cases in Val Verde County in 7 days ending Dec. 29: 107 per 100,000
> Avg. new daily cases in Val Verde County in 7 days ending Dec. 22: 64 per 100,000
> Avg. new daily cases in Texas in 7 days ending Dec. 29: 51 per 100,000 (25th most)
> Cumulative confirmed COVID-19 cases in Val Verde County as of Dec. 29: 9,087 per 100,000 people (total: 4,455)
> Population: 49,027
> Largest place in Val Verde County: Del Rio

Utah: Summit County
> Change in daily avg. new COVID-19 cases, week over week: +5 per 100,000 people
> Avg. new daily cases in Summit County in 7 days ending Dec. 29: 78 per 100,000
> Avg. new daily cases in Summit County in 7 days ending Dec. 22: 74 per 100,000
> Avg. new daily cases in Utah in 7 days ending Dec. 29: 61 per 100,000 (17th most)
> Cumulative confirmed COVID-19 cases in Summit County as of Dec. 29: 7,665 per 100,000 people (total: 3,105)
> Population: 40,511
> Largest place in Summit County: Park City
[in-text-ad-2]

Vermont: Windham County
> Change in daily avg. new COVID-19 cases, week over week: +5 per 100,000 people
> Avg. new daily cases in Windham County in 7 days ending Dec. 29: 17 per 100,000
> Avg. new daily cases in Windham County in 7 days ending Dec. 22: 13 per 100,000
> Avg. new daily cases in Vermont in 7 days ending Dec. 29: 14 per 100,000 (2nd fewest)
> Cumulative confirmed COVID-19 cases in Windham County as of Dec. 29: 1,043 per 100,000 people (total: 450)
> Population: 43,150
> Largest place in Windham County: Brattleboro CDP

Virginia: Richmond County
> Change in daily avg. new COVID-19 cases, week over week: +113 per 100,000 people
> Avg. new daily cases in Richmond County in 7 days ending Dec. 29: 236 per 100,000
> Avg. new daily cases in Richmond County in 7 days ending Dec. 22: 123 per 100,000
> Avg. new daily cases in Virginia in 7 days ending Dec. 29: 45 per 100,000 (14th fewest)
> Cumulative confirmed COVID-19 cases in Richmond County as of Dec. 29: 8,741 per 100,000 people (total: 776)
> Population: 8,878
> Largest place in Richmond County: Warsaw
[in-text-ad]

Washington: Chelan County
> Change in daily avg. new COVID-19 cases, week over week: +60 per 100,000 people
> Avg. new daily cases in Chelan County in 7 days ending Dec. 29: 130 per 100,000
> Avg. new daily cases in Chelan County in 7 days ending Dec. 22: 70 per 100,000
> Avg. new daily cases in Washington in 7 days ending Dec. 29: 37 per 100,000 (7th fewest)
> Cumulative confirmed COVID-19 cases in Chelan County as of Dec. 29: 6,238 per 100,000 people (total: 4,726)
> Population: 75,757
> Largest place in Chelan County: Wenatchee
[recirclink id=825898]

West Virginia: Pleasants County
> Change in daily avg. new COVID-19 cases, week over week: +222 per 100,000 people
> Avg. new daily cases in Pleasants County in 7 days ending Dec. 29: 396 per 100,000
> Avg. new daily cases in Pleasants County in 7 days ending Dec. 22: 174 per 100,000
> Avg. new daily cases in West Virginia in 7 days ending Dec. 29: 70 per 100,000 (9th most)
> Cumulative confirmed COVID-19 cases in Pleasants County as of Dec. 29: 7,406 per 100,000 people (total: 556)
> Population: 7,507
> Largest place in Pleasants County: St. Marys

Wisconsin: Forest County
> Change in daily avg. new COVID-19 cases, week over week: +6 per 100,000 people
> Avg. new daily cases in Forest County in 7 days ending Dec. 29: 41 per 100,000
> Avg. new daily cases in Forest County in 7 days ending Dec. 22: 34 per 100,000
> Avg. new daily cases in Wisconsin in 7 days ending Dec. 29: 41 per 100,000 (9th fewest)
> Cumulative confirmed COVID-19 cases in Forest County as of Dec. 29: 9,226 per 100,000 people (total: 832)
> Population: 9,018
> Largest place in Forest County: Crandon
[in-text-ad-2]

Wyoming: Weston County
> Change in daily avg. new COVID-19 cases, week over week: +9 per 100,000 people
> Avg. new daily cases in Weston County in 7 days ending Dec. 29: 39 per 100,000
> Avg. new daily cases in Weston County in 7 days ending Dec. 22: 30 per 100,000
> Avg. new daily cases in Wyoming in 7 days ending Dec. 29: 48 per 100,000 (19th fewest)
> Cumulative confirmed COVID-19 cases in Weston County as of Dec. 29: 6,634 per 100,000 people (total: 471)
> Population: 7,100
> Largest place in Weston County: Newcastle
Contact [email protected] for any questions or corrections.