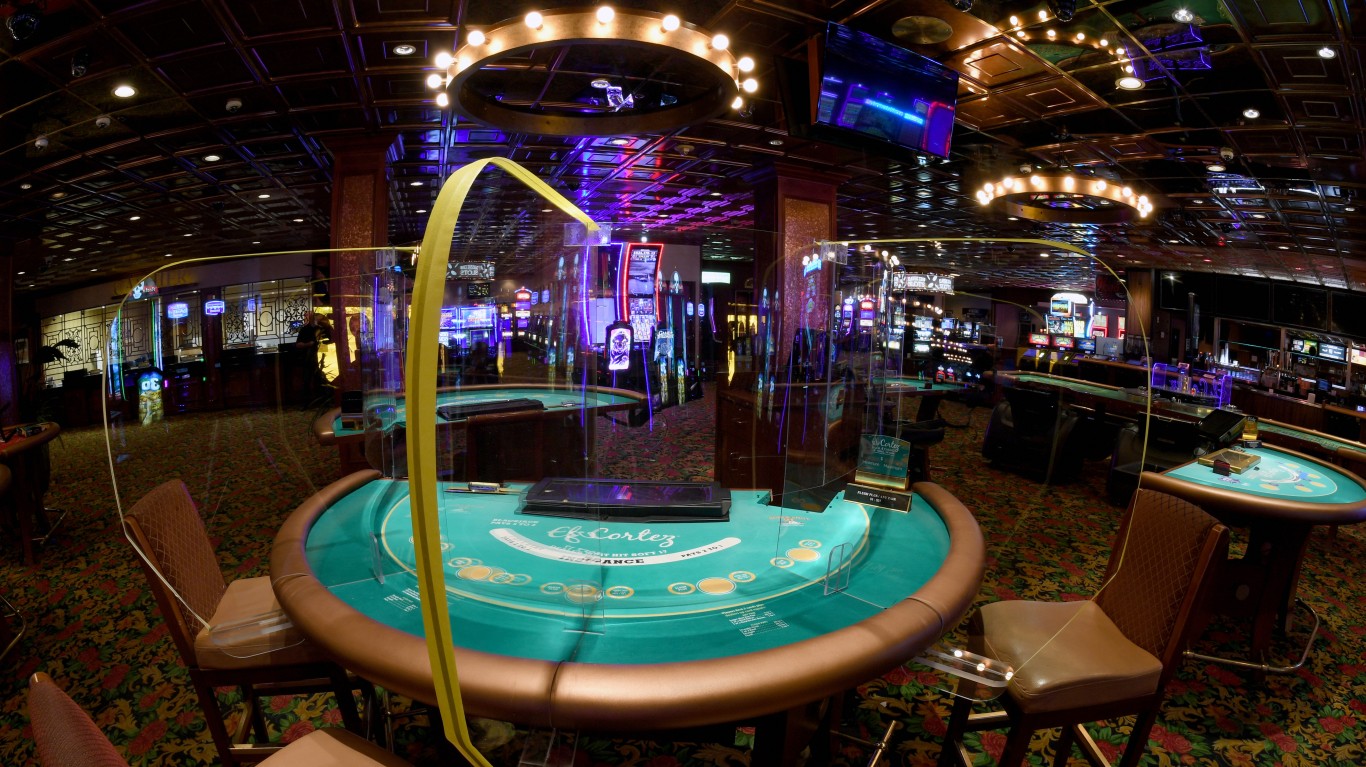

The 465 commercial casinos operating in the United States at the end of 2019 reported a combined revenue of $43.6 billion — an all-time high. Gambling in the United States is by no means limited to casinos, either. All but six states had lottery games in 2019, and lottery ticket sales totaled $81.6 billion that year.
Between both lotteries and commercial casinos, Americans and tourists spent $125.2 billion on gambling in 2019 — or about $491 for every adult in the country. Of course, gambling laws, which can restrict gambling opportunities, vary by state, as does interest in gambling. And residents of some states spend far more on lottery tickets and at casinos than others.
Using data from the U.S. Census Bureau and the American Gaming Association, 24/7 Wall St. identified the states spending the most and least on gambling. States were ranked based on total spending on lottery tickets and in commercial casino gaming per adult 18 years and over in 2019.
It is important to note that while there were 524 tribal casinos in the United States in 2019, these institutions are subject to different regulations than commercial casinos, and revenue from these establishments were not included in this story.
Legal and regulated gambling can be a significant source of revenue for state and local governments across the country. Tax revenue from commercial casinos topped $10 billion in 2019. In Nevada, taxes on casinos account for nearly one in every 10 dollars the state collects in tax revenue. Here is a look at the states where Americans are paying the most in taxes.
While 2019 was a historic year for gambling expenditures in the United States, the same will not likely be said for 2020. COVID-19 shut down businesses like casinos all over the country, and moratoriums on nonessential travel and businesses had devastating economic consequences to gambling destinations like Atlantic City and Las Vegas. Here is a look at 17 non-obvious ways life has changed during the COVID-19 pandemic.
Click here to see the states spending the most and least on gambling.
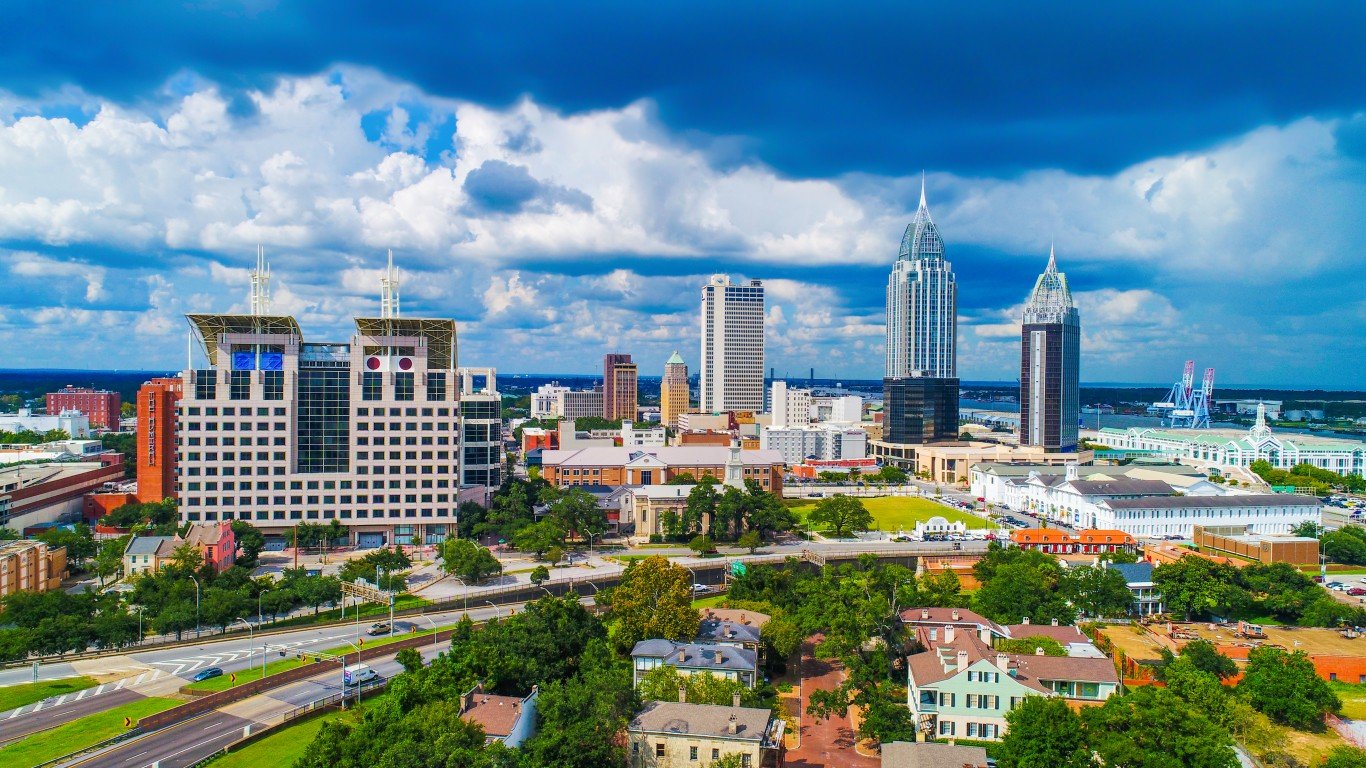
50. Alabama
> Annual lottery and casino spending: $0
> Annual casino spending:$0
> Annual lottery spending: $0
> State tax revenue from casinos: $0
Alabama had no commercial casinos or state lotteries as of 2019. It does, however, have three tribal casinos. Each of the three casinos — Wind Creek Casino in Atmore, Wind Creek Casino in Montgomery, and Wind Creek Casino in Wetumpka — is owned by the Poarch Band of Creek Indians, the only federally-recognized tribe in Alabama. These casinos do not pay a state tax. Recently, however, the state opened the Center Stage Bingo casino, a commercial facility in Cottonwood.
Earlier this year, a bill proposed in the state legislature called for the authorization of a state lottery, in addition to five new casinos and sports betting. A report commissioned by Gov. Kay Ivey estimated that such a move would create 19,000 jobs and raise up to $700 million in tax revenue that would be used for education and broadband expansion. The bill, however, fell two votes short of the threshold necessary to pass in March.
[in-text-ad]

49. Alaska
> Annual lottery and casino spending: $0
> Annual casino spending: $0
> Annual lottery spending: $0
> State tax revenue from casinos: $0
Alaska has some of the strictest gambling laws in the country. Currently, only bingo, pull tabs, and charitable raffles are the only forms of gambling that are legal in the state — and more traditional casinos and lotteries are not. Online gambling is not expressly prohibited in state law either, and many Alaskans bet on sports, poker, and traditional casino games over the internet.
Unlike some other states without commercial casinos or lotteries, Alaska also has no casinos on Indian reservations, as no land in the state meets the legal definition of Indian lands, which are taxed differently than other areas. Low-stakes bingo halls are permitted in some parts of the state.

48. Hawaii
> Annual lottery and casino spending: $0
> Annual casino spending: $0
> Annual lottery spending: $0
> State tax revenue from casinos: $0
State law in Hawaii prohibits casino style gambling, lotteries, and gambling on horse or dog races. It is not illegal for state residents to gamble socially in private residences, however.
Following reports of severe housing shortages for a program to return Native Hawaiins to their lands stemming from underfunding from the Department of Hawaiian Home Lands, a state commission proposed a casino on native Hawaiian land to raise funds. However, in February 2021 the bill failed to move out of committee in the state legislature.

47. Utah
> Annual lottery and casino spending: $0
> Annual casino spending: $0
> Annual lottery spending: $0
> State tax revenue from casinos: $0
All forms of casino gambling — including online — are legal in Utah. Additionally, even though there are many Native American tribes in the state, Utah has no Indian casinos either. Unlike other states with similarly strict gambling restrictions, social gambling in private residences is prohibited and there have been no serious attempts to legalize gambling in the state.
However, fantasy sports platforms such as FanDuel or DraftKings are considered skill games, and are not expressly prohibited in Utah.
[in-text-ad-2]

46. North Dakota
> Annual lottery and casino spending: $58 per adult ($33.8 million total)
> Annual casino spending: $0
> Annual lottery spending: $58 per adult ($33.8 million total)
> State tax revenue from casinos: $0
North Dakota only allows casinos on Native American lands. While there are multiple tribal casinos in the state that offer slot machines and table games, these venues are exempt from taxes and do not generate revenue for the state.
Lottery ticket sales, excluding scratch-offs, are permitted in North Dakota. The state sold a total of $33.8 million worth of lottery tickets in 2019, equal to about $58 for every adult in the state.

45. Wyoming
> Annual lottery and casino spending: $68 per adult ($30.2 million total)
> Annual casino spending: $0
> Annual lottery spending: $68 per adult ($30.2 million total)
> State tax revenue from casinos: $0
Like many other states, Wyoming generates no revenue from casino gambling. Though there are several Indian casinos operating in the state, these venues are exempt from state taxes.
State revenue from gambling comes primarily from the state lottery. Voters in Wyoming approved a state lottery in 2013, and though video lotteries and instant games like scratch offs remain prohibited, the state reported $30.2 million in revenue from lottery ticket sales in 2019, or $68 for every adult state resident.
[in-text-ad]

44. Montana
> Annual lottery and casino spending: $76 per adult ($63.9 million total)
> Annual casino spending: $0
> Annual lottery spending: $76 per adult ($63.9 million total)
> State tax revenue from casinos: $0
Montana is home to over a dozen Indian casinos as well as poker tables and video gambling machines in hundreds of bar rooms and taverns across the state. However, these establishments are not classified as commercial casinos, and while the state does collect taxes and fees on winnings and licensing, such revenue is not considered revenue from commercial casinos. As is the case in other states, tribal casinos are not subject to state tax in Montana.
The state also has a lottery that generated nearly $64 million in sales in 2019 — or $76 for every adult living in the state. With the exception of offtrack betting, online gambling — including fantasy sports — is prohibited in Montana.

43. Nebraska
> Annual lottery and casino spending: $123 per adult ($179.8 million total)
> Annual casino spending: $0
> Annual lottery spending: $123 per adult ($179.8 million total)
> State tax revenue from casinos: $0
In addition to four horse racing tracks, charity bingo, and online fantasy sports betting, lottery is the other legal form of gambling in Nebraska. Businesses that sell liquor are also permitted to offer keno drawings, a popular game of chance in many commercial casinos in other parts of the country.
The state lottery, which was approved by voters in 1992, includes scratch off ticket sales as well as Powerball and Mega Millions. The lottery generated nearly $180 million in sales in 2019, or $123 for every adult.

42. Oklahoma
> Annual lottery and casino spending: $127 per adult ($382.8 million total)
> Annual casino spending: $47 per adult ($140.9 million total)
> Annual lottery spending: $81 per adult ($242.0 million total)
> State tax revenue from casinos: $63.8 0 (0.6% of all tax revenue)
Oklahoma is one of many states in which both lotteries and commercial casinos are legal. Many casinos in the state benefit from being located near the Texas border, as the Lone Star State does not allow casinos. Oklahoma boasts the third most electronic gaming devices of any state, trailing only Nevada and California. Casino spending in the state totalled $140.9 million in 2019.
The first state lottery ticket was sold in Oklahoma in 2005, and in 2019, the state lottery reported $242.0 million in ticket sales. Spending on lotteries and at casinos in the state, however, totals $127 a year per adult, the lowest such per capita spending rate of any state — excluding those without commercial casinos.
[in-text-ad-2]

41. Washington
> Annual lottery and casino spending: $135 per adult ($803.3 million total)
> Annual casino spending: $0
> Annual lottery spending: $135 per adult ($803.3 million total)
> State tax revenue from casinos: $0
While there are many Native American casinos on tribal land in Washington, commercial casinos are not permitted in the state. Tribal casinos were legalized in the state in 1992, and card clubs that offer live poker tables and other card games have been regulated in the state since 1997. These casinos are exempt from taxes that commercial casinos in other parts of the country are subject to.
Washington’s state lottery was approved by the legislature in 1982, and today, adults in the state can play scratch offs, Powerball, and Mega Millions. Lottery ticket sales totalled $803.3 million in 2019, or an average of $135 for every adult in the state.

40. Minnesota
> Annual lottery and casino spending: $147 per adult ($636.8 million total)
> Annual casino spending: $0
> Annual lottery spending: $147 per adult ($636.8 million total)
> State tax revenue from casinos: $0
There were a total of 40 Indian casinos — operated by seven different tribes — in Minnesota in 2019. These establishments are permitted to offer slot machines, video poker, and blackjack, but such casinos are exempt from state taxes. Commercial casinos are not legal in the state. The state’s revenue from gambling comes from the state lottery, which sold nearly $637 million in lottery tickets in 2019.
In the last decade, the Minnesota Vikings NFL team received approval for a new stadium. To help fund the construction, the state was baking on revenue from electronic pull-tabs, which are similar to casino slot machines, in bars around the state. However, the games were not popular and revenue from this form of gambling fell well short of the $35 million that was anticipated.
[in-text-ad]
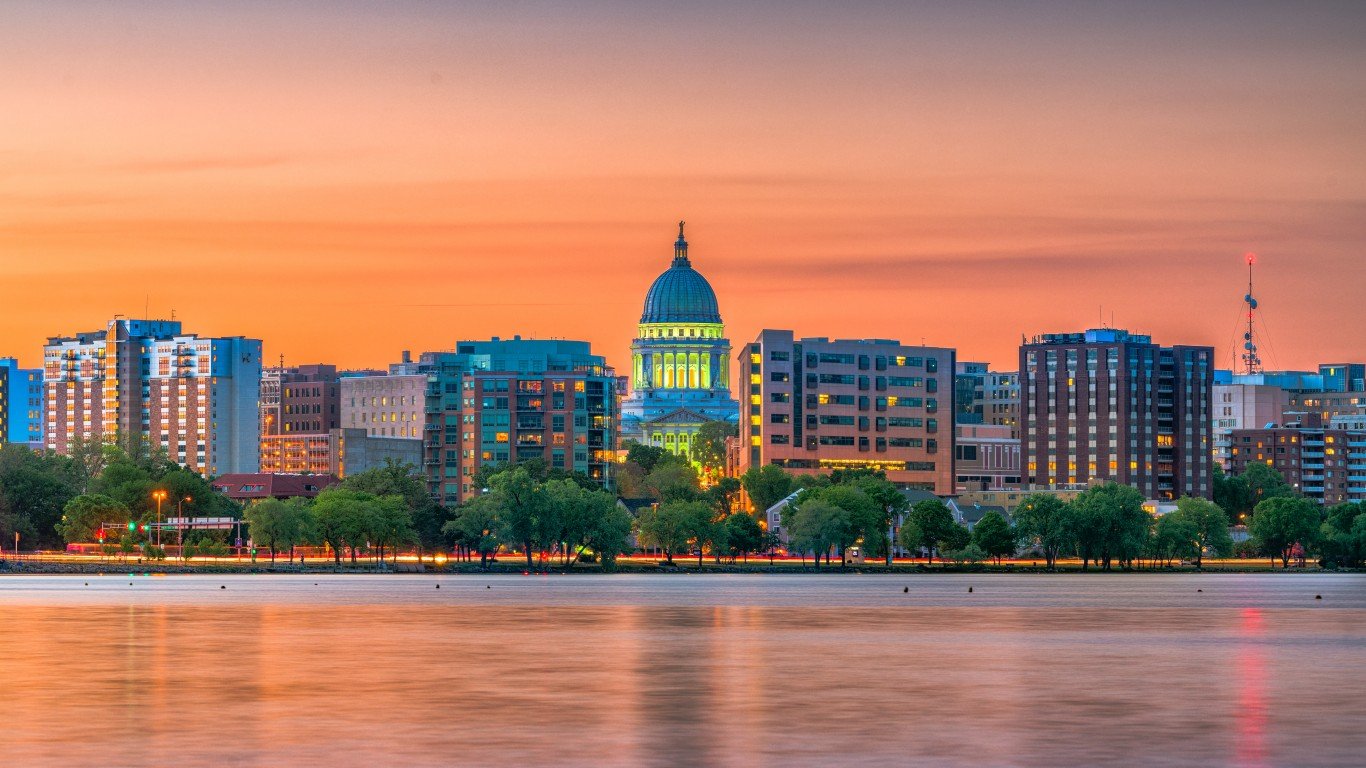
39. Wisconsin
> Annual lottery and casino spending: $149 per adult ($677.3 million total)
> Annual casino spending: $0
> Annual lottery spending: $149 per adult ($677.3 million total)
> State tax revenue from casinos: $0
Wisconsin was home to more than two dozen tribal casinos, as of 2019. Such casinos are not included in the casino spending figure. There are, however, no commercial casinos in the state.
Wisconsin has also had a state lottery since 1988, one year after voters approved of a measure legalizing the new form of gambling. The state sold over $677 million in lottery tickets in 2019. Per capita, annual lottery ticket spending in Wisconsin totals $149.

38. Arizona
> Annual lottery and casino spending: $178 per adult ($1.0 billion total)
> Annual casino spending: $0
> Annual lottery spending: $178 per adult ($1.0 billion total)
> State tax revenue from casinos: $0
Arizona has a state lottery and was home to more than two dozen tribal casinos as of 2019. In November 1980, Arizona became the first state west of the Mississippi River to approve a state lottery. The lottery predates gaming on Indian Reservations, which was ushered in by the state’s Indian Gaming Regulatory Act of 1988.
Lottery ticket sales in Arizona totalled $1 billion 2019 — or $178 for every adult resident.

37. Idaho
> Annual lottery and casino spending: $199 per adult ($265.6 million total)
> Annual casino spending: $0
> Annual lottery spending: $199 per adult ($265.6 million total)
> State tax revenue from casinos: $0
There were a total of 10 tribal casinos in Idaho housing over 3,760 gaming machines in 2019, but were not considered in the casino spending figure. These casinos are prohibited from offering table card games like blackjack or poker, however, and commercial casinos are also not permitted in the state.
While the state’s gambling laws are relatively restrictive, adults in Idaho are permitted to buy lottery tickets, including scratch off tickets and Powerball and Mega Millions tickets. Lottery ticket sales totalled $256.6 million in 2019, or $199 for every adult in Idaho.
[in-text-ad-2]

36. New Mexico
> Annual lottery and casino spending: $239 per adult ($387.7 million total)
> Annual casino spending: $150 per adult ($244.1 million total)
> Annual lottery spending: $88 per adult ($143.6 million total)
> State tax revenue from casinos: $112.9 million (1.5% of all tax revenue)
New Mexico had a total of five commercial casinos in addition to 27 tribal casinos in 2019. Each of the state’s five commercial casinos are racinos, a combined racetrack and casino. Unlike tribal casinos, these racinos are not permitted to offer table games. New Mexico is also the only state that restricts hours of operations for its casinos, allowing them to be open a maximum of 112 hours each week. Tribal casinos present considerable competition to commercial casinos, housing more than five times as many gaming machines, but spending at tribal casinos was not considered.
New Mexico also has a state lottery. Adults in the state spent a total of $387.7 million at commercial casinos and the lottery in 2019, equal to just $239 per adult.

35. California
> Annual lottery and casino spending: $241 per adult ($7.4 billion total)
> Annual casino spending: $0
> Annual lottery spending: $241 per adult ($7.4 billion total)
> State tax revenue from casinos: $0
Casinos in California house a total of 75,369 gaming machines, more than in every other state except Nevada. Spread over 77 tribal casinos, none of those gaming machines, however, are located in a commercial casino, so spendings on those were not included.
In November 1983, voters in California passed a proposition legalizing a state lottery. The proceeds from lottery ticket sales are used to fund the state’s public school system. Lottery ticket sales in the state totalled $7.4 billion in 2019, more than in every other state except New York. However, per capita annual lottery ticket sales comes out to just $241, less than in 27 states.
[in-text-ad]

34. Vermont
> Annual lottery and casino spending: $273 per adult ($139.3 million total)
> Annual casino spending: $0
> Annual lottery spending: $273 per adult ($139.3 million total)
> State tax revenue from casinos: $0
There are no casinos in Vermont — commercial or tribal. State residents are permitted to participate in raffles, bingo, or casino nights for a charitable cause. Social poker played in private residences is also permitted in Vermont.
Vermont also has a state lottery system that allows instant games, like scratch off tickets. The lottery was legalized in 1976, and the first ticket was sold in 1978. Vermonters bought $139.3 million in lottery tickets in 2019, or $273 per adult.

33. Texas
> Annual lottery and casino spending: $274 per adult ($5.9 billion total)
> Annual casino spending: $0
> Annual lottery spending: $274 per adult ($5.9 billion total)
> State tax revenue from casinos: $0
There were a total of two tribal casinos in all of Texas in 2019, housing 3,765 gaming machines. Commercial casinos are not permitted in the Lone Star State.
In November 1991, voters in Texas approved of a state lottery, and the first ticket was sold in May of the following year. Lottery ticket sales in Texas totalled $5.9 billion in 2019, more than in nearly every other state except New York, California, and Florida. However, per capita annual lottery ticket sales comes out to just $274 in Texas, less than in 22 other states.

32. Tennessee
> Annual lottery and casino spending: $289 per adult ($1.5 billion total)
> Annual casino spending: $0
> Annual lottery spending: $289 per adult ($1.5 billion total)
> State tax revenue from casinos: $0
There are no casinos in Tennessee, either tribal or commercial. The state’s restrictive gambling laws also prohibit bingo games. Voters in the state did, however, pass an amendment that legalized a state lottery in 2002. In 2019, adults in Tennessee spent $1.5 billion on lottery tickets, or about $289 for every adult state resident.
Online sports betting is also legal in Tennessee. The state also requires sportsbook operators to base outcomes on official data purchased from the sports league of other authorized data providers.
[in-text-ad-2]

31. Kansas
> Annual lottery and casino spending: $302 per adult ($669.2 million total)
> Annual casino spending: $188 per adult ($416.2 million total)
> Annual lottery spending: $114 per adult ($253.1 million total)
> State tax revenue from casinos: $112.4 million (1.1% of all tax revenue)
There were a total of six tribal casinos and four commercial casinos operating in Kansas in 2019. The commercial casinos are subject to a minimum 27% on tax on revenue — 22% to the state, 3% to local governments, and 2% for gambling addiction treatment — but the tribal casinos are not. Commercial casinos in the state reported revenue of $416.2 million in 2019, an all-time record.
Kansas residents are also permitted to purchase lottery tickets. Adults purchased $253.1 million in lottery tickets in 2019. Total spending in the state on both lottery tickets and commercial casinos totalled $669.2 million in 2019, or $302 for every adult resident.

30. Kentucky
> Annual lottery and casino spending: $307 per adult ($1.1 billion total)
> Annual casino spending: $0
> Annual lottery spending: $307 per adult ($1.1 billion total)
> State tax revenue from casinos: $0
Though the state is closely associated with horseracing, Kentucky has otherwise relatively restrictive laws related to gambling. As of 2019, no commercial or tribal casinos were permitted to operate in the state. The state does, however, allow certain video gaming machines, including those for placing bets on racing, in non-casino locations. There are nearly 3,000 such machines across the state.
A state lottery was legalized in Kentucky in 1988, and the first ticket was sold the following year. State residents spent a total of $1.1 billion on lottery tickets in 2019, or $307 for every adult resident.
[in-text-ad]

29. Virginia
> Annual lottery and casino spending: $324 per adult ($2.2 billion total)
> Annual casino spending: $0
> Annual lottery spending: $324 per adult ($2.2 billion total)
> State tax revenue from casinos: $0
There were no casinos operating in Virginia in 2019. However, that same year, state lawmakers authorized five cities to build a commercial casino, local voters approved of the measure, and now four of those five casinos are expected to open in 2022 or 2023. Still, there are more than 2,000 casino-style gambling machines in non-casino locations throughout the state.
Virginia has also had a state lottery since the 1980s. Lottery ticket sales in the state brought in $2.2 billion in 2019, or $324 for every adult resident.

28. Colorado
> Annual lottery and casino spending: $325 per adult ($1.5 billion total)
> Annual casino spending: $185 per adult ($833.7 million total)
> Annual lottery spending: $140 per adult ($628.2 million total)
> State tax revenue from casinos: $123.3 million (0.8% of all tax revenue)
There were 33 commercial casinos and two tribal casinos operating in Colorado in 2019. Commercial casinos alone reported $833.7 in revenue that year, and the state benefited from that spending to the tune of $123.3 in tax revenue. Casinos have been operating in the state for 30 years.
Colorado’s lottery system predates casinos by almost a decade. State residents purchased $628.2 million in instant games and lotto tickets in 2019. Combined lottery and commercial casino spending in the state totaled $1.5 billion in 2019, or $325 per adult.

27. North Carolina
> Annual lottery and casino spending: $325 per adult ($2.7 billion total)
> Annual casino spending: $0
> Annual lottery spending: $325 per adult ($2.7 billion total)
> State tax revenue from casinos: $0
There were no commercial casinos operating in North Carolina in 2019 and only three tribal casinos. Aside from charity bingo and raffles and online fantasy sports betting, the only other regulated form of gambling in the state is the lottery.
State residents 18 and older are permitted to purchase lottery tickets, including instant scratch off games. North Carolinians spent $2.7 billion on lottery tickets in 2019, or $325 for every adult in the state.
[in-text-ad-2]

26. Oregon
> Annual lottery and casino spending: $326 per adult ($1.1 billion total)
> Annual casino spending: $0
> Annual lottery spending: $326 per adult ($1.1 billion total)
> State tax revenue from casinos: $0
Though there were no commercial casinos operating in Oregon in 2019, there were still 11,530 casino-style gambling machines in non-casino locations throughout the state. The state is also home to 10 tribal casinos. Oregon also legalized sports betting in 2019.
Like most other states, Oregon also has a state lottery that includes instant games like scratch-off tickets. Lotto ticket sales totalled $1.1 billion in the state in 2019, or $326 for every adult.

25. New Hampshire
> Annual lottery and casino spending: $332 per adult ($366.9 million total)
> Annual casino spending: $0
> Annual lottery spending: $332 per adult ($366.9 million total)
> State tax revenue from casinos: $0
New Hampshire was the first state in the country to have a lottery. The state lottery, which was legalized in 1964, reported $366.9 million in ticket sales in 2019, less than in the vast majority of states with a lottery. However, adjusting for population, per capita lotto ticket sales in the state totaled $332 per adult, more than in all but 14 states.
There are no commercial casinos or tribal casinos operating in New Hampshire. There are, however, bingo, raffle, and poker rooms that brand themselves as casinos. These venues are legally required to be run by charitable organizations.
[in-text-ad]

24. Maine
> Annual lottery and casino spending: $405 per adult ($444.6 million total)
> Annual casino spending: $132 per adult ($145.2 million total)
> Annual lottery spending: $273 per adult ($299.5 million total)
> State tax revenue from casinos: $58.4 million (1.2% of all tax revenue)
There was one commercial casino and one commercial racino operating in Maine in 2019. That same year, the state reported $145.2 billion in commercial casino revenue, an all-time record.
In addition, Maine residents spent some $299.5 million on lottery tickets in 2019. Combined spending in Maine on both the lotto and at commercial casinos totaled $444.6 million, or $405 for every adult in the state.

23. Arkansas
> Annual lottery and casino spending: $406 per adult ($942.0 million total)
> Annual casino spending: $184 per adult ($426.5 million total)
> Annual lottery spending: $222 per adult ($515.5 million total)
> State tax revenue from casinos: $65.5 million (0.6% of all tax revenue)
Following the implementation of a constitutional amendmendment in November 2018, Arkansas became the 25th state to legalize commercial casinos. A total of three commercial casinos operated in the state in 2019 and reported $426.5 in revenue, generating $65.5 million in tax revenue.
One decade before commercial casinos opened in the state, Arkansas created a lottery. Adults 18 and over can buy lotto tickets, including instant games like scratch offs. Combined lotto ticket sales and casino revenue totalled $942 million in Arkansas in 2019, or $406 for every adult resident.

22. Florida
> Annual lottery and casino spending: $425 per adult ($7.3 billion total)
> Annual casino spending: $33 per adult ($574.7 million total)
> Annual lottery spending: $392 per adult ($6.8 billion total)
> State tax revenue from casinos: $201.1 million (0.4% of all tax revenue)
There were eight commercial casinos and racinos in Florida in 2019, and another seven tribal casinos. Commercial casino operations reported $574.7 million in revenue, an all-time high and the 10th consecutive year of growth. Casino spending also generated a total of $201.1 million in tax revenue for the state’s Educational Enhancement Trust Fund.
Florida’s state lottery system generated $6.8 billion in ticket sales in 2019, more than any other state except New York and California. Through both commercial casinos and lotteries, gambling spending totalled $7.3 billion in the Sunshine State in 2019, or $425 for every adult.
[in-text-ad-2]

21. South Dakota
> Annual lottery and casino spending: $431 per adult ($288.3 million total)
> Annual casino spending: $165 per adult ($110.3 million total)
> Annual lottery spending: $266 per adult ($178.1 million total)
> State tax revenue from casinos: $14.9 million (0.8% of all tax revenue)
There were 22 commercial casinos, 13 tribal casinos, and over 1,300 venues with electronic gaming devices across South Dakota in 2019. Patrons of the state’s commercial casinos spent $110.3 million on gaming in 2019, a record high driven largely by electronic gaming machines at casinos in Deadwood. Commercial casino gambling generated nearly $15 million in tax revenue.
South Dakota has also had a state lottery since 1989, and at $178.1 million, lotto ticket sales eclipsed casino spending in the state in 2019. Between commercial casinos and lottery tickets, gambling expenditures in South Dakota totalled $288.3 million in 2019, or $431 per adult.

20. Illinois
> Annual lottery and casino spending: $439 per adult ($4.3 billion total)
> Annual casino spending: $137 per adult ($1.4 billion total)
> Annual lottery spending: $302 per adult ($3.0 billion total)
> State tax revenue from casinos: $455.2 million (1.1% of all tax revenue)
Illinois was home to 10 commercial casinos, as well as more than 7,000 locations with electronic gaming devices in 2019. Commercial casinos in the state reported $1.4 billion in revenue in 2019, down 1.5% from the previous year. Tax revenue generated by casino gambling totalled $455.2 million the same year, also 1.5% below the previous year’s level. The bulk of casino revenue collected by the state goes towards Illinois’ Education Assistance Fund, and the remainder to local governments that host commercial casinos. The declines were attributed to the uptick in gaming machines in bars and taverns across the state.
Lotto ticket spending in Illinois totaled $3.0 billion in 2019, which, in combination with commercial casino spending, totaled $4.3 billion — or $439 per adult.
[in-text-ad]

19. South Carolina
> Annual lottery and casino spending: $456 per adult ($1.8 billion total)
> Annual casino spending: $0
> Annual lottery spending: $456 per adult ($1.8 billion total)
> State tax revenue from casinos: $0
Casinos are prohibited in South Carolina. Despite the restrictive gambling laws, per capita spending on gambling in the state rivals spending in states with many more opportunities for wagering.
South Carolinians spent $1.8 billion on lottery tickets in 2019, more than in all but 14 other states. Adjusting for the state’s adult population, per capita lotto ticket sales totaled $456, more than in all but eight other states.

18. Connecticut
> Annual lottery and casino spending: $470 per adult ($1.3 billion total)
> Annual casino spending: $0
> Annual lottery spending: $470 per adult ($1.3 billion total)
> State tax revenue from casinos: $0
Though there are two tribal casinos in Connecticut — Mohegan Sun and Foxwoods — there are no commercial casinos. These establishments had a combined 7,499 gaming machines as of 2019.
Gambling revenue that benefits the state comes exclusively from lottery ticket sales. Connecticut has a wide variety of lottery games, and residents spent a total of $1.3 on lotto tickets in 2019, or $470 per adult.

17. Georgia
> Annual lottery and casino spending: $525 per adult ($4.3 billion total)
> Annual casino spending: $0
> Annual lottery spending: $525 per adult ($4.3 billion total)
> State tax revenue from casinos: $0
There are no casinos — tribal or commercial — in Georgia. Despite the relatively strict gambling laws, Georgia’s lottery, which was approved by voters in 1992, is among the most popular in the country. Lotto ticket sales totalled $4.3 billion in 2019, more than in all but five other states. Lotto spending per adult in the state totaled $525 per adult, more per capita than in all but four states.
Georgia is the only state without any commercial casinos where gambling expenditures exceed $500 per adult.
[in-text-ad-2]

16. Ohio
> Annual lottery and casino spending: $557 per adult ($5.1 billion total)
> Annual casino spending: $213 per adult ($1.9 billion total)
> Annual lottery spending: $344 per adult ($3.1 billion total)
> State tax revenue from casinos: $649.9 million (2.2% of all tax revenue)
There are four commercial casinos in Ohio and another seven commercial racinos. Commercial casino spending in the Buckeye State hit an all-time high of $1.9 billion in 2019, generating nearly $650 million in tax revenue. Much of that money goes towards funding local government operations, and the second largest share goes towards the Ohio Student Fund.
Ohio residents spent an additional $3.1 billion on lottery tickets and games in 2019. Between commercial casinos and the state lottery, gambling expenditures totalled $5.1 billion in Ohio in 2019, or $557 for every adult resident.

15. Michigan
> Annual lottery and casino spending: $635 per adult ($5.0 billion total)
> Annual casino spending: $185 per adult ($1.5 billion total)
> Annual lottery spending: $449 per adult ($3.5 billion total)
> State tax revenue from casinos: $355.7 million (1.2% of all tax revenue)
Michigan was home to three commercial casinos as well as 24 tribal casinos in 2019. Commercial casinos in the state reported $1.5 billion in revenue in 2019, an all-time record, up 0.7% from the previous year. Tax revenue generated by casino gambling totalled $355.7 million the same year, up 1.7% from the previous year.
Michigan residents spent an additional $3.5 billion on lottery tickets and games in 2019. Between commercial casinos and the state lottery, gambling expenditures totalled $5.0 billion in Michigan in 2019 — 10th highest among states — or $635 for every adult resident.
[in-text-ad]

14. Missouri
> Annual lottery and casino spending: $658 per adult ($3.1 billion total)
> Annual casino spending: $363 per adult ($1.7 billion total)
> Annual lottery spending: $295 per adult ($1.4 billion total)
> State tax revenue from casinos: $436.6 million (3.3% of all tax revenue)
There were 13 casinos — each of them a riverboat casino — in Missouri in 2019. Patron spending at these establishments totalled $1.7 billion in 2019.
Though riverboat gambling spending in 2019 was 1.4% lower from the previous year, it still eclipsed the $1.4 billion state residents spent on lotto tickets the same year. Through both commercial casinos and lotteries, gambling spending totalled $3.1 billion in Missouri in 2019, or $658 for every adult.
13. Indiana
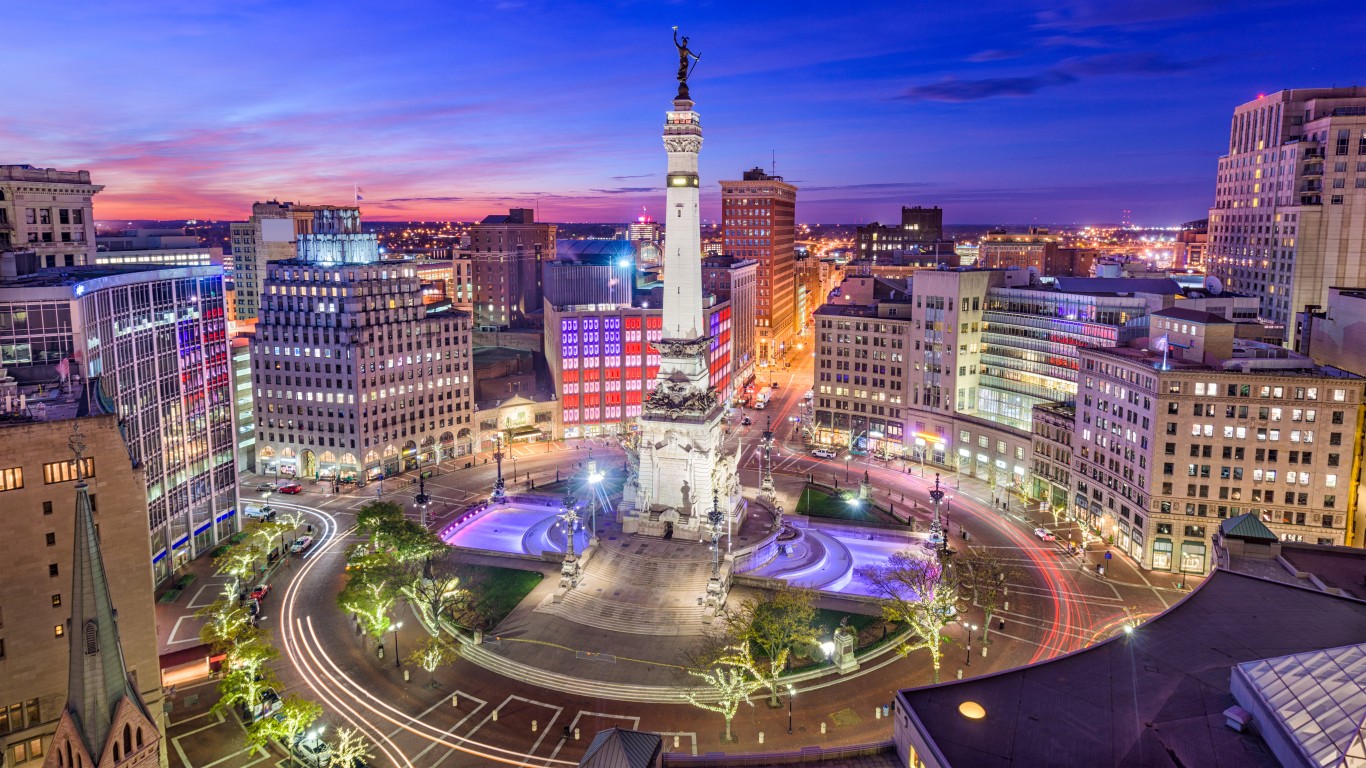
> Annual lottery and casino spending: $678 per adult ($3.5 billion total)
> Annual casino spending: $435 per adult ($2.2 billion total)
> Annual lottery spending: $243 per adult ($1.3 billion total)
> State tax revenue from casinos: $593.0 million (2.9% of all tax revenue)
Indiana is home to 13 commercial casinos, including eight riverboat casinos and two racinos, as well as one tribal casino. Spending at commercial casinos in the state totaled $2.2 billion in 2019, only marginally more than in the previous two years.
Indiana also has a state lottery, which, while not as popular as commercial casinos in the state, reported $1.3 billion in ticket sales in 2019. Combined gambling expenditures in Indiana totalled $3.5 billion in 2019, or $678 for each adult in the state.

12. Pennsylvania
> Annual lottery and casino spending: $743 per adult ($7.6 billion total)
> Annual casino spending: $333 per adult ($3.4 billion total)
> Annual lottery spending: $410 per adult ($4.2 billion total)
> State tax revenue from casinos: $1.5 billion (3.5% of all tax revenue)
There were 12 commercial casinos in Pennsylvania in 2019. That same year, patrons spent $3.4 billion on wagering, third most of any state. Casino spending was a boon for state finances, bringing in $1.5 billion in tax revenue, the most of any state in the country.
The Pennsylvania state lottery is even more popular than the state’s casinos, as lottery ticket spending totalled $4.2 billion in 2019. Combined spending on lottery tickets and in casinos totalled $7.6 billion in 2019, more than in every state except Nevada and New York.
[in-text-ad-2]

11. New York
> Annual lottery and casino spending: $750 per adult ($11.6 billion total)
> Annual casino spending: $177 per adult ($2.7 billion total)
> Annual lottery spending: $573 per adult ($8.8 billion total)
> State tax revenue from casinos: $1.1 billion (1.2% of all tax revenue)
Between New York state’s 12 commercial casinos — not including the 16 tribal casinos in the state — total spending hit an all-time high of $2.7 billion in 2019. Casino gambling was eclipsed, however, by lotto ticket sales, which at $8.8 billion in 2019 were the highest of any state in the country.
Combined spending on lottery tickets and at commercial casinos in New York totalled $11.6 billion in 2019, more than in every state except Nevada. Adjusting for population, however, spending totalled $750 for every adult, 11th most among states.

10. Iowa
> Annual lottery and casino spending: $772 per adult ($1.9 billion total)
> Annual casino spending: $611 per adult ($1.5 billion total)
> Annual lottery spending: $161 per adult ($390.9 million total)
> State tax revenue from casinos: $324.0 million (3.1% of all tax revenue)
Iowa was home to 19 commercial casinos and another four tribal casinos in 2019. Through electronic gaming devices, table games, and sports betting, commercial casino revenue reached an all-time high of $1.5 billion in the state the same year, bringing in about $324 million in tax revenue. Additionally, 3% of all commercial casino revenue in the state goes to charitable organizations.
Iowans spent an additional $390.9 million in lottery tickets in 2019. Combined casino and lotto spending in the state totalled $1.9 billion in 2019, or $772 per adult.
[in-text-ad]
9. Louisiana
> Annual lottery and casino spending: $837 per adult ($3.0 billion total)
> Annual casino spending: $690 per adult ($2.5 billion total)
> Annual lottery spending: $147 per adult ($524.0 million total)
> State tax revenue from casinos: $584.7 million (5.0% of all tax revenue)
As of the end of 2019, there were 20 commercial casinos, five tribal casinos, and more than 1,600 locations with electronic gaming devices throughout Louisiana. Louisiana was one of only a handful of states to report declining commercial casino revenue. At $2.5 billion in 2019, commercial casino revenue was about 4% lower than the previous year, the largest such decline of any state. The decline translated to a 3.8% drop in casino tax revenue.
Louisiana residents spent an additional $524.0 million in lottery tickets in 2019. Combined casino and lotto spending in the state totalled $3.0 billion in 2019, or $837 per adult.
8. Maryland
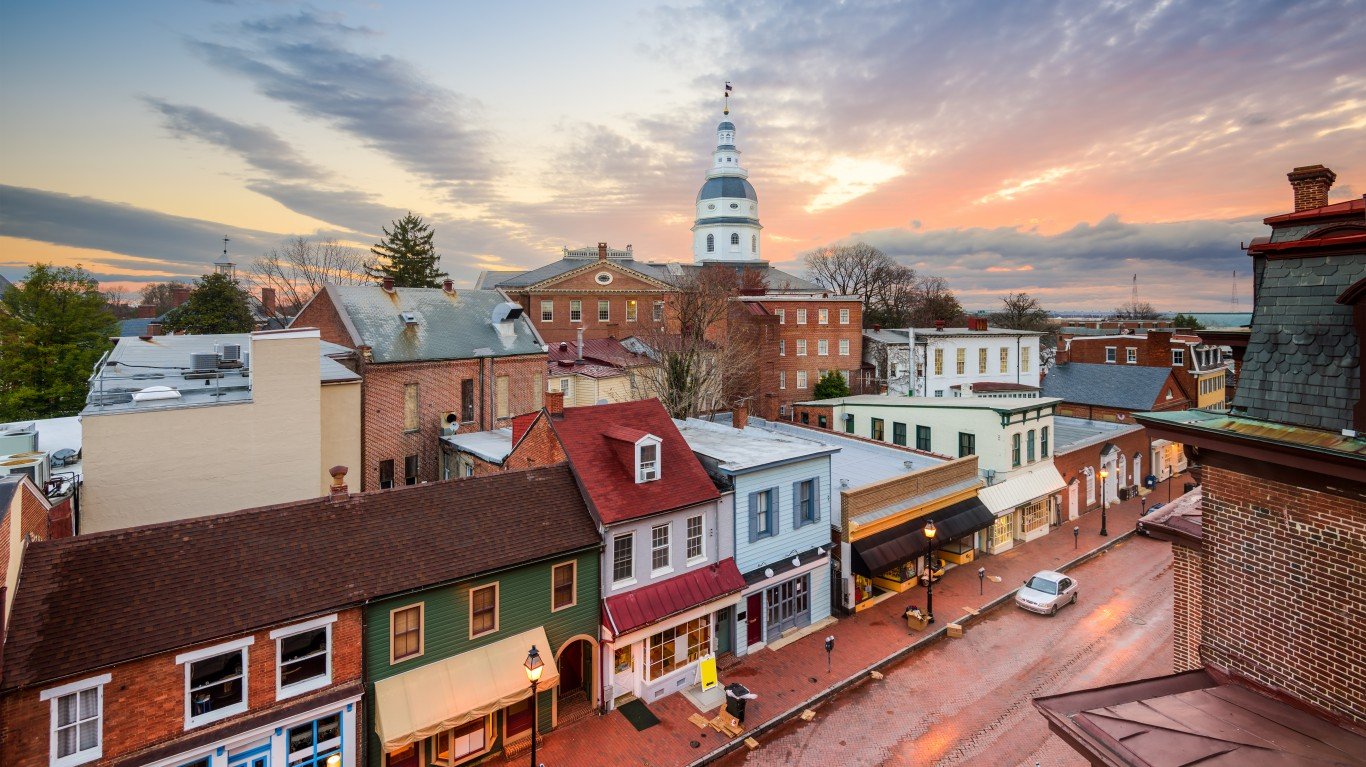
> Annual lottery and casino spending: $839 per adult ($4.0 billion total)
> Annual casino spending: $373 per adult ($1.8 billion total)
> Annual lottery spending: $466 per adult ($2.2 billion total)
> State tax revenue from casinos: $727.0 million (3.1% of all tax revenue)
Maryland’s five commercial casinos reported $1.8 billion in revenue in 2019, an all-time record, up 0.6% from the previous year. Casinos in Maryland are heavily taxed. Electronic gaming devices are taxed between 40% and 61%, and table games are taxed 20%. Commercial casinos generated $727.0 million in tax revenue, or just over 3% of the state’s total tax revenue. The bulk of commercial gaming revenue went to Maryland’s Education Trust Fund.
The Maryland state lottery is even more popular than the state’s casinos, as lottery ticket spending totalled $2.2 billion in 2019. Combined spending on lottery tickets and in casinos totalled $4.0 billion in 2019, or $839 per adult.

7. West Virginia
> Annual lottery and casino spending: $880 per adult ($1.3 billion total)
> Annual casino spending: $440 per adult ($630.0 million total)
> Annual lottery spending: $440 per adult ($631.0 million total)
> State tax revenue from casinos: $287.8 million (4.8% of all tax revenue)
As of the end of 2019, there were five commercial casinos and more than 1,200 locations with electronic gaming devices throughout West Virginia. Commercial casinos in the state reported $630 million in revenue in 2019, only about $1 million less than what the West Virginia state lottery generated in ticket sales the same year.
Combined casino and lotto spending in the state totalled $1.3 billion in 2019, or $880 per adult.
[in-text-ad-2]

6. Mississippi
> Annual lottery and casino spending: $966 per adult ($2.2 billion total)
> Annual casino spending: $966 per adult ($2.2 billion total)
> Annual lottery spending: $0
> State tax revenue from casinos: $261.6 million (3.2% of all tax revenue)
For more than two decades, gambling laws in Mississippi were distinct from those in most other states in that the state had a regulated commercial casino industry but did not have a lottery system. However, following legislation passed in 2018, lottery ticket sales began in Mississippi at the end of 2019.
Per capita spending at commercial casinos alone in Mississippi exceeds total gambling expenditures in many states that have both casinos and a lottery. There were a total of 26 commercial casinos and three tribal casinos in Mississippi at the end of 2019. The commercial casinos reported $2.2 billion in annual revenue, or $966 for every adult in the state.

5. New Jersey
> Annual lottery and casino spending: $972 per adult ($6.8 billion total)
> Annual casino spending: $500 per adult ($3.5 billion total)
> Annual lottery spending: $473 per adult ($3.3 billion total)
> State tax revenue from casinos: $349.8 million (0.9% of all tax revenue)
New Jersey was home to a total of nine commercial casinos — each located in Atlantic City — at the end of 2019. These establishments reported a combined revenue of $3.5 billion that year, a nearly 20% increase from the previous year, attributed mostly to growth in sports betting. Casino gambling brought in nearly $350 million in tax revenue in 2019.
The New Jersey state lottery nearly matched casino revenue in ticket sales in 2019. Garden State residents purchased $3.3 billion in lotto tickets in 2019. Combined casino and lotto spending in the state totalled $6.8 billion in 2019, or $972 per adult.
[in-text-ad]

4. Massachusetts
> Annual lottery and casino spending: $1,121 per adult ($6.2 billion total)
> Annual casino spending: $130 per adult ($718.5 million total)
> Annual lottery spending: $991 per adult ($5.5 billion total)
> State tax revenue from casinos: $216.1 million (0.7% of all tax revenue)
Massachusetts is one of only four states where spending on casino and lottery gaming topped $1,000 per adult in the state. As of the end of 2019, there were three casinos operating in the state that reported a combined revenue of $718.5 million — a 163% increase from the previous year. The nation-leading increase was driven by the June opening of a casino just outside of Boston.
Despite the burgeoning popularity of casino gambling in the state , lottery games remain the far more popular option. Massachusetts residents spent $5.5 billion on lotto tickets in 2019, which, when adjusting for population, is more than in every other state in the country.

3. Delaware
> Annual lottery and casino spending: $1,370 per adult ($1.1 billion total)
> Annual casino spending: $586 per adult ($450.8 million total)
> Annual lottery spending: $784 per adult ($603.7 million total)
> State tax revenue from casinos: $208.4 million (4.5% of all tax revenue)
There are three commercial casinos in Delaware, and, driven by sports betting, casino spending climbed for the third consecutive year in 2019 to $450.8 million.
The Delaware state lottery is even more popular than the state’s casinos, as lottery ticket spending totalled $603.7 million in 2019. Combined spending on lottery tickets and in casinos totalled $1.1 billion in 2019, or $1,370 per adult.

2. Rhode Island
> Annual lottery and casino spending: $1,594 per adult ($1.4 billion total)
> Annual casino spending: $781 per adult ($668.4 million total)
> Annual lottery spending: $813 per adult ($695.6 million total)
> State tax revenue from casinos: $329.6 million (8.9% of all tax revenue)
Spending on lottery and casinos in Rhode Island totalled $1.4 billion in 2019. Adjusting for population, gambling expenditures totalled $1,594 per adult in the state in 2019, more than every other state except Nevada.
The state’s two casinos reported $668.4 million in revenue in 2019, just shy of the $695.6 million in total lotto tickets sales.
[in-text-ad-2]

1. Nevada
> Annual lottery and casino spending: $5,035 per adult ($12.0 billion total)
> Annual casino spending: $5,035 per adult ($12.0 billion total)
> Annual lottery spending: $0
> State tax revenue from casinos: $969.3 million (9.9% of all tax revenue)
Though it has no state lottery, Nevada reported higher gambling expenditures than every other state in 2019, both in absolute and population adjusted terms. Casino spending totalled $12.0 billion in 2019, or $5,035 for every adult in the state. It is important to note, however, that Las Vegas is a popular tourist destination, reporting 42.5 million visitors in 2019. As a result, per capita gambling expenditures in the state are not likely an accurate representation of residents’ spending.
Across Nevada, there are a total of 219 commercial casinos, four tribal casinos, and 1,978 locations with electronic gaming devices. All told, there are 160,526 gaming machines in Nevada, by far the most of any state. Gambling is a critical source of tax revenue, generating nearly $1 billion in revenue in 2019, accounting for about one in every 10 tax dollars collected by the state.
Essential Tips for Investing: Sponsored
A financial advisor can help you understand the advantages and disadvantages of investment properties. Finding a qualified financial advisor doesn’t have to be hard. SmartAsset’s free tool matches you with up to three financial advisors who serve your area, and you can interview your advisor matches at no cost to decide which one is right for you. If you’re ready to find an advisor who can help you achieve your financial goals, get started now.
Investing in real estate can diversify your portfolio. But expanding your horizons may add additional costs. If you’re an investor looking to minimize expenses, consider checking out online brokerages. They often offer low investment fees, helping you maximize your profit.
Thank you for reading! Have some feedback for us?
Contact the 24/7 Wall St. editorial team.
 24/7 Wall St.
 24/7 Wall St.
 24/7 Wall St.
