
The share of Americans under the age of 65 without health insurance fell every year between 2010, when the Affordable Care Act was signed into law, and 2016, when President Barack Obama left office. Though the U.S. uninsured rate among Americans younger than 65 has inched up over the years since, it remains well below the reported 17%+ figures in the years leading up to the ACA.
Without a universal health care program, most Americans under age 65 receive employer-based health insurance coverage. Under this system, 10.8% of Americans younger than 65, approximately 29 million people, lacked health insurance in 2019 — and that was before the COVID-19 pandemic put over 22 million Americans out of work.
While most of those jobs have since been restored, the official uninsured rate for Americans younger than 65 for 2020 will likely be higher than the 2019 rate. And in some parts of the country, the 2019 rate was already close to or above the higher national uninsured rates of the era before the passing of the ACA.
Using data from the U.S. Census Bureau, 24/7 Wall St. identified the metropolitan area in every state with the worst health insurance coverage. Metro areas are ranked based on the share of residents under age 65 — the age of eligibility for Medicare — who are uninsured. It is important to note that Delaware, New Hampshire, Rhode Island, and Vermont each have only one metropolitan area, and as a result, these places rank as having the worst health insurance coverage by default only.
Uninsured rates vary considerably across the country, and as a result, a metro area’s ranking on this list does not necessarily mean the uninsured rate is high relative to the nation as a whole. In over a dozen states, particularly in New England and parts of the Midwest, the highest uninsured rate among counties is in the single digits. Uninsured rates in the metropolitan areas on this list range from 4.1% to 35.7%. In comparison, here is the metro with the best health insurance in every state.
Click here to see the metro with the worst health insurance coverage in every state
Click here to see our detailed methodology
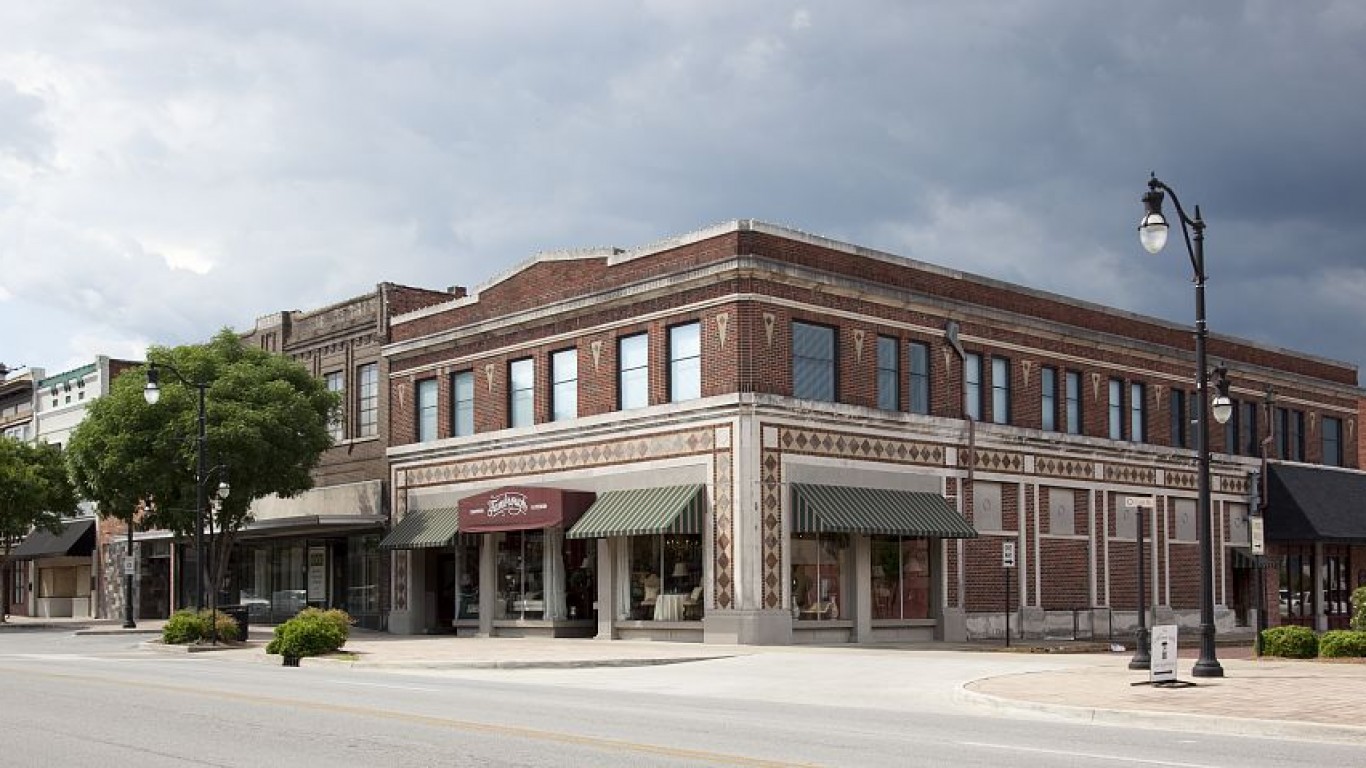
Alabama: Gadsden
> Americans under 65, no health insurance: 16.0% (Alabama: 11.7%)
> Americans under 65, Medicare coverage (or multiple types): 5.1% (Alabama: 4.8%)
> Americans under 65, Medicaid coverage (or multiple types): 22.8% (Alabama: 20.8%)
> Americans under 65, VA coverage (or multiple types): 1.1% (Alabama: 1.6%)
> Americans under 65, employer-based insurance (or multiple types): 53.4% (Alabama: 58.2%)
> Americans under 65, direct-purchase insurance (or multiple types): 12.3% (Alabama: 9.7%)
> Americans under 65, Tricare/military insurance (or many types): 1.0% (Alabama: 3.6%)
[in-text-ad]

Alaska: Anchorage
> Americans under 65, no health insurance: 12.9% (Alaska: 13.9%)
> Americans under 65, Medicare coverage (or multiple types): 2.8% (Alaska: 2.3%)
> Americans under 65, Medicaid coverage (or multiple types): 20.7% (Alaska: 22.8%)
> Americans under 65, VA coverage (or multiple types): 4.0% (Alaska: 3.1%)
> Americans under 65, employer-based insurance (or multiple types): 57.6% (Alaska: 55.0%)
> Americans under 65, direct-purchase insurance (or multiple types): 6.9% (Alaska: 6.4%)
> Americans under 65, Tricare/military insurance (or many types): 10.5% (Alaska: 9.6%)
[recirclink id=497059]
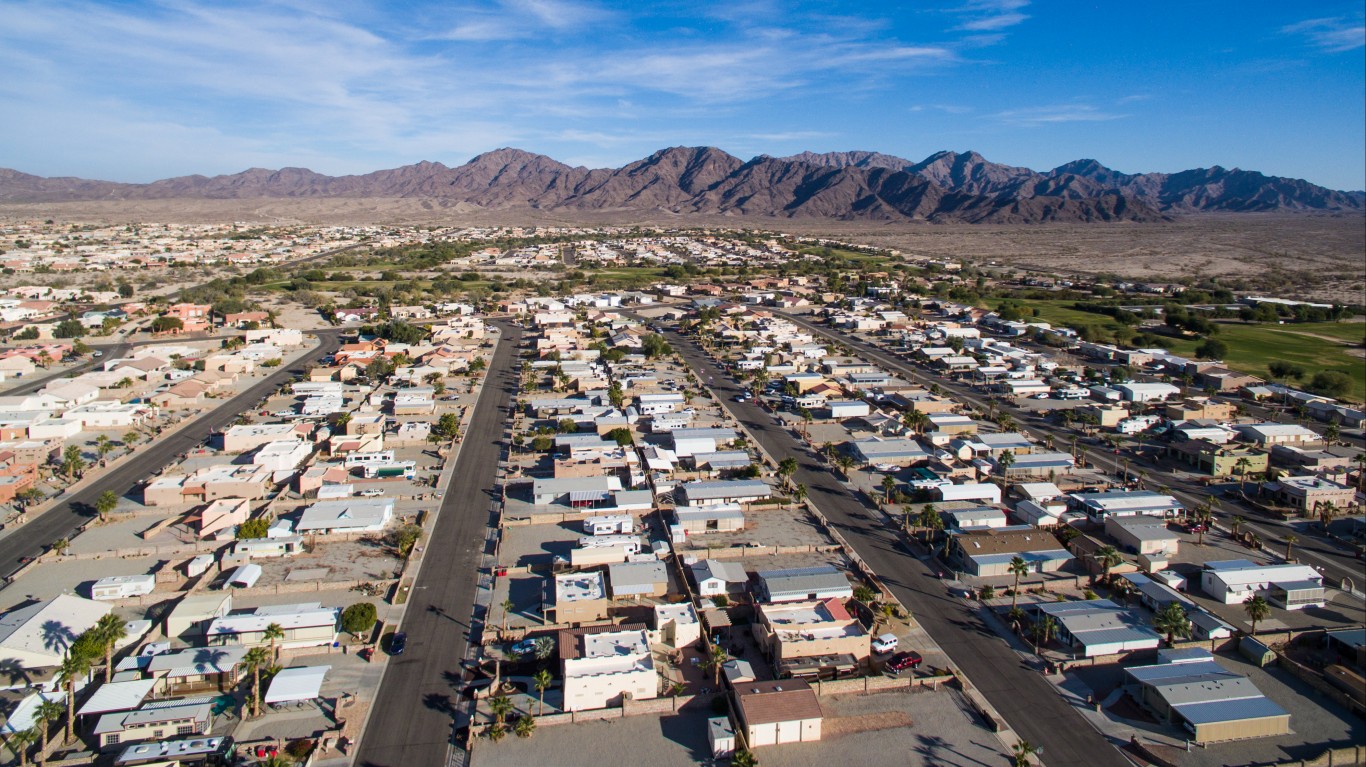
Arizona: Yuma
> Americans under 65, no health insurance: 17.4% (Arizona: 13.6%)
> Americans under 65, Medicare coverage (or multiple types): 1.8% (Arizona: 2.8%)
> Americans under 65, Medicaid coverage (or multiple types): 35.9% (Arizona: 22.8%)
> Americans under 65, VA coverage (or multiple types): 1.7% (Arizona: 1.6%)
> Americans under 65, employer-based insurance (or multiple types): 40.8% (Arizona: 56.2%)
> Americans under 65, direct-purchase insurance (or multiple types): 6.9% (Arizona: 8.5%)
> Americans under 65, Tricare/military insurance (or many types): 5.4% (Arizona: 2.4%)

Arkansas: Hot Springs
> Americans under 65, no health insurance: 14.5% (Arkansas: 10.9%)
> Americans under 65, Medicare coverage (or multiple types): 6.0% (Arkansas: 4.9%)
> Americans under 65, Medicaid coverage (or multiple types): 31.9% (Arkansas: 29.1%)
> Americans under 65, VA coverage (or multiple types): 1.3% (Arkansas: 1.7%)
> Americans under 65, employer-based insurance (or multiple types): 43.4% (Arkansas: 51.4%)
> Americans under 65, direct-purchase insurance (or multiple types): 10.6% (Arkansas: 9.1%)
> Americans under 65, Tricare/military insurance (or many types): 1.7% (Arkansas: 2.0%)
[in-text-ad-2]

California: Merced
> Americans under 65, no health insurance: 13.2% (California: 8.9%)
> Americans under 65, Medicare coverage (or multiple types): 1.8% (California: 2.1%)
> Americans under 65, Medicaid coverage (or multiple types): 41.2% (California: 26.4%)
> Americans under 65, VA coverage (or multiple types): 0.8% (California: 0.9%)
> Americans under 65, employer-based insurance (or multiple types): 41.8% (California: 56.9%)
> Americans under 65, direct-purchase insurance (or multiple types): 6.6% (California: 10.4%)
> Americans under 65, Tricare/military insurance (or many types): 0.7% (California: 1.4%)

Colorado: Grand Junction
> Americans under 65, no health insurance: 12.4% (Colorado: 9.3%)
> Americans under 65, Medicare coverage (or multiple types): 3.1% (Colorado: 1.9%)
> Americans under 65, Medicaid coverage (or multiple types): 26.0% (Colorado: 18.1%)
> Americans under 65, VA coverage (or multiple types): 1.6% (Colorado: 1.7%)
> Americans under 65, employer-based insurance (or multiple types): 55.3% (Colorado: 62.4%)
> Americans under 65, direct-purchase insurance (or multiple types): 6.4% (Colorado: 10.5%)
> Americans under 65, Tricare/military insurance (or many types): 0.7% (Colorado: 3.4%)
[in-text-ad]

Connecticut: Bridgeport-Stamford-Norwalk
> Americans under 65, no health insurance: 10.6% (Connecticut: 7.0%)
> Americans under 65, Medicare coverage (or multiple types): 1.6% (Connecticut: 2.5%)
> Americans under 65, Medicaid coverage (or multiple types): 20.2% (Connecticut: 23.2%)
> Americans under 65, VA coverage (or multiple types): 0.5% (Connecticut: 0.8%)
> Americans under 65, employer-based insurance (or multiple types): 61.9% (Connecticut: 64.2%)
> Americans under 65, direct-purchase insurance (or multiple types): 9.6% (Connecticut: 8.5%)
> Americans under 65, Tricare/military insurance (or many types): 0.4% (Connecticut: 1.0%)
[recirclink id=919182]

Delaware: Dover*
> Americans under 65, no health insurance: 10.9% (Delaware: 8.1%)
> Americans under 65, Medicare coverage (or multiple types): 4.4% (Delaware: 3.3%)
> Americans under 65, Medicaid coverage (or multiple types): 23.5% (Delaware: 23.0%)
> Americans under 65, VA coverage (or multiple types): 2.0% (Delaware: 1.2%)
> Americans under 65, employer-based insurance (or multiple types): 57.4% (Delaware: 63.6%)
> Americans under 65, direct-purchase insurance (or multiple types): 6.2% (Delaware: 8.3%)
> Americans under 65, Tricare/military insurance (or many types): 9.8% (Delaware: 3.2%)
*Because Dover is the only eligible metro in Delaware, it is the metro with the worst health insurance coverage by default.

Florida: Sebastian-Vero Beach
> Americans under 65, no health insurance: 19.9% (Florida: 16.3%)
> Americans under 65, Medicare coverage (or multiple types): 2.6% (Florida: 3.2%)
> Americans under 65, Medicaid coverage (or multiple types): 18.6% (Florida: 18.1%)
> Americans under 65, VA coverage (or multiple types): 1.6% (Florida: 1.6%)
> Americans under 65, employer-based insurance (or multiple types): 46.1% (Florida: 51.4%)
> Americans under 65, direct-purchase insurance (or multiple types): 17.1% (Florida: 14.2%)
> Americans under 65, Tricare/military insurance (or many types): 2.3% (Florida: 2.7%)
[in-text-ad-2]

Georgia: Gainesville
> Americans under 65, no health insurance: 21.6% (Georgia: 15.5%)
> Americans under 65, Medicare coverage (or multiple types): 2.5% (Georgia: 3.1%)
> Americans under 65, Medicaid coverage (or multiple types): 17.2% (Georgia: 17.5%)
> Americans under 65, VA coverage (or multiple types): 1.0% (Georgia: 1.7%)
> Americans under 65, employer-based insurance (or multiple types): 52.2% (Georgia: 58.1%)
> Americans under 65, direct-purchase insurance (or multiple types): 9.2% (Georgia: 9.2%)
> Americans under 65, Tricare/military insurance (or many types): 0.9% (Georgia: 3.3%)

Hawaii: Kahului-Wailuku-Lahaina
> Americans under 65, no health insurance: 7.4% (Hawaii: 5.0%)
> Americans under 65, Medicare coverage (or multiple types): 1.7% (Hawaii: 2.0%)
> Americans under 65, Medicaid coverage (or multiple types): 21.4% (Hawaii: 19.5%)
> Americans under 65, VA coverage (or multiple types): 0.4% (Hawaii: 1.5%)
> Americans under 65, employer-based insurance (or multiple types): 65.5% (Hawaii: 66.9%)
> Americans under 65, direct-purchase insurance (or multiple types): 14.3% (Hawaii: 9.9%)
> Americans under 65, Tricare/military insurance (or many types): 0.8% (Hawaii: 7.6%)
[in-text-ad]

Idaho: Twin Falls
> Americans under 65, no health insurance: 15.4% (Idaho: 12.8%)
> Americans under 65, Medicare coverage (or multiple types): 2.3% (Idaho: 2.7%)
> Americans under 65, Medicaid coverage (or multiple types): 21.3% (Idaho: 17.3%)
> Americans under 65, VA coverage (or multiple types): 0.8% (Idaho: 1.6%)
> Americans under 65, employer-based insurance (or multiple types): 56.9% (Idaho: 58.7%)
> Americans under 65, direct-purchase insurance (or multiple types): 9.7% (Idaho: 12.9%)
> Americans under 65, Tricare/military insurance (or many types): 0.4% (Idaho: 2.5%)
[recirclink id=924822]

Illinois: Chicago-Naperville-Elgin
> Americans under 65, no health insurance: 9.4% (Illinois: 8.6%)
> Americans under 65, Medicare coverage (or multiple types): 2.1% (Illinois: 2.5%)
> Americans under 65, Medicaid coverage (or multiple types): 18.3% (Illinois: 19.7%)
> Americans under 65, VA coverage (or multiple types): 0.7% (Illinois: 0.8%)
> Americans under 65, employer-based insurance (or multiple types): 65.9% (Illinois: 64.9%)
> Americans under 65, direct-purchase insurance (or multiple types): 7.9% (Illinois: 8.3%)
> Americans under 65, Tricare/military insurance (or many types): 0.6% (Illinois: 1.0%)

Indiana: Elkhart-Goshen
> Americans under 65, no health insurance: 18.4% (Indiana: 10.3%)
> Americans under 65, Medicare coverage (or multiple types): 2.2% (Indiana: 3.2%)
> Americans under 65, Medicaid coverage (or multiple types): 17.8% (Indiana: 19.1%)
> Americans under 65, VA coverage (or multiple types): 0.4% (Indiana: 1.1%)
> Americans under 65, employer-based insurance (or multiple types): 59.5% (Indiana: 64.4%)
> Americans under 65, direct-purchase insurance (or multiple types): 6.0% (Indiana: 7.8%)
> Americans under 65, Tricare/military insurance (or many types): 0.6% (Indiana: 1.3%)
[in-text-ad-2]
Iowa: Iowa City
> Americans under 65, no health insurance: 8.7% (Iowa: 6.0%)
> Americans under 65, Medicare coverage (or multiple types): 2.2% (Iowa: 2.7%)
> Americans under 65, Medicaid coverage (or multiple types): 14.9% (Iowa: 21.3%)
> Americans under 65, VA coverage (or multiple types): 1.0% (Iowa: 1.3%)
> Americans under 65, employer-based insurance (or multiple types): 70.5% (Iowa: 67.6%)
> Americans under 65, direct-purchase insurance (or multiple types): 10.4% (Iowa: 8.5%)
> Americans under 65, Tricare/military insurance (or many types): 1.4% (Iowa: 1.3%)

Kansas: Wichita
> Americans under 65, no health insurance: 12.1% (Kansas: 10.9%)
> Americans under 65, Medicare coverage (or multiple types): 3.2% (Kansas: 2.7%)
> Americans under 65, Medicaid coverage (or multiple types): 18.2% (Kansas: 14.3%)
> Americans under 65, VA coverage (or multiple types): 1.5% (Kansas: 1.3%)
> Americans under 65, employer-based insurance (or multiple types): 62.9% (Kansas: 66.4%)
> Americans under 65, direct-purchase insurance (or multiple types): 8.8% (Kansas: 10.1%)
> Americans under 65, Tricare/military insurance (or many types): 3.2% (Kansas: 3.2%)
[in-text-ad]

Kentucky: Bowling Green
> Americans under 65, no health insurance: 8.5% (Kentucky: 7.7%)
> Americans under 65, Medicare coverage (or multiple types): 4.1% (Kentucky: 5.0%)
> Americans under 65, Medicaid coverage (or multiple types): 26.4% (Kentucky: 28.3%)
> Americans under 65, VA coverage (or multiple types): 0.8% (Kentucky: 1.4%)
> Americans under 65, employer-based insurance (or multiple types): 58.9% (Kentucky: 57.1%)
> Americans under 65, direct-purchase insurance (or multiple types): 8.0% (Kentucky: 7.3%)
> Americans under 65, Tricare/military insurance (or many types): 2.1% (Kentucky: 2.2%)
[recirclink id=928130]

Louisiana: Alexandria
> Americans under 65, no health insurance: 11.8% (Louisiana: 10.5%)
> Americans under 65, Medicare coverage (or multiple types): 4.9% (Louisiana: 4.0%)
> Americans under 65, Medicaid coverage (or multiple types): 36.8% (Louisiana: 31.6%)
> Americans under 65, VA coverage (or multiple types): 2.8% (Louisiana: 1.2%)
> Americans under 65, employer-based insurance (or multiple types): 45.8% (Louisiana: 50.9%)
> Americans under 65, direct-purchase insurance (or multiple types): 8.2% (Louisiana: 8.4%)
> Americans under 65, Tricare/military insurance (or many types): 2.1% (Louisiana: 2.0%)

Maine: Bangor
> Americans under 65, no health insurance: 11.8% (Maine: 10.1%)
> Americans under 65, Medicare coverage (or multiple types): 5.4% (Maine: 4.4%)
> Americans under 65, Medicaid coverage (or multiple types): 22.4% (Maine: 20.2%)
> Americans under 65, VA coverage (or multiple types): 1.7% (Maine: 1.7%)
> Americans under 65, employer-based insurance (or multiple types): 55.1% (Maine: 61.4%)
> Americans under 65, direct-purchase insurance (or multiple types): 11.5% (Maine: 10.5%)
> Americans under 65, Tricare/military insurance (or many types): 4.0% (Maine: 2.4%)
[in-text-ad-2]

Maryland: Salisbury
> Americans under 65, no health insurance: 9.4% (Maryland: 6.9%)
> Americans under 65, Medicare coverage (or multiple types): 3.5% (Maryland: 2.8%)
> Americans under 65, Medicaid coverage (or multiple types): 30.1% (Maryland: 19.6%)
> Americans under 65, VA coverage (or multiple types): 0.7% (Maryland: 1.2%)
> Americans under 65, employer-based insurance (or multiple types): 53.5% (Maryland: 65.6%)
> Americans under 65, direct-purchase insurance (or multiple types): 9.5% (Maryland: 9.3%)
> Americans under 65, Tricare/military insurance (or many types): 1.4% (Maryland: 3.3%)

Massachusetts: Barnstable Town
> Americans under 65, no health insurance: 4.1% (Massachusetts: 3.5%)
> Americans under 65, Medicare coverage (or multiple types): 2.1% (Massachusetts: 2.6%)
> Americans under 65, Medicaid coverage (or multiple types): 23.2% (Massachusetts: 23.0%)
> Americans under 65, VA coverage (or multiple types): 0.5% (Massachusetts: 0.6%)
> Americans under 65, employer-based insurance (or multiple types): 63.7% (Massachusetts: 68.1%)
> Americans under 65, direct-purchase insurance (or multiple types): 11.3% (Massachusetts: 10.2%)
> Americans under 65, Tricare/military insurance (or many types): 2.1% (Massachusetts: 0.8%)
[in-text-ad]
Michigan: Niles
> Americans under 65, no health insurance: 9.4% (Michigan: 6.9%)
> Americans under 65, Medicare coverage (or multiple types): 4.1% (Michigan: 3.7%)
> Americans under 65, Medicaid coverage (or multiple types): 28.4% (Michigan: 23.8%)
> Americans under 65, VA coverage (or multiple types): 1.0% (Michigan: 1.0%)
> Americans under 65, employer-based insurance (or multiple types): 56.0% (Michigan: 63.7%)
> Americans under 65, direct-purchase insurance (or multiple types): 10.0% (Michigan: 8.9%)
> Americans under 65, Tricare/military insurance (or many types): 0.6% (Michigan: 0.9%)
[recirclink id=931001]

Minnesota: Rochester
> Americans under 65, no health insurance: 6.6% (Minnesota: 5.8%)
> Americans under 65, Medicare coverage (or multiple types): 1.2% (Minnesota: 2.0%)
> Americans under 65, Medicaid coverage (or multiple types): 14.3% (Minnesota: 18.9%)
> Americans under 65, VA coverage (or multiple types): 0.8% (Minnesota: 0.9%)
> Americans under 65, employer-based insurance (or multiple types): 76.2% (Minnesota: 69.8%)
> Americans under 65, direct-purchase insurance (or multiple types): 7.5% (Minnesota: 8.4%)
> Americans under 65, Tricare/military insurance (or many types): 0.8% (Minnesota: 1.0%)
Mississippi: Hattiesburg
> Americans under 65, no health insurance: 16.6% (Mississippi: 15.4%)
> Americans under 65, Medicare coverage (or multiple types): 3.9% (Mississippi: 4.5%)
> Americans under 65, Medicaid coverage (or multiple types): 25.1% (Mississippi: 25.1%)
> Americans under 65, VA coverage (or multiple types): 1.8% (Mississippi: 1.2%)
> Americans under 65, employer-based insurance (or multiple types): 50.1% (Mississippi: 50.9%)
> Americans under 65, direct-purchase insurance (or multiple types): 7.0% (Mississippi: 8.6%)
> Americans under 65, Tricare/military insurance (or many types): 2.5% (Mississippi: 2.9%)
[in-text-ad-2]
Missouri: Joplin
> Americans under 65, no health insurance: 17.8% (Missouri: 12.0%)
> Americans under 65, Medicare coverage (or multiple types): 4.0% (Missouri: 3.7%)
> Americans under 65, Medicaid coverage (or multiple types): 23.4% (Missouri: 15.6%)
> Americans under 65, VA coverage (or multiple types): 2.2% (Missouri: 1.4%)
> Americans under 65, employer-based insurance (or multiple types): 51.3% (Missouri: 63.3%)
> Americans under 65, direct-purchase insurance (or multiple types): 8.8% (Missouri: 9.3%)
> Americans under 65, Tricare/military insurance (or many types): 1.1% (Missouri: 2.1%)

Montana: Great Falls
> Americans under 65, no health insurance: 8.6% (Montana: 10.2%)
> Americans under 65, Medicare coverage (or multiple types): 3.3% (Montana: 3.0%)
> Americans under 65, Medicaid coverage (or multiple types): 29.6% (Montana: 23.6%)
> Americans under 65, VA coverage (or multiple types): 3.3% (Montana: 2.2%)
> Americans under 65, employer-based insurance (or multiple types): 48.2% (Montana: 55.0%)
> Americans under 65, direct-purchase insurance (or multiple types): 8.9% (Montana: 13.6%)
> Americans under 65, Tricare/military insurance (or many types): 11.0% (Montana: 3.0%)
[in-text-ad]

Nebraska: Grand Island
> Americans under 65, no health insurance: 12.5% (Nebraska: 9.8%)
> Americans under 65, Medicare coverage (or multiple types): 2.4% (Nebraska: 2.2%)
> Americans under 65, Medicaid coverage (or multiple types): 17.8% (Nebraska: 13.4%)
> Americans under 65, VA coverage (or multiple types): 1.3% (Nebraska: 1.2%)
> Americans under 65, employer-based insurance (or multiple types): 62.9% (Nebraska: 67.2%)
> Americans under 65, direct-purchase insurance (or multiple types): 10.8% (Nebraska: 12.1%)
> Americans under 65, Tricare/military insurance (or many types): 0.9% (Nebraska: 2.6%)
[recirclink id=497059]

Nevada: Carson City
> Americans under 65, no health insurance: 18.7% (Nevada: 13.4%)
> Americans under 65, Medicare coverage (or multiple types): 2.9% (Nevada: 2.4%)
> Americans under 65, Medicaid coverage (or multiple types): 18.2% (Nevada: 18.9%)
> Americans under 65, VA coverage (or multiple types): 1.5% (Nevada: 1.8%)
> Americans under 65, employer-based insurance (or multiple types): 53.9% (Nevada: 59.4%)
> Americans under 65, direct-purchase insurance (or multiple types): 9.3% (Nevada: 8.7%)
> Americans under 65, Tricare/military insurance (or many types): 0.5% (Nevada: 2.6%)

New Hampshire: Manchester-Nashua*
> Americans under 65, no health insurance: 7.9% (New Hampshire: 7.6%)
> Americans under 65, Medicare coverage (or multiple types): 3.1% (New Hampshire: 3.2%)
> Americans under 65, Medicaid coverage (or multiple types): 15.7% (New Hampshire: 14.6%)
> Americans under 65, VA coverage (or multiple types): 1.1% (New Hampshire: 1.2%)
> Americans under 65, employer-based insurance (or multiple types): 69.4% (New Hampshire: 68.8%)
> Americans under 65, direct-purchase insurance (or multiple types): 7.5% (New Hampshire: 9.1%)
> Americans under 65, Tricare/military insurance (or many types): 1.4% (New Hampshire: 1.5%)
*Because Manchester-Nashua is the only eligible metro in New Hampshire, it is the metro with the worst health insurance coverage by default.
[in-text-ad-2]

New Jersey: Vineland-Bridgeton
> Americans under 65, no health insurance: 10.8% (New Jersey: 9.2%)
> Americans under 65, Medicare coverage (or multiple types): 4.5% (New Jersey: 2.5%)
> Americans under 65, Medicaid coverage (or multiple types): 34.6% (New Jersey: 17.4%)
> Americans under 65, VA coverage (or multiple types): 0.4% (New Jersey: 0.5%)
> Americans under 65, employer-based insurance (or multiple types): 52.2% (New Jersey: 66.4%)
> Americans under 65, direct-purchase insurance (or multiple types): 10.0% (New Jersey: 8.7%)
> Americans under 65, Tricare/military insurance (or many types): 0.6% (New Jersey: 0.7%)

New Mexico: Farmington
> Americans under 65, no health insurance: 16.3% (New Mexico: 12.0%)
> Americans under 65, Medicare coverage (or multiple types): 4.0% (New Mexico: 3.7%)
> Americans under 65, Medicaid coverage (or multiple types): 40.3% (New Mexico: 37.0%)
> Americans under 65, VA coverage (or multiple types): 1.5% (New Mexico: 1.7%)
> Americans under 65, employer-based insurance (or multiple types): 43.5% (New Mexico: 46.1%)
> Americans under 65, direct-purchase insurance (or multiple types): 3.5% (New Mexico: 7.6%)
> Americans under 65, Tricare/military insurance (or many types): 1.3% (New Mexico: 2.9%)
[in-text-ad]

New York: New York-Newark-Jersey City
> Americans under 65, no health insurance: 7.9% (New York: 6.1%)
> Americans under 65, Medicare coverage (or multiple types): 2.2% (New York: 2.7%)
> Americans under 65, Medicaid coverage (or multiple types): 23.8% (New York: 26.9%)
> Americans under 65, VA coverage (or multiple types): 0.4% (New York: 0.6%)
> Americans under 65, employer-based insurance (or multiple types): 61.4% (New York: 60.2%)
> Americans under 65, direct-purchase insurance (or multiple types): 10.4% (New York: 10.8%)
> Americans under 65, Tricare/military insurance (or many types): 0.3% (New York: 0.7%)
[recirclink id=919182]

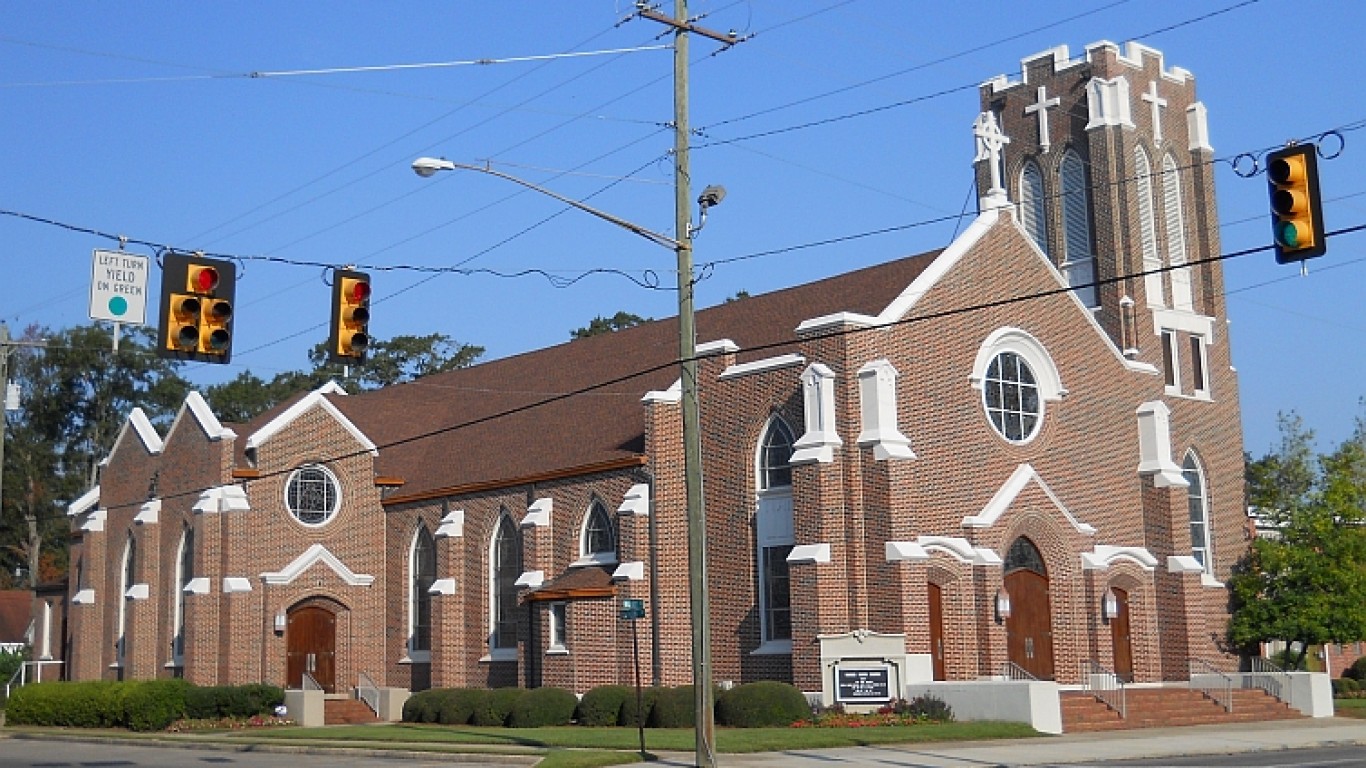
North Carolina: Hickory-Lenoir-Morganton
> Americans under 65, no health insurance: 16.6% (North Carolina: 13.4%)
> Americans under 65, Medicare coverage (or multiple types): 4.2% (North Carolina: 3.3%)
> Americans under 65, Medicaid coverage (or multiple types): 21.5% (North Carolina: 19.2%)
> Americans under 65, VA coverage (or multiple types): 1.6% (North Carolina: 1.7%)
> Americans under 65, employer-based insurance (or multiple types): 55.1% (North Carolina: 56.7%)
> Americans under 65, direct-purchase insurance (or multiple types): 9.0% (North Carolina: 10.7%)
> Americans under 65, Tricare/military insurance (or many types): 1.0% (North Carolina: 3.6%)

North Dakota: Fargo
> Americans under 65, no health insurance: 5.6% (North Dakota: 8.1%)
> Americans under 65, Medicare coverage (or multiple types): 1.8% (North Dakota: 2.0%)
> Americans under 65, Medicaid coverage (or multiple types): 14.2% (North Dakota: 12.4%)
> Americans under 65, VA coverage (or multiple types): 1.0% (North Dakota: 1.6%)
> Americans under 65, employer-based insurance (or multiple types): 73.5% (North Dakota: 68.3%)
> Americans under 65, direct-purchase insurance (or multiple types): 10.2% (North Dakota: 13.6%)
> Americans under 65, Tricare/military insurance (or many types): 2.7% (North Dakota: 3.5%)
[in-text-ad-2]

Ohio: Mansfield
> Americans under 65, no health insurance: 9.0% (Ohio: 7.8%)
> Americans under 65, Medicare coverage (or multiple types): 4.0% (Ohio: 3.1%)
> Americans under 65, Medicaid coverage (or multiple types): 26.8% (Ohio: 22.2%)
> Americans under 65, VA coverage (or multiple types): 2.0% (Ohio: 1.2%)
> Americans under 65, employer-based insurance (or multiple types): 59.9% (Ohio: 64.4%)
> Americans under 65, direct-purchase insurance (or multiple types): 8.1% (Ohio: 7.3%)
> Americans under 65, Tricare/military insurance (or many types): 1.8% (Ohio: 1.3%)

Oklahoma: Enid
> Americans under 65, no health insurance: 16.4% (Oklahoma: 16.8%)
> Americans under 65, Medicare coverage (or multiple types): 2.4% (Oklahoma: 4.0%)
> Americans under 65, Medicaid coverage (or multiple types): 15.0% (Oklahoma: 18.7%)
> Americans under 65, VA coverage (or multiple types): 0.9% (Oklahoma: 1.9%)
> Americans under 65, employer-based insurance (or multiple types): 57.8% (Oklahoma: 54.8%)
> Americans under 65, direct-purchase insurance (or multiple types): 8.7% (Oklahoma: 9.3%)
> Americans under 65, Tricare/military insurance (or many types): 5.3% (Oklahoma: 3.4%)
[in-text-ad]

Oregon: Grants Pass
> Americans under 65, no health insurance: 16.6% (Oregon: 8.6%)
> Americans under 65, Medicare coverage (or multiple types): 3.9% (Oregon: 2.7%)
> Americans under 65, Medicaid coverage (or multiple types): 44.5% (Oregon: 23.0%)
> Americans under 65, VA coverage (or multiple types): 1.9% (Oregon: 1.5%)
> Americans under 65, employer-based insurance (or multiple types): 30.9% (Oregon: 61.4%)
> Americans under 65, direct-purchase insurance (or multiple types): 8.0% (Oregon: 9.4%)
> Americans under 65, Tricare/military insurance (or many types): 1.5% (Oregon: 1.4%)
[recirclink id=924822]

Pennsylvania: Lancaster
> Americans under 65, no health insurance: 13.3% (Pennsylvania: 7.0%)
> Americans under 65, Medicare coverage (or multiple types): 2.9% (Pennsylvania: 3.3%)
> Americans under 65, Medicaid coverage (or multiple types): 17.4% (Pennsylvania: 22.0%)
> Americans under 65, VA coverage (or multiple types): 0.7% (Pennsylvania: 1.0%)
> Americans under 65, employer-based insurance (or multiple types): 63.4% (Pennsylvania: 65.1%)
> Americans under 65, direct-purchase insurance (or multiple types): 9.4% (Pennsylvania: 9.2%)
> Americans under 65, Tricare/military insurance (or many types): 1.3% (Pennsylvania: 1.1%)

Rhode Island: Providence-Warwick*
> Americans under 65, no health insurance: 4.4% (Rhode Island: 4.8%)
> Americans under 65, Medicare coverage (or multiple types): 3.9% (Rhode Island: 3.9%)
> Americans under 65, Medicaid coverage (or multiple types): 24.6% (Rhode Island: 21.6%)
> Americans under 65, VA coverage (or multiple types): 0.7% (Rhode Island: 0.7%)
> Americans under 65, employer-based insurance (or multiple types): 65.4% (Rhode Island: 66.8%)
> Americans under 65, direct-purchase insurance (or multiple types): 11.0% (Rhode Island: 11.7%)
> Americans under 65, Tricare/military insurance (or many types): 1.1% (Rhode Island: 1.3%)
*Because Providence-Warwick is the only eligible metro in Rhode Island, it is the metro with the worst health insurance coverage by default.
[in-text-ad-2]

South Carolina: Myrtle Beach-Conway-North Myrtle Beach
> Americans under 65, no health insurance: 18.2% (South Carolina: 13.2%)
> Americans under 65, Medicare coverage (or multiple types): 4.3% (South Carolina: 3.7%)
> Americans under 65, Medicaid coverage (or multiple types): 20.4% (South Carolina: 20.2%)
> Americans under 65, VA coverage (or multiple types): 2.6% (South Carolina: 1.8%)
> Americans under 65, employer-based insurance (or multiple types): 48.5% (South Carolina: 57.0%)
> Americans under 65, direct-purchase insurance (or multiple types): 13.0% (South Carolina: 10.1%)
> Americans under 65, Tricare/military insurance (or many types): 2.8% (South Carolina: 3.7%)

South Dakota: Rapid City
> Americans under 65, no health insurance: 12.8% (South Dakota: 12.2%)
> Americans under 65, Medicare coverage (or multiple types): 3.4% (South Dakota: 2.9%)
> Americans under 65, Medicaid coverage (or multiple types): 14.7% (South Dakota: 14.2%)
> Americans under 65, VA coverage (or multiple types): 3.9% (South Dakota: 1.8%)
> Americans under 65, employer-based insurance (or multiple types): 59.5% (South Dakota: 61.8%)
> Americans under 65, direct-purchase insurance (or multiple types): 12.2% (South Dakota: 12.8%)
> Americans under 65, Tricare/military insurance (or many types): 6.5% (South Dakota: 2.9%)
[in-text-ad]

Tennessee: Morristown
> Americans under 65, no health insurance: 15.3% (Tennessee: 12.1%)
> Americans under 65, Medicare coverage (or multiple types): 5.9% (Tennessee: 3.4%)
> Americans under 65, Medicaid coverage (or multiple types): 28.0% (Tennessee: 21.0%)
> Americans under 65, VA coverage (or multiple types): 1.6% (Tennessee: 1.6%)
> Americans under 65, employer-based insurance (or multiple types): 47.8% (Tennessee: 58.4%)
> Americans under 65, direct-purchase insurance (or multiple types): 7.5% (Tennessee: 9.6%)
> Americans under 65, Tricare/military insurance (or many types): 1.2% (Tennessee: 2.9%)
[recirclink id=928130]
Texas: McAllen-Edinburg-Mission
> Americans under 65, no health insurance: 35.7% (Texas: 20.8%)
> Americans under 65, Medicare coverage (or multiple types): 3.1% (Texas: 2.3%)
> Americans under 65, Medicaid coverage (or multiple types): 27.0% (Texas: 16.2%)
> Americans under 65, VA coverage (or multiple types): 0.6% (Texas: 1.4%)
> Americans under 65, employer-based insurance (or multiple types): 30.8% (Texas: 54.8%)
> Americans under 65, direct-purchase insurance (or multiple types): 6.5% (Texas: 8.6%)
> Americans under 65, Tricare/military insurance (or many types): 0.8% (Texas: 2.3%)
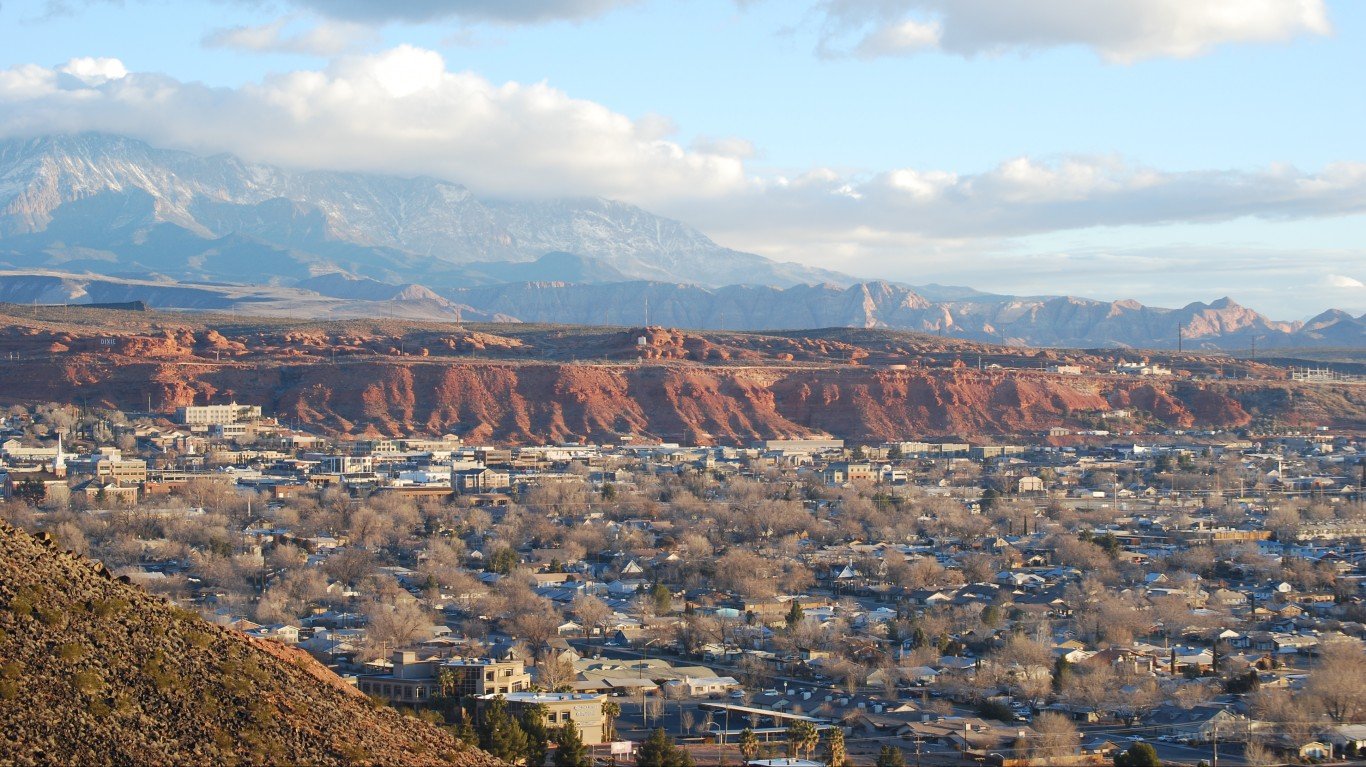
Utah: St. George
> Americans under 65, no health insurance: 18.4% (Utah: 10.8%)
> Americans under 65, Medicare coverage (or multiple types): 2.0% (Utah: 1.5%)
> Americans under 65, Medicaid coverage (or multiple types): 11.0% (Utah: 9.8%)
> Americans under 65, VA coverage (or multiple types): 1.1% (Utah: 0.8%)
> Americans under 65, employer-based insurance (or multiple types): 56.6% (Utah: 68.8%)
> Americans under 65, direct-purchase insurance (or multiple types): 15.9% (Utah: 12.5%)
> Americans under 65, Tricare/military insurance (or many types): 1.3% (Utah: 1.9%)
[in-text-ad-2]

Vermont: Burlington-South Burlington*
> Americans under 65, no health insurance: 4.3% (Vermont: 5.6%)
> Americans under 65, Medicare coverage (or multiple types): 2.6% (Vermont: 4.1%)
> Americans under 65, Medicaid coverage (or multiple types): 21.5% (Vermont: 25.8%)
> Americans under 65, VA coverage (or multiple types): 0.9% (Vermont: 1.1%)
> Americans under 65, employer-based insurance (or multiple types): 66.9% (Vermont: 60.6%)
> Americans under 65, direct-purchase insurance (or multiple types): 10.0% (Vermont: 10.3%)
> Americans under 65, Tricare/military insurance (or many types): 1.5% (Vermont: 1.6%)
*Because Burlington-South Burlington is the only eligible metro in Vermont, it is the metro with the worst health insurance coverage by default.

Virginia: Harrisonburg
> Americans under 65, no health insurance: 10.3% (Virginia: 9.3%)
> Americans under 65, Medicare coverage (or multiple types): 2.5% (Virginia: 2.8%)
> Americans under 65, Medicaid coverage (or multiple types): 17.0% (Virginia: 14.5%)
> Americans under 65, VA coverage (or multiple types): 1.7% (Virginia: 2.3%)
> Americans under 65, employer-based insurance (or multiple types): 62.0% (Virginia: 64.4%)
> Americans under 65, direct-purchase insurance (or multiple types): 13.7% (Virginia: 9.3%)
> Americans under 65, Tricare/military insurance (or many types): 1.5% (Virginia: 6.9%)
[in-text-ad]

Washington: Yakima
> Americans under 65, no health insurance: 15.8% (Washington: 7.7%)
> Americans under 65, Medicare coverage (or multiple types): 3.3% (Washington: 2.4%)
> Americans under 65, Medicaid coverage (or multiple types): 36.3% (Washington: 21.4%)
> Americans under 65, VA coverage (or multiple types): 0.9% (Washington: 1.5%)
> Americans under 65, employer-based insurance (or multiple types): 42.9% (Washington: 63.7%)
> Americans under 65, direct-purchase insurance (or multiple types): 5.9% (Washington: 8.3%)
> Americans under 65, Tricare/military insurance (or many types): 0.5% (Washington: 3.4%)
[recirclink id=931001]

West Virginia: Weirton-Steubenville
> Americans under 65, no health insurance: 11.0% (West Virginia: 8.3%)
> Americans under 65, Medicare coverage (or multiple types): 3.8% (West Virginia: 5.5%)
> Americans under 65, Medicaid coverage (or multiple types): 25.8% (West Virginia: 30.0%)
> Americans under 65, VA coverage (or multiple types): 1.7% (West Virginia: 2.2%)
> Americans under 65, employer-based insurance (or multiple types): 57.3% (West Virginia: 57.4%)
> Americans under 65, direct-purchase insurance (or multiple types): 6.1% (West Virginia: 5.7%)
> Americans under 65, Tricare/military insurance (or many types): 2.0% (West Virginia: 1.8%)
Wisconsin: Eau Claire
> Americans under 65, no health insurance: 8.8% (Wisconsin: 6.8%)
> Americans under 65, Medicare coverage (or multiple types): 2.7% (Wisconsin: 2.7%)
> Americans under 65, Medicaid coverage (or multiple types): 18.1% (Wisconsin: 17.6%)
> Americans under 65, VA coverage (or multiple types): 1.5% (Wisconsin: 1.1%)
> Americans under 65, employer-based insurance (or multiple types): 64.5% (Wisconsin: 69.5%)
> Americans under 65, direct-purchase insurance (or multiple types): 10.8% (Wisconsin: 8.8%)
> Americans under 65, Tricare/military insurance (or many types): 2.1% (Wisconsin: 1.0%)
[in-text-ad-2]
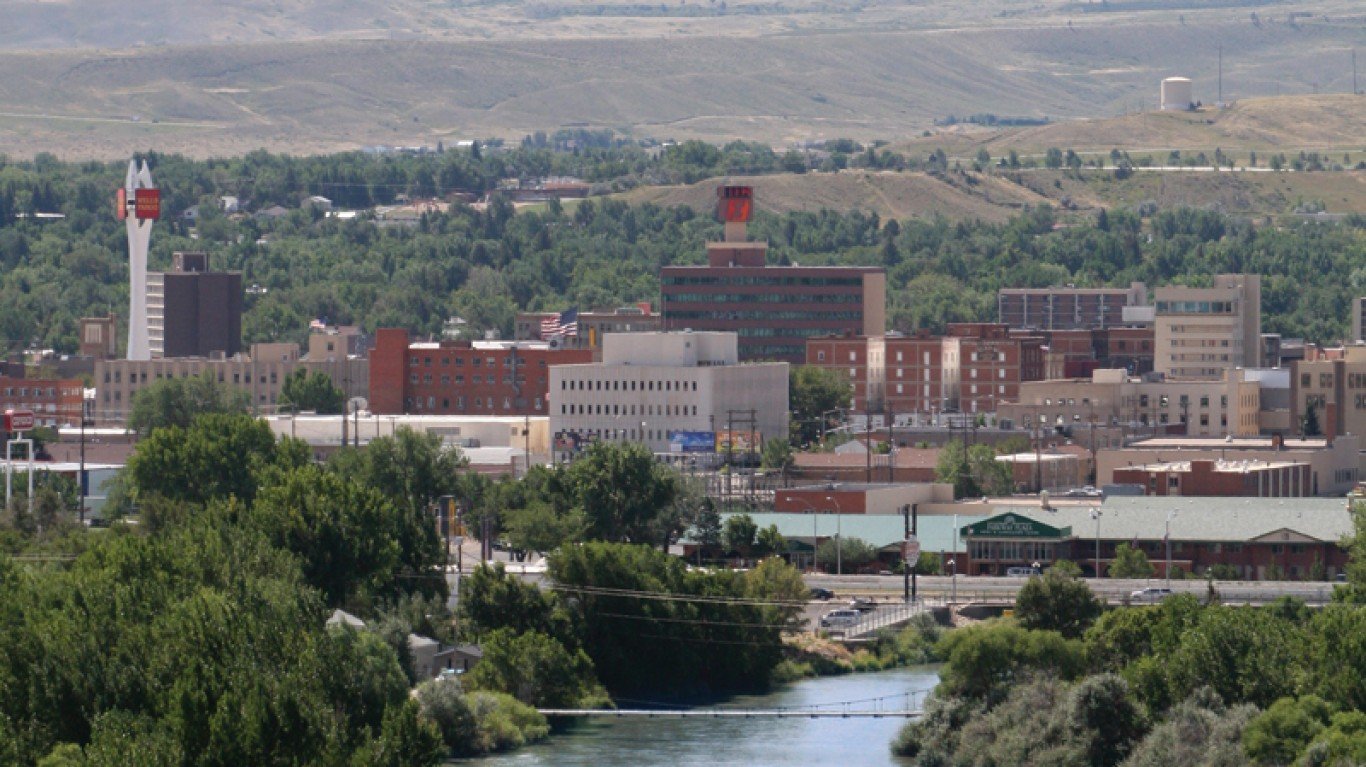
Wyoming: Casper
> Americans under 65, no health insurance: 14.5% (Wyoming: 14.8%)
> Americans under 65, Medicare coverage (or multiple types): 2.3% (Wyoming: 2.4%)
> Americans under 65, Medicaid coverage (or multiple types): 15.5% (Wyoming: 12.3%)
> Americans under 65, VA coverage (or multiple types): 1.4% (Wyoming: 1.7%)
> Americans under 65, employer-based insurance (or multiple types): 64.3% (Wyoming: 62.6%)
> Americans under 65, direct-purchase insurance (or multiple types): 7.1% (Wyoming: 10.8%)
> Americans under 65, Tricare/military insurance (or many types): 0.7% (Wyoming: 2.8%)
Methodology
To determine the metro with the worst health insurance coverage in every state, 24/7 Wall St. reviewed one-year estimates of the percentage of the noninstitutionalized civilian population under 65 without health insurance from the U.S. Census Bureau’s 2019 American Community Survey.
We used the 384 metropolitan statistical areas as delineated by the United States Office of Management and Budget and used by the Census Bureau as our definition of metros.
We selected the under 65 age group because Americans become eligible for Medicare at age 65, and the uninsured rate for the population above this age is less than 1% nationwide. However, because the Census doesn’t publish insurance coverage estimates specifically for the under 65 age group, we aggregated the data from more granular age breakouts.
Each metro was ranked within its state by its under 65 uninsured rate. Since many metros cross state lines, the metro was assigned to the state of its first-listed principal city. Thus, the Washington-Arlington-Alexandria, DC-VA-MD-WV metro area was excluded as it is principally in the District of Columbia.
The share of the population covered by each type of insurance — Medicare, Medicaid, VA, employer, direct-purchase, and Tricare/military — are for the same cohort and are also aggregated from one-year ACS estimates. The estimates reflect people who are covered by that type of insurance alone or in combination with other types on the list. So, when a person is covered by more than one type of insurance, they are included in each group.
Contact [email protected] for any questions or corrections.