
The United States is the only industrialized country in the world without universal health care. As a result, most Americans under age 65 receive employer-based health insurance coverage. Under this system, an estimated 28.9 million Americans under 65 were uninsured in 2019 — before the COVID-19 pandemic put over 22 million Americans out of work.
While most of those jobs have since been restored, the official uninsured rate for Americans under 65 in 2020 will likely be higher than the 10.3% rate in 2019 — a continuation of the three-year trend of declining insurance coverage that began in 2017. Still, there are parts of the country where nearly every American under 65 is insured, either through their employer, Medicaid, or directly-purchased coverage.
Using data from the U.S. Census Bureau, 24/7 Wall St. identified the town in every state with the best health insurance coverage. We included cities, towns, villages, and unincorporated communities with populations between 1,000 and 25,000 in our analysis.
The highest uninsured rate among the towns on this list is just 5.2% — about half the comparable national rate. In over a dozen towns on this list, the uninsured rate is effectively zero.
Click here to see the town with the worst health insurance coverage in every state
Click here to read our detailed methodology
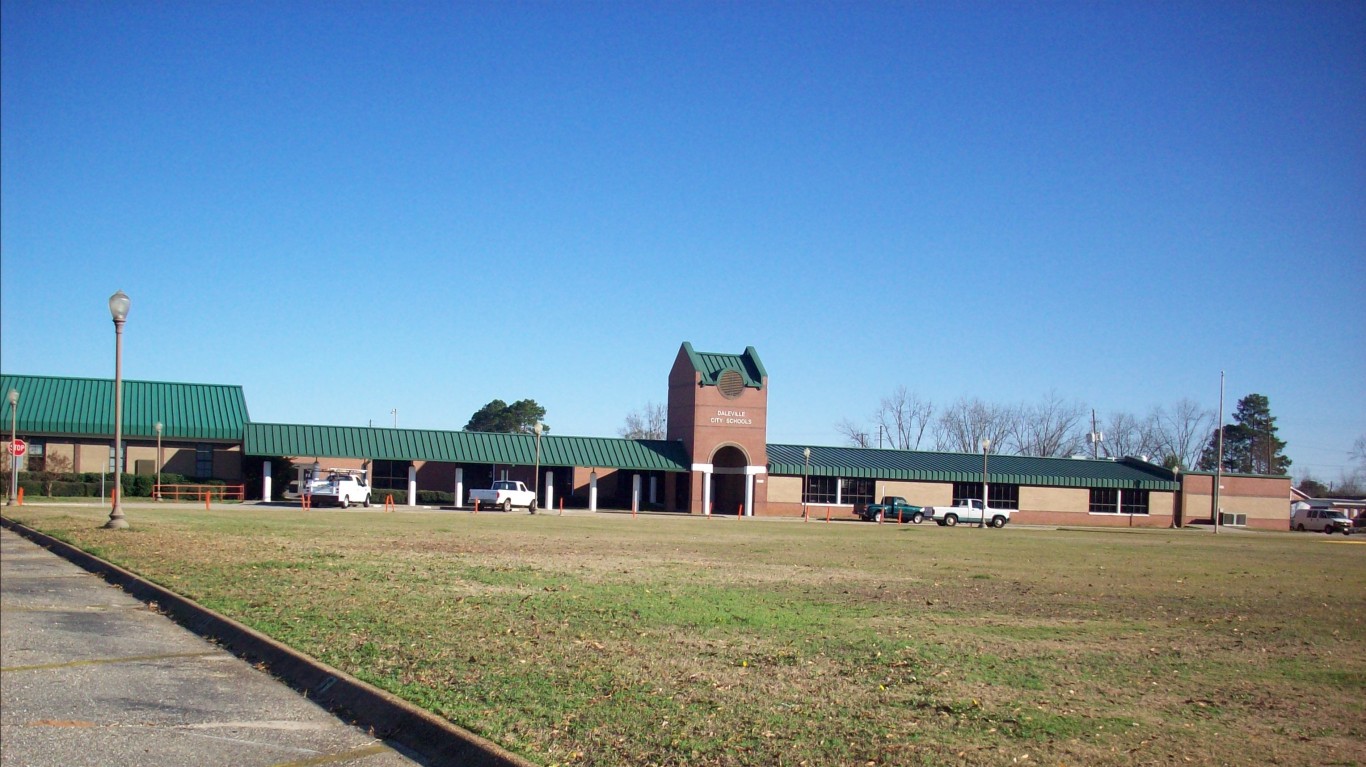
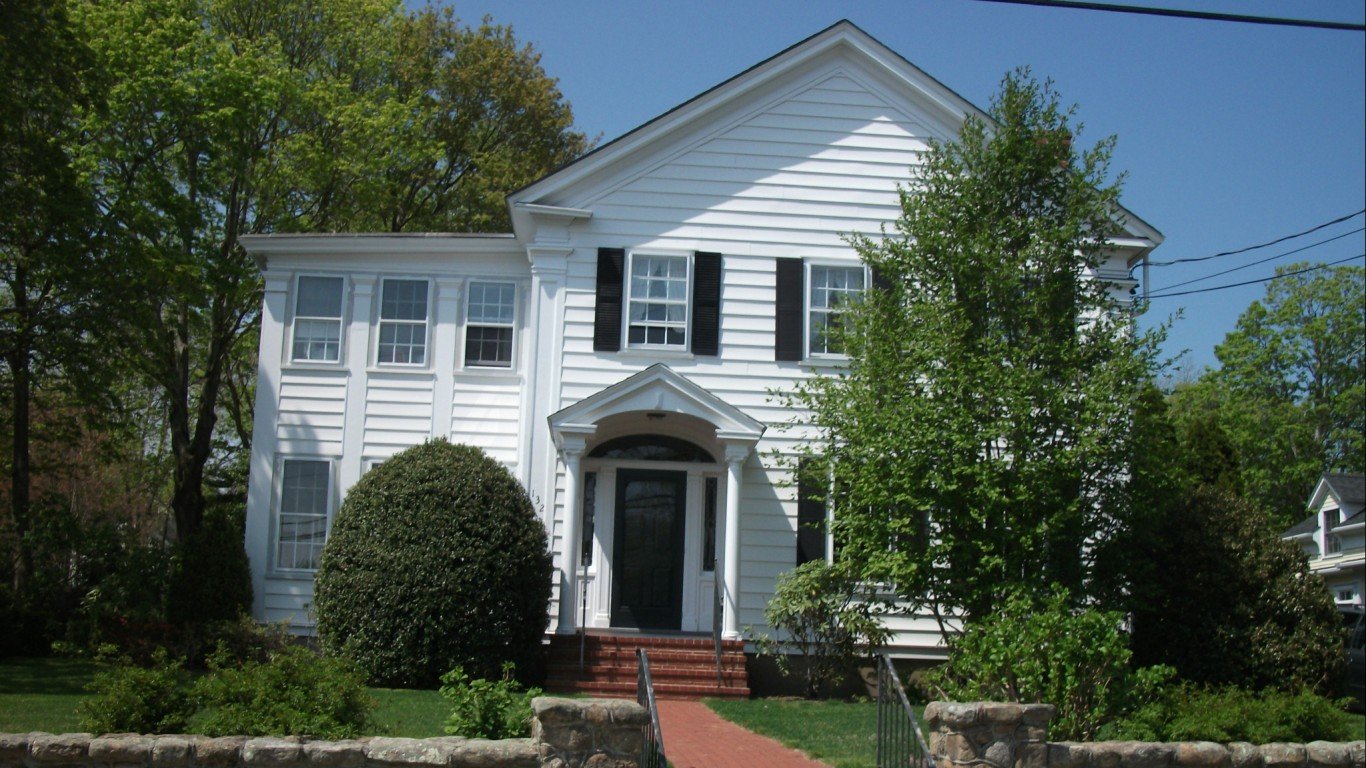
Alabama: Daleville
> Americans under 65, no health insurance: 31.3% (Alabama: 11.3%)
> Americans under 65, Medicare coverage (or multiple types): 9.2% (Alabama: 4.9%)
> Americans under 65, Medicaid coverage (or multiple types): 26.6% (Alabama: 20.9%)
> Americans under 65, VA coverage (or multiple types): 3.3% (Alabama: 1.7%)
> Americans under 65, employer-based insurance (or multiple types): 29.5% (Alabama: 57.8%)
> Americans under 65, direct-purchase insurance (or multiple types): 5.2% (Alabama: 10.5%)
> Americans under 65, Tricare/military insurance (or many types): 14.4% (Alabama: 3.3%)
[in-text-ad]
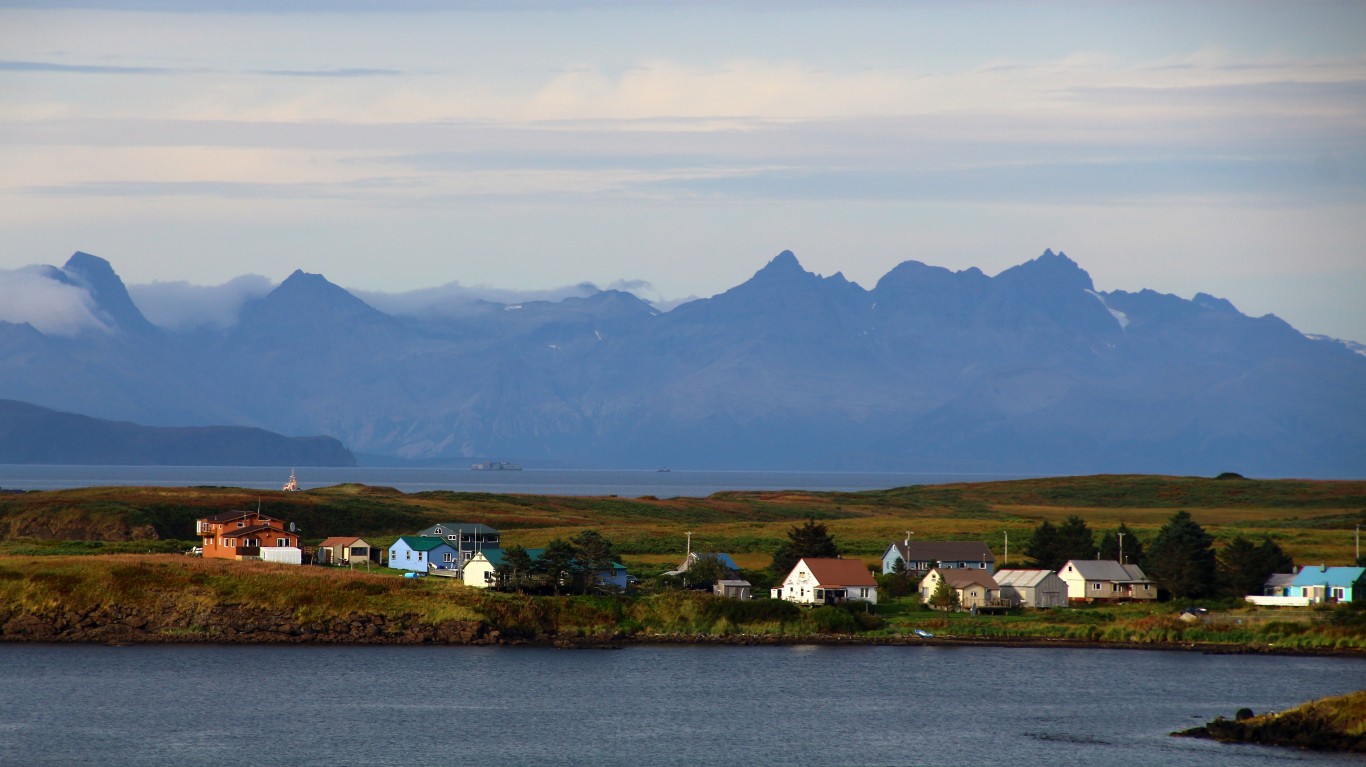
Alaska: Sand Point
> Americans under 65, no health insurance: 55.4% (Alaska: 15.3%)
> Americans under 65, Medicare coverage (or multiple types): 0.9% (Alaska: 1.9%)
> Americans under 65, Medicaid coverage (or multiple types): 14.6% (Alaska: 21.1%)
> Americans under 65, VA coverage (or multiple types): 0.8% (Alaska: 3.0%)
> Americans under 65, employer-based insurance (or multiple types): 25.9% (Alaska: 54.4%)
> Americans under 65, direct-purchase insurance (or multiple types): 3.6% (Alaska: 6.9%)
> Americans under 65, Tricare/military insurance (or many types): 0.8% (Alaska: 9.6%)
[recirclink id=887931]

Arizona: Arivaca Junction
> Americans under 65, no health insurance: 59.5% (Arizona: 12.4%)
> Americans under 65, Medicare coverage (or multiple types): 0.7% (Arizona: 2.6%)
> Americans under 65, Medicaid coverage (or multiple types): 21.9% (Arizona: 24.1%)
> Americans under 65, VA coverage (or multiple types): 0.0% reported (Arizona: 1.5%)
> Americans under 65, employer-based insurance (or multiple types): 8.6% (Arizona: 55.1%)
> Americans under 65, direct-purchase insurance (or multiple types): 9.3% (Arizona: 9.7%)
> Americans under 65, Tricare/military insurance (or many types): 0.0% reported (Arizona: 2.4%)

Arkansas: Eureka Springs
> Americans under 65, no health insurance: 27.4% (Arkansas: 10.1%)
> Americans under 65, Medicare coverage (or multiple types): 7.5% (Arkansas: 5.1%)
> Americans under 65, Medicaid coverage (or multiple types): 32.5% (Arkansas: 28.6%)
> Americans under 65, VA coverage (or multiple types): 3.1% (Arkansas: 1.8%)
> Americans under 65, employer-based insurance (or multiple types): 30.0% (Arkansas: 51.8%)
> Americans under 65, direct-purchase insurance (or multiple types): 7.9% (Arkansas: 10.2%)
> Americans under 65, Tricare/military insurance (or many types): 1.5% (Arkansas: 2.3%)
[in-text-ad-2]

California: Mammoth Lakes
> Americans under 65, no health insurance: 24.1% (California: 8.6%)
> Americans under 65, Medicare coverage (or multiple types): 1.0% (California: 2.2%)
> Americans under 65, Medicaid coverage (or multiple types): 18.5% (California: 27.1%)
> Americans under 65, VA coverage (or multiple types): 1.4% (California: 0.9%)
> Americans under 65, employer-based insurance (or multiple types): 44.7% (California: 55.7%)
> Americans under 65, direct-purchase insurance (or multiple types): 12.4% (California: 10.9%)
> Americans under 65, Tricare/military insurance (or many types): 1.7% (California: 1.4%)
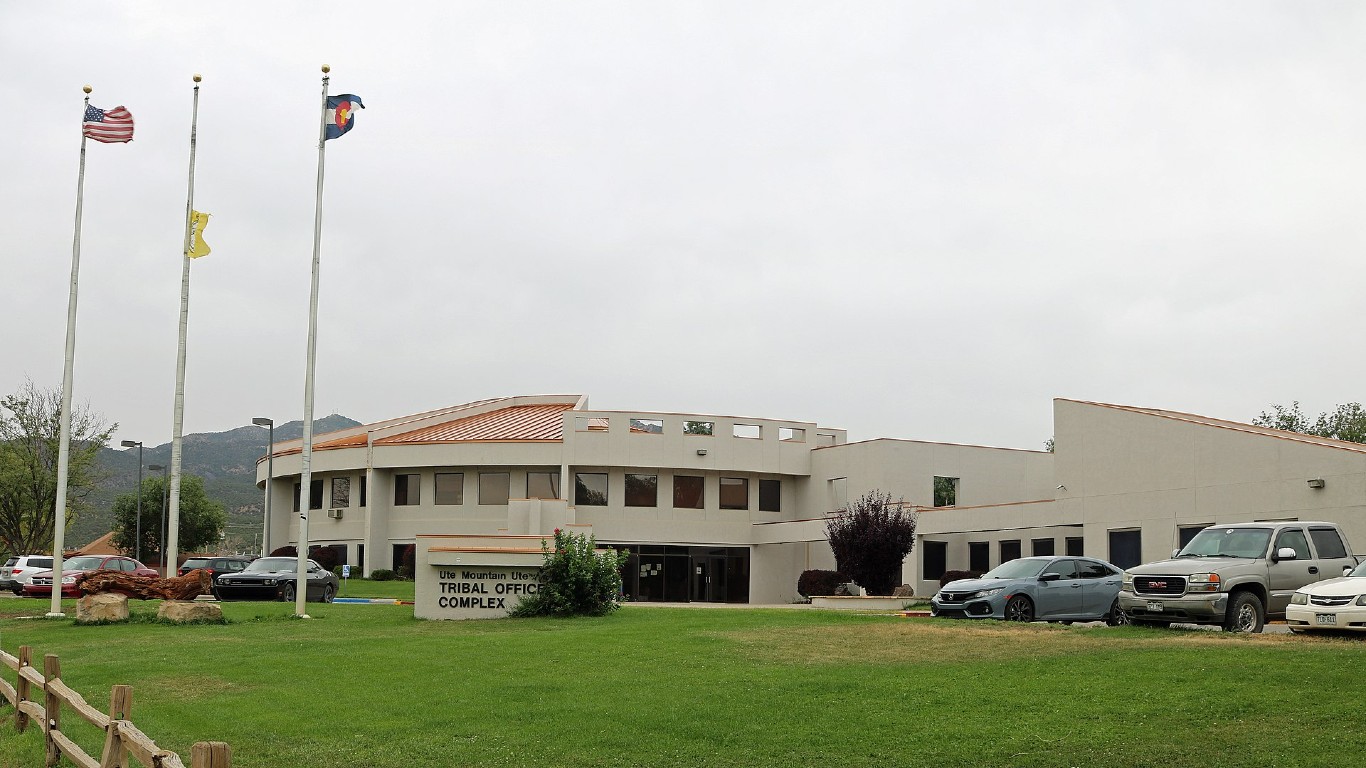
Colorado: Towaoc
> Americans under 65, no health insurance: 31.6% (Colorado: 8.7%)
> Americans under 65, Medicare coverage (or multiple types): 4.5% (Colorado: 2.1%)
> Americans under 65, Medicaid coverage (or multiple types): 44.5% (Colorado: 19.8%)
> Americans under 65, VA coverage (or multiple types): 0.0% reported (Colorado: 1.5%)
> Americans under 65, employer-based insurance (or multiple types): 22.1% (Colorado: 60.5%)
> Americans under 65, direct-purchase insurance (or multiple types): 0.5% (Colorado: 11.4%)
> Americans under 65, Tricare/military insurance (or many types): 0.0% reported (Colorado: 3.5%)
[in-text-ad]

Connecticut: Byram
> Americans under 65, no health insurance: 19.9% (Connecticut: 6.3%)
> Americans under 65, Medicare coverage (or multiple types): 1.0% (Connecticut: 2.4%)
> Americans under 65, Medicaid coverage (or multiple types): 22.1% (Connecticut: 21.6%)
> Americans under 65, VA coverage (or multiple types): 0.0% reported (Connecticut: 0.7%)
> Americans under 65, employer-based insurance (or multiple types): 49.5% (Connecticut: 65.1%)
> Americans under 65, direct-purchase insurance (or multiple types): 9.8% (Connecticut: 9.4%)
> Americans under 65, Tricare/military insurance (or many types): 0.0% reported (Connecticut: 1.0%)
[recirclink id=931632]

Delaware: Georgetown
> Americans under 65, no health insurance: 22.8% (Delaware: 6.8%)
> Americans under 65, Medicare coverage (or multiple types): 3.7% (Delaware: 3.3%)
> Americans under 65, Medicaid coverage (or multiple types): 42.8% (Delaware: 22.5%)
> Americans under 65, VA coverage (or multiple types): 0.3% (Delaware: 1.0%)
> Americans under 65, employer-based insurance (or multiple types): 32.5% (Delaware: 64.4%)
> Americans under 65, direct-purchase insurance (or multiple types): 1.6% (Delaware: 8.6%)
> Americans under 65, Tricare/military insurance (or many types): 0.1% (Delaware: 2.6%)
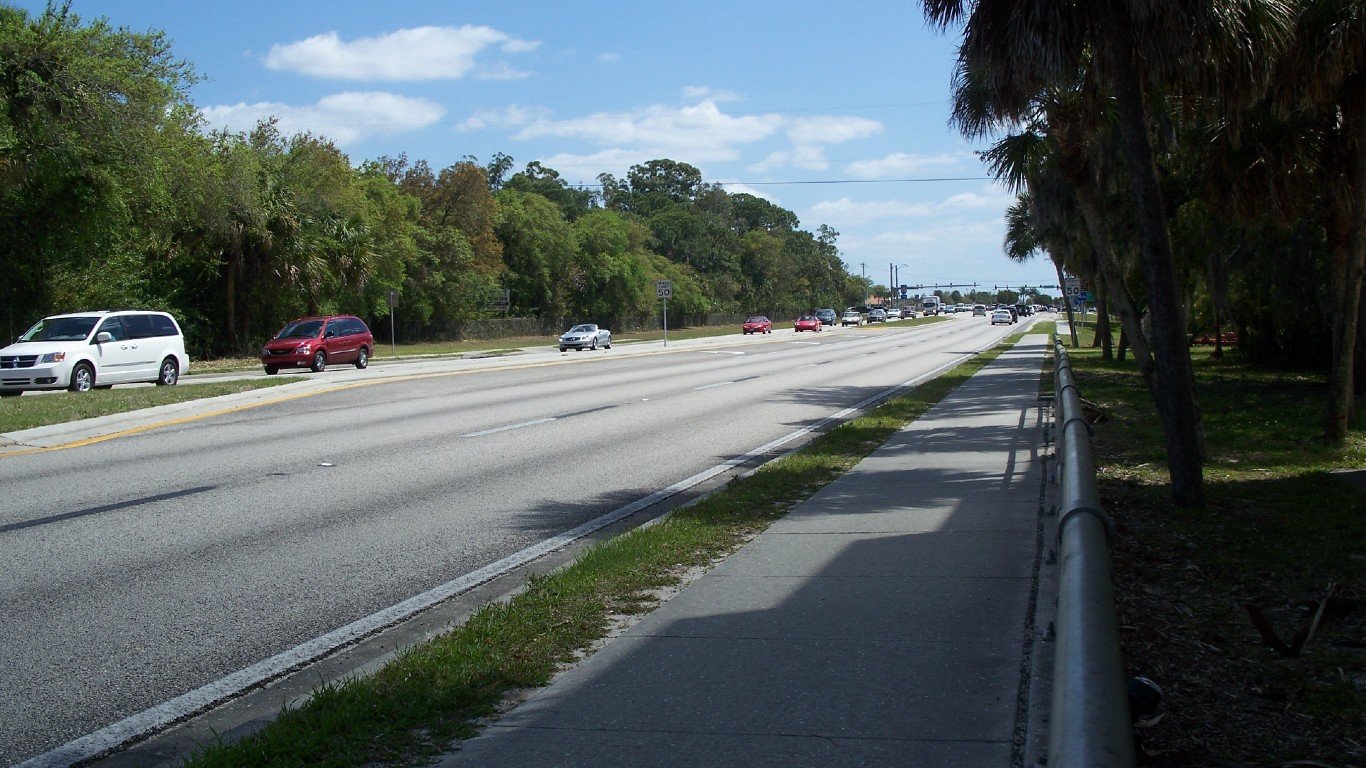
Florida: Suncoast Estates
> Americans under 65, no health insurance: 46.4% (Florida: 15.7%)
> Americans under 65, Medicare coverage (or multiple types): 4.7% (Florida: 3.1%)
> Americans under 65, Medicaid coverage (or multiple types): 34.8% (Florida: 19.2%)
> Americans under 65, VA coverage (or multiple types): 1.3% (Florida: 1.6%)
> Americans under 65, employer-based insurance (or multiple types): 16.8% (Florida: 50.6%)
> Americans under 65, direct-purchase insurance (or multiple types): 4.5% (Florida: 14.5%)
> Americans under 65, Tricare/military insurance (or many types): 1.5% (Florida: 2.7%)
[in-text-ad-2]
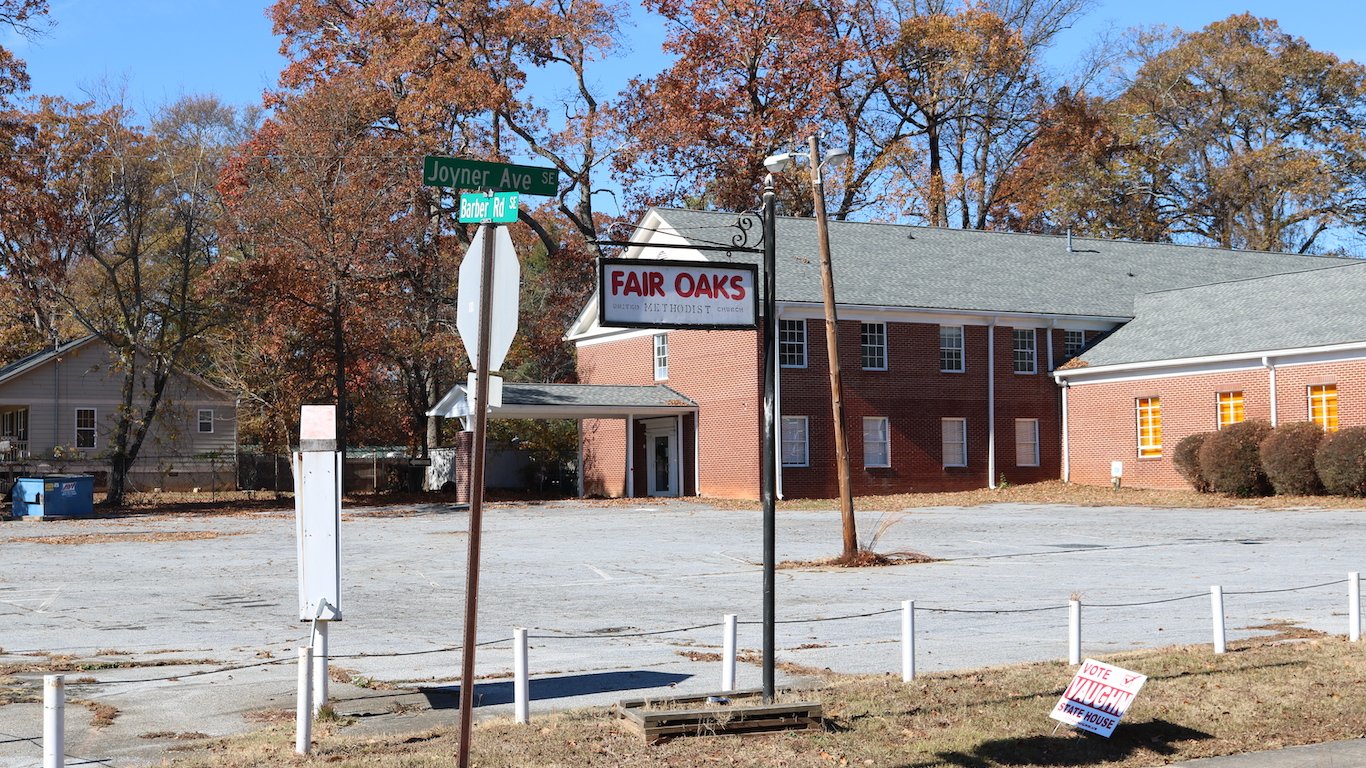
Georgia: Fair Oaks
> Americans under 65, no health insurance: 46.9% (Georgia: 15.2%)
> Americans under 65, Medicare coverage (or multiple types): 6.0% (Georgia: 3.0%)
> Americans under 65, Medicaid coverage (or multiple types): 22.1% (Georgia: 17.9%)
> Americans under 65, VA coverage (or multiple types): 0.2% (Georgia: 1.5%)
> Americans under 65, employer-based insurance (or multiple types): 21.5% (Georgia: 56.9%)
> Americans under 65, direct-purchase insurance (or multiple types): 5.1% (Georgia: 10.2%)
> Americans under 65, Tricare/military insurance (or many types): 1.8% (Georgia: 3.4%)

Hawaii: Honaunau-Napoopoo
> Americans under 65, no health insurance: 12.6% (Hawaii: 4.6%)
> Americans under 65, Medicare coverage (or multiple types): 0.7% (Hawaii: 1.8%)
> Americans under 65, Medicaid coverage (or multiple types): 26.0% (Hawaii: 19.0%)
> Americans under 65, VA coverage (or multiple types): 1.1% (Hawaii: 1.5%)
> Americans under 65, employer-based insurance (or multiple types): 51.8% (Hawaii: 66.3%)
> Americans under 65, direct-purchase insurance (or multiple types): 11.9% (Hawaii: 9.5%)
> Americans under 65, Tricare/military insurance (or many types): 0.0% reported (Hawaii: 8.8%)
[in-text-ad]

Idaho: Lapwai
> Americans under 65, no health insurance: 36.5% (Idaho: 12.4%)
> Americans under 65, Medicare coverage (or multiple types): 3.7% (Idaho: 2.8%)
> Americans under 65, Medicaid coverage (or multiple types): 25.4% (Idaho: 18.2%)
> Americans under 65, VA coverage (or multiple types): 0.3% (Idaho: 1.6%)
> Americans under 65, employer-based insurance (or multiple types): 38.0% (Idaho: 57.4%)
> Americans under 65, direct-purchase insurance (or multiple types): 4.9% (Idaho: 13.8%)
> Americans under 65, Tricare/military insurance (or many types): 0.0% reported (Idaho: 2.5%)
[recirclink id=924829]
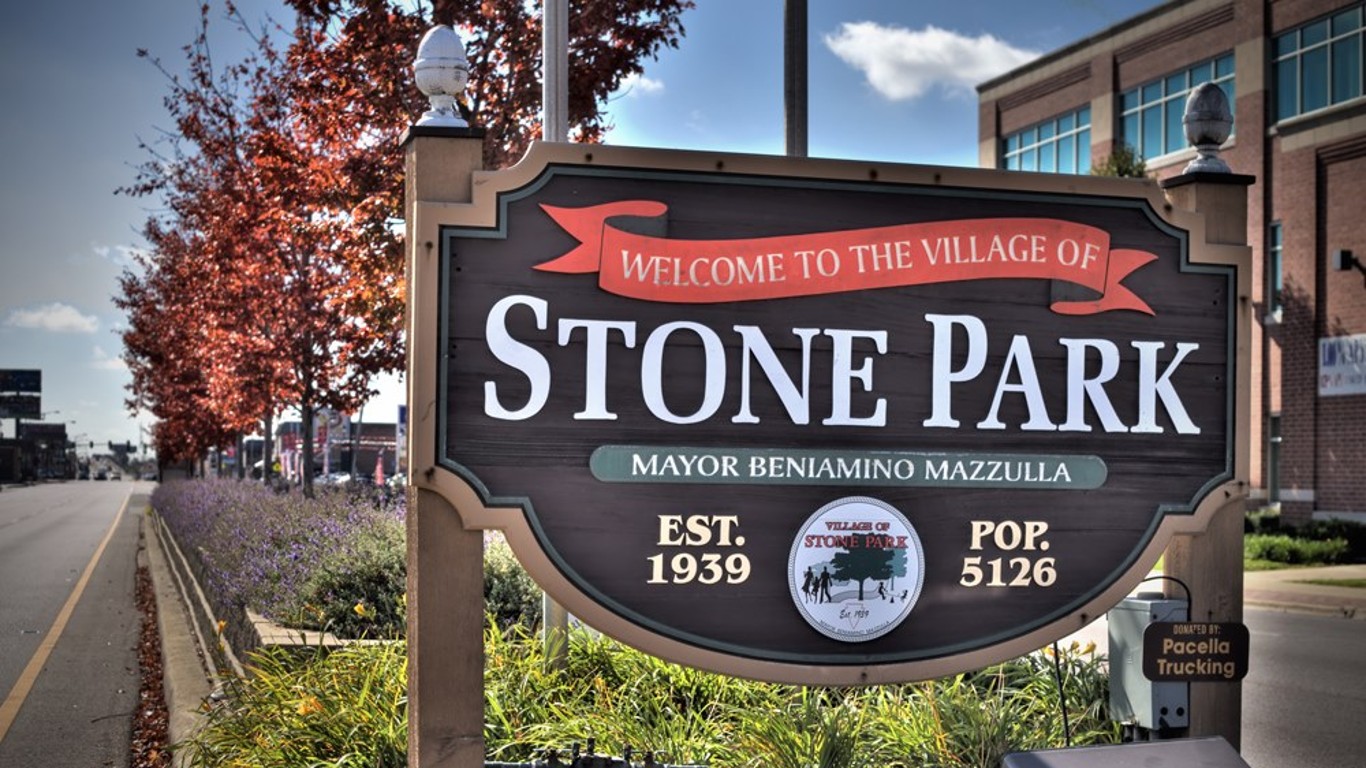
Illinois: Stone Park
> Americans under 65, no health insurance: 31.2% (Illinois: 7.9%)
> Americans under 65, Medicare coverage (or multiple types): 2.8% (Illinois: 2.4%)
> Americans under 65, Medicaid coverage (or multiple types): 36.6% (Illinois: 21.0%)
> Americans under 65, VA coverage (or multiple types): 0.0% reported (Illinois: 0.8%)
> Americans under 65, employer-based insurance (or multiple types): 28.3% (Illinois: 63.6%)
> Americans under 65, direct-purchase insurance (or multiple types): 3.7% (Illinois: 9.5%)
> Americans under 65, Tricare/military insurance (or many types): 0.2% (Illinois: 0.9%)
Indiana: Monon
> Americans under 65, no health insurance: 28.7% (Indiana: 9.8%)
> Americans under 65, Medicare coverage (or multiple types): 2.7% (Indiana: 3.2%)
> Americans under 65, Medicaid coverage (or multiple types): 24.9% (Indiana: 19.1%)
> Americans under 65, VA coverage (or multiple types): 0.4% (Indiana: 1.2%)
> Americans under 65, employer-based insurance (or multiple types): 45.0% (Indiana: 64.2%)
> Americans under 65, direct-purchase insurance (or multiple types): 4.8% (Indiana: 8.8%)
> Americans under 65, Tricare/military insurance (or many types): 0.0% reported (Indiana: 1.2%)
[in-text-ad-2]
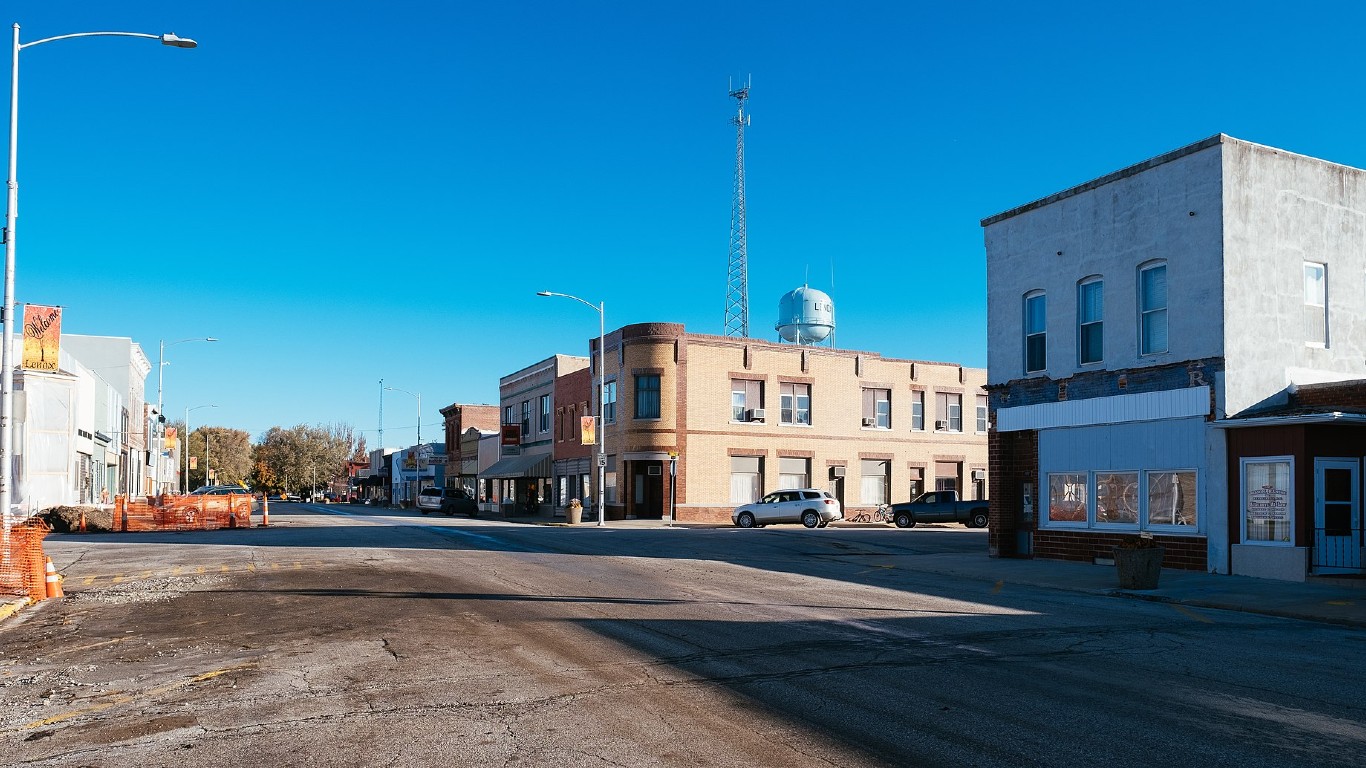
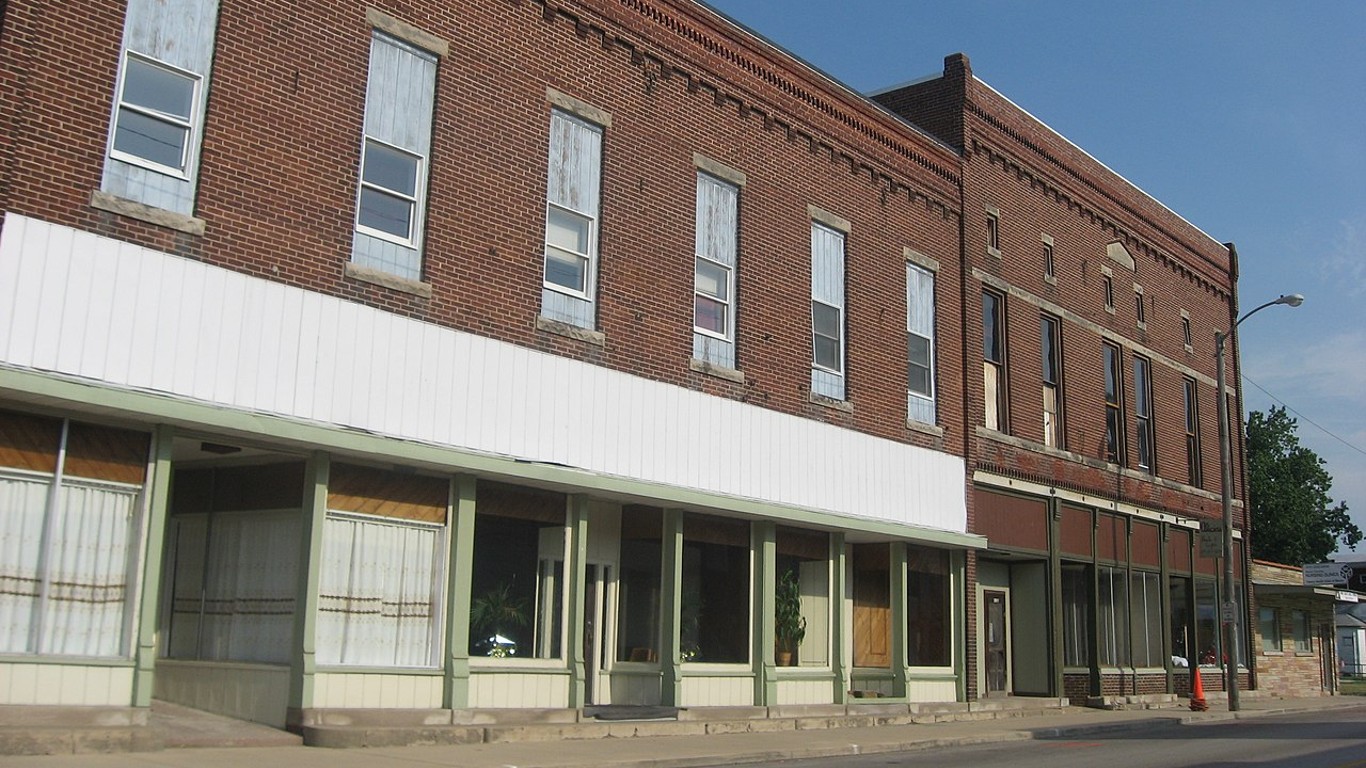
Iowa: Lenox
> Americans under 65, no health insurance: 26.1% (Iowa: 5.5%)
> Americans under 65, Medicare coverage (or multiple types): 2.5% (Iowa: 2.5%)
> Americans under 65, Medicaid coverage (or multiple types): 15.0% (Iowa: 20.4%)
> Americans under 65, VA coverage (or multiple types): 0.5% (Iowa: 1.1%)
> Americans under 65, employer-based insurance (or multiple types): 51.3% (Iowa: 67.4%)
> Americans under 65, direct-purchase insurance (or multiple types): 9.5% (Iowa: 10.6%)
> Americans under 65, Tricare/military insurance (or many types): 0.0% reported (Iowa: 1.3%)

Kansas: Elkhart
> Americans under 65, no health insurance: 23.6% (Kansas: 10.3%)
> Americans under 65, Medicare coverage (or multiple types): 3.7% (Kansas: 2.7%)
> Americans under 65, Medicaid coverage (or multiple types): 13.3% (Kansas: 14.5%)
> Americans under 65, VA coverage (or multiple types): 0.6% (Kansas: 1.4%)
> Americans under 65, employer-based insurance (or multiple types): 58.7% (Kansas: 65.2%)
> Americans under 65, direct-purchase insurance (or multiple types): 6.3% (Kansas: 11.4%)
> Americans under 65, Tricare/military insurance (or many types): 1.1% (Kansas: 3.4%)
[in-text-ad]
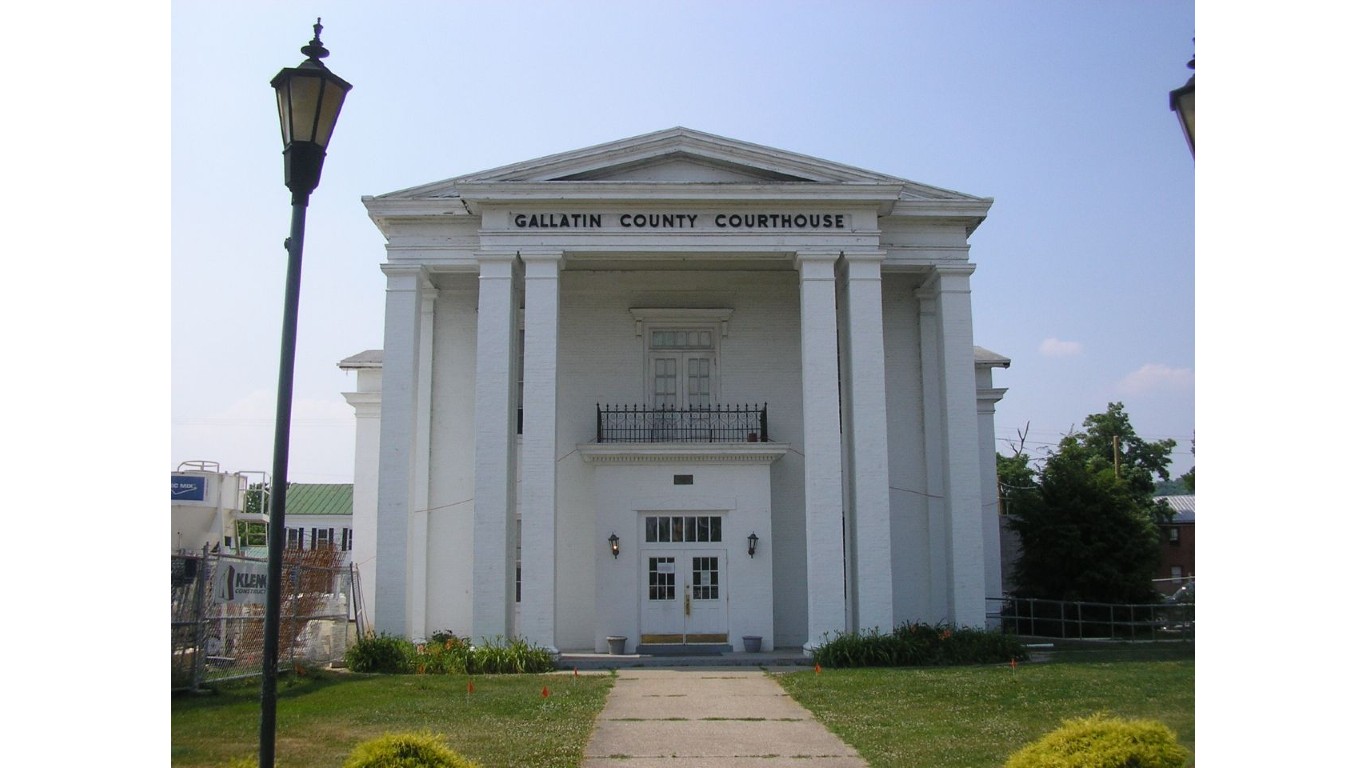
Kentucky: Warsaw
> Americans under 65, no health insurance: 28.2% (Kentucky: 6.7%)
> Americans under 65, Medicare coverage (or multiple types): 7.1% (Kentucky: 5.0%)
> Americans under 65, Medicaid coverage (or multiple types): 26.9% (Kentucky: 28.5%)
> Americans under 65, VA coverage (or multiple types): 1.3% (Kentucky: 1.5%)
> Americans under 65, employer-based insurance (or multiple types): 40.4% (Kentucky: 57.3%)
> Americans under 65, direct-purchase insurance (or multiple types): 2.1% (Kentucky: 8.2%)
> Americans under 65, Tricare/military insurance (or many types): 0.3% (Kentucky: 2.3%)
[recirclink id=927311]
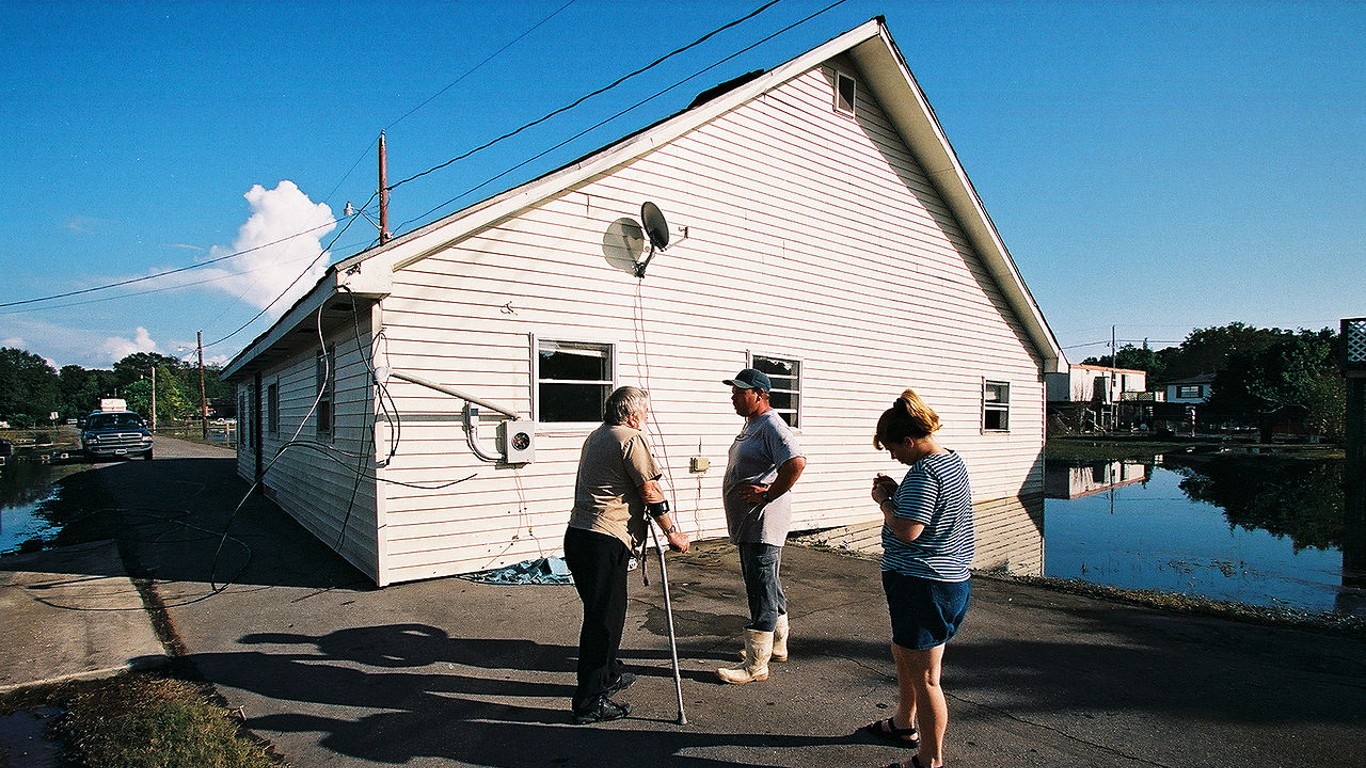
Louisiana: Montegut
> Americans under 65, no health insurance: 29.3% (Louisiana: 11.0%)
> Americans under 65, Medicare coverage (or multiple types): 9.5% (Louisiana: 4.0%)
> Americans under 65, Medicaid coverage (or multiple types): 26.8% (Louisiana: 28.4%)
> Americans under 65, VA coverage (or multiple types): 0.0% reported (Louisiana: 1.3%)
> Americans under 65, employer-based insurance (or multiple types): 36.2% (Louisiana: 52.3%)
> Americans under 65, direct-purchase insurance (or multiple types): 8.6% (Louisiana: 9.6%)
> Americans under 65, Tricare/military insurance (or many types): 1.8% (Louisiana: 2.2%)
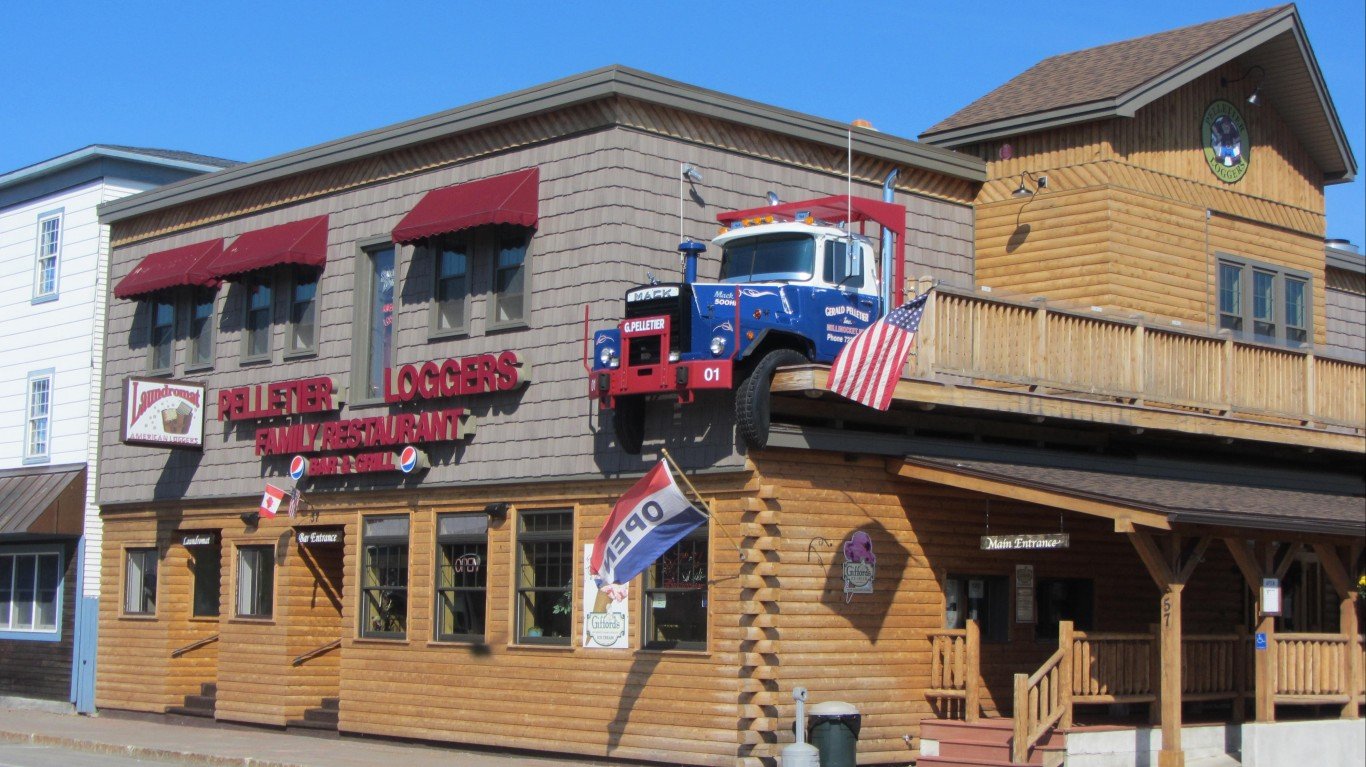
Maine: Millinocket
> Americans under 65, no health insurance: 20.2% (Maine: 9.8%)
> Americans under 65, Medicare coverage (or multiple types): 15.7% (Maine: 4.5%)
> Americans under 65, Medicaid coverage (or multiple types): 34.4% (Maine: 19.3%)
> Americans under 65, VA coverage (or multiple types): 4.5% (Maine: 1.8%)
> Americans under 65, employer-based insurance (or multiple types): 35.5% (Maine: 61.5%)
> Americans under 65, direct-purchase insurance (or multiple types): 13.9% (Maine: 11.0%)
> Americans under 65, Tricare/military insurance (or many types): 1.4% (Maine: 2.3%)
[in-text-ad-2]
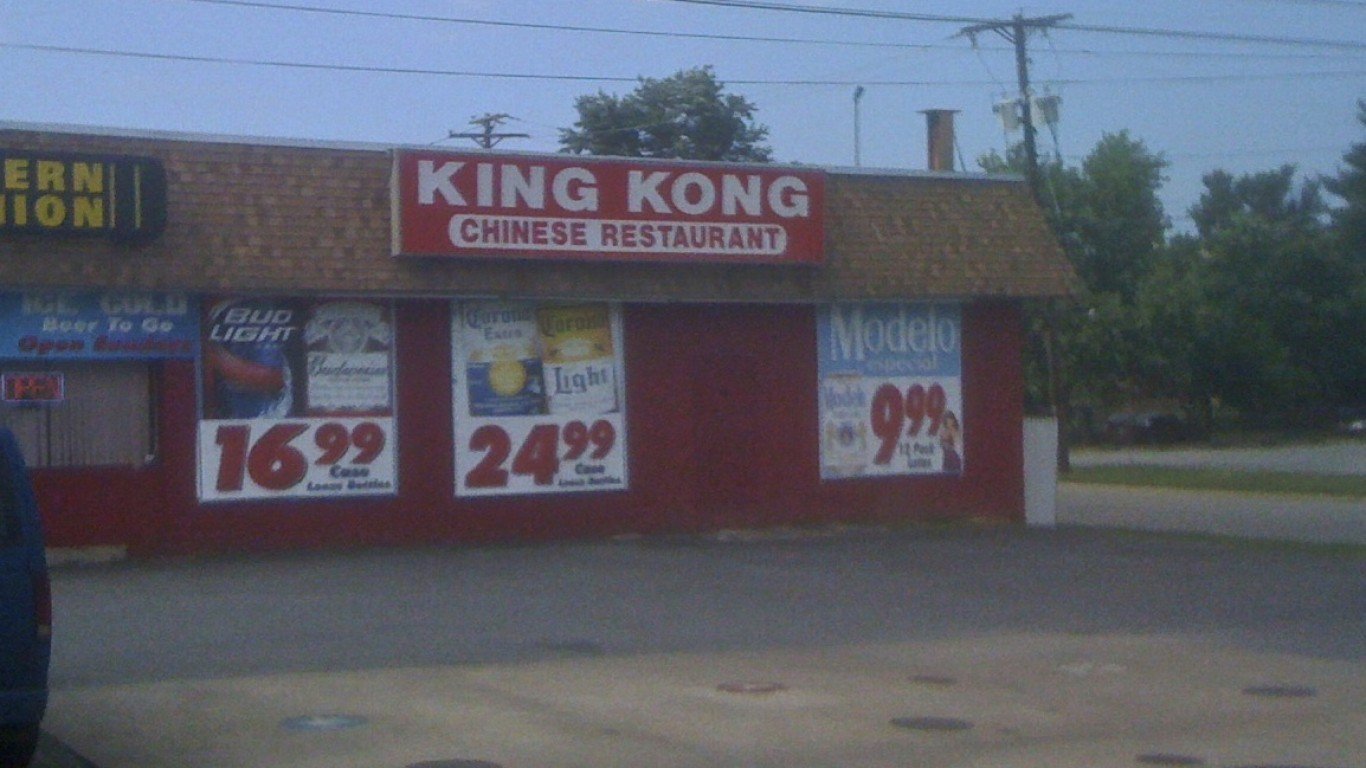
Maryland: Langley Park
> Americans under 65, no health insurance: 46.0% (Maryland: 6.9%)
> Americans under 65, Medicare coverage (or multiple types): 0.4% (Maryland: 2.6%)
> Americans under 65, Medicaid coverage (or multiple types): 35.1% (Maryland: 19.1%)
> Americans under 65, VA coverage (or multiple types): 0.2% (Maryland: 1.2%)
> Americans under 65, employer-based insurance (or multiple types): 15.9% (Maryland: 65.7%)
> Americans under 65, direct-purchase insurance (or multiple types): 3.3% (Maryland: 9.6%)
> Americans under 65, Tricare/military insurance (or many types): 0.0% reported (Maryland: 3.1%)
Massachusetts: Vineyard Haven
> Americans under 65, no health insurance: 13.0% (Massachusetts: 3.2%)
> Americans under 65, Medicare coverage (or multiple types): 2.3% (Massachusetts: 2.5%)
> Americans under 65, Medicaid coverage (or multiple types): 23.4% (Massachusetts: 24.0%)
> Americans under 65, VA coverage (or multiple types): 0.0% reported (Massachusetts: 0.6%)
> Americans under 65, employer-based insurance (or multiple types): 55.7% (Massachusetts: 67.5%)
> Americans under 65, direct-purchase insurance (or multiple types): 13.6% (Massachusetts: 9.9%)
> Americans under 65, Tricare/military insurance (or many types): 0.0% reported (Massachusetts: 0.8%)
[in-text-ad]

Michigan: Three Oaks
> Americans under 65, no health insurance: 17.5% (Michigan: 6.5%)
> Americans under 65, Medicare coverage (or multiple types): 3.3% (Michigan: 3.7%)
> Americans under 65, Medicaid coverage (or multiple types): 25.4% (Michigan: 24.2%)
> Americans under 65, VA coverage (or multiple types): 0.0% reported (Michigan: 1.0%)
> Americans under 65, employer-based insurance (or multiple types): 51.0% (Michigan: 63.3%)
> Americans under 65, direct-purchase insurance (or multiple types): 12.0% (Michigan: 9.1%)
> Americans under 65, Tricare/military insurance (or many types): 0.0% reported (Michigan: 0.9%)
[recirclink id=923401]
Minnesota: Little Rock
> Americans under 65, no health insurance: 38.2% (Minnesota: 5.2%)
> Americans under 65, Medicare coverage (or multiple types): 4.0% (Minnesota: 2.1%)
> Americans under 65, Medicaid coverage (or multiple types): 41.9% (Minnesota: 19.4%)
> Americans under 65, VA coverage (or multiple types): 1.8% (Minnesota: 1.0%)
> Americans under 65, employer-based insurance (or multiple types): 15.3% (Minnesota: 68.6%)
> Americans under 65, direct-purchase insurance (or multiple types): 0.0% reported (Minnesota: 9.9%)
> Americans under 65, Tricare/military insurance (or many types): 0.0% reported (Minnesota: 1.0%)
Mississippi: Conehatta
> Americans under 65, no health insurance: 40.8% (Mississippi: 14.5%)
> Americans under 65, Medicare coverage (or multiple types): 0.8% (Mississippi: 4.7%)
> Americans under 65, Medicaid coverage (or multiple types): 32.3% (Mississippi: 25.1%)
> Americans under 65, VA coverage (or multiple types): 0.0% reported (Mississippi: 1.4%)
> Americans under 65, employer-based insurance (or multiple types): 28.7% (Mississippi: 51.2%)
> Americans under 65, direct-purchase insurance (or multiple types): 0.4% (Mississippi: 9.5%)
> Americans under 65, Tricare/military insurance (or many types): 0.0% reported (Mississippi: 3.0%)
[in-text-ad-2]

Missouri: Merriam Woods
> Americans under 65, no health insurance: 30.4% (Missouri: 11.1%)
> Americans under 65, Medicare coverage (or multiple types): 3.4% (Missouri: 3.8%)
> Americans under 65, Medicaid coverage (or multiple types): 31.6% (Missouri: 15.8%)
> Americans under 65, VA coverage (or multiple types): 1.9% (Missouri: 1.4%)
> Americans under 65, employer-based insurance (or multiple types): 28.0% (Missouri: 62.9%)
> Americans under 65, direct-purchase insurance (or multiple types): 7.8% (Missouri: 10.5%)
> Americans under 65, Tricare/military insurance (or many types): 0.3% (Missouri: 2.0%)
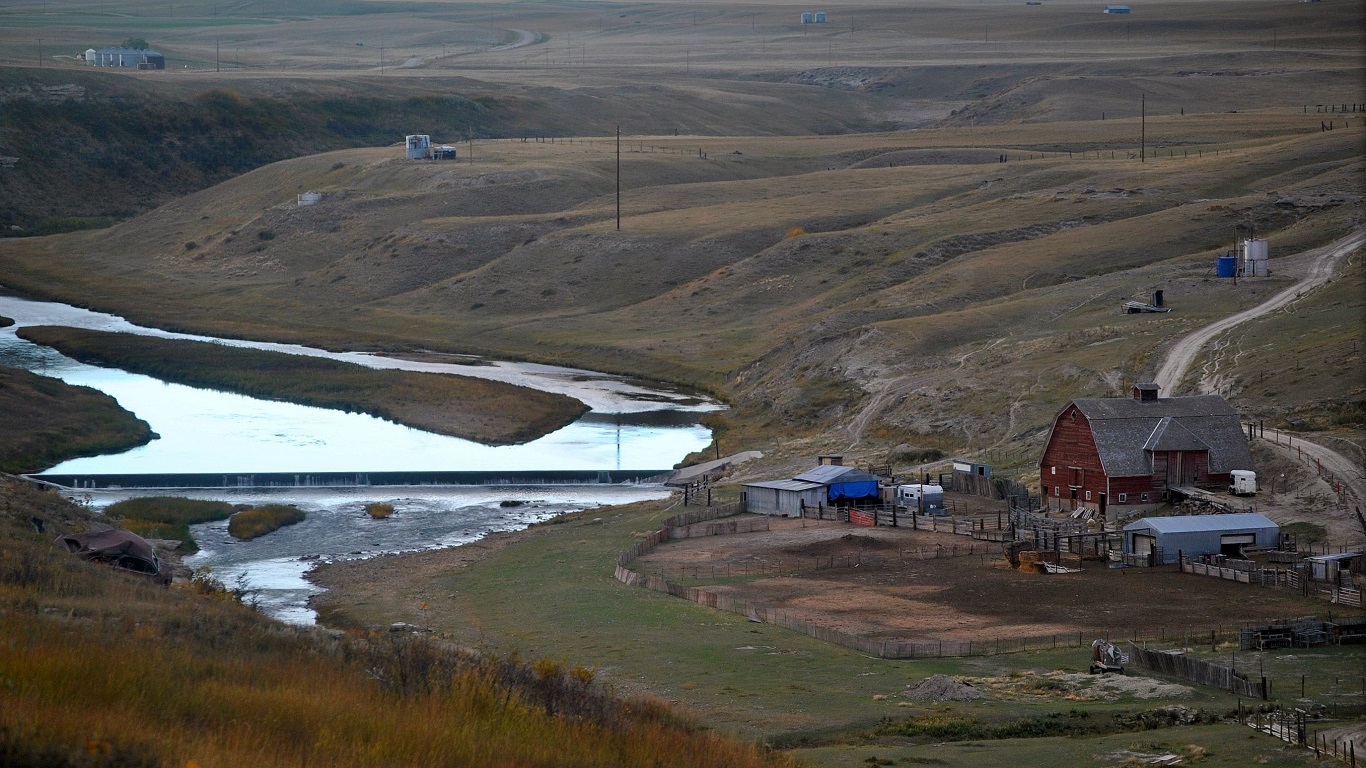
Montana: North Browning
> Americans under 65, no health insurance: 58.2% (Montana: 10.9%)
> Americans under 65, Medicare coverage (or multiple types): 1.4% (Montana: 3.0%)
> Americans under 65, Medicaid coverage (or multiple types): 28.4% (Montana: 21.4%)
> Americans under 65, VA coverage (or multiple types): 0.8% (Montana: 2.1%)
> Americans under 65, employer-based insurance (or multiple types): 11.2% (Montana: 54.9%)
> Americans under 65, direct-purchase insurance (or multiple types): 2.0% (Montana: 13.9%)
> Americans under 65, Tricare/military insurance (or many types): 0.0% reported (Montana: 3.0%)
[in-text-ad]
Nebraska: Terrytown
> Americans under 65, no health insurance: 22.4% (Nebraska: 9.5%)
> Americans under 65, Medicare coverage (or multiple types): 4.6% (Nebraska: 2.2%)
> Americans under 65, Medicaid coverage (or multiple types): 26.5% (Nebraska: 13.4%)
> Americans under 65, VA coverage (or multiple types): 1.3% (Nebraska: 1.4%)
> Americans under 65, employer-based insurance (or multiple types): 41.0% (Nebraska: 66.1%)
> Americans under 65, direct-purchase insurance (or multiple types): 9.6% (Nebraska: 12.9%)
> Americans under 65, Tricare/military insurance (or many types): 1.5% (Nebraska: 2.7%)
[recirclink id=887931]
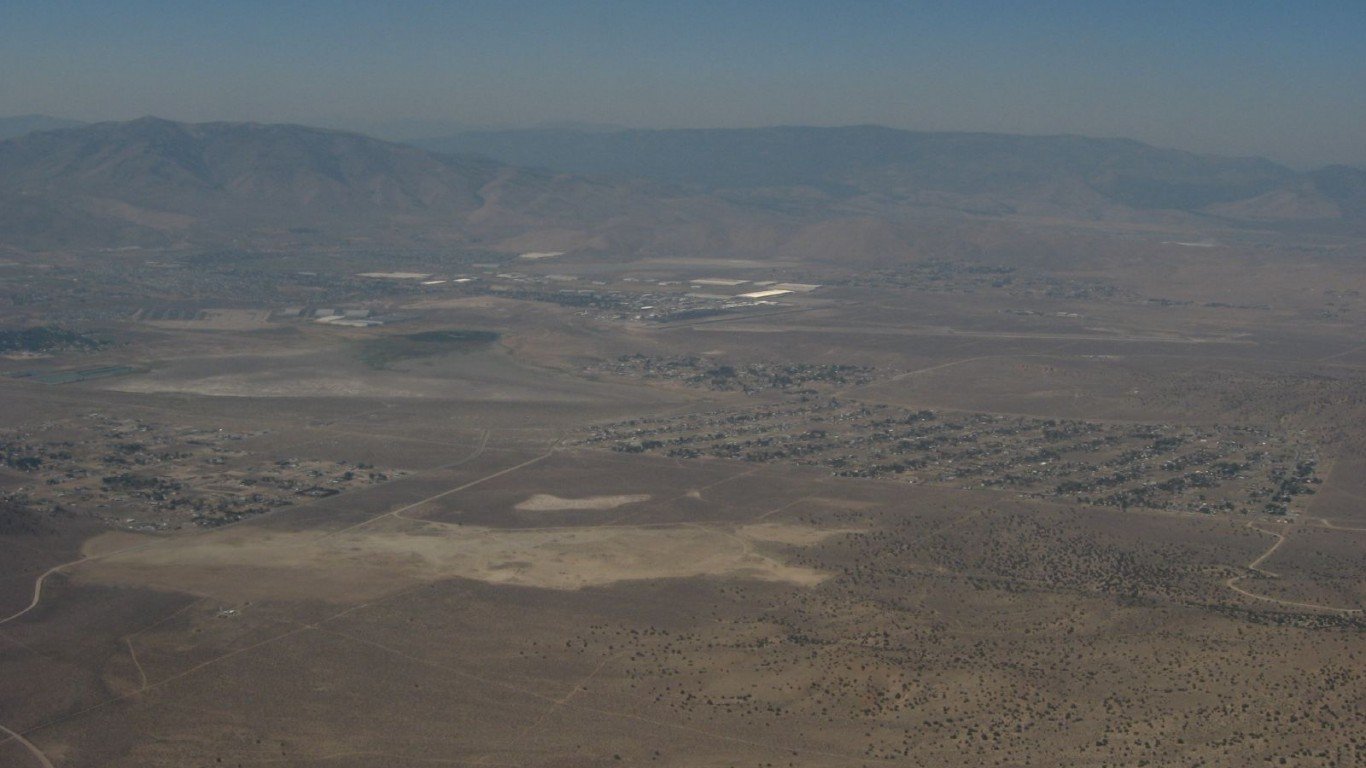
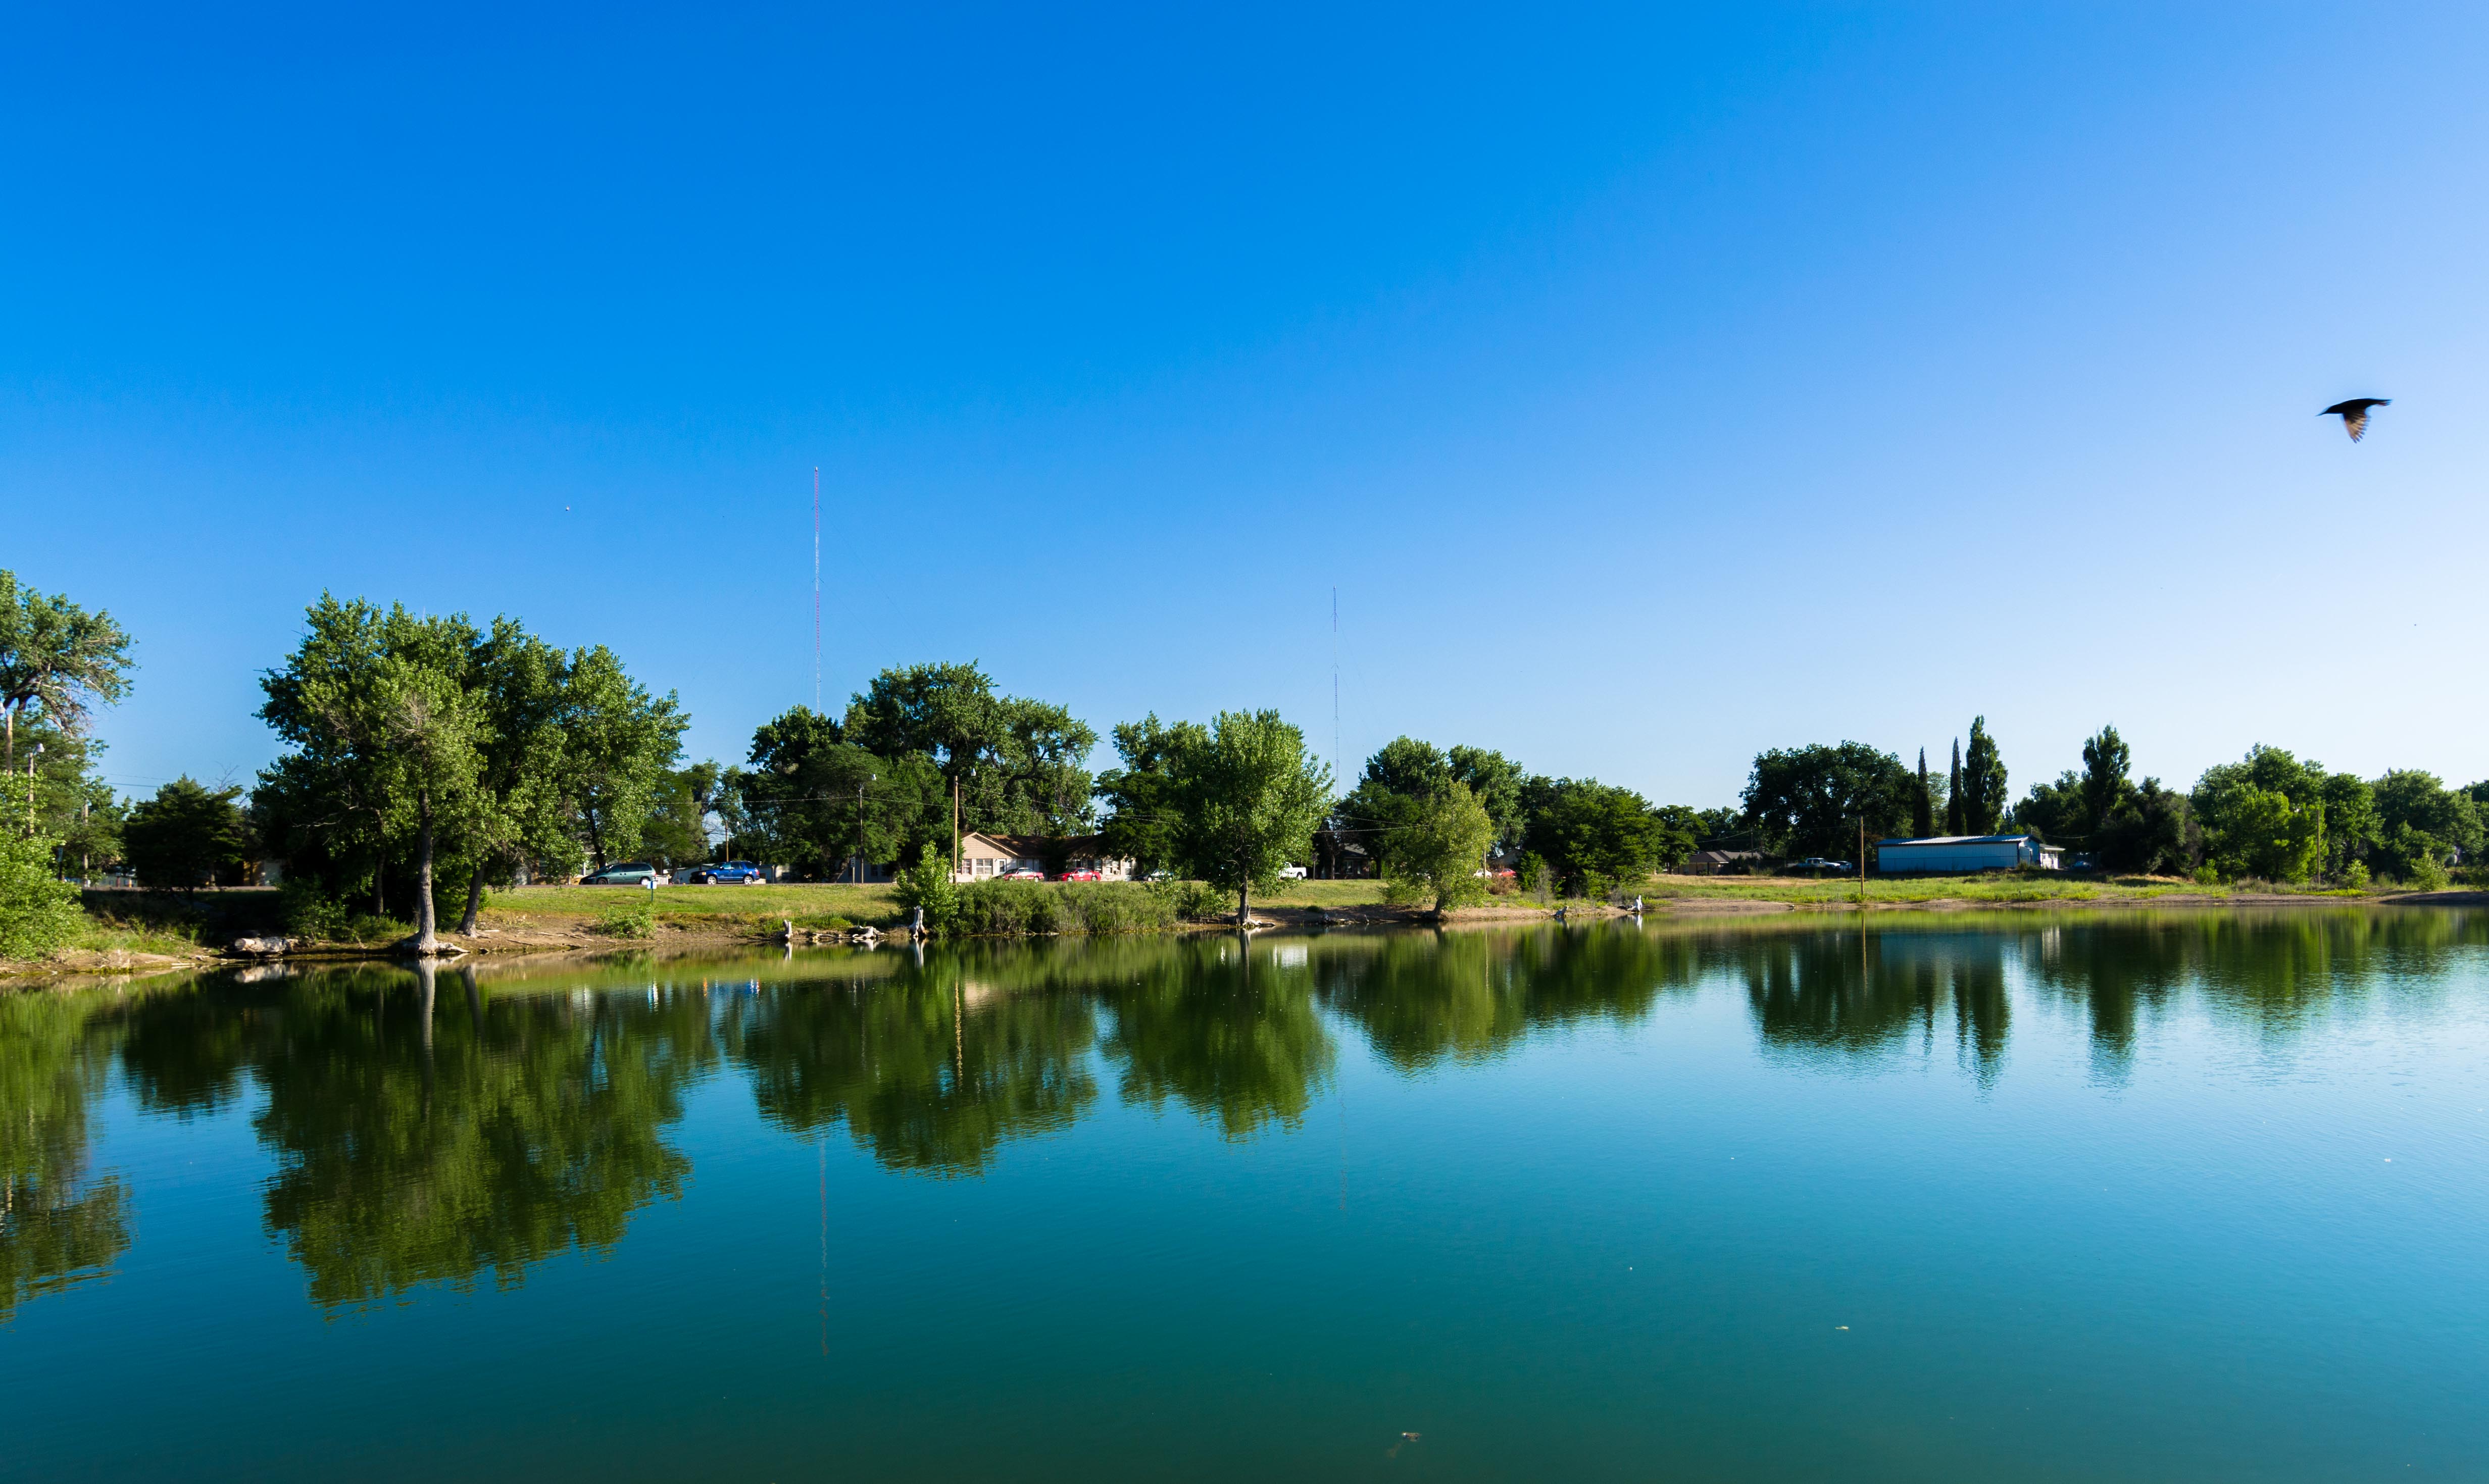
Nevada: Lemmon Valley
> Americans under 65, no health insurance: 25.6% (Nevada: 12.9%)
> Americans under 65, Medicare coverage (or multiple types): 4.2% (Nevada: 2.5%)
> Americans under 65, Medicaid coverage (or multiple types): 10.3% (Nevada: 20.0%)
> Americans under 65, VA coverage (or multiple types): 1.3% (Nevada: 1.7%)
> Americans under 65, employer-based insurance (or multiple types): 55.0% (Nevada: 58.7%)
> Americans under 65, direct-purchase insurance (or multiple types): 4.8% (Nevada: 9.1%)
> Americans under 65, Tricare/military insurance (or many types): 1.4% (Nevada: 2.7%)

New Hampshire: Winchester
> Americans under 65, no health insurance: 22.0% (New Hampshire: 7.1%)
> Americans under 65, Medicare coverage (or multiple types): 6.8% (New Hampshire: 3.2%)
> Americans under 65, Medicaid coverage (or multiple types): 38.7% (New Hampshire: 14.6%)
> Americans under 65, VA coverage (or multiple types): 2.5% (New Hampshire: 1.3%)
> Americans under 65, employer-based insurance (or multiple types): 29.0% (New Hampshire: 69.8%)
> Americans under 65, direct-purchase insurance (or multiple types): 4.4% (New Hampshire: 9.3%)
> Americans under 65, Tricare/military insurance (or many types): 2.8% (New Hampshire: 1.5%)
[in-text-ad-2]

New Jersey: Dover
> Americans under 65, no health insurance: 26.5% (New Jersey: 9.0%)
> Americans under 65, Medicare coverage (or multiple types): 3.7% (New Jersey: 2.4%)
> Americans under 65, Medicaid coverage (or multiple types): 18.0% (New Jersey: 17.7%)
> Americans under 65, VA coverage (or multiple types): 0.6% (New Jersey: 0.4%)
> Americans under 65, employer-based insurance (or multiple types): 48.7% (New Jersey: 66.5%)
> Americans under 65, direct-purchase insurance (or multiple types): 7.1% (New Jersey: 8.9%)
> Americans under 65, Tricare/military insurance (or many types): 0.1% (New Jersey: 0.7%)
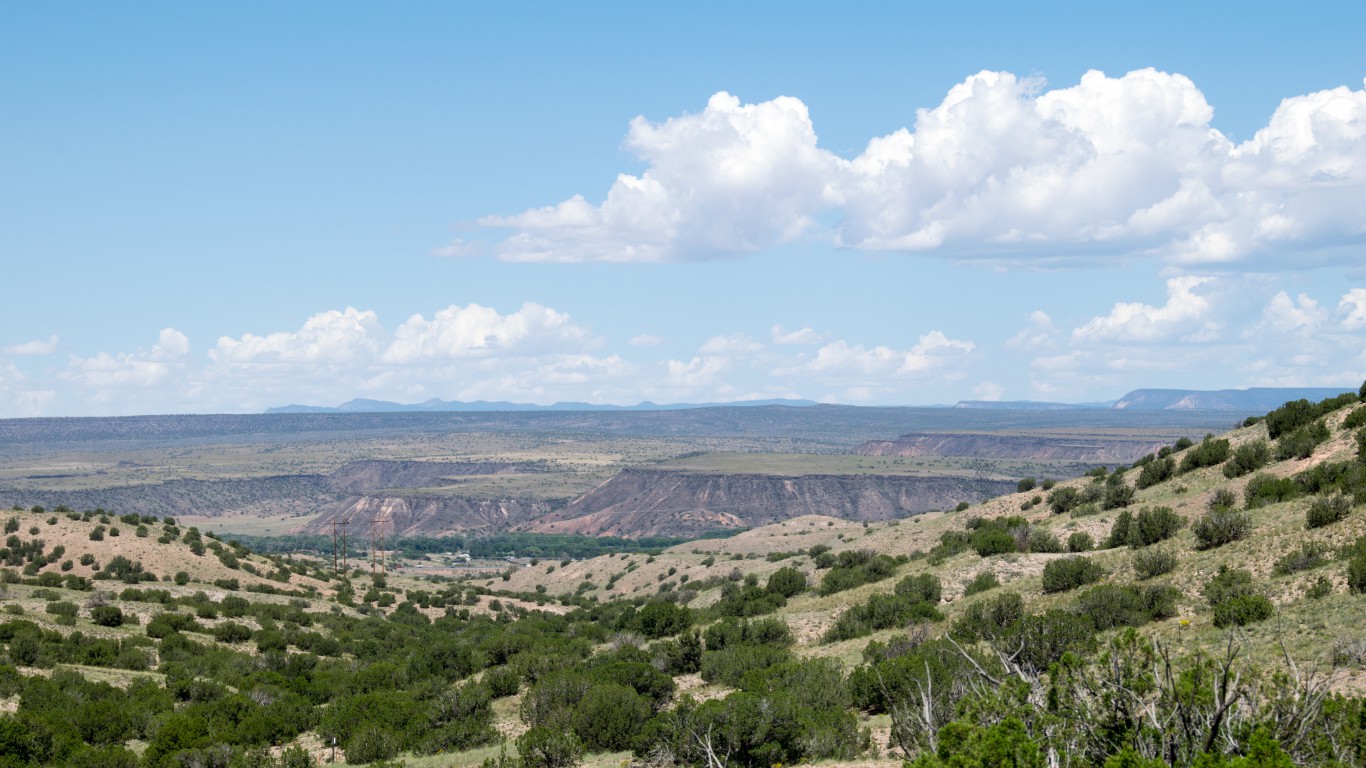
New Mexico: San Felipe Pueblo
> Americans under 65, no health insurance: 53.8% (New Mexico: 11.4%)
> Americans under 65, Medicare coverage (or multiple types): 3.4% (New Mexico: 3.6%)
> Americans under 65, Medicaid coverage (or multiple types): 31.0% (New Mexico: 35.6%)
> Americans under 65, VA coverage (or multiple types): 0.0% reported (New Mexico: 1.7%)
> Americans under 65, employer-based insurance (or multiple types): 18.2% (New Mexico: 46.4%)
> Americans under 65, direct-purchase insurance (or multiple types): 1.7% (New Mexico: 8.0%)
> Americans under 65, Tricare/military insurance (or many types): 0.0% reported (New Mexico: 3.3%)
[in-text-ad]
New York: Brewster
> Americans under 65, no health insurance: 28.2% (New York: 6.7%)
> Americans under 65, Medicare coverage (or multiple types): 5.4% (New York: 2.8%)
> Americans under 65, Medicaid coverage (or multiple types): 38.6% (New York: 26.9%)
> Americans under 65, VA coverage (or multiple types): 0.0% reported (New York: 0.6%)
> Americans under 65, employer-based insurance (or multiple types): 33.9% (New York: 59.7%)
> Americans under 65, direct-purchase insurance (or multiple types): 5.3% (New York: 10.8%)
> Americans under 65, Tricare/military insurance (or many types): 0.0% reported (New York: 0.7%)
[recirclink id=931632]

North Carolina: Cherokee
> Americans under 65, no health insurance: 44.0% (North Carolina: 12.6%)
> Americans under 65, Medicare coverage (or multiple types): 5.1% (North Carolina: 3.5%)
> Americans under 65, Medicaid coverage (or multiple types): 15.9% (North Carolina: 19.4%)
> Americans under 65, VA coverage (or multiple types): 0.6% (North Carolina: 1.7%)
> Americans under 65, employer-based insurance (or multiple types): 36.0% (North Carolina: 55.9%)
> Americans under 65, direct-purchase insurance (or multiple types): 1.0% (North Carolina: 11.7%)
> Americans under 65, Tricare/military insurance (or many types): 1.1% (North Carolina: 3.8%)
North Dakota: Shell Valley
> Americans under 65, no health insurance: 35.8% (North Dakota: 8.5%)
> Americans under 65, Medicare coverage (or multiple types): 4.3% (North Dakota: 2.1%)
> Americans under 65, Medicaid coverage (or multiple types): 39.2% (North Dakota: 11.4%)
> Americans under 65, VA coverage (or multiple types): 0.0% reported (North Dakota: 1.4%)
> Americans under 65, employer-based insurance (or multiple types): 20.3% (North Dakota: 67.6%)
> Americans under 65, direct-purchase insurance (or multiple types): 0.9% (North Dakota: 14.3%)
> Americans under 65, Tricare/military insurance (or many types): 0.0% reported (North Dakota: 3.4%)
[in-text-ad-2]

Ohio: West Hill
> Americans under 65, no health insurance: 23.9% (Ohio: 7.2%)
> Americans under 65, Medicare coverage (or multiple types): 4.8% (Ohio: 3.3%)
> Americans under 65, Medicaid coverage (or multiple types): 33.5% (Ohio: 22.8%)
> Americans under 65, VA coverage (or multiple types): 3.2% (Ohio: 1.2%)
> Americans under 65, employer-based insurance (or multiple types): 36.2% (Ohio: 64.0%)
> Americans under 65, direct-purchase insurance (or multiple types): 2.6% (Ohio: 7.8%)
> Americans under 65, Tricare/military insurance (or many types): 0.9% (Ohio: 1.2%)
Oklahoma: Wetumka
> Americans under 65, no health insurance: 37.6% (Oklahoma: 16.5%)
> Americans under 65, Medicare coverage (or multiple types): 5.3% (Oklahoma: 3.9%)
> Americans under 65, Medicaid coverage (or multiple types): 29.0% (Oklahoma: 18.8%)
> Americans under 65, VA coverage (or multiple types): 0.0% reported (Oklahoma: 1.8%)
> Americans under 65, employer-based insurance (or multiple types): 30.4% (Oklahoma: 54.4%)
> Americans under 65, direct-purchase insurance (or multiple types): 4.2% (Oklahoma: 9.9%)
> Americans under 65, Tricare/military insurance (or many types): 0.0% reported (Oklahoma: 3.1%)
[in-text-ad]

Oregon: Depoe Bay
> Americans under 65, no health insurance: 21.2% (Oregon: 8.0%)
> Americans under 65, Medicare coverage (or multiple types): 5.5% (Oregon: 2.8%)
> Americans under 65, Medicaid coverage (or multiple types): 16.4% (Oregon: 24.7%)
> Americans under 65, VA coverage (or multiple types): 0.6% (Oregon: 1.6%)
> Americans under 65, employer-based insurance (or multiple types): 50.4% (Oregon: 59.2%)
> Americans under 65, direct-purchase insurance (or multiple types): 12.1% (Oregon: 11.0%)
> Americans under 65, Tricare/military insurance (or many types): 4.7% (Oregon: 1.4%)
[recirclink id=924829]
Pennsylvania: West Grove
> Americans under 65, no health insurance: 33.8% (Pennsylvania: 6.8%)
> Americans under 65, Medicare coverage (or multiple types): 2.1% (Pennsylvania: 3.2%)
> Americans under 65, Medicaid coverage (or multiple types): 11.4% (Pennsylvania: 21.1%)
> Americans under 65, VA coverage (or multiple types): 0.7% (Pennsylvania: 1.0%)
> Americans under 65, employer-based insurance (or multiple types): 46.2% (Pennsylvania: 65.2%)
> Americans under 65, direct-purchase insurance (or multiple types): 8.1% (Pennsylvania: 10.2%)
> Americans under 65, Tricare/military insurance (or many types): 2.2% (Pennsylvania: 1.0%)
Rhode Island: Central Falls
> Americans under 65, no health insurance: 18.2% (Rhode Island: 5.3%)
> Americans under 65, Medicare coverage (or multiple types): 5.5% (Rhode Island: 3.4%)
> Americans under 65, Medicaid coverage (or multiple types): 51.6% (Rhode Island: 23.2%)
> Americans under 65, VA coverage (or multiple types): 0.4% (Rhode Island: 1.0%)
> Americans under 65, employer-based insurance (or multiple types): 26.9% (Rhode Island: 64.1%)
> Americans under 65, direct-purchase insurance (or multiple types): 5.2% (Rhode Island: 10.8%)
> Americans under 65, Tricare/military insurance (or many types): 0.4% (Rhode Island: 1.4%)
[in-text-ad-2]
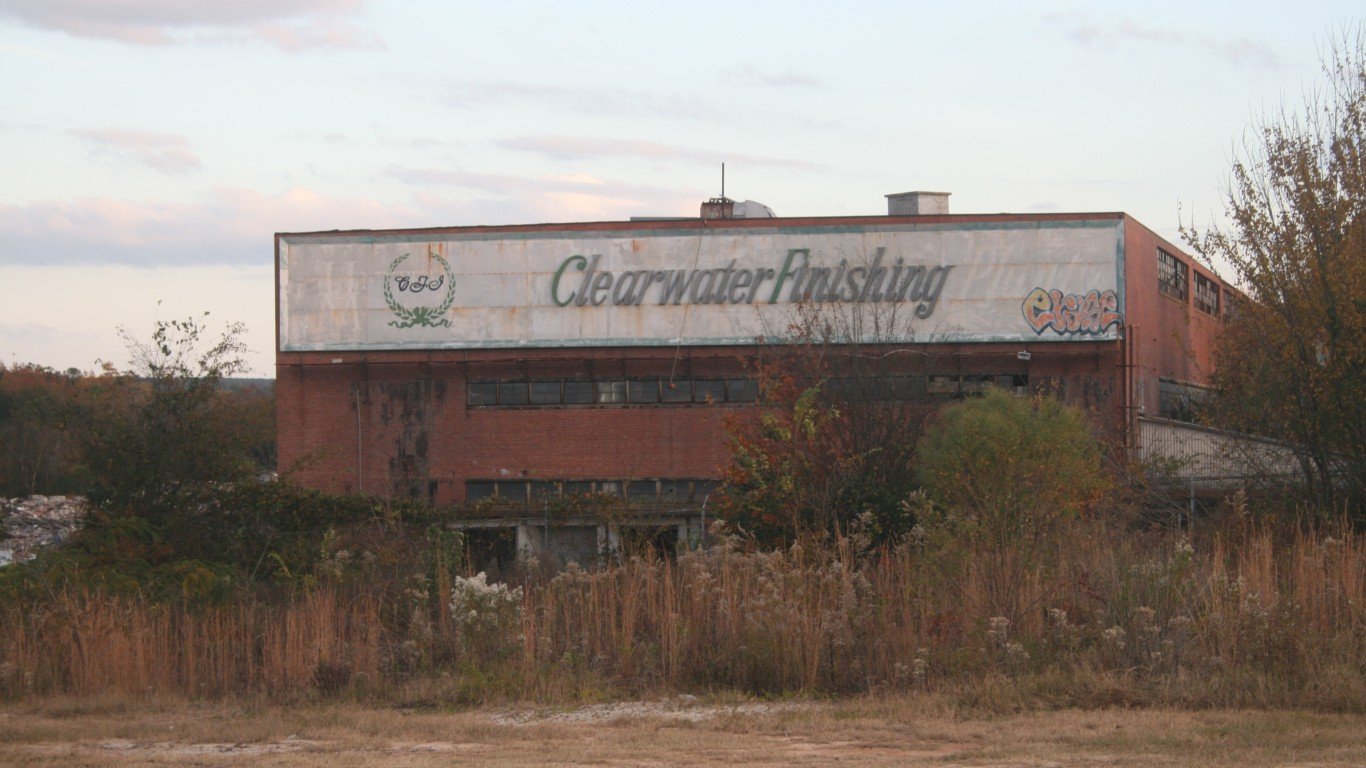
South Carolina: Clearwater
> Americans under 65, no health insurance: 32.5% (South Carolina: 12.6%)
> Americans under 65, Medicare coverage (or multiple types): 1.3% (South Carolina: 3.8%)
> Americans under 65, Medicaid coverage (or multiple types): 32.7% (South Carolina: 20.7%)
> Americans under 65, VA coverage (or multiple types): 2.4% (South Carolina: 1.8%)
> Americans under 65, employer-based insurance (or multiple types): 33.9% (South Carolina: 56.5%)
> Americans under 65, direct-purchase insurance (or multiple types): 4.2% (South Carolina: 10.4%)
> Americans under 65, Tricare/military insurance (or many types): 0.5% (South Carolina: 3.7%)

South Dakota: Fort Thompson
> Americans under 65, no health insurance: 44.0% (South Dakota: 11.2%)
> Americans under 65, Medicare coverage (or multiple types): 7.5% (South Dakota: 2.7%)
> Americans under 65, Medicaid coverage (or multiple types): 45.2% (South Dakota: 15.3%)
> Americans under 65, VA coverage (or multiple types): 0.9% (South Dakota: 1.9%)
> Americans under 65, employer-based insurance (or multiple types): 6.3% (South Dakota: 61.1%)
> Americans under 65, direct-purchase insurance (or multiple types): 0.8% (South Dakota: 13.7%)
> Americans under 65, Tricare/military insurance (or many types): 0.3% (South Dakota: 3.4%)
[in-text-ad]

Tennessee: Pigeon Forge
> Americans under 65, no health insurance: 30.3% (Tennessee: 11.4%)
> Americans under 65, Medicare coverage (or multiple types): 3.4% (Tennessee: 3.8%)
> Americans under 65, Medicaid coverage (or multiple types): 32.5% (Tennessee: 21.6%)
> Americans under 65, VA coverage (or multiple types): 0.0% reported (Tennessee: 1.6%)
> Americans under 65, employer-based insurance (or multiple types): 33.1% (Tennessee: 57.8%)
> Americans under 65, direct-purchase insurance (or multiple types): 4.5% (Tennessee: 10.1%)
> Americans under 65, Tricare/military insurance (or many types): 1.0% (Tennessee: 2.7%)
[recirclink id=927311]
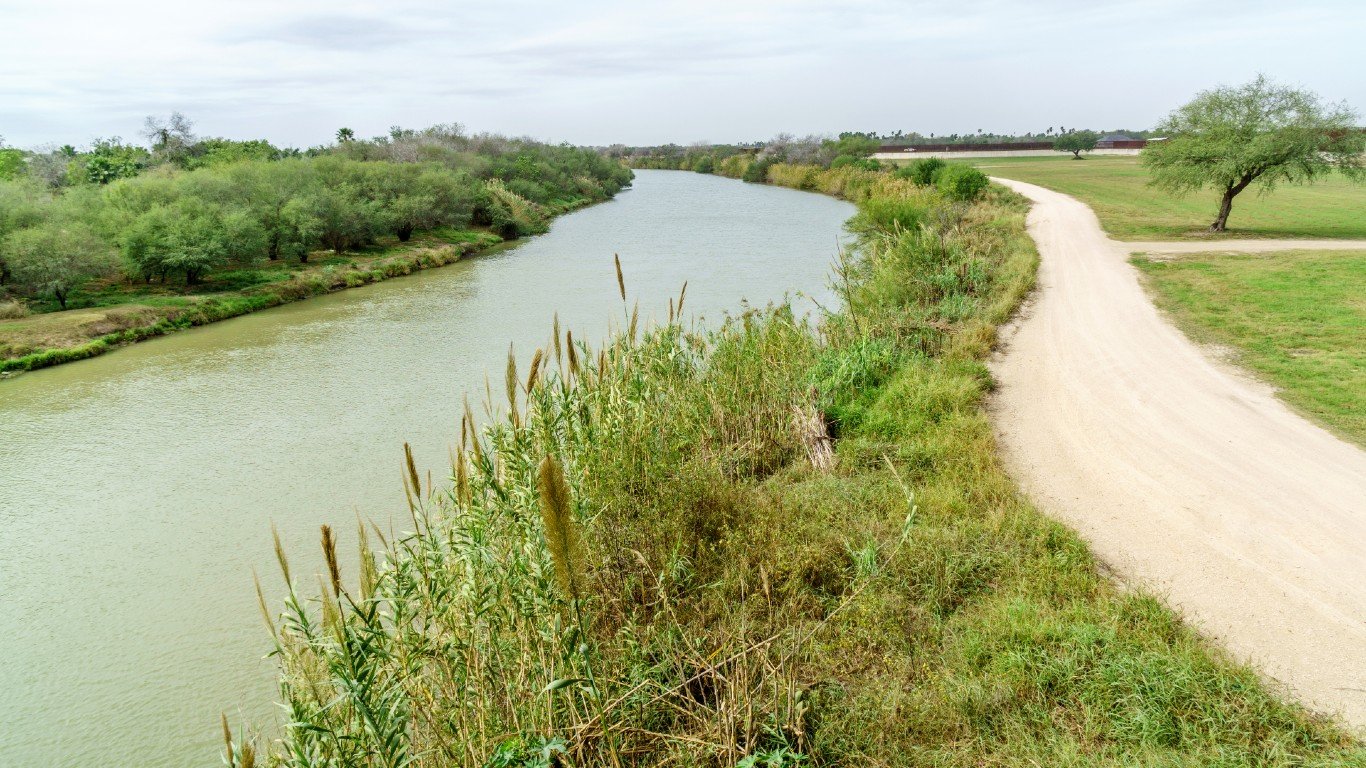
Texas: Citrus City
> Americans under 65, no health insurance: 51.2% (Texas: 19.4%)
> Americans under 65, Medicare coverage (or multiple types): 3.6% (Texas: 2.2%)
> Americans under 65, Medicaid coverage (or multiple types): 41.8% (Texas: 17.2%)
> Americans under 65, VA coverage (or multiple types): 1.0% (Texas: 1.3%)
> Americans under 65, employer-based insurance (or multiple types): 6.6% (Texas: 54.5%)
> Americans under 65, direct-purchase insurance (or multiple types): 0.0% reported (Texas: 9.4%)
> Americans under 65, Tricare/military insurance (or many types): 0.0% reported (Texas: 2.3%)
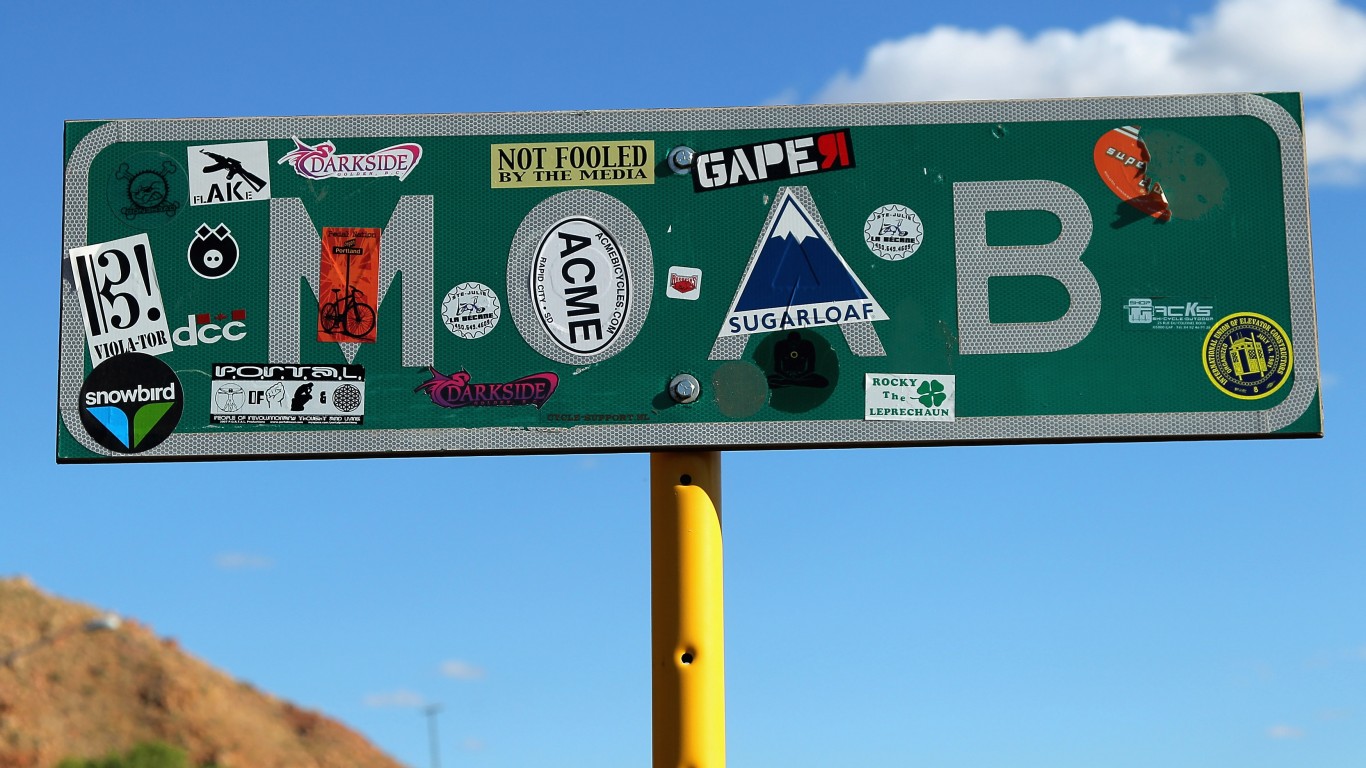
Utah: Moab
> Americans under 65, no health insurance: 31.2% (Utah: 10.4%)
> Americans under 65, Medicare coverage (or multiple types): 4.1% (Utah: 1.5%)
> Americans under 65, Medicaid coverage (or multiple types): 18.1% (Utah: 10.7%)
> Americans under 65, VA coverage (or multiple types): 1.2% (Utah: 0.8%)
> Americans under 65, employer-based insurance (or multiple types): 37.0% (Utah: 68.4%)
> Americans under 65, direct-purchase insurance (or multiple types): 15.1% (Utah: 12.5%)
> Americans under 65, Tricare/military insurance (or many types): 0.2% (Utah: 1.8%)
[in-text-ad-2]

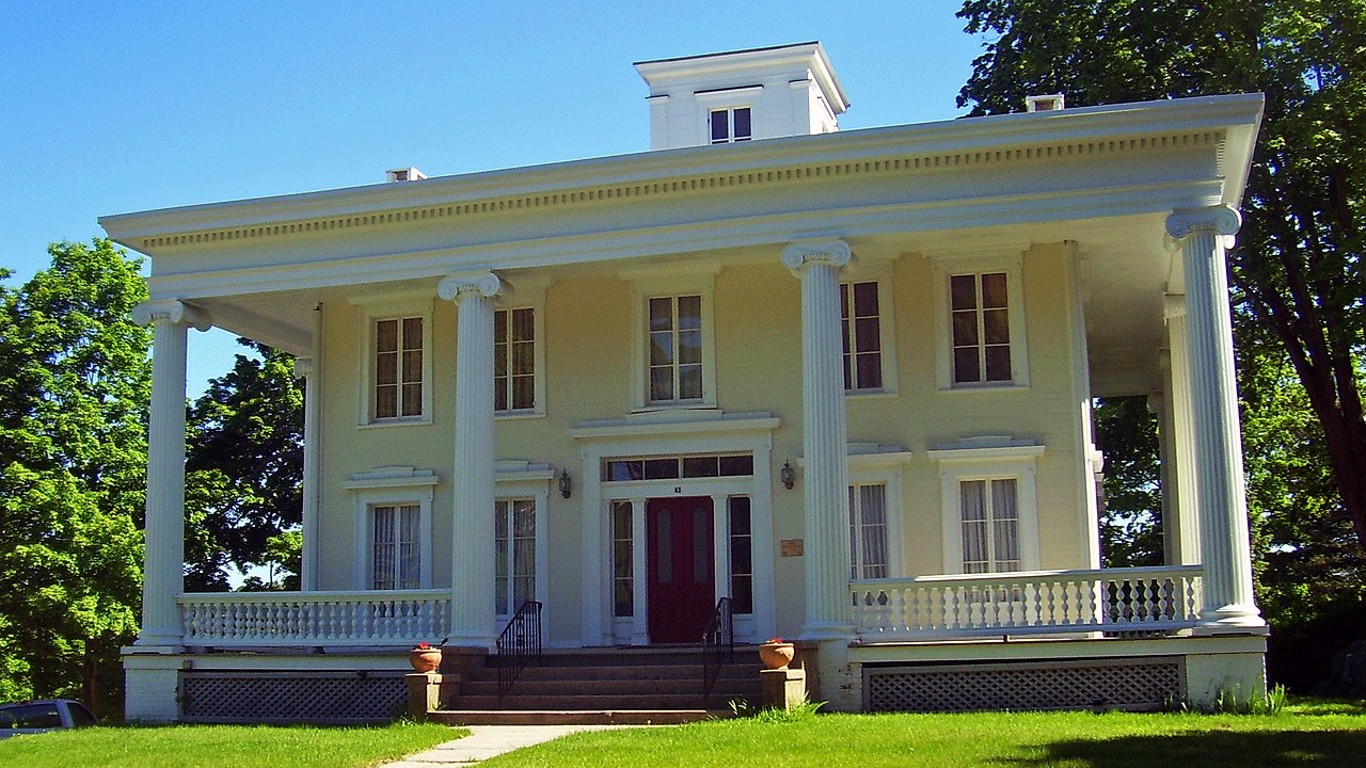
Vermont: North Bennington
> Americans under 65, no health insurance: 11.5% (Vermont: 4.8%)
> Americans under 65, Medicare coverage (or multiple types): 3.1% (Vermont: 3.8%)
> Americans under 65, Medicaid coverage (or multiple types): 17.1% (Vermont: 27.1%)
> Americans under 65, VA coverage (or multiple types): 1.5% (Vermont: 1.2%)
> Americans under 65, employer-based insurance (or multiple types): 51.9% (Vermont: 60.5%)
> Americans under 65, direct-purchase insurance (or multiple types): 21.4% (Vermont: 10.1%)
> Americans under 65, Tricare/military insurance (or many types): 0.7% (Vermont: 1.6%)
Virginia: Bensley
> Americans under 65, no health insurance: 30.9% (Virginia: 10.0%)
> Americans under 65, Medicare coverage (or multiple types): 2.8% (Virginia: 2.7%)
> Americans under 65, Medicaid coverage (or multiple types): 32.0% (Virginia: 12.6%)
> Americans under 65, VA coverage (or multiple types): 0.7% (Virginia: 2.1%)
> Americans under 65, employer-based insurance (or multiple types): 32.6% (Virginia: 63.9%)
> Americans under 65, direct-purchase insurance (or multiple types): 4.3% (Virginia: 11.0%)
> Americans under 65, Tricare/military insurance (or many types): 2.2% (Virginia: 7.1%)
[in-text-ad]
Washington: Royal City
> Americans under 65, no health insurance: 37.5% (Washington: 7.3%)
> Americans under 65, Medicare coverage (or multiple types): 1.2% (Washington: 2.5%)
> Americans under 65, Medicaid coverage (or multiple types): 41.6% (Washington: 22.0%)
> Americans under 65, VA coverage (or multiple types): 0.0% reported (Washington: 1.6%)
> Americans under 65, employer-based insurance (or multiple types): 19.0% (Washington: 62.3%)
> Americans under 65, direct-purchase insurance (or multiple types): 0.0% reported (Washington: 9.7%)
> Americans under 65, Tricare/military insurance (or many types): 0.7% (Washington: 3.6%)
[recirclink id=923401]

West Virginia: Newell
> Americans under 65, no health insurance: 16.3% (West Virginia: 7.4%)
> Americans under 65, Medicare coverage (or multiple types): 3.9% (West Virginia: 5.4%)
> Americans under 65, Medicaid coverage (or multiple types): 28.9% (West Virginia: 30.3%)
> Americans under 65, VA coverage (or multiple types): 5.6% (West Virginia: 1.8%)
> Americans under 65, employer-based insurance (or multiple types): 52.1% (West Virginia: 57.1%)
> Americans under 65, direct-purchase insurance (or multiple types): 0.9% (West Virginia: 6.4%)
> Americans under 65, Tricare/military insurance (or many types): 0.0% reported (West Virginia: 1.6%)
Wisconsin: Legend Lake
> Americans under 65, no health insurance: 33.8% (Wisconsin: 6.4%)
> Americans under 65, Medicare coverage (or multiple types): 1.9% (Wisconsin: 2.7%)
> Americans under 65, Medicaid coverage (or multiple types): 13.2% (Wisconsin: 18.0%)
> Americans under 65, VA coverage (or multiple types): 0.0% reported (Wisconsin: 1.1%)
> Americans under 65, employer-based insurance (or multiple types): 44.0% (Wisconsin: 69.1%)
> Americans under 65, direct-purchase insurance (or multiple types): 13.4% (Wisconsin: 9.4%)
> Americans under 65, Tricare/military insurance (or many types): 0.0% reported (Wisconsin: 1.0%)
[in-text-ad-2]

Wyoming: Ethete
> Americans under 65, no health insurance: 44.8% (Wyoming: 13.5%)
> Americans under 65, Medicare coverage (or multiple types): 2.0% (Wyoming: 2.3%)
> Americans under 65, Medicaid coverage (or multiple types): 31.5% (Wyoming: 12.1%)
> Americans under 65, VA coverage (or multiple types): 0.9% (Wyoming: 1.8%)
> Americans under 65, employer-based insurance (or multiple types): 21.8% (Wyoming: 64.1%)
> Americans under 65, direct-purchase insurance (or multiple types): 0.9% (Wyoming: 11.4%)
> Americans under 65, Tricare/military insurance (or many types): 0.2% (Wyoming: 3.0%)
Methodology
To determine the town with the best health insurance coverage in every state, 24/7 Wall St. reviewed five-year estimates of the percentage of the noninstitutionalized civilian population under 65 without health insurance from the U.S. Census Bureau’s 2019 American Community Survey.
We used census “place” geographies — a category that includes 29,573 incorporated legal entities and census-designated statistical entities. Of those, 29,319 had boundaries that fell within one of the 50 states, while the rest were in the District of Columbia or Puerto Rico.
We defined towns based on population thresholds — having at least 1,000 people and less than 25,000 people — and 13,332 of the places fell within these thresholds.
Towns were excluded if the noninstitutionalized civilian population under 65 was less than 1,000 or if the sampling error associated with a town’s data was deemed too high.
The sampling error was defined as too high if the coefficient of variation — a statistical assessment of how reliable an estimate is — for a town’s under 65 uninsured rate was above 15% and greater than two standard deviations above the mean CV for all towns’ under 65 uninsured rates. We similarly excluded towns that had a sampling error too high for their under 65 noninstitutionalized civilian population, using the same definition.
We selected the under 65 age group because Americans become eligible for medicare at age 65, and the uninsured rate for the population above this age is less than 1% nationwide. However, because the Census doesn’t publish insurance coverage estimates specifically for the under 65 age group, we aggregated the data from more granular age breakdowns.
To ensure each aggregate estimate’s sampling error could be assessed using the definition above, we derived a margin of error for each aggregate estimate using the successive differences replication variance estimation methodology recommended and used by the U.S. Census Bureau.
The remaining 11,039 places were ranked within their state based on their under 65 uninsured rates. To break ties, we used the number of insured people in the same population group.
The share of the population covered by each type of insurance — Medicare, Medicaid, VA, employer, direct-purchase, and Tricare/military — are for the same cohort and are also aggregated from five-year ACS estimates. The estimates reflect people who are covered by that type of insurance alone or in combination with other types on the list. So, when a person is covered by more than one type of insurance, they are included in each group.
Contact [email protected] for any questions or corrections.