The United States has some of the highest levels of income and wealth inequality in the world. U.S. Federal Reserve data shows that the wealthiest 10% of Americans control $93.8 trillion, more than double the $40.3 trillion in the hands of the remaining 90% of Americans.
The income and wealth divide only appears to be growing wider. A January 2020 report published by the Pew Research Center found that over the last four decades, income growth for the top 5% of families by earnings has far outpaced income growth for families in lower income strata.
Income inequality varies considerably within the United States, and in some cities, the problem is far more pronounced.
Using data from the U.S. Census Bureau’s 2019 American Community Survey, 24/7 Wall St. identified the 50 U.S. metro areas with the widest income gaps. Metropolitan areas are ranked by their Gini coefficient, a measure of income inequality based on the distribution of income across a population on a 0 to 1 scale — 0 representing perfect equality and 1 representing the highest possible level of inequality.
Among the metro areas on this list, Gini scores are as high as 0.541 — well above the national Gini coefficient of 0.481. The majority of metro areas on this list are located in the South, including six in Louisiana and five in each Florida and Georgia.
Causes behind rising inequality are complex and varied. A report published by the National Bureau of Economic Research ties the rising disparity to a range of economic factors, including globalization, technological advancement, a stagnant minimum wage, and the decline of labor unions.
Click here to see America’s metro with the widest income gaps
Click here to read our detailed methodology

50. Greenville, NC
> Gini index: 0.481
> Avg. household income, top 20%: $185,849 — 166th lowest of 384 metros
> Avg. household income, bottom 20%: $10,937 — 57th lowest of 384 metros
> Share of all income in Greenville that went to top 20%: 51.3% — 55th highest of 384 metros
> Share of all income in Greenville that went to bottom 20%: 3.0% — 60th lowest of 384 metros (tied)
> Median household income: $53,401 — 101st lowest of 384 metros
[in-text-ad]

49. Chicago-Naperville-Elgin, IL-IN-WI
> Gini index: 0.481
> Avg. household income, top 20%: $267,783 — 24th highest of 384 metros
> Avg. household income, bottom 20%: $15,887 — 116th highest of 384 metros
> Share of all income in Chicago-Naperville-Elgin that went to top 20%: 51.3% — 53rd highest of 384 metros (tied)
> Share of all income in Chicago-Naperville-Elgin that went to bottom 20%: 3.0% — 66th lowest of 384 metros (tied)
> Median household income: $75,379 — 50th highest of 384 metros
[recirclink id=887395]
48. Valdosta, GA
> Gini index: 0.481
> Avg. household income, top 20%: $164,132 — 60th lowest of 384 metros
> Avg. household income, bottom 20%: $11,292 — 62nd lowest of 384 metros
> Share of all income in Valdosta that went to top 20%: 51.7% — 40th highest of 384 metros
> Share of all income in Valdosta that went to bottom 20%: 3.6% — 179th highest of 384 metros (tied)
> Median household income: $43,787 — 9th lowest of 384 metros

47. Flagstaff, AZ
> Gini index: 0.483
> Avg. household income, top 20%: $206,645 — 136th highest of 384 metros
> Avg. household income, bottom 20%: $9,935 — 31st lowest of 384 metros
> Share of all income in Flagstaff that went to top 20%: 50.9% — 69th highest of 384 metros
> Share of all income in Flagstaff that went to bottom 20%: 2.5% — 9th lowest of 384 metros (tied)
> Median household income: $58,085 — 176th lowest of 384 metros
[in-text-ad-2]

46. Cheyenne, WY
> Gini index: 0.483
> Avg. household income, top 20%: $248,185 — 43rd highest of 384 metros
> Avg. household income, bottom 20%: $14,492 — 170th highest of 384 metros
> Share of all income in Cheyenne that went to top 20%: 51.9% — 35th highest of 384 metros (tied)
> Share of all income in Cheyenne that went to bottom 20%: 3.0% — 63rd lowest of 384 metros (tied)
> Median household income: $70,567 — 70th highest of 384 metros

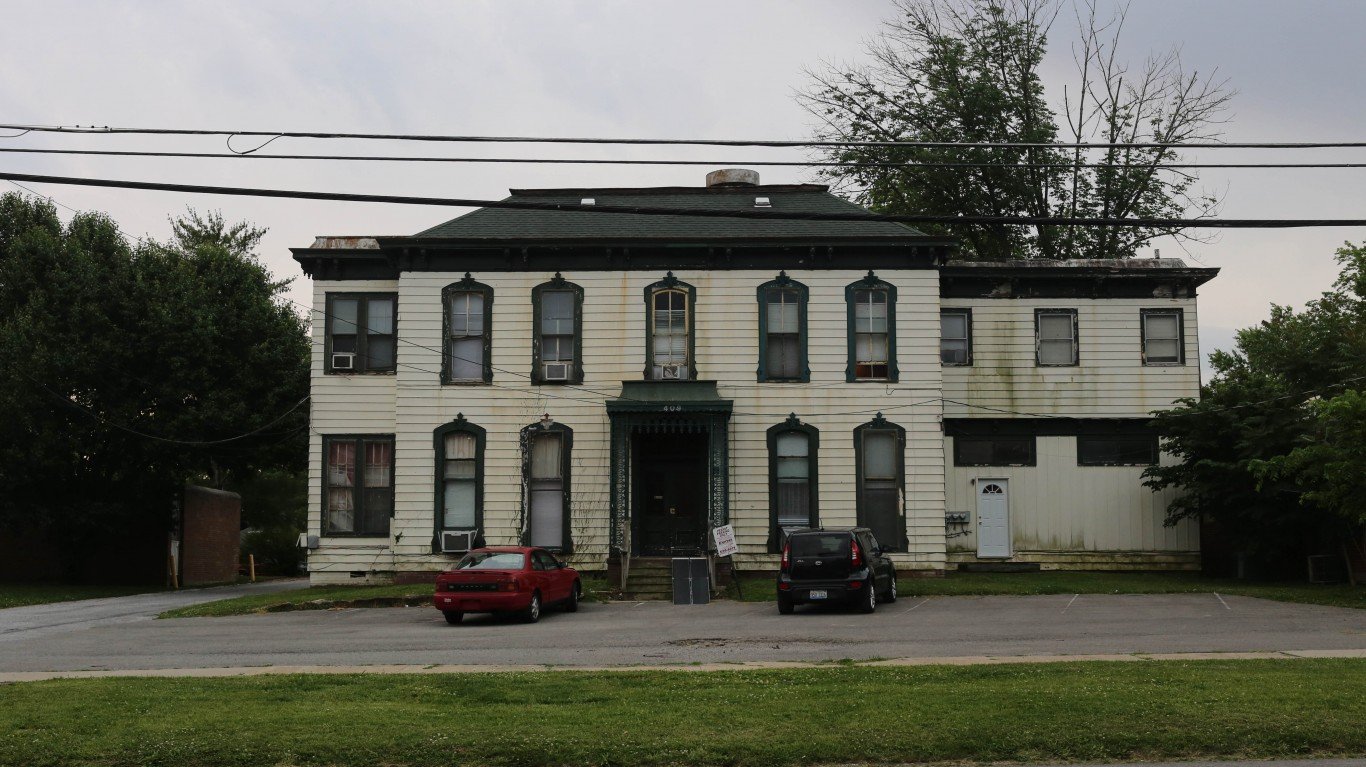
45. Decatur, IL
> Gini index: 0.483
> Avg. household income, top 20%: $177,312 — 118th lowest of 384 metros
> Avg. household income, bottom 20%: $8,467 — 7th lowest of 384 metros
> Share of all income in Decatur that went to top 20%: 50.9% — 67th highest of 384 metros
> Share of all income in Decatur that went to bottom 20%: 2.4% — 8th lowest of 384 metros
> Median household income: $50,839 — 73rd lowest of 384 metros
[in-text-ad]

44. Santa Cruz-Watsonville, CA
> Gini index: 0.484
> Avg. household income, top 20%: $324,729 — 10th highest of 384 metros
> Avg. household income, bottom 20%: $19,112 — 31st highest of 384 metros
> Share of all income in Santa Cruz-Watsonville that went to top 20%: 51.5% — 44th highest of 384 metros (tied)
> Share of all income in Santa Cruz-Watsonville that went to bottom 20%: 3.0% — 63rd lowest of 384 metros (tied)
> Median household income: $89,269 — 9th highest of 384 metros
[recirclink id=848904]

43. Houston-The Woodlands-Sugar Land, TX
> Gini index: 0.484
> Avg. household income, top 20%: $257,308 — 35th highest of 384 metros
> Avg. household income, bottom 20%: $15,995 — 114th highest of 384 metros
> Share of all income in Houston-The Woodlands-Sugar Land that went to top 20%: 51.9% — 35th highest of 384 metros (tied)
> Share of all income in Houston-The Woodlands-Sugar Land that went to bottom 20%: 3.2% — 98th lowest of 384 metros (tied)
> Median household income: $69,193 — 80th highest of 384 metros

42. Akron, OH
> Gini index: 0.484
> Avg. household income, top 20%: $210,348 — 119th highest of 384 metros
> Avg. household income, bottom 20%: $13,279 — 156th lowest of 384 metros
> Share of all income in Akron that went to top 20%: 52.1% — 33rd highest of 384 metros
> Share of all income in Akron that went to bottom 20%: 3.3% — 112th lowest of 384 metros (tied)
> Median household income: $57,158 — 155th lowest of 384 metros
[in-text-ad-2]
41. Carbondale-Marion, IL
> Gini index: 0.484
> Avg. household income, top 20%: $170,596 — 89th lowest of 384 metros
> Avg. household income, bottom 20%: $9,571 — 21st lowest of 384 metros
> Share of all income in Carbondale-Marion that went to top 20%: 51.1% — 60th highest of 384 metros
> Share of all income in Carbondale-Marion that went to bottom 20%: 2.9% — 36th lowest of 384 metros (tied)
> Median household income: $46,882 — 21st lowest of 384 metros

40. Houma-Thibodaux, LA
> Gini index: 0.486
> Avg. household income, top 20%: $180,959 — 141st lowest of 384 metros
> Avg. household income, bottom 20%: $10,412 — 40th lowest of 384 metros
> Share of all income in Houma-Thibodaux that went to top 20%: 51.0% — 65th highest of 384 metros (tied)
> Share of all income in Houma-Thibodaux that went to bottom 20%: 2.9% — 48th lowest of 384 metros (tied)
> Median household income: $49,874 — 56th lowest of 384 metros
[in-text-ad]

39. San Francisco-Oakland-Berkeley, CA
> Gini index: 0.486
> Avg. household income, top 20%: $412,625 — 3rd highest of 384 metros
> Avg. household income, bottom 20%: $21,755 — 10th highest of 384 metros
> Share of all income in San Francisco-Oakland-Berkeley that went to top 20%: 51.6% — 41st highest of 384 metros
> Share of all income in San Francisco-Oakland-Berkeley that went to bottom 20%: 2.7% — 24th lowest of 384 metros (tied)
> Median household income: $114,696 — 2nd highest of 384 metros
[recirclink id=850383]

38. Hilton Head Island-Bluffton, SC
> Gini index: 0.486
> Avg. household income, top 20%: $274,582 — 19th highest of 384 metros
> Avg. household income, bottom 20%: $18,573 — 44th highest of 384 metros
> Share of all income in Hilton Head Island-Bluffton that went to top 20%: 52.9% — 21st highest of 384 metros
> Share of all income in Hilton Head Island-Bluffton that went to bottom 20%: 3.6% — 165th highest of 384 metros (tied)
> Median household income: $71,252 — 63rd highest of 384 metros

37. Saginaw, MI
> Gini index: 0.487
> Avg. household income, top 20%: $185,495 — 165th lowest of 384 metros
> Avg. household income, bottom 20%: $12,684 — 127th lowest of 384 metros
> Share of all income in Saginaw that went to top 20%: 52.7% — 25th highest of 384 metros
> Share of all income in Saginaw that went to bottom 20%: 3.6% — 162nd highest of 384 metros (tied)
> Median household income: $48,303 — 31st lowest of 384 metros
[in-text-ad-2]

36. Lafayette, LA
> Gini index: 0.487
> Avg. household income, top 20%: $187,244 — 171st lowest of 384 metros
> Avg. household income, bottom 20%: $9,624 — 24th lowest of 384 metros
> Share of all income in Lafayette that went to top 20%: 51.2% — 58th highest of 384 metros
> Share of all income in Lafayette that went to bottom 20%: 2.6% — 17th lowest of 384 metros
> Median household income: $53,493 — 105th lowest of 384 metros

35. Philadelphia-Camden-Wilmington, PA-NJ-DE-MD
> Gini index: 0.487
> Avg. household income, top 20%: $271,306 — 22nd highest of 384 metros
> Avg. household income, bottom 20%: $14,969 — 148th highest of 384 metros
> Share of all income in Philadelphia-Camden-Wilmington that went to top 20%: 51.8% — 37th highest of 384 metros
> Share of all income in Philadelphia-Camden-Wilmington that went to bottom 20%: 2.9% — 35th lowest of 384 metros
> Median household income: $74,533 — 53rd highest of 384 metros
[in-text-ad]

34. Los Angeles-Long Beach-Anaheim, CA
> Gini index: 0.488
> Avg. household income, top 20%: $284,830 — 16th highest of 384 metros
> Avg. household income, bottom 20%: $15,908 — 115th highest of 384 metros
> Share of all income in Los Angeles-Long Beach-Anaheim that went to top 20%: 52.0% — 34th highest of 384 metros
> Share of all income in Los Angeles-Long Beach-Anaheim that went to bottom 20%: 2.9% — 45th lowest of 384 metros (tied)
> Median household income: $77,774 — 36th highest of 384 metros
[recirclink id=970377]

33. Morgantown, WV
> Gini index: 0.488
> Avg. household income, top 20%: $206,309 — 139th highest of 384 metros
> Avg. household income, bottom 20%: $11,157 — 59th lowest of 384 metros
> Share of all income in Morgantown that went to top 20%: 51.1% — 59th highest of 384 metros
> Share of all income in Morgantown that went to bottom 20%: 2.8% — 28th lowest of 384 metros
> Median household income: $56,395 — 143rd lowest of 384 metros
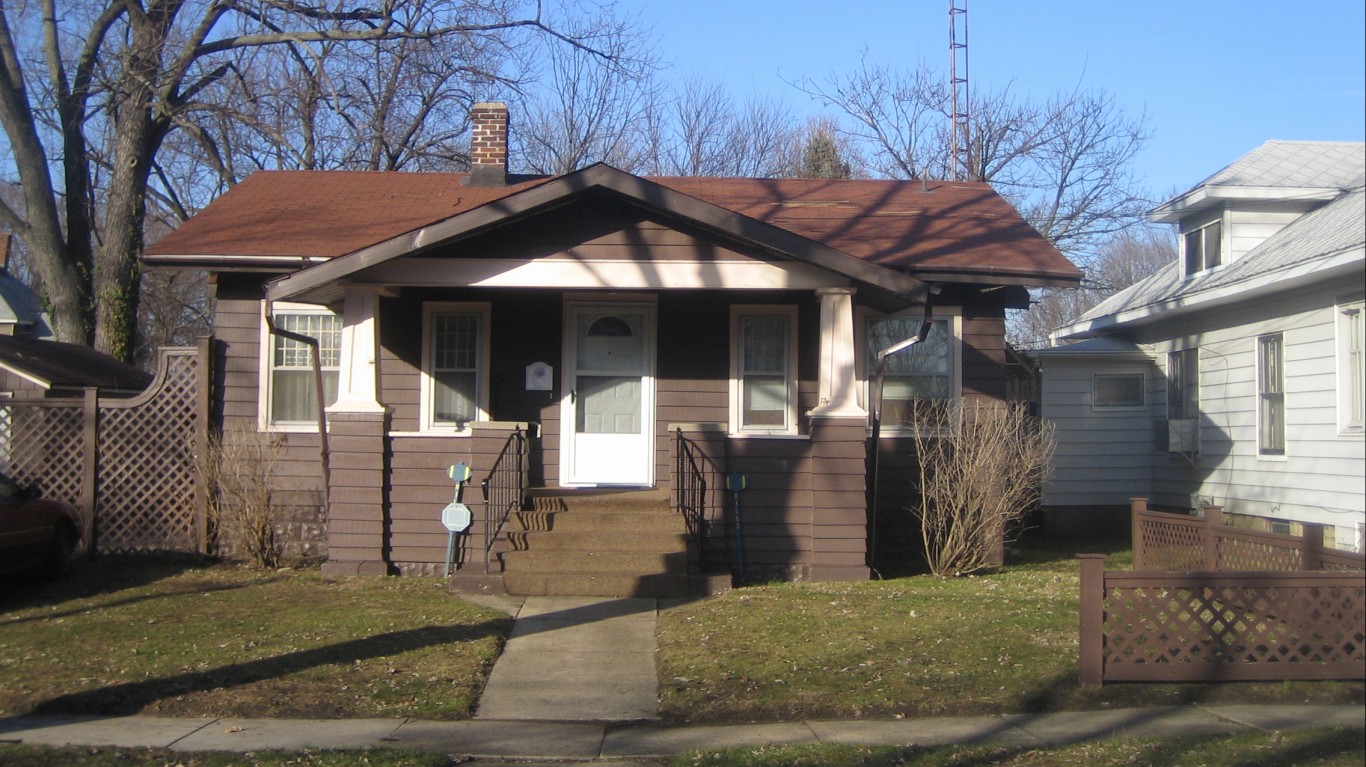
32. Niles, MI
> Gini index: 0.488
> Avg. household income, top 20%: $199,521 — 162nd highest of 384 metros
> Avg. household income, bottom 20%: $12,743 — 131st lowest of 384 metros
> Share of all income in Niles that went to top 20%: 52.2% — 29th highest of 384 metros
> Share of all income in Niles that went to bottom 20%: 3.3% — 132nd lowest of 384 metros (tied)
> Median household income: $50,153 — 61st lowest of 384 metros
[in-text-ad-2]

31. Birmingham-Hoover, AL
> Gini index: 0.488
> Avg. household income, top 20%: $213,918 — 107th highest of 384 metros
> Avg. household income, bottom 20%: $11,702 — 87th lowest of 384 metros
> Share of all income in Birmingham-Hoover that went to top 20%: 51.8% — 38th highest of 384 metros
> Share of all income in Birmingham-Hoover that went to bottom 20%: 2.8% — 34th lowest of 384 metros
> Median household income: $58,366 — 180th lowest of 384 metros
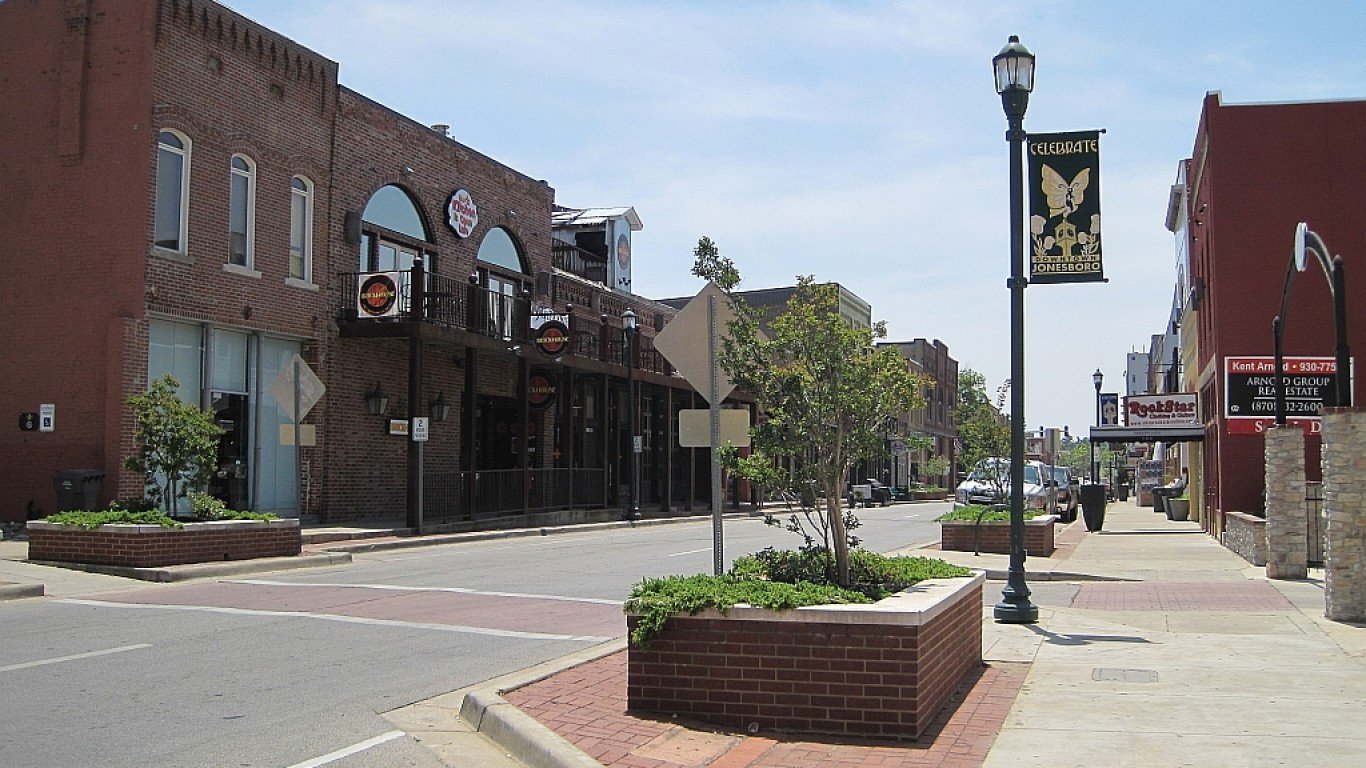
30. Jonesboro, AR
> Gini index: 0.489
> Avg. household income, top 20%: $175,155 — 111th lowest of 384 metros
> Avg. household income, bottom 20%: $11,427 — 71st lowest of 384 metros (tied)
> Share of all income in Jonesboro that went to top 20%: 52.2% — 30th highest of 384 metros
> Share of all income in Jonesboro that went to bottom 20%: 3.4% — 149th lowest of 384 metros (tied)
> Median household income: $44,998 — 13th lowest of 384 metros
[in-text-ad]

29. Johnson City, TN
> Gini index: 0.491
> Avg. household income, top 20%: $174,013 — 103rd lowest of 384 metros
> Avg. household income, bottom 20%: $10,025 — 33rd lowest of 384 metros
> Share of all income in Johnson City that went to top 20%: 52.4% — 28th highest of 384 metros
> Share of all income in Johnson City that went to bottom 20%: 3.0% — 60th lowest of 384 metros (tied)
> Median household income: $45,917 — 18th lowest of 384 metros
[recirclink id=887395]

28. Santa Fe, NM
> Gini index: 0.491
> Avg. household income, top 20%: $231,843 — 67th highest of 384 metros
> Avg. household income, bottom 20%: $13,528 — 170th lowest of 384 metros
> Share of all income in Santa Fe that went to top 20%: 52.6% — 26th highest of 384 metros
> Share of all income in Santa Fe that went to bottom 20%: 3.1% — 70th lowest of 384 metros (tied)
> Median household income: $61,298 — 155th highest of 384 metros

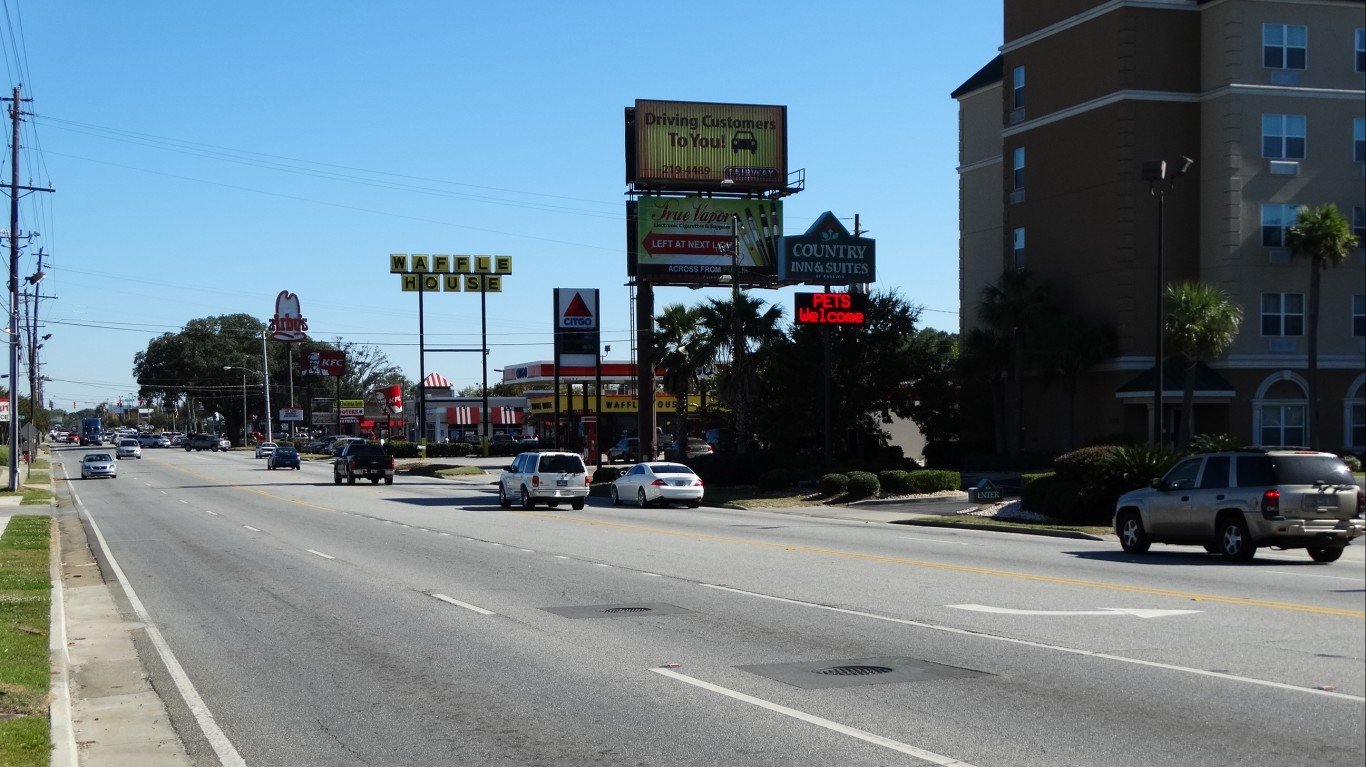
27. Tallahassee, FL
> Gini index: 0.491
> Avg. household income, top 20%: $192,237 — 189th highest of 384 metros
> Avg. household income, bottom 20%: $9,915 — 30th lowest of 384 metros
> Share of all income in Tallahassee that went to top 20%: 52.1% — 32nd highest of 384 metros
> Share of all income in Tallahassee that went to bottom 20%: 2.7% — 20th lowest of 384 metros (tied)
> Median household income: $52,729 — 97th lowest of 384 metros
[in-text-ad-2]

26. College Station-Bryan, TX
> Gini index: 0.491
> Avg. household income, top 20%: $196,734 — 170th highest of 384 metros
> Avg. household income, bottom 20%: $9,502 — 20th lowest of 384 metros
> Share of all income in College Station-Bryan that went to top 20%: 51.7% — 39th highest of 384 metros
> Share of all income in College Station-Bryan that went to bottom 20%: 2.5% — 12th lowest of 384 metros
> Median household income: $55,670 — 132nd lowest of 384 metros

25. Memphis, TN-MS-AR
> Gini index: 0.493
> Avg. household income, top 20%: $207,086 — 135th highest of 384 metros
> Avg. household income, bottom 20%: $11,723 — 88th lowest of 384 metros
> Share of all income in Memphis that went to top 20%: 52.7% — 24th highest of 384 metros
> Share of all income in Memphis that went to bottom 20%: 3.0% — 53rd lowest of 384 metros (tied)
> Median household income: $54,859 — 123rd lowest of 384 metros
[in-text-ad]

24. New Orleans-Metairie, LA
> Gini index: 0.494
> Avg. household income, top 20%: $205,316 — 144th highest of 384 metros
> Avg. household income, bottom 20%: $10,318 — 39th lowest of 384 metros
> Share of all income in New Orleans-Metairie that went to top 20%: 52.1% — 31st highest of 384 metros
> Share of all income in New Orleans-Metairie that went to bottom 20%: 2.6% — 16th lowest of 384 metros
> Median household income: $55,710 — 134th lowest of 384 metros
[recirclink id=848904]

23. Boulder, CO
> Gini index: 0.496
> Avg. household income, top 20%: $333,016 — 6th highest of 384 metros
> Avg. household income, bottom 20%: $17,144 — 76th highest of 384 metros
> Share of all income in Boulder that went to top 20%: 52.9% — 22nd highest of 384 metros
> Share of all income in Boulder that went to bottom 20%: 2.7% — 24th lowest of 384 metros (tied)
> Median household income: $88,535 — 10th highest of 384 metros

22. Santa Maria-Santa Barbara, CA
> Gini index: 0.498
> Avg. household income, top 20%: $301,969 — 13th highest of 384 metros
> Avg. household income, bottom 20%: $17,239 — 74th highest of 384 metros
> Share of all income in Santa Maria-Santa Barbara that went to top 20%: 53.6% — 14th highest of 384 metros
> Share of all income in Santa Maria-Santa Barbara that went to bottom 20%: 3.1% — 69th lowest of 384 metros
> Median household income: $75,653 — 47th highest of 384 metros
[in-text-ad-2]

21. Albany, GA
> Gini index: 0.498
> Avg. household income, top 20%: $151,751 — 26th lowest of 384 metros
> Avg. household income, bottom 20%: $8,153 — 5th lowest of 384 metros
> Share of all income in Albany that went to top 20%: 52.5% — 27th highest of 384 metros
> Share of all income in Albany that went to bottom 20%: 2.8% — 33rd lowest of 384 metros
> Median household income: $40,625 — 2nd lowest of 384 metros

20. Gainesville, FL
> Gini index: 0.498
> Avg. household income, top 20%: $182,406 — 151st lowest of 384 metros
> Avg. household income, bottom 20%: $9,125 — 17th lowest of 384 metros
> Share of all income in Gainesville that went to top 20%: 52.7% — 23rd highest of 384 metros
> Share of all income in Gainesville that went to bottom 20%: 2.6% — 18th lowest of 384 metros
> Median household income: $47,762 — 28th lowest of 384 metros
[in-text-ad]

19. Atlantic City-Hammonton, NJ
> Gini index: 0.501
> Avg. household income, top 20%: $247,992 — 45th highest of 384 metros
> Avg. household income, bottom 20%: $13,767 — 181st lowest of 384 metros
> Share of all income in Atlantic City-Hammonton that went to top 20%: 53.2% — 18th highest of 384 metros
> Share of all income in Atlantic City-Hammonton that went to bottom 20%: 3.0% — 51st lowest of 384 metros (tied)
> Median household income: $63,389 — 124th highest of 384 metros
[recirclink id=850383]
18. Gadsden, AL
> Gini index: 0.501
> Avg. household income, top 20%: $160,265 — 48th lowest of 384 metros
> Avg. household income, bottom 20%: $8,994 — 14th lowest of 384 metros
> Share of all income in Gadsden that went to top 20%: 53.5% — 16th highest of 384 metros
> Share of all income in Gadsden that went to bottom 20%: 3.0% — 56th lowest of 384 metros (tied)
> Median household income: $41,447 — 4th lowest of 384 metros

17. Sebastian-Vero Beach, FL
> Gini index: 0.501
> Avg. household income, top 20%: $235,387 — 65th highest of 384 metros
> Avg. household income, bottom 20%: $14,470 — 171st highest of 384 metros
> Share of all income in Sebastian-Vero Beach that went to top 20%: 53.7% — 13th highest of 384 metros
> Share of all income in Sebastian-Vero Beach that went to bottom 20%: 3.3% — 124th lowest of 384 metros (tied)
> Median household income: $59,782 — 189th highest of 384 metros
[in-text-ad-2]

16. Columbus, GA-AL
> Gini index: 0.502
> Avg. household income, top 20%: $188,230 — 178th lowest of 384 metros
> Avg. household income, bottom 20%: $9,747 — 26th lowest of 384 metros
> Share of all income in Columbus that went to top 20%: 53.4% — 17th highest of 384 metros
> Share of all income in Columbus that went to bottom 20%: 2.8% — 29th lowest of 384 metros
> Median household income: $49,013 — 45th lowest of 384 metros

15. Trenton-Princeton, NJ
> Gini index: 0.505
> Avg. household income, top 20%: $306,478 — 11th highest of 384 metros
> Avg. household income, bottom 20%: $12,663 — 123rd lowest of 384 metros
> Share of all income in Trenton-Princeton that went to top 20%: 53.2% — 20th highest of 384 metros
> Share of all income in Trenton-Princeton that went to bottom 20%: 2.2% — 4th lowest of 384 metros (tied)
> Median household income: $79,492 — 30th highest of 384 metros
[in-text-ad]

14. Miami-Fort Lauderdale-Pompano Beach, FL
> Gini index: 0.508
> Avg. household income, top 20%: $243,055 — 51st highest of 384 metros
> Avg. household income, bottom 20%: $12,973 — 145th lowest of 384 metros
> Share of all income in Miami-Fort Lauderdale-Pompano Beach that went to top 20%: 54.2% — 11th highest of 384 metros
> Share of all income in Miami-Fort Lauderdale-Pompano Beach that went to bottom 20%: 2.9% — 41st lowest of 384 metros (tied)
> Median household income: $60,141 — 185th highest of 384 metros
[recirclink id=970377]

13. Lake Charles, LA
> Gini index: 0.508
> Avg. household income, top 20%: $205,345 — 143rd highest of 384 metros
> Avg. household income, bottom 20%: $9,999 — 32nd lowest of 384 metros
> Share of all income in Lake Charles that went to top 20%: 53.2% — 19th highest of 384 metros
> Share of all income in Lake Charles that went to bottom 20%: 2.6% — 15th lowest of 384 metros
> Median household income: $51,547 — 82nd lowest of 384 metros

12. Vineland-Bridgeton, NJ
> Gini index: 0.509
> Avg. household income, top 20%: $221,977 — 83rd highest of 384 metros
> Avg. household income, bottom 20%: $11,949 — 96th lowest of 384 metros
> Share of all income in Vineland-Bridgeton that went to top 20%: 53.6% — 15th highest of 384 metros
> Share of all income in Vineland-Bridgeton that went to bottom 20%: 2.9% — 39th lowest of 384 metros (tied)
> Median household income: $54,587 — 119th lowest of 384 metros
[in-text-ad-2]

11. New York-Newark-Jersey City, NY-NJ-PA
> Gini index: 0.512
> Avg. household income, top 20%: $332,127 — 7th highest of 384 metros
> Avg. household income, bottom 20%: $15,052 — 144th highest of 384 metros
> Share of all income in New York-Newark-Jersey City that went to top 20%: 54.0% — 12th highest of 384 metros
> Share of all income in New York-Newark-Jersey City that went to bottom 20%: 2.5% — 9th lowest of 384 metros (tied)
> Median household income: $83,160 — 21st highest of 384 metros (tied)
10. Iowa City, IA
> Gini index: 0.516
> Avg. household income, top 20%: $263,386 — 30th highest of 384 metros
> Avg. household income, bottom 20%: $12,732 — 130th lowest of 384 metros
> Share of all income in Iowa City that went to top 20%: 54.9% — 7th highest of 384 metros
> Share of all income in Iowa City that went to bottom 20%: 2.7% — 19th lowest of 384 metros
> Median household income: $63,761 — 119th highest of 384 metros
[in-text-ad]

9. Macon-Bibb County, GA
> Gini index: 0.517
> Avg. household income, top 20%: $199,221 — 163rd highest of 384 metros
> Avg. household income, bottom 20%: $9,016 — 15th lowest of 384 metros
> Share of all income in Macon-Bibb County that went to top 20%: 54.6% — 9th highest of 384 metros
> Share of all income in Macon-Bibb County that went to bottom 20%: 2.5% — 11th lowest of 384 metros
> Median household income: $48,435 — 34th lowest of 384 metros
[recirclink id=887395]

8. Shreveport-Bossier City, LA
> Gini index: 0.520
> Avg. household income, top 20%: $188,523 — 180th lowest of 384 metros
> Avg. household income, bottom 20%: $8,025 — 2nd lowest of 384 metros
> Share of all income in Shreveport-Bossier City that went to top 20%: 54.3% — 10th highest of 384 metros
> Share of all income in Shreveport-Bossier City that went to bottom 20%: 2.3% — 6th lowest of 384 metros
> Median household income: $47,447 — 24th lowest of 384 metros

7. Chico, CA
> Gini index: 0.521
> Avg. household income, top 20%: $253,472 — 37th highest of 384 metros
> Avg. household income, bottom 20%: $12,420 — 112th lowest of 384 metros
> Share of all income in Chico that went to top 20%: 55.3% — 5th highest of 384 metros
> Share of all income in Chico that went to bottom 20%: 2.7% — 23rd lowest of 384 metros
> Median household income: $62,563 — 135th highest of 384 metros
[in-text-ad-2]

6. Athens-Clarke County, GA
> Gini index: 0.521
> Avg. household income, top 20%: $213,996 — 104th highest of 384 metros
> Avg. household income, bottom 20%: $10,452 — 43rd lowest of 384 metros
> Share of all income in Athens-Clarke County that went to top 20%: 55.2% — 6th highest of 384 metros
> Share of all income in Athens-Clarke County that went to bottom 20%: 2.7% — 22nd lowest of 384 metros
> Median household income: $50,962 — 75th lowest of 384 metros

5. Auburn-Opelika, AL
> Gini index: 0.525
> Avg. household income, top 20%: $213,783 — 108th highest of 384 metros
> Avg. household income, bottom 20%: $8,129 — 4th lowest of 384 metros
> Share of all income in Auburn-Opelika that went to top 20%: 54.8% — 8th highest of 384 metros
> Share of all income in Auburn-Opelika that went to bottom 20%: 2.1% — 2nd lowest of 384 metros (tied)
> Median household income: $53,712 — 109th lowest of 384 metros
[in-text-ad]

4. Monroe, LA
> Gini index: 0.535
> Avg. household income, top 20%: $172,389 — 98th lowest of 384 metros
> Avg. household income, bottom 20%: $6,765 — the lowest of 384 metros
> Share of all income in Monroe that went to top 20%: 56.1% — 4th highest of 384 metros
> Share of all income in Monroe that went to bottom 20%: 2.2% — 4th lowest of 384 metros (tied)
> Median household income: $40,136 — the lowest of 384 metros
[recirclink id=848904]

3. Naples-Marco Island, FL
> Gini index: 0.538
> Avg. household income, top 20%: $351,019 — 4th highest of 384 metros
> Avg. household income, bottom 20%: $17,462 — 66th highest of 384 metros
> Share of all income in Naples-Marco Island that went to top 20%: 57.7% — the highest of 384 metros
> Share of all income in Naples-Marco Island that went to bottom 20%: 2.9% — 36th lowest of 384 metros (tied)
> Median household income: $76,025 — 44th highest of 384 metros

2. Ithaca, NY
> Gini index: 0.539
> Avg. household income, top 20%: $264,640 — 27th highest of 384 metros
> Avg. household income, bottom 20%: $9,613 — 23rd lowest of 384 metros
> Share of all income in Ithaca that went to top 20%: 57.2% — 3rd highest of 384 metros
> Share of all income in Ithaca that went to bottom 20%: 2.1% — 2nd lowest of 384 metros (tied)
> Median household income: $58,626 — 185th lowest of 384 metros
[in-text-ad-2]

1. Bridgeport-Stamford-Norwalk, CT
> Gini index: 0.541
> Avg. household income, top 20%: $459,737 — the highest of 384 metros
> Avg. household income, bottom 20%: $19,234 — 29th highest of 384 metros
> Share of all income in Bridgeport-Stamford-Norwalk that went to top 20%: 57.6% — 2nd highest of 384 metros
> Share of all income in Bridgeport-Stamford-Norwalk that went to bottom 20%: 2.4% — 7th lowest of 384 metros
> Median household income: $97,053 — 4th highest of 384 metros
Methodology
To determine the metropolitan areas with the widest income gaps in the nation, 24/7 Wall St. reviewed one-year estimates of the Gini Index of income inequality from the U.S. Census Bureau’s 2019 American Community Survey.
The Gini Index of income inequality summarizes income dispersion in an area on a scale from 0 to 1. A value of 0 indicates perfect equality — everyone in the area receives an equal share of income. A value of 1 indicates perfect inequality — only one recipient receives all the income.
We used the 384 metropolitan statistical areas as delineated by the United States Office of Management and Budget and used by the Census Bureau as our definition of metros.
Metros were ranked based on their Gini Index. To break ties, we used the share of aggregate household income earned by the top 20% of households.
Additional information on average household income by quintile, share of aggregate household income by quintile, and median household income are also one-year estimates from the 2019 ACS.
Contact [email protected] for any questions or corrections.