Blizzards across the eastern two-thirds of the United States have steadily increased in frequency over the last century. Due to accelerating changes to the climate, including rising ocean surface temperatures (which leads to more moisture in the air) and reduction in Arctic sea ice (which can affect the jet stream), as well as natural variability, the increase in severe winter storms, especially in the eastern U.S., is expected to continue.
If there was any reminder of how disruptive winter storms can be it was the storm that snarled traffic along Route 95 in Virginia for a day the first week in January with motorists stuck in their cars for 24 hours or longer. And that wasn’t even considered a major snow event. So you can imagine what a really bad blizzard would cause.
Unlike hurricanes and earthquakes, there is no widely used scale or index for assessing the impact of snowstorms. In recent years, however, the meteorological community has made several successful attempts to establish a standard for measuring the impact of extreme snow events that can be used to compare snowstorms over time. (These are the most powerful hurricanes of all time.)
The Regional Snowfall Index, introduced in 2014, ranks a snowstorm impact on a scale of 1 to 5 using data on a storm’s area of snowfall, the amount of snowfall, and the population affected. The RSI has since been used to retroactively classify nearly 600 snowstorms that occurred between 1900 and 2013.
To determine the worst blizzards of all time, 24/7 Wall St. ranked snowstorms based on their Regional Snowfall Index values, published by the National Oceanic and Atmospheric Administration’s National Centers for Environmental Information.
Click here to see the worst blizzards of all time
We included the 25 snowstorms designated as Category 5 since 1900. Data on duration, region, affected area, and affected population also came from the NOAA. 24/7 Wall St. combined data on affected area and population for Category 5 storms that spanned multiple regions, considering it one event. Storm names, as well as measures of snowfall in the affected areas, came from various news and media sources. (These are the places with the biggest snowfalls in history in every state.)
25. The Chicago Blizzard of 1967
> RSI score: 18.13
> Duration: Jan 25th – Jan 29th
> Region: Ohio Valley
> Affected area: 286,503 square miles
> Population affected: 46.1 million
> Notable snowfall: 23 inches (Chicago, Illinois)
As the snow began to fall on Jan. 26th, most Chicagoans were able to make it to school and work. The commute home, however, was a disaster. As eight inches of snow blanketed the city by noon, transportation systems shut down and commuters were left stranded in their cars, or their offices or in a hotel, if they could find a room. By the 28th, the city had dug itself out from the blizzard, but more than 60 people died in what was termed the most disruptive event in the city’s history since the Great Chicago Fire of 1871.
[in-text-ad]

24. The Great Atlanta Blizzard
> RSI score: 18.14
> Duration: Jan 21st, 1940 – Jan 24th, 1940
> Region: Southeast
> Affected area: 214,946 square miles
> Population affected: 35.6 million
> Notable snowfall: 21.6 inches (Richmond, Virginia)
Although Atlanta has been known to weather an occasional snowstorm, the city was hit with a paralyzing blizzard in January of 1940. Instead of the typical two to four inches of snow dumped on the city by an average Atlanta storm, the Great Atlanta Blizzard covered the Southern capital with more than 10 inches of the white stuff, closing schools and transportation and downing power lines. But in Virginia, Farmville was hit even worse by the same storm â the town 55 miles southwest of Richmond was buried in 24 inches of snow.
[recirclink id=823036]
23. The Blizzard of 1978
> RSI score: 18.42
> Duration: Feb 4th – Feb 8th
> Region: Northeast
> Affected area: 174,950 square miles
> Population affected: 58.9 million
> Notable snowfall: 55 inches (Lincoln, Rhode Island)
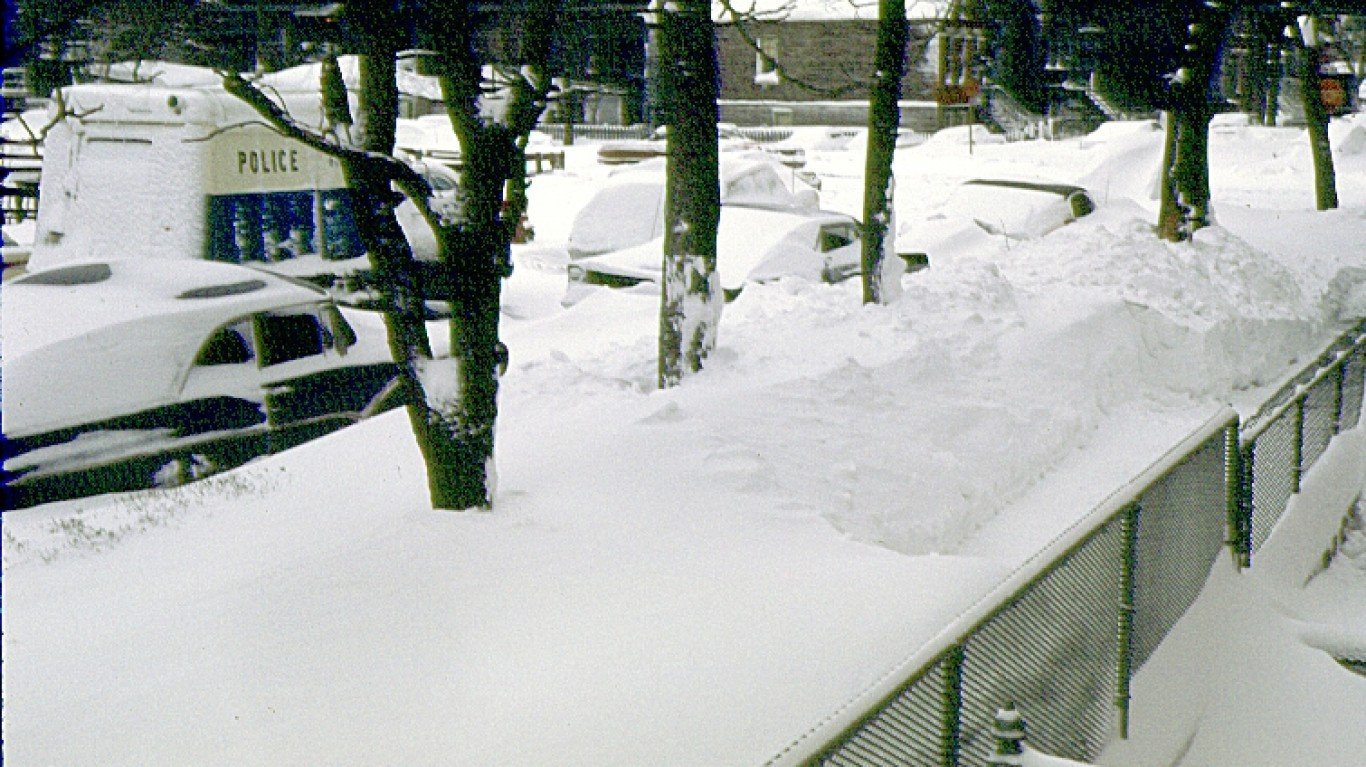
The Blizzard of 1978 stretched from New England to New York, New Jersey, and Pennsylvania. Snow totals ranged from 27 inches in Boston to 16 inches in Philadelphia. About 100 people died,10,000 sought emergency shelter, and more than 2,000 homes were destroyed or severely damaged, including many along the New England and Long Island coastline. All told, the storm caused $520 million in damages, which equates to almost $2.2 billion in 2021 dollars.

22. The Knickerbocker Storm
> RSI score: 18.53
> Duration: Jan 26th, 1922 – Jan 30th, 1922
> Region: Southeast
> Affected area: 150,041 square miles
> Population affected: 30.1 million
> Notable snowfall: 28 inches (Washington, D.C.)
The Knickerbocker Storm got its name from a tragic event related to the blizzard. So much snow fell on the Knickerbocker Theatre in Washington, D.C. that the roof collapsed, killing 98 people and injuring 133 at about 9 p.m. on Jan. 28. The nation’s capital took the brunt of the accumulation with a blanket of 28 inches, but Maryland and Virginia were also covered with heavy snow.
[in-text-ad-2]

21. The Blizzard of 1971
> RSI score: 19.36
> Duration: Feb 19th – Feb 24th
> Region: South
> Affected area: 261,324 square miles
> Population affected: 10.5 million
> Notable snowfall: N/A
Not known for significant snowstorms, northwestern Oklahoma was inundated with 36 inches in the town of Buffalo, creating 20-foot high snow drifts. Yet nearby cities in the Oklahoma Panhandle received light snow of only two to three inches. Thousands of head of livestock were lost in the storm, but the precipitation gave the parched area some relief.

20. The 2009 Christmas Blizzard
> RSI score: 19.62
> Duration: Dec 22nd – Dec 29th
> Region: Northern Rockies and Plains
> Affected area: 466,690 square miles
> Population affected: 4.8 million
> Notable snowfall: 15.7 inches (Osceola, Nebraska)
Residents of the Northern Rockies and Plains states got their wish for a white Christmas when the area was struck by a Category 5 or “extreme” event on the Regional Snowfall Index Scale, leaving travelers stranded during a busy holiday week. Hardest hit was South Dakota, where more than 30 inches of snow fell. Minnesota received 26 inches. The storm reportedly claimed 21 lives.
[in-text-ad]

19. The Blizzard of 1966
> RSI score: 20.38
> Duration: Feb 28th – Mar 6th
> Region: Northern Rockies and Plains
> Affected area: 466,796 square miles
> Population affected: 4.8 million
> Notable snowfall: 30.5 inches (Devils Lake, North Dakota)
Prior to the 2009 Christmas Blizzard, the Northern Plains endured another hellish snowstorm. Snowfall reached up to 38 inches, with drifts as high as 40 feet in some locations. Across the Great Plains, 18 people reportedly died and tens of thousands of livestock perished. Businesses, schools, and transportation were halted for days as power lines were destroyed.
[recirclink id=1007286]
18. The Blizzard of 1920
> RSI score: 20.84
> Duration: Apr 15th – Apr 19th
> Region: Northern Rockies and Plains
> Affected area: 350,813 square miles
> Population affected: 2.4 million
> Notable snowfall: 28.3 inches (Denver, Colorado)
The Blizzard of 1920 buried parts of northern Colorado under two to three feet of snow. But as the Berthoud Bulletin described the event, the snow started to fall early one Saturday morning and continued until Sunday night. By Monday, the dig-out had started and life resumed as normal soon afterwards.

17. The Historic Texas Snowstorm
> RSI score: 21.13
> Duration: Dec 19th, 1929 – Dec 24th, 1929
> Region: South
> Affected area: 380,488 square miles
> Population affected: 31.2 million
> Notable snowfall: 26 inches (Hillsboro, Texas)
December 1929 in northern Texas started warmly with temperatures in the 60s and 70s. Yet the weather took a severe turn on December 17, when temperatures plunged to a frigid 40º. Although the height of the storm lasted only 24 hours, some cities recorded more than 20 inches of snow. The highest total was in Hillsboro, where 26 inches fell – a record for a 24-hour snowfall in the Lone Star State that still stands today.
[in-text-ad-2]
16. The Blizzard of 1943
> RSI score: 21.14
> Duration: Jan 19th – Jan 26th
> Region: Northern Rockies and Plains
> Affected area: 358,424 square miles
> Population affected: 3.1 million
> Notable snowfall: 14.4 inches (Portland, Oregon)
In early 1943, people in the Northern Rockies were enjoying a relatively mild winter with average temperatures of 33º – which for that part of the country qualifies as mild. Yet a Category 5 storm blanketed areas of Montana, Wyoming, Nebraska, North Dakota, and South Dakota in the latter half of January.
15. The Groundhog Day Blizzard
> RSI score: 21.99
> Duration: Jan 31st, 2011 – Feb 2nd, 2011
> Region: Ohio Valley
> Affected area: 241,595 square miles
> Population affected: 41.3 million
> Notable snowfall: 23.5 inches (Racine, Wisconsin)
Covering a large swath of the Midwest, the Groundhog Day Blizzard of 2011 reached into New Mexico and northern Texas and into Eastern Canada. The snow began to fall on Jan. 31, and didn’t let up until Feb. 2. Wisconsin was particularly hard hit, with snow totals reaching nearly 24 inches in some places.
[in-text-ad]

14. The Blizzard of 1993
> RSI score: 22.00
> Duration: Nov 21st – Nov 29th
> Region: Northern Rockies and Plains
> Affected area: 468,083 square miles
> Population affected: 4.8 million
> Notable snowfall: N/A
A blizzard is never welcome any time of year, but when it occurs around a busy holiday travel season its effects are even worse. In late November of 1993, a storm swept across the Upper Midwest, dumping massive amounts of snow in South Dakota and Minnesota. Westport, South Dakota weathered the highest total at 32 inches.
[recirclink id=987613]

13. The Post-Thanksgiving Day Storm
> RSI score: 22.19
> Duration: Nov 28th, 1985 – Dec 2nd, 1985
> Region: Upper Midwest
> Affected area: 251,618 square miles
> Population affected: 23.9 million
> Notable snowfall: 30 inches (Marquette, Wisconsin)
Late 1985 brought snow and freezing temperatures to the Upper Midwest and Northern Plains in this post-Thanksgiving Day blizzard, with a foot of snow and winds of 40 miles per in some areas. Yet the blizzard didn’t stop a match between the Green Bay Packers and Tampa Bay Buccaneers played in a driving snowstorm at Lambeau. Green Bay won.

12. The Blizzard of 1988
> RSI score: 22.64
> Duration: Jan 5th – Jan 9th
> Region: South
> Affected area: 369,821 square miles
> Population affected: 22.3 million
> Notable snowfall: 20 inches (Macon County, North Carolina)
The Blizzard of 1988 covered a swath of land from Oklahoma to North Carolina, with the Carolina mountains covered in 16 inches of snow. Chattanooga, Tennessee and Huntsville, Alabama, received more than 10 inches each of powdery snow.
[in-text-ad-2]

11. The Blizzard of 1927 (Southeastern United States)
> RSI score: 24.42
> Duration: Feb 27th – Mar 3rd
> Region: Southeast
> Affected area: 142,285 square miles
> Population affected: 26.5 million
> Notable snowfall: 30-40 inches (Wilson, North Carolina)
A mild winter across the U.S. was interrupted when a severe snowstorm hit the South in late February. On March 2, Raleigh, North Carolina recorded a historic 17.8 inches in just one day — a record that stood until 2000. According to local reports at the time, Asheville received seven inches, Greensboro 20 inches, and Fayetteville more than two feet.

10. The Storm of the Century
> RSI score: 24.43
> Duration: Mar 12th, 1993 – Mar 15th, 1993
> Region: Southeast
> Affected area: 551,948 square miles
> Population affected: 120.8 million
> Notable snowfall: 56 inches (Mount LeConte, Tennessee)
The Storm of the Century, also known as the Superstorm of 1993, was one of the most costly and deadliest weather disasters of the 20th century. It cut across the South and up along the East Coast to Maine. Snow totals ranged from nearly 60 inches in Mount LeConte, Tennessee, to less than an inch in Raleigh, North Carolina. The storm led to more than 300 deaths and $2 billion in damages in 1993 dollars — equivalent to almost $3.7 billion today.
[in-text-ad]
9. The Blizzard of 1984
> RSI score: 25.95
> Duration: Apr 24th – Apr 28th
> Region: Northern Rockies and Plains
> Affected area: 418,380 square miles
> Population affected: 3.1 million
> Notable snowfall: 24 inches (Campbell County, Wyoming)
A rare springtime blizzard left parts of the Northern Rockies and Plains buried under four feet of snow. The storm also produced tornadoes that crashed into homes and businesses in the Plains. An AP report quoted snowplow drivers saying the snow was so high it was like driving through a brick wall.
[recirclink id=823036]

8. The Blizzard of 1996
> RSI score: 26.37
> Duration: Jan 6th – Jan 9th
> Region: Southeast
> Affected area: 331,486 square miles
> Population affected: 89.5 million
> Notable snowfall: 26.6 inches (Baltimore, Maryland)
Snow began to fall on Washington, D.C. on January 6, and soon the storm moved up the Eastern Seaboard. Newark, New Jersey, was hit with 28 inches, while Providence, Rhode Island, received 32 inches and Philadelphia 30 inches. When it was all over, 154 people had lost their lives and the region suffered $1 billion in damages.

7. The Great Cold Outbreak of 1985
> RSI score: 27.06
> Duration: Feb 7th – Feb 15th
> Region: Upper Midwest
> Affected area: 252,012 square miles
> Population affected: 23.9 million
> Notable snowfall: N/A
Severe cold temperatures affected every state east of the Rockies and reached down into the deep South with Mt. Mitchell, North Carolina frozen under -34 degrees. Florida’s citrus industry suffered $2.5 billion in losses from the “freeze of the century.”
[in-text-ad-2]

6. The Halloween Blizzard of 1991
> RSI score: 30.18
> Duration: Oct 31st – Nov 4th
> Region: Upper Midwest
> Affected area: 251,176 square miles
> Population affected: 23.5 million
> Notable snowfall: 28 inches (Twin Cities, Minnesota)
The Upper Midwest was spooked by a blizzard on Halloween Day of 1991, with heavy snowfall and ice. Duluth, Minnesota, received nearly 37 inches of snow, a record that held until 1994. Interesting fact: The same weather pattern that began in the Northeast and was the basis for the book “The Perfect Storm,” about the tragic sinking of a fishing vessel off the Nova Scotia coast, was responsible for the Halloween Day blizzard.

5. The Blizzard of 1921
> RSI score: 31.89
> Duration: Feb 18th – Feb 22nd
> Region: South
> Affected area: 256,548 square miles
> Population affected: 16.7 million
> Notable snowfall: 30 inches (Mount Vernon, Arkansas)
The Regional Snowfall Index (RSI), a NOAA-developed system to assess the impact of snowstorms in different regions of the U.S., ranked this blizzard as a Category 5, or extreme, event — one of only 26 storms so classified since 1900. Arkansas bore the brunt of the storm, with Mount Vernon accumulating 30 inches of snow and six other communities getting at least two feet. The state capital, Little Rock, got off comparatively lightly with 11.6 inches of snow and 1.5 inches of sleet.
[in-text-ad]

4. The 100-Hour Snowstorm of February 1969
> RSI score: 34.03
> Duration: Feb 22nd – Feb 28th
> Region: Northeast
> Affected area: 174,950 square miles
> Population affected: 58.9 million
> Notable snowfall: 77 inches (Coos County, New Hampshire)
Boston took a direct hit from the “100-Hour Storm” in late February 1969. Logan Airport was covered by more than 26 inches. More than 70 inches fell at Pinkham Notch Base Station in New Hampshire.
[recirclink id=1007286]

3. The Blizzard of 1927, Northern Rockies
> RSI score: 34.20
> Duration: Apr 10th – Apr 15th
> Region: Northern Rockies and Plains
> Affected area: 335,119 square miles
> Population affected: 2.1 million
> Notable snowfall: 25.8 inches (Scottsbluff, Nebraska)
No further information is available about this storm.

2. The Great Appalachian Storm of 1950
> RSI score: 34.69
> Duration: Nov 22nd – Nov 30th
> Region: Ohio Valley
> Affected area: 308,845 square miles
> Population affected: 49.2 million
> Notable snowfall: 57 inches (Central Appalachia)
On Thanksgiving weekend, the Central Appalachians weathered a massive storm, part blizzard, part hurricane. Colburn Creek, West Virginia, had to dig out from under 62 inches of snow. Eastern Kentucky was also hard hit with more than a foot of snow. The storm impacted 22 states, with hurricane force winds felt as far north as New Hampshire. The death total reached more than 300.
[in-text-ad-2]

1. The White Hurricane
> RSI score: 39.07
> Duration: Jan 23rd, 1978 – Jan 28th, 1978
> Region: Upper Midwest
> Affected area: 233,580 square miles
> Population affected: 23.6 million
> Notable snowfall: 12.9 inches (Dayton, Ohio)
The Ohio Valley and Great Lakes region endured one its worst winter storms in late January of 1978. In addition to massive snow totals, the storm whipped up near-hurricane strength winds, earning the event its “White Hurricane” moniker. Ohio bore the brunt of the bad weather, with 51 people dying in that state. But across the area businesses, schools, and transportation were closed for days.
Contact [email protected] for any questions or corrections.