Getting a driver’s license is a rite of passage for American teens. It’s also dangerous. According to the Centers for Disease Control and Prevention (CDC), the risk of motor vehicle crashes is higher among teens than among any other age group. Per mile driven, teen drivers are nearly three times as likely as drivers aged 20 or older to be in a fatal crash.
Some teens are at more risk than others. The motor vehicle death rate for male drivers is more than twice as high as that for female drivers of the same age, says the CDC. Also at high risk are newly licensed teens and teen passengers driving with teens.
Because risk also varies from state to state, 24/7 Wall St. has compiled a list of the best and worst states for teenage drivers by reviewing data gathered by the credit reporting and advice site WalletHub based on three key dimensions: safety, economic environment, and driving laws. The site evaluated those factors based on 23 relevant metrics, variously weighted, in order to rank each state according to conditions for teenage drivers (the higher the score, the more favorable the conditions). Among the metrics were teen “under the influence” violations per 100,000, share of teens texting or emailing while driving, quality of roads, maximum cost of a speeding ticket, and average cost of car repairs. (These are the worst cities to get your car fixed.)
Teen driver fatality statistics come from the National Highway Traffic Safety Administration’s Fatality and Injury Reporting System, and teen population figures (ages 15-19) were drawn from the U.S. Census Bureau’s 2019 American Community Survey one-year estimates.
It may not come as a surprise to learn that the best-performing state is New York. That may be in part because it’s home to the largest city in the nation, where many teens live near their schools and places of work and where public transportation is the default choice for many. (Around the country, these are the safest cities for driving.)
Click here to see the best and worst states for teen drivers
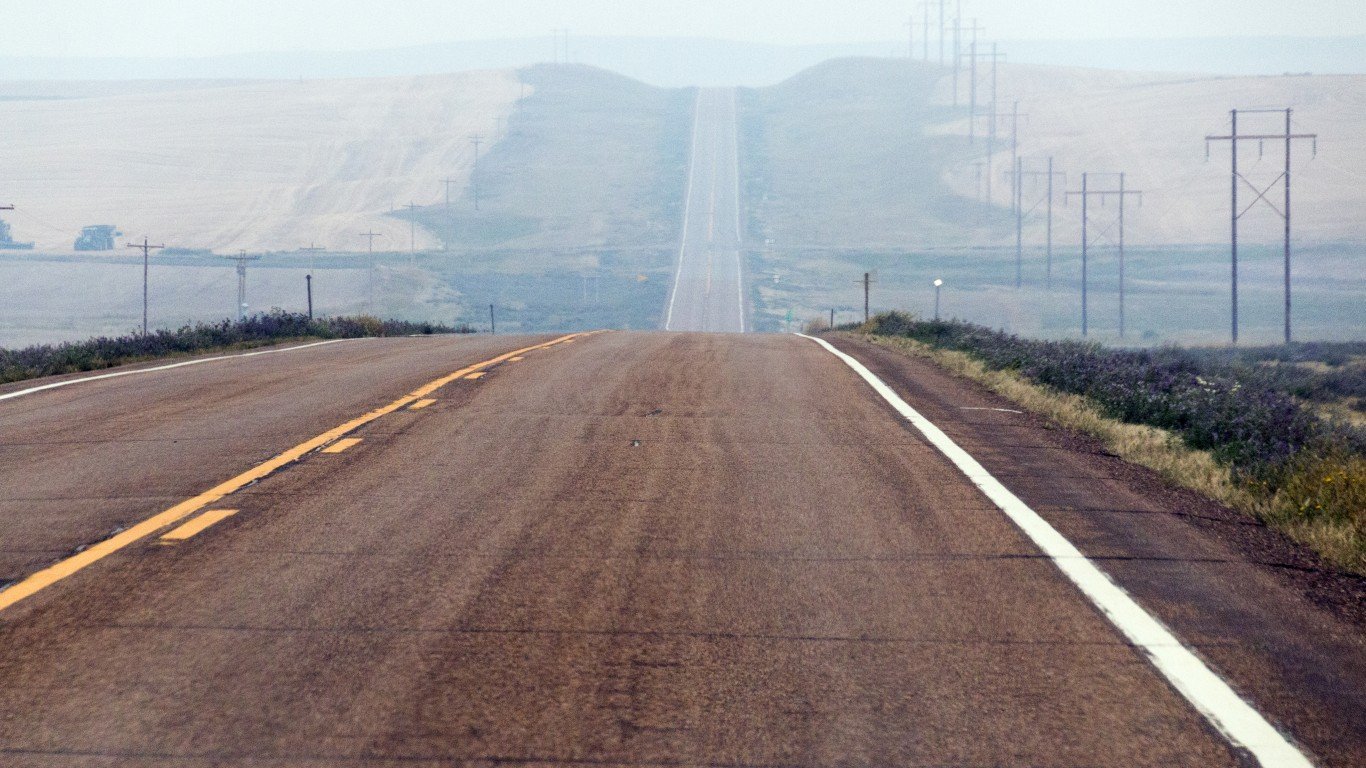
At the other end of the spectrum is Wyoming, a relatively thinly populated state synonymous with wide open spaces. It has the smallest teenage population in the country, but one of the highest rates of teen driver fatalities.
50. Wyoming
> Wallet Hub score: 34.68
> Top metric: Economic Environment (#37 in the nation)
> Teen driver fatalities per 100,000 teens: 33.7 — 4th highest
> Teenage population (ages 15-19): 38,611 — the lowest
[in-text-ad]

49. Idaho
> Wallet Hub score: 35.64
> Top metric: Driving Laws (#37 in the nation)
> Teen driver fatalities per 100,000 teens: 21.5 — 20th highest
> Teenage population (ages 15-19): 125,543 — 13th lowest
[recirclink id=866927]
48. South Dakota
> Wallet Hub score: 38.62
> Top metric: Economic Environment (#22 in the nation)
> Teen driver fatalities per 100,000 teens: 24.1 — 14th highest
> Teenage population (ages 15-19): 57,976 — 5th lowest
47. Montana
> Wallet Hub score: 38.77
> Top metric: Economic Environment (#27 in the nation)
> Teen driver fatalities per 100,000 teens: 41.4 — the highest
> Teenage population (ages 15-19): 70,013 — 7th lowest
[in-text-ad-2]

46. Missouri
> Wallet Hub score: 40.61
> Top metric: Economic Environment (#24 in the nation)
> Teen driver fatalities per 100,000 teens: 26.1 — 11th highest
> Teenage population (ages 15-19): 398,235 — 18th highest

45. Mississippi
> Wallet Hub score: 42.34
> Top metric: Economic Environment (#11 in the nation)
> Teen driver fatalities per 100,000 teens: 32.1 — 6th highest
> Teenage population (ages 15-19): 214,658 — 19th lowest
[in-text-ad]

44. Nebraska
> Wallet Hub score: 43.63
> Top metric: Economic Environment (#23 in the nation)
> Teen driver fatalities per 100,000 teens: 23.5 — 15th highest
> Teenage population (ages 15-19): 131,674 — 14th lowest
[recirclink id=863633]
43. Arkansas
> Wallet Hub score: 43.83
> Top metric: Economic Environment (#6 in the nation)
> Teen driver fatalities per 100,000 teens: 29.7 — 7th highest
> Teenage population (ages 15-19): 205,446 — 18th lowest
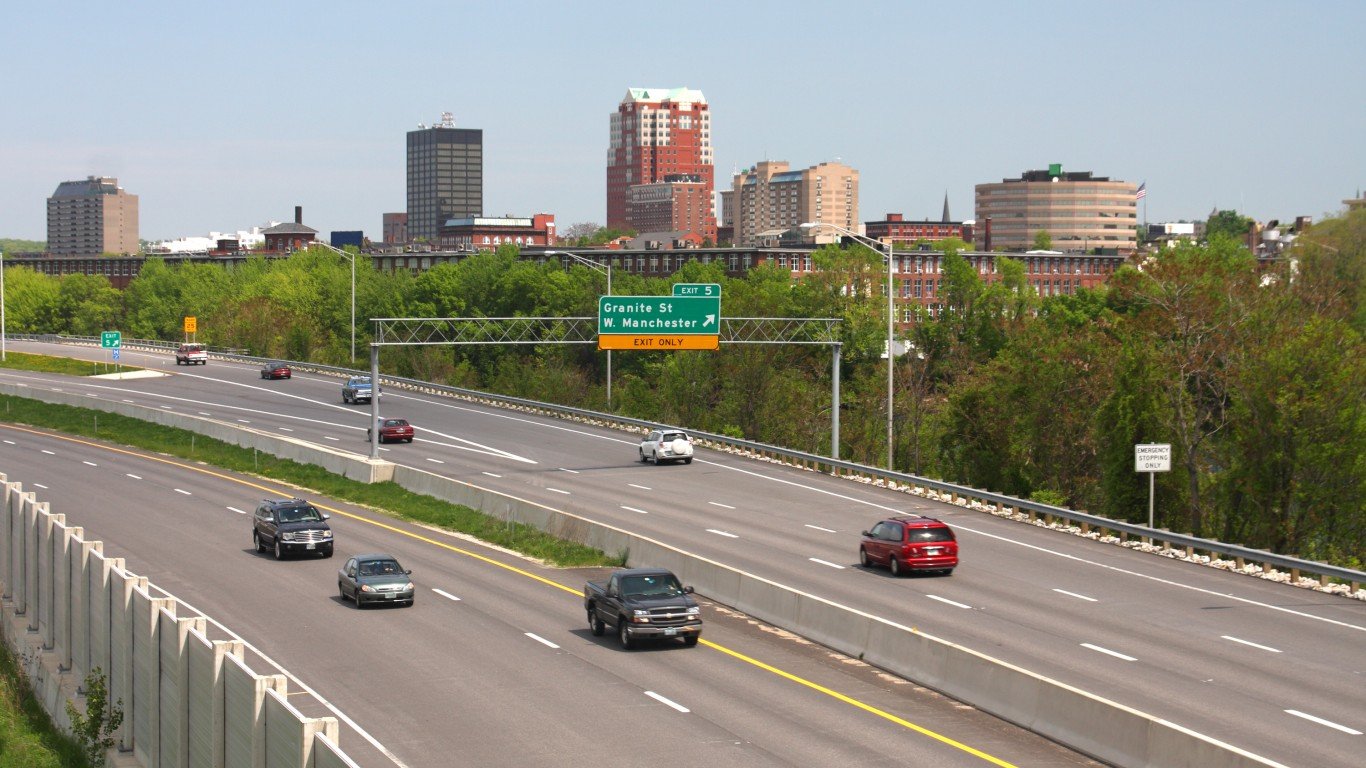
42. New Hampshire
> Wallet Hub score: 44.49
> Top metric: Economic Environment (#28 in the nation)
> Teen driver fatalities per 100,000 teens: 9.2 — 4th lowest
> Teenage population (ages 15-19): 87,386 — 11th lowest
[in-text-ad-2]
41. South Carolina
> Wallet Hub score: 44.75
> Top metric: Driving Laws (#31 in the nation)
> Teen driver fatalities per 100,000 teens: 26.5 — 10th highest
> Teenage population (ages 15-19): 339,558 — 23rd highest
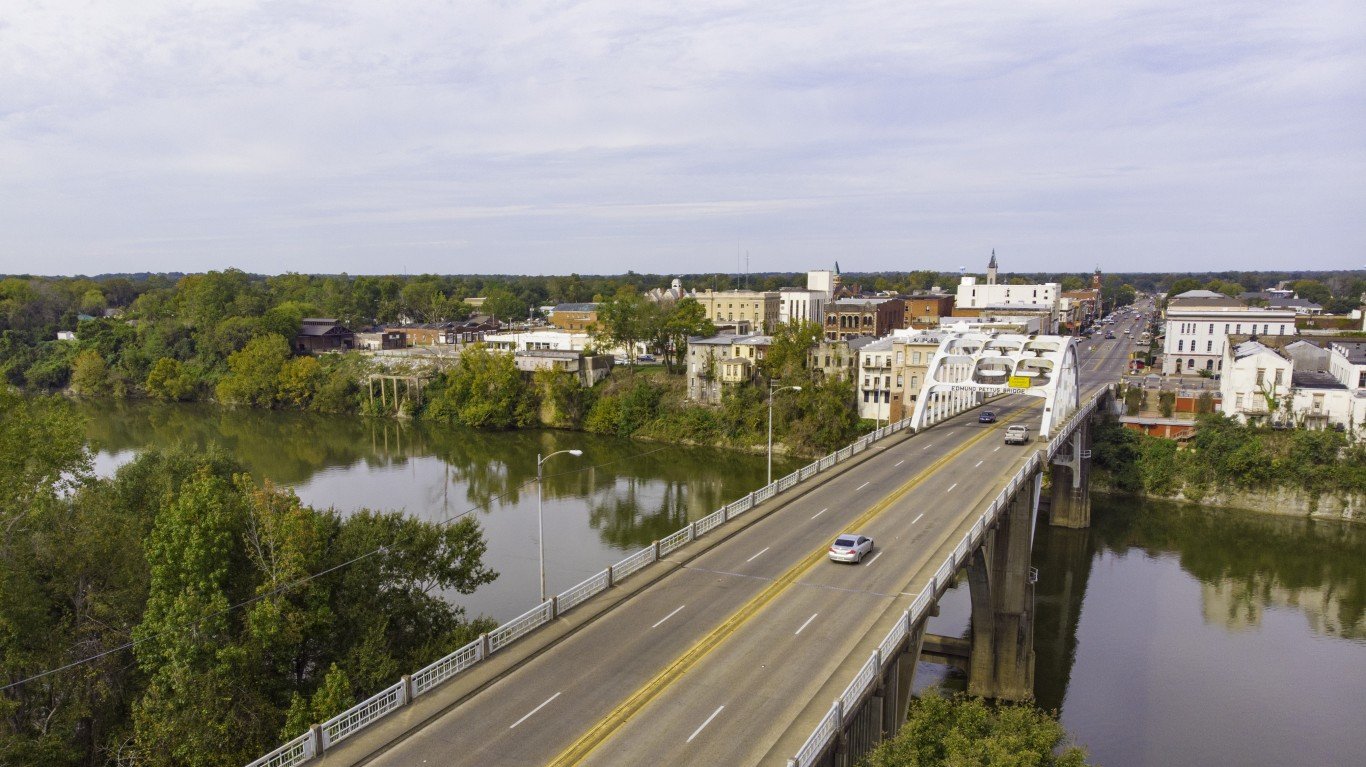
40. Alabama
> Wallet Hub score: 45.59
> Top metric: Driving Laws (#14 in the nation)
> Teen driver fatalities per 100,000 teens: 34.6 — 3rd highest
> Teenage population (ages 15-19): 326,671 — 24th highest
[in-text-ad]

39. Nevada
> Wallet Hub score: 46.77
> Top metric: Safety (#22 in the nation)
> Teen driver fatalities per 100,000 teens: 14.6 — 18th lowest
> Teenage population (ages 15-19): 184,666 — 16th lowest
[recirclink id=806734]
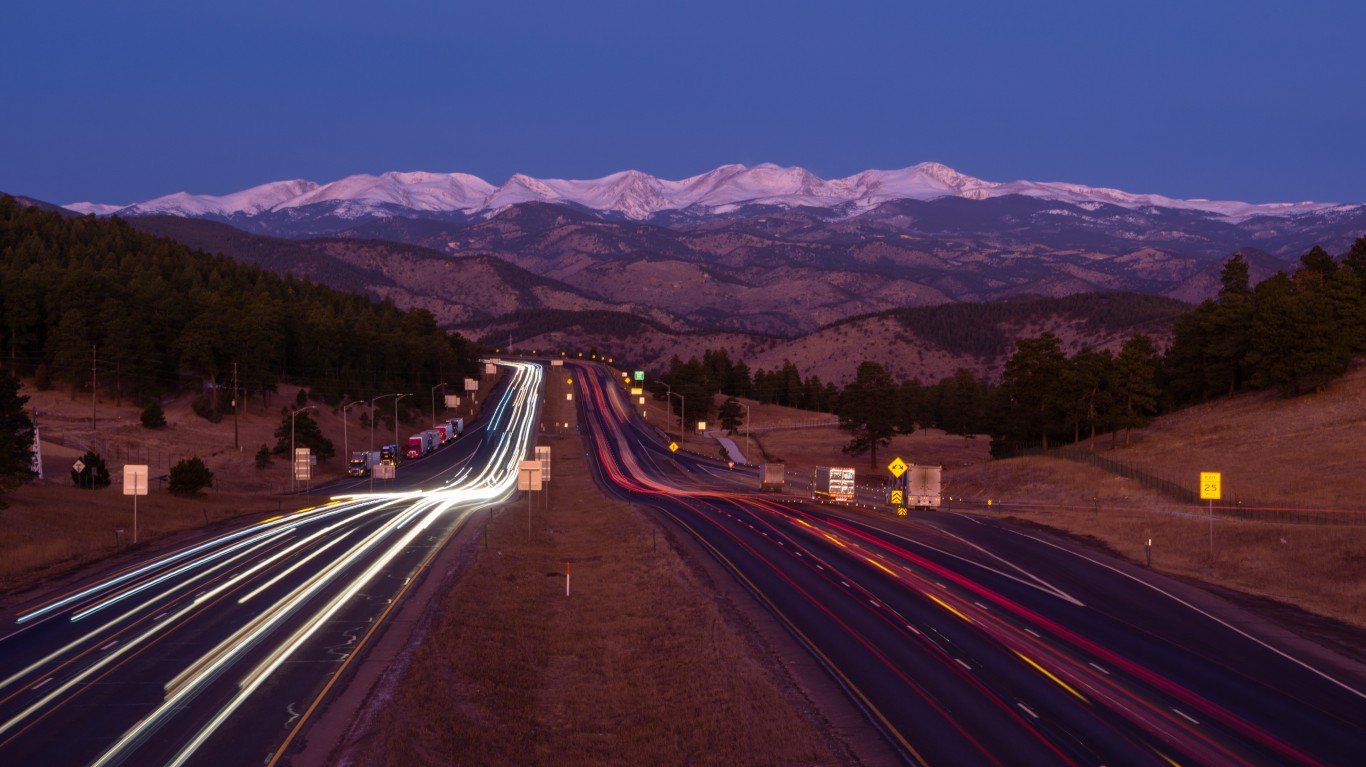
38. Colorado
> Wallet Hub score: 47.48
> Top metric: Driving Laws (#12 in the nation)
> Teen driver fatalities per 100,000 teens: 19.4 — 25th lowest
> Teenage population (ages 15-19): 365,529 — 21st highest

37. Arizona
> Wallet Hub score: 47.56
> Top metric: Driving Laws (#18 in the nation)
> Teen driver fatalities per 100,000 teens: 18.4 — 22nd lowest
> Teenage population (ages 15-19): 483,546 — 13th highest
[in-text-ad-2]

36. Indiana
> Wallet Hub score: 47.57
> Top metric: Economic Environment (#16 in the nation)
> Teen driver fatalities per 100,000 teens: 19.4 — 24th lowest
> Teenage population (ages 15-19): 464,953 — 14th highest

35. California
> Wallet Hub score: 47.99
> Top metric: Safety (#8 in the nation)
> Teen driver fatalities per 100,000 teens: 13.5 — 13th lowest
> Teenage population (ages 15-19): 2,547,449 — the highest
[in-text-ad]
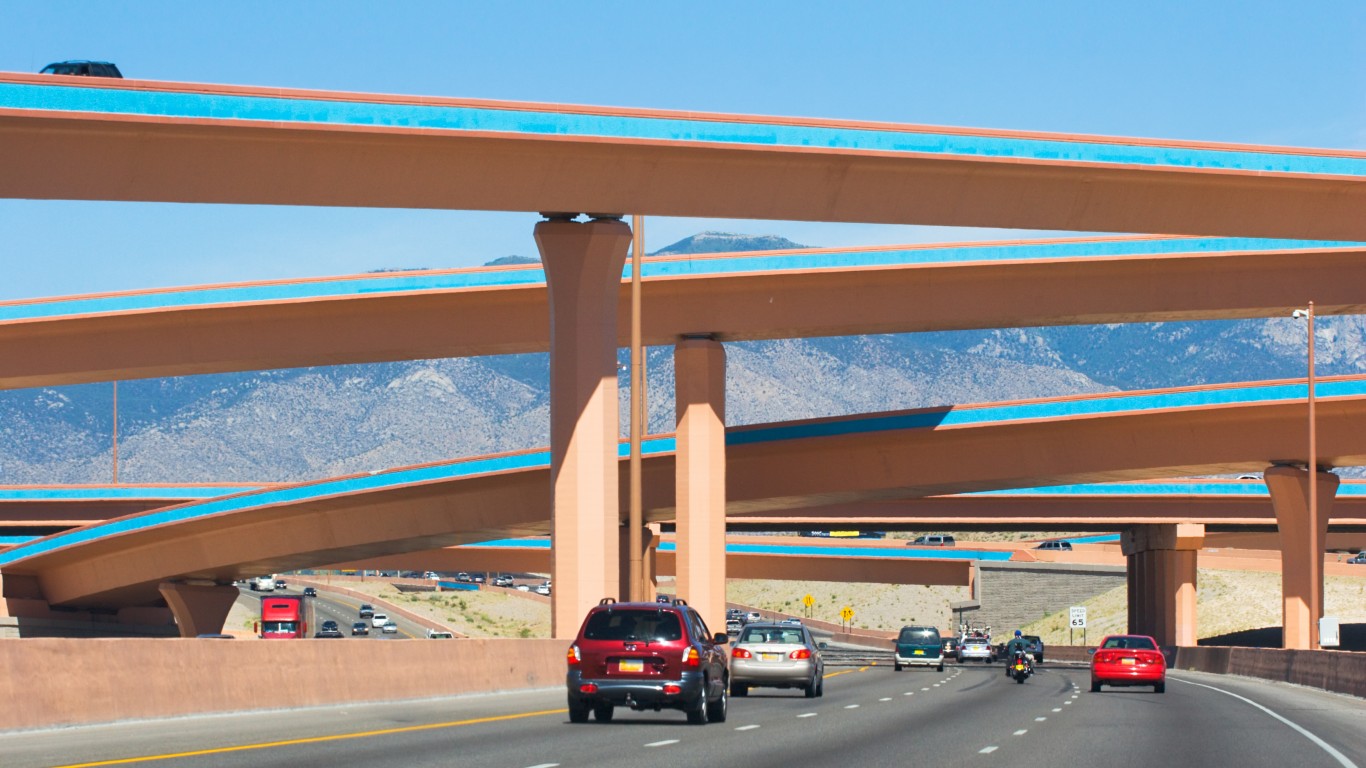
34. New Mexico
> Wallet Hub score: 48.68
> Top metric: Driving Laws (#7 in the nation)
> Teen driver fatalities per 100,000 teens: 37.4 — 2nd highest
> Teenage population (ages 15-19): 139,186 — 15th lowest
[recirclink id=912562]
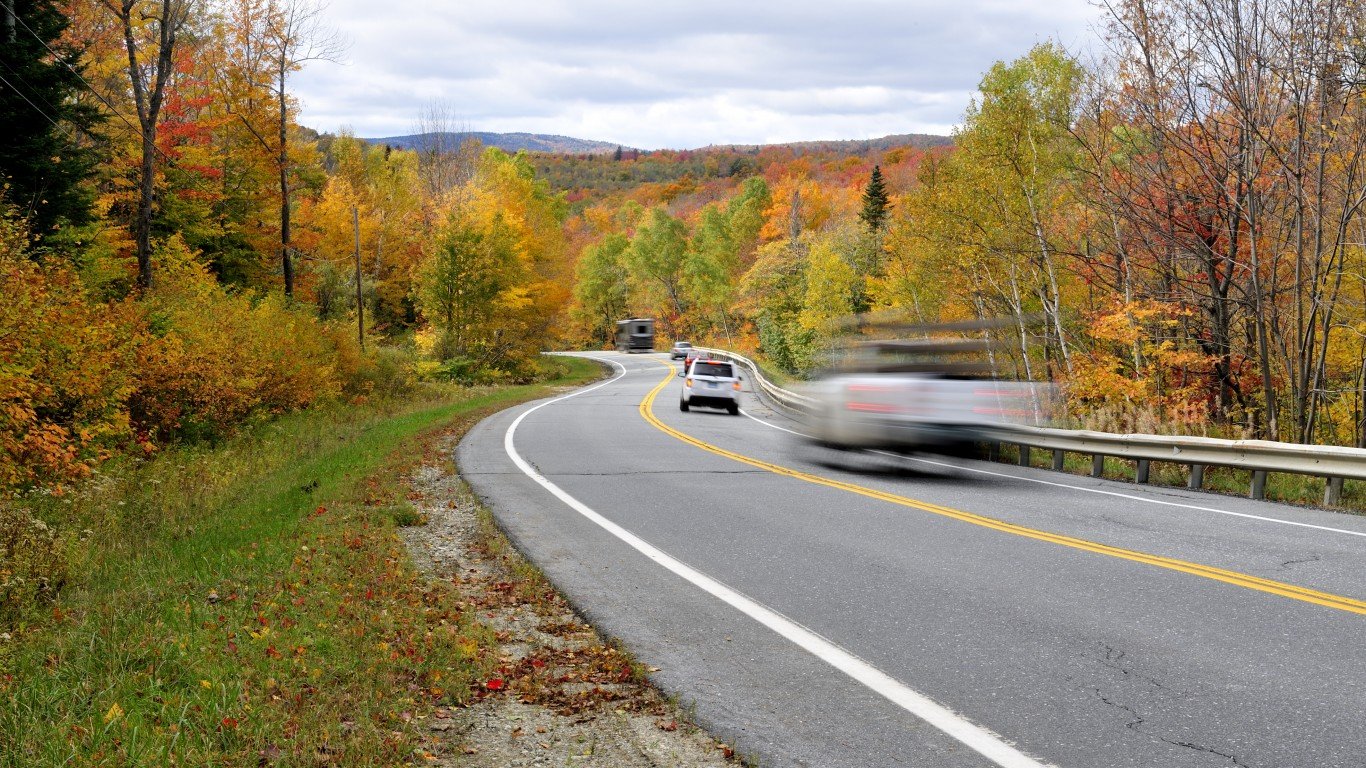
33. Vermont
> Wallet Hub score: 48.77
> Top metric: Economic Environment (#13 in the nation)
> Teen driver fatalities per 100,000 teens: 9.3 — 5th lowest
> Teenage population (ages 15-19): 43,161 — 2nd lowest

32. Tennessee
> Wallet Hub score: 48.83
> Top metric: Driving Laws (#8 in the nation)
> Teen driver fatalities per 100,000 teens: 32.9 — 5th highest
> Teenage population (ages 15-19): 435,235 — 17th highest
[in-text-ad-2]
31. Utah
> Wallet Hub score: 48.92
> Top metric: Driving Laws (#15 in the nation)
> Teen driver fatalities per 100,000 teens: 12.5 — 10th lowest
> Teenage population (ages 15-19): 255,453 — 23rd lowest
30. Iowa
> Wallet Hub score: 49.79
> Top metric: Economic Environment (#15 in the nation)
> Teen driver fatalities per 100,000 teens: 15.4 — 20th lowest
> Teenage population (ages 15-19): 214,686 — 20th lowest
[in-text-ad]
29. Kansas
> Wallet Hub score: 50.17
> Top metric: Economic Environment (#7 in the nation)
> Teen driver fatalities per 100,000 teens: 24.6 — 13th highest
> Teenage population (ages 15-19): 198,860 — 17th lowest
[recirclink id=802364]

28. Virginia
> Wallet Hub score: 50.38
> Top metric: Safety (#9 in the nation)
> Teen driver fatalities per 100,000 teens: 13.7 — 14th lowest
> Teenage population (ages 15-19): 555,996 — 11th highest

27. Georgia
> Wallet Hub score: 51.33
> Top metric: Safety (#10 in the nation)
> Teen driver fatalities per 100,000 teens: 21.3 — 22nd highest
> Teenage population (ages 15-19): 746,150 — 8th highest
[in-text-ad-2]

26. West Virginia
> Wallet Hub score: 51.43
> Top metric: Driving Laws (#11 in the nation)
> Teen driver fatalities per 100,000 teens: 21.9 — 18th highest
> Teenage population (ages 15-19): 109,763 — 12th lowest

25. Wisconsin
> Wallet Hub score: 51.50
> Top metric: Economic Environment (#18 in the nation)
> Teen driver fatalities per 100,000 teens: 20.0 — 24th highest
> Teenage population (ages 15-19): 380,127 — 20th highest
[in-text-ad]
24. Pennsylvania
> Wallet Hub score: 51.86
> Top metric: Safety (#24 in the nation)
> Teen driver fatalities per 100,000 teens: 15.2 — 19th lowest
> Teenage population (ages 15-19): 803,486 — 6th highest
[recirclink id=866927]
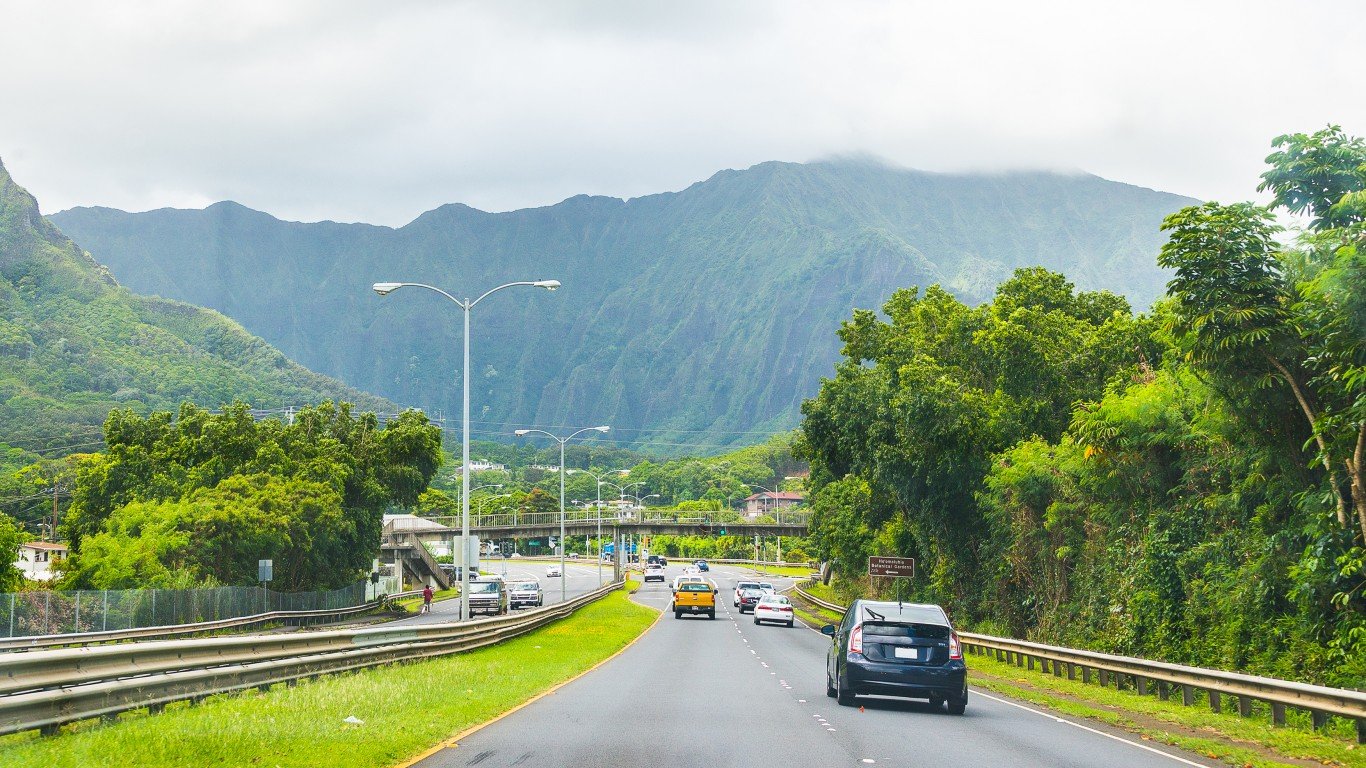
23. Hawaii
> Wallet Hub score: 52.66
> Top metric: Driving Laws (#22 in the nation)
> Teen driver fatalities per 100,000 teens: 14.2 — 16th lowest
> Teenage population (ages 15-19): 77,697 — 9th lowest
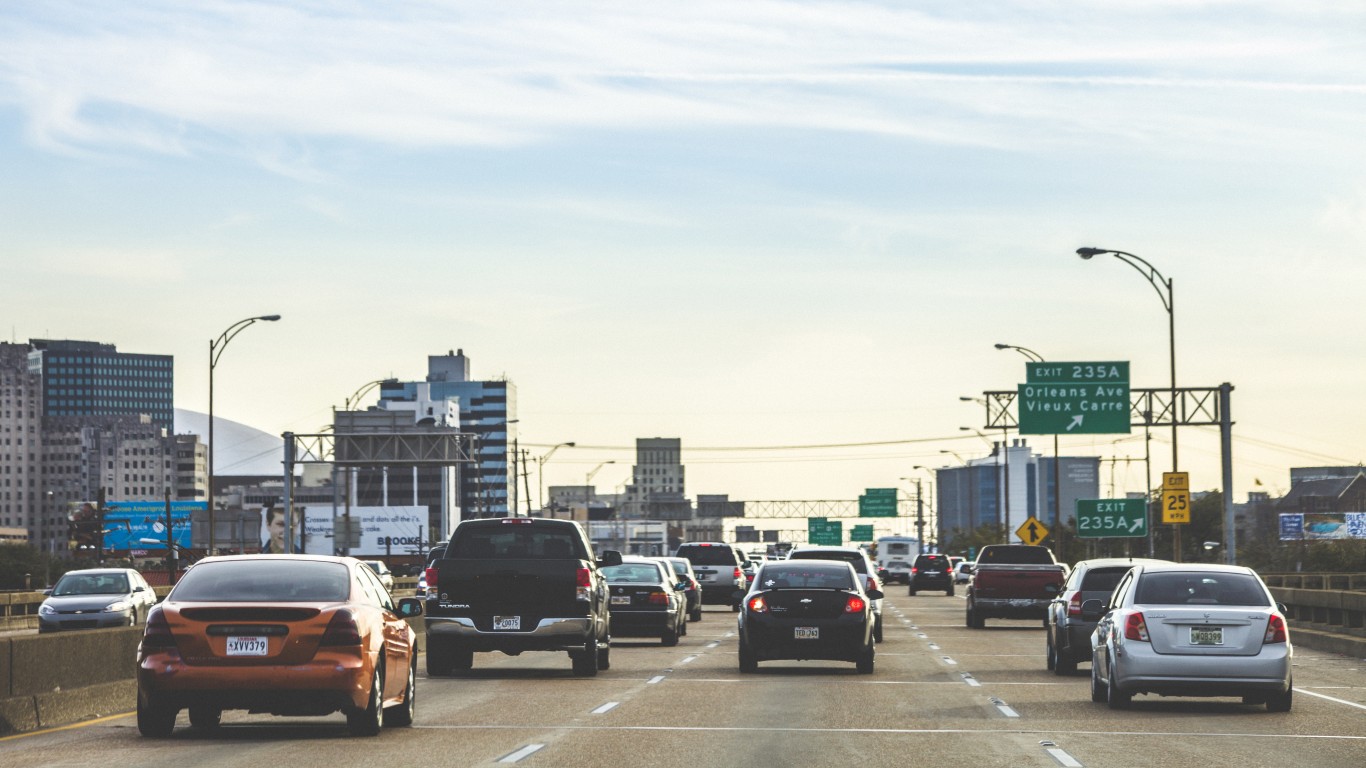
22. Louisiana
> Wallet Hub score: 52.97
> Top metric: Driving Laws (#3 in the nation)
> Teen driver fatalities per 100,000 teens: 25.5 — 12th highest
> Teenage population (ages 15-19): 301,712 — 25th highest
[in-text-ad-2]
21. North Dakota
> Wallet Hub score: 53.43
> Top metric: Safety (#16 in the nation)
> Teen driver fatalities per 100,000 teens: 19.2 — 23rd lowest
> Teenage population (ages 15-19): 46,933 — 4th lowest

20. Rhode Island
> Wallet Hub score: 54.07
> Top metric: Driving Laws (#9 in the nation)
> Teen driver fatalities per 100,000 teens: 4.2 — the lowest
> Teenage population (ages 15-19): 71,713 — 8th lowest
[in-text-ad]

19. Delaware
> Wallet Hub score: 54.52
> Top metric: Driving Laws (#4 in the nation)
> Teen driver fatalities per 100,000 teens: 23.0 — 16th highest
> Teenage population (ages 15-19): 60,766 — 6th lowest
[recirclink id=863633]
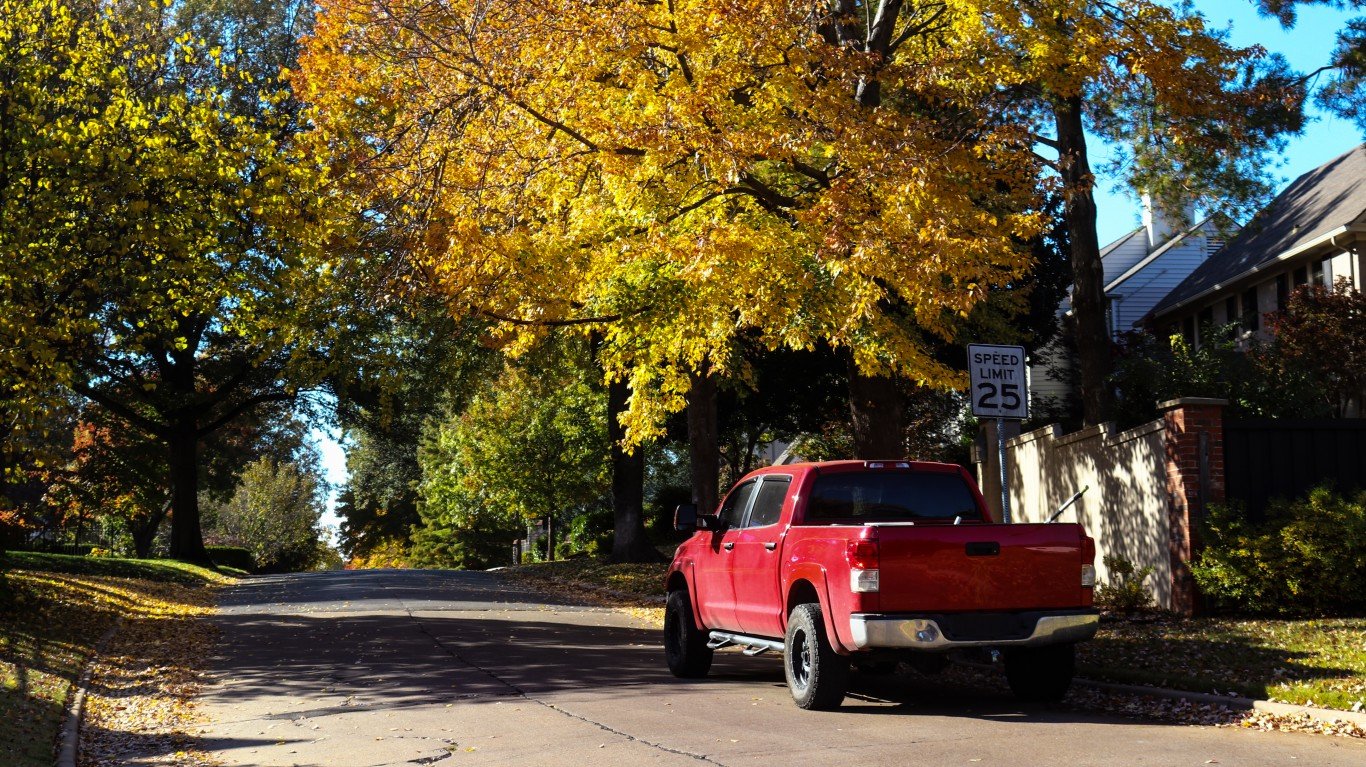
18. Oklahoma
> Wallet Hub score: 54.74
> Top metric: Economic Environment (#3 in the nation)
> Teen driver fatalities per 100,000 teens: 26.7 — 9th highest
> Teenage population (ages 15-19): 273,627 — 24th lowest
17. North Carolina
> Wallet Hub score: 54.98
> Top metric: Safety (#19 in the nation)
> Teen driver fatalities per 100,000 teens: 19.8 — 25th highest
> Teenage population (ages 15-19): 713,066 — 9th highest
[in-text-ad-2]
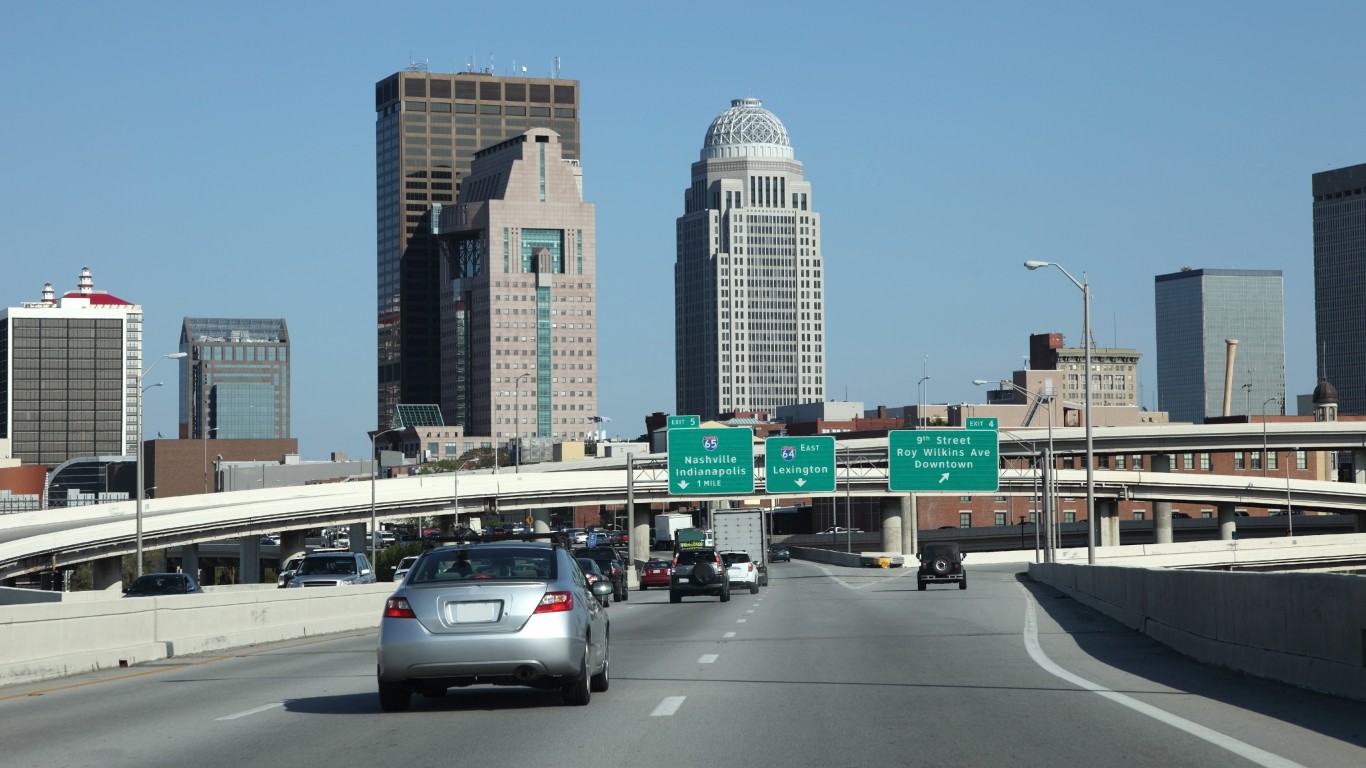
16. Kentucky
> Wallet Hub score: 55.32
> Top metric: Economic Environment (#4 in the nation)
> Teen driver fatalities per 100,000 teens: 21.7 — 19th highest
> Teenage population (ages 15-19): 295,004 — 25th lowest
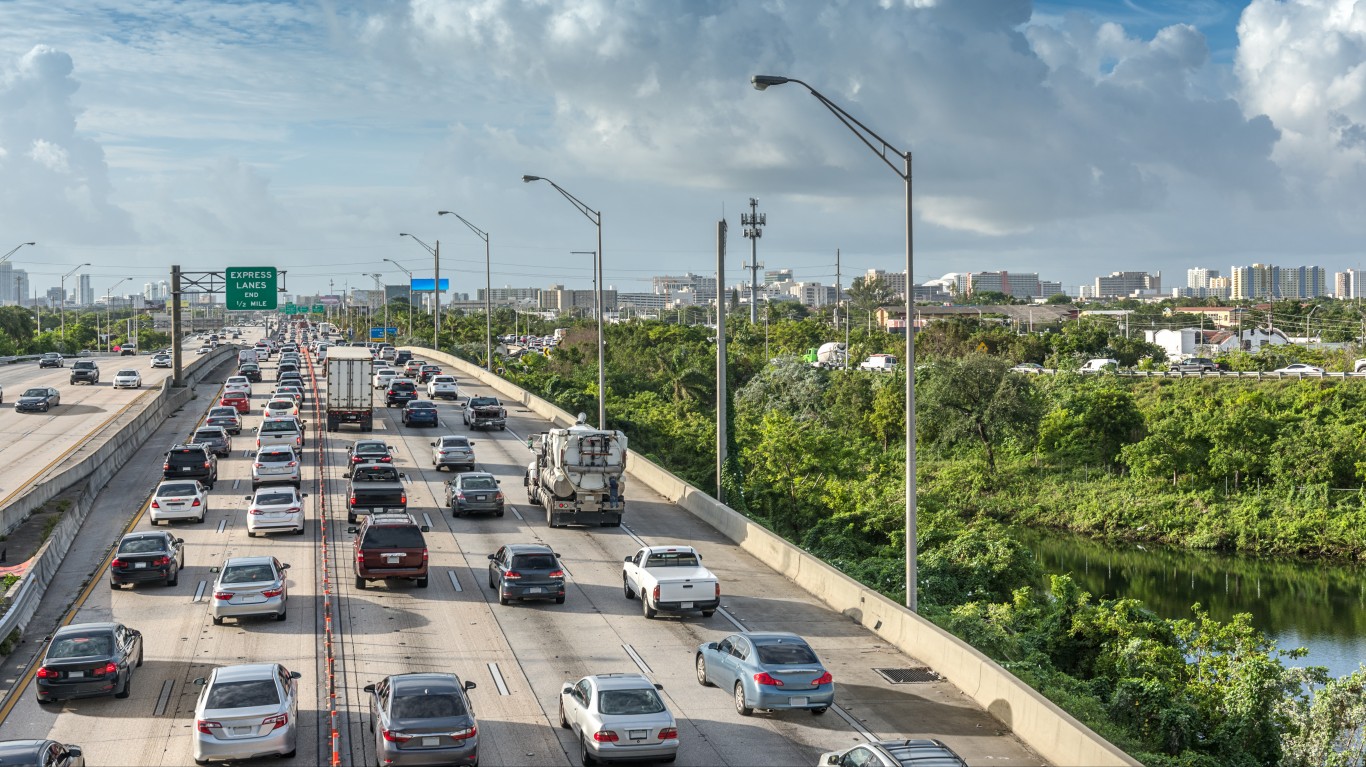
15. Florida
> Wallet Hub score: 55.40
> Top metric: Economic Environment (#10 in the nation)
> Teen driver fatalities per 100,000 teens: 27.7 — 8th highest
> Teenage population (ages 15-19): 1,213,809 — 3rd highest
[in-text-ad]

14. Ohio
> Wallet Hub score: 55.69
> Top metric: Economic Environment (#2 in the nation)
> Teen driver fatalities per 100,000 teens: 14.6 — 17th lowest
> Teenage population (ages 15-19): 766,270 — 7th highest
[recirclink id=806734]

13. Maine
> Wallet Hub score: 55.82
> Top metric: Economic Environment (#8 in the nation)
> Teen driver fatalities per 100,000 teens: 14.1 — 15th lowest
> Teenage population (ages 15-19): 78,209 — 10th lowest

12. Illinois
> Wallet Hub score: 56.19
> Top metric: Driving Laws (#6 in the nation)
> Teen driver fatalities per 100,000 teens: 13.0 — 12th lowest
> Teenage population (ages 15-19): 829,525 — 5th highest
[in-text-ad-2]
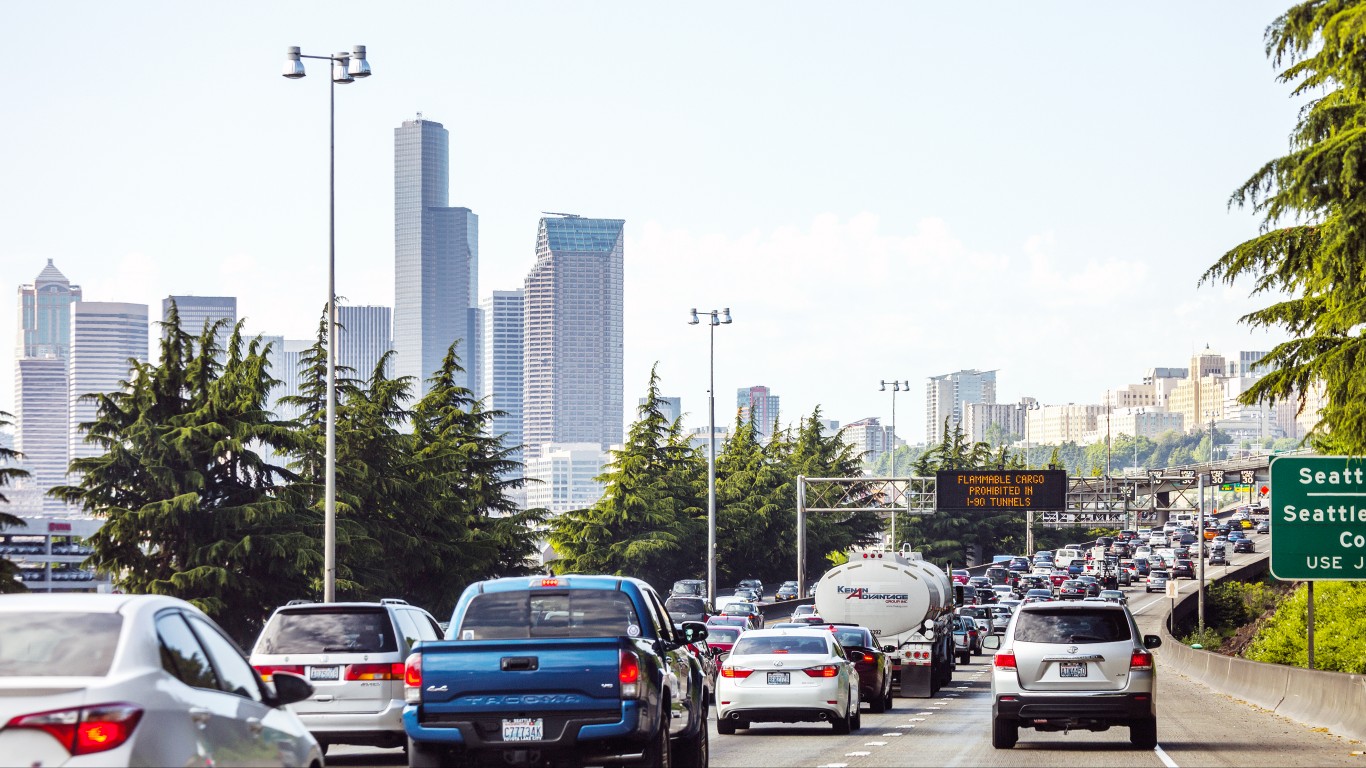
11. Washington
> Wallet Hub score: 56.69
> Top metric: Driving Laws (#2 in the nation)
> Teen driver fatalities per 100,000 teens: 9.6 — 7th lowest
> Teenage population (ages 15-19): 459,277 — 15th highest

10. New Jersey
> Wallet Hub score: 56.81
> Top metric: Safety (#2 in the nation)
> Teen driver fatalities per 100,000 teens: 9.5 — 6th lowest
> Teenage population (ages 15-19): 555,206 — 12th highest
[in-text-ad]
9. Maryland
> Wallet Hub score: 57.05
> Top metric: Safety (#5 in the nation)
> Teen driver fatalities per 100,000 teens: 11.5 — 9th lowest
> Teenage population (ages 15-19): 381,318 — 19th highest
[recirclink id=912562]

8. Texas
> Wallet Hub score: 57.20
> Top metric: Economic Environment (#9 in the nation)
> Teen driver fatalities per 100,000 teens: 20.1 — 23rd highest
> Teenage population (ages 15-19): 2,077,356 — 2nd highest
7. Minnesota
> Wallet Hub score: 57.51
> Top metric: Economic Environment (#5 in the nation)
> Teen driver fatalities per 100,000 teens: 9.6 — 8th lowest
> Teenage population (ages 15-19): 363,358 — 22nd highest
[in-text-ad-2]
6. Michigan
> Wallet Hub score: 57.62
> Top metric: Economic Environment (#1 in the nation)
> Teen driver fatalities per 100,000 teens: 18.4 — 21st lowest
> Teenage population (ages 15-19): 653,218 — 10th highest

5. Massachusetts
> Wallet Hub score: 57.85
> Top metric: Safety (#6 in the nation)
> Teen driver fatalities per 100,000 teens: 6.9 — 3rd lowest
> Teenage population (ages 15-19): 451,393 — 16th highest
[in-text-ad]

4. Alaska
> Wallet Hub score: 58.15
> Top metric: Safety (#3 in the nation)
> Teen driver fatalities per 100,000 teens: 21.5 — 21st highest
> Teenage population (ages 15-19): 46,531 — 3rd lowest
[recirclink id=802364]

3. Connecticut
> Wallet Hub score: 59.01
> Top metric: Safety (#7 in the nation)
> Teen driver fatalities per 100,000 teens: 13.0 — 11th lowest
> Teenage population (ages 15-19): 238,670 — 21st lowest
2. Oregon
> Wallet Hub score: 59.72
> Top metric: Safety (#4 in the nation)
> Teen driver fatalities per 100,000 teens: 22.8 — 17th highest
> Teenage population (ages 15-19): 249,830 — 22nd lowest
[in-text-ad-2]
1. New York
> Wallet Hub score: 64.92
> Top metric: Safety (#1 in the nation)
> Teen driver fatalities per 100,000 teens: 6.7 — 2nd lowest
> Teenage population (ages 15-19): 1,187,268 — 4th highest
Contact [email protected] for any questions or corrections.