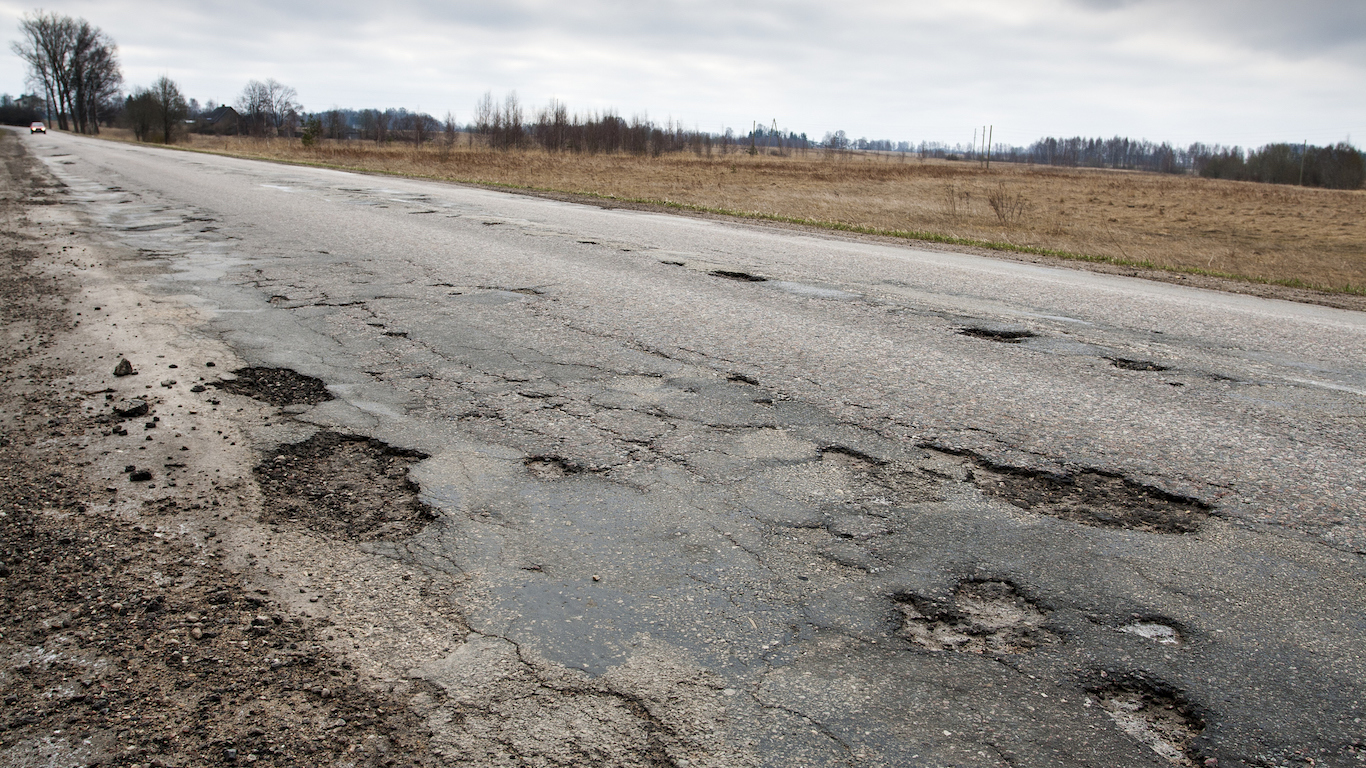
Among the most important aims of the Biden administration’s legislative agenda is to fix – which usually means to update and replace – vast portions of the nation’s infrastructure. This includes a wide array of projects, such as highways, broadband systems — and bridges. Bridges are at different states of disrepair nationwide, and the state with the most dangerous bridges is West Virginia. (This state has the worst highways in America.)
The bipartisan infrastructure bill (Infrastructure Investment and Jobs Act) has paved a way for the Biden administration’s goals to be met. The cornerstones of the ambitious plan are the $52.5 billion in federal highway apportionment and the $27 billion in funding to replace, repair, and rehabilitate bridges announced by the U.S. Department of Transportation and Federal Highway Administration.
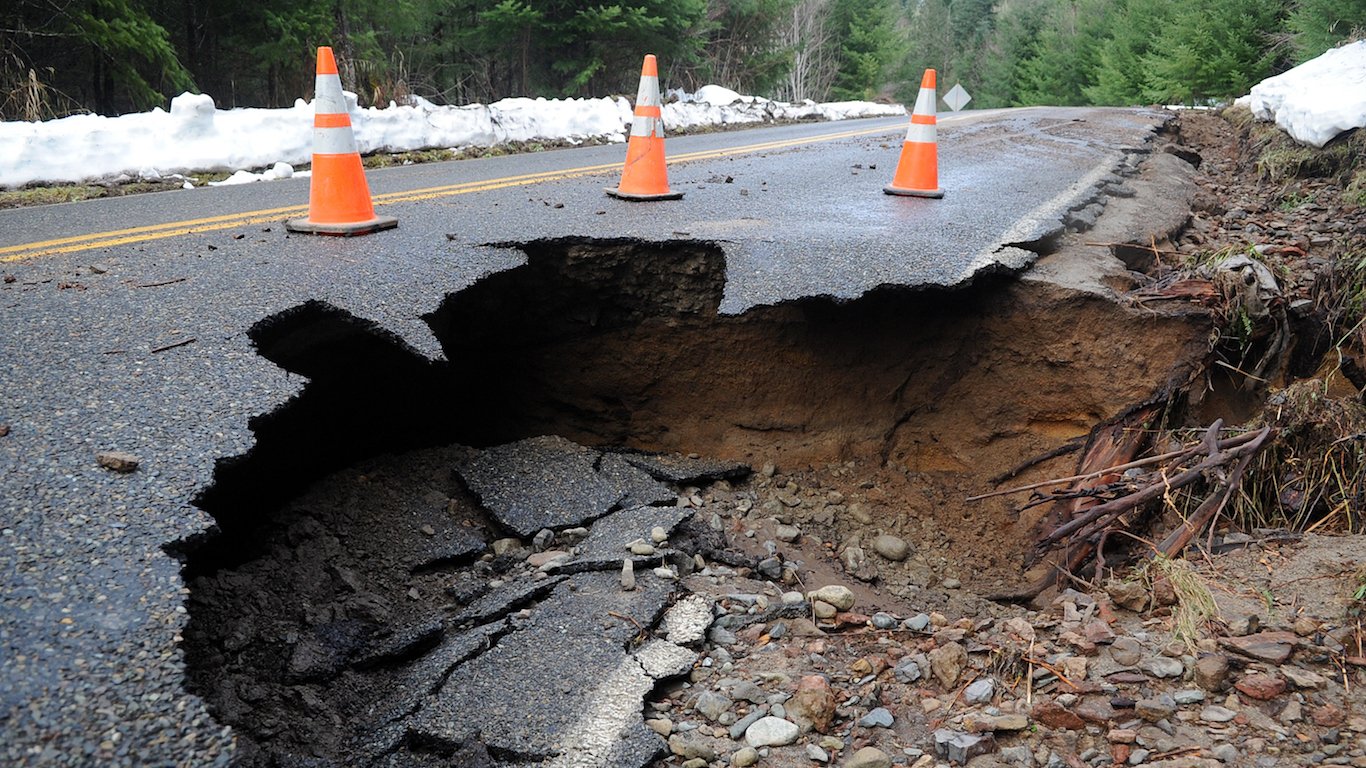
One of the most pressing problems is that bridges are wearing out faster than expected due to “Deferred maintenance, climate change and heavier-than-anticipated traffic,” according to Axios.
Many estimates of the cost to repair America’s bridges are much larger than the money the administration provided in the bill. The American Road & Transportation Builders Association analyzed the Transportation Department’s 2021 National Bridge Inventory and found that 36% of America’s bridges need major repair work. The organization’s total bridge count nationwide is 619,588. Of these, 43,578 are in a dangerous state and need to be repaired or replaced immediately.
24/7 Wall St. reviewed the association’s 2022 Bridge Report to find the states with the most dangerous bridges. The report notes bridges that are particularly dangerous. States were ranked by the percent of bridges that are structurally deficient. Data is from the report.
The state with the most structurally deficient bridges is Iowa with 4,504, which represents 18.9% of its 23,870 bridges. Only one state has a higher percentage of structurally deficient bridges. In West Virginia, 20.5% of bridges are structurally deficient, but the raw figure is 1,490, much lower than Iowa’s count.
To illustrate how bad the Iowa and West Virginia numbers are, note that the three states with the lowest percentage of structurally deficient bridges are Arizona, Texas, and Nevada at 1.4%, and the number of structurally deficient bridges are 117, 789, and 29, respectively. (This is the worst city to drive in every state.)
Click here to see the state with the most dangerous bridges

50. Arizona
>Percent of bridges that are structurally deficient: 1.4%
>Number of bridges: 8,467
[in-text-ad]

49. Nevada
>Percent of bridges that are structurally deficient: 1.4%
>Number of bridges: 2,067
[recirclink id=1027744]

48. Texas
>Percent of bridges that are structurally deficient: 1.4%
>Number of bridges: 55,175

47. Delaware
>Percent of bridges that are structurally deficient: 1.9%
>Number of bridges: 875
[in-text-ad-2]

46. Utah
>Percent of bridges that are structurally deficient: 2.1%
>Number of bridges: 3,056

45. Georgia
>Percent of bridges that are structurally deficient: 2.1%
>Number of bridges: 14,987
[in-text-ad]

44. Vermont
>Percent of bridges that are structurally deficient: 2.4%
>Number of bridges: 2,836
[recirclink id=1044820]

43. Florida
>Percent of bridges that are structurally deficient: 3.6%
>Number of bridges: 12,680

42. Alabama
>Percent of bridges that are structurally deficient: 3.6%
>Number of bridges: 16,164
[in-text-ad-2]

41. Virginia
>Percent of bridges that are structurally deficient: 3.8%
>Number of bridges: 13,997

40. Tennessee
>Percent of bridges that are structurally deficient: 4.1%
>Number of bridges: 20,331
[in-text-ad]

39. Minnesota
>Percent of bridges that are structurally deficient: 4.6%
>Number of bridges: 13,496
[recirclink id=1019842]

38. Oregon
>Percent of bridges that are structurally deficient: 4.6%
>Number of bridges: 8,235

37. Maryland
>Percent of bridges that are structurally deficient: 4.7%
>Number of bridges: 5,446
[in-text-ad-2]

36. Washington
>Percent of bridges that are structurally deficient: 4.8%
>Number of bridges: 8,358

35. Ohio
>Percent of bridges that are structurally deficient: 4.9%
>Number of bridges: 27,151
[in-text-ad]

34. Kansas
>Percent of bridges that are structurally deficient: 5.1%
>Number of bridges: 24,925
[recirclink id=1017929]

33. New Mexico
>Percent of bridges that are structurally deficient: 5.2%
>Number of bridges: 4,025

32. Idaho
>Percent of bridges that are structurally deficient: 5.2%
>Number of bridges: 4,561
[in-text-ad-2]

31. Arkansas
>Percent of bridges that are structurally deficient: 5.3%
>Number of bridges: 12,941

30. Colorado
>Percent of bridges that are structurally deficient: 5.3%
>Number of bridges: 8,869
[in-text-ad]

29. Connecticut
>Percent of bridges that are structurally deficient: 5.3%
>Number of bridges: 4,361
[recirclink id=1000298]

28. South Carolina
>Percent of bridges that are structurally deficient: 5.3%
>Number of bridges: 9,395

27. Indiana
>Percent of bridges that are structurally deficient: 5.6%
>Number of bridges: 19,337
[in-text-ad-2]

26. California
>Percent of bridges that are structurally deficient: 5.8%
>Number of bridges: 25,737

25. Kentucky
>Percent of bridges that are structurally deficient: 6.9%
>Number of bridges: 14,410
[in-text-ad]

24. Wisconsin
>Percent of bridges that are structurally deficient: 6.9%
>Number of bridges: 14,307
[recirclink id=1027744]

23. Montana
>Percent of bridges that are structurally deficient: 6.9%
>Number of bridges: 5,266

22. Mississippi
>Percent of bridges that are structurally deficient: 7.0%
>Number of bridges: 16,788
[in-text-ad-2]

21. North Carolina
>Percent of bridges that are structurally deficient: 7.0%
>Number of bridges: 18,877

20. New Jersey
>Percent of bridges that are structurally deficient: 7.1%
>Number of bridges: 6,798
[in-text-ad]

19. Wyoming
>Percent of bridges that are structurally deficient: 7.4%
>Number of bridges: 3,114
[recirclink id=1044820]

18. Hawaii
>Percent of bridges that are structurally deficient: 7.5%
>Number of bridges: 1,162

17. New Hampshire
>Percent of bridges that are structurally deficient: 7.7%
>Number of bridges: 2,527
[in-text-ad-2]

16. Alaska
>Percent of bridges that are structurally deficient: 8.2%
>Number of bridges: 1,632

15. Nebraska
>Percent of bridges that are structurally deficient: 8.3%
>Number of bridges: 15,348
[in-text-ad]

14. Massachusetts
>Percent of bridges that are structurally deficient: 8.7%
>Number of bridges: 5,245
[recirclink id=1019842]

13. Illinois
>Percent of bridges that are structurally deficient: 9.0%
>Number of bridges: 26,846

12. Missouri
>Percent of bridges that are structurally deficient: 9.0%
>Number of bridges: 24,590
[in-text-ad-2]

11. New York
>Percent of bridges that are structurally deficient: 9.5%
>Number of bridges: 17,555

10. Oklahoma
>Percent of bridges that are structurally deficient: 9.9%
>Number of bridges: 23,220
[in-text-ad]

9. Michigan
>Percent of bridges that are structurally deficient: 11.0%
>Number of bridges: 11,284
[recirclink id=1017929]

8. North Dakota
>Percent of bridges that are structurally deficient: 11.2%
>Number of bridges: 4,285

7. Maine
>Percent of bridges that are structurally deficient: 12.6%
>Number of bridges: 2,485
[in-text-ad-2]

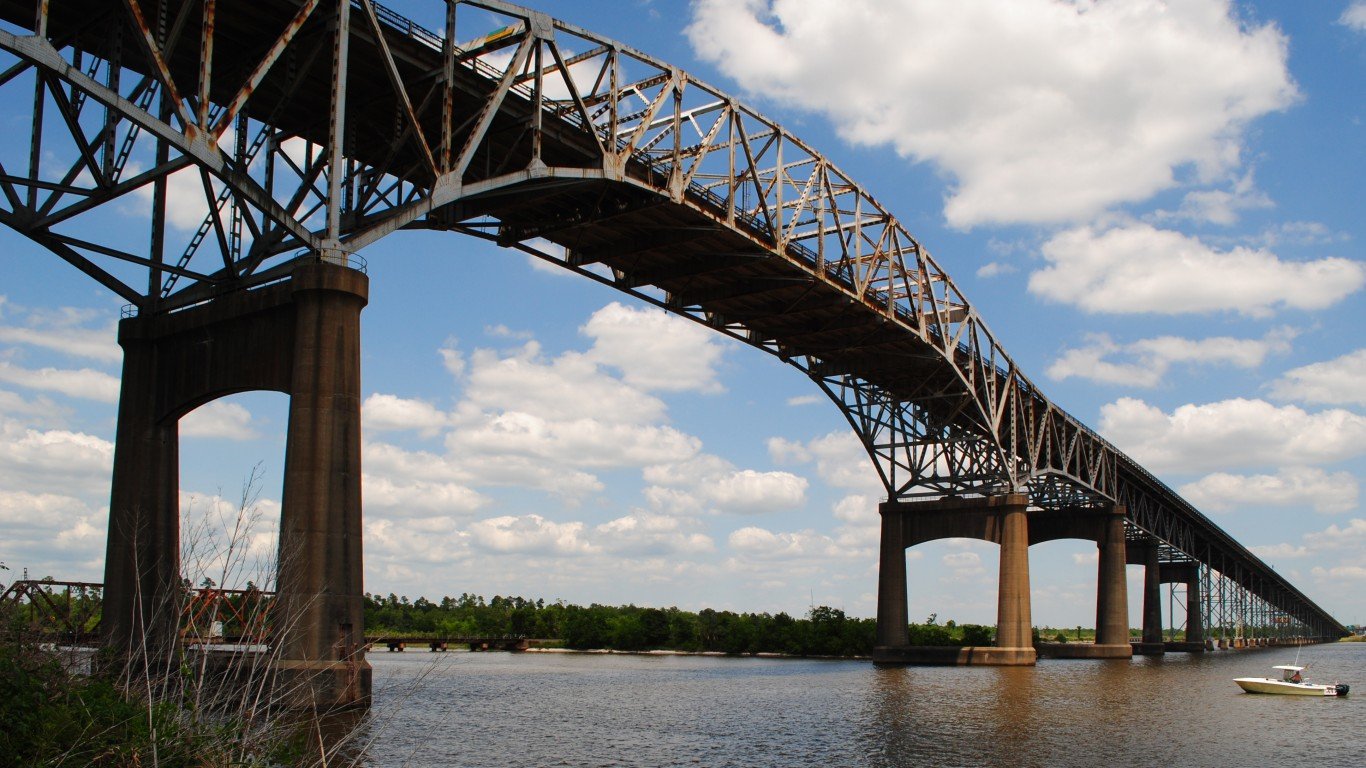
6. Louisiana
>Percent of bridges that are structurally deficient: 12.8%
>Number of bridges: 12,782

5. Pennsylvania
>Percent of bridges that are structurally deficient: 13.8%
>Number of bridges: 23,166
[in-text-ad]

4. South Dakota
>Percent of bridges that are structurally deficient: 17.3%
>Number of bridges: 5,886
[recirclink id=1000298]

3. Rhode Island
>Percent of bridges that are structurally deficient: 17.5%
>Number of bridges: 779

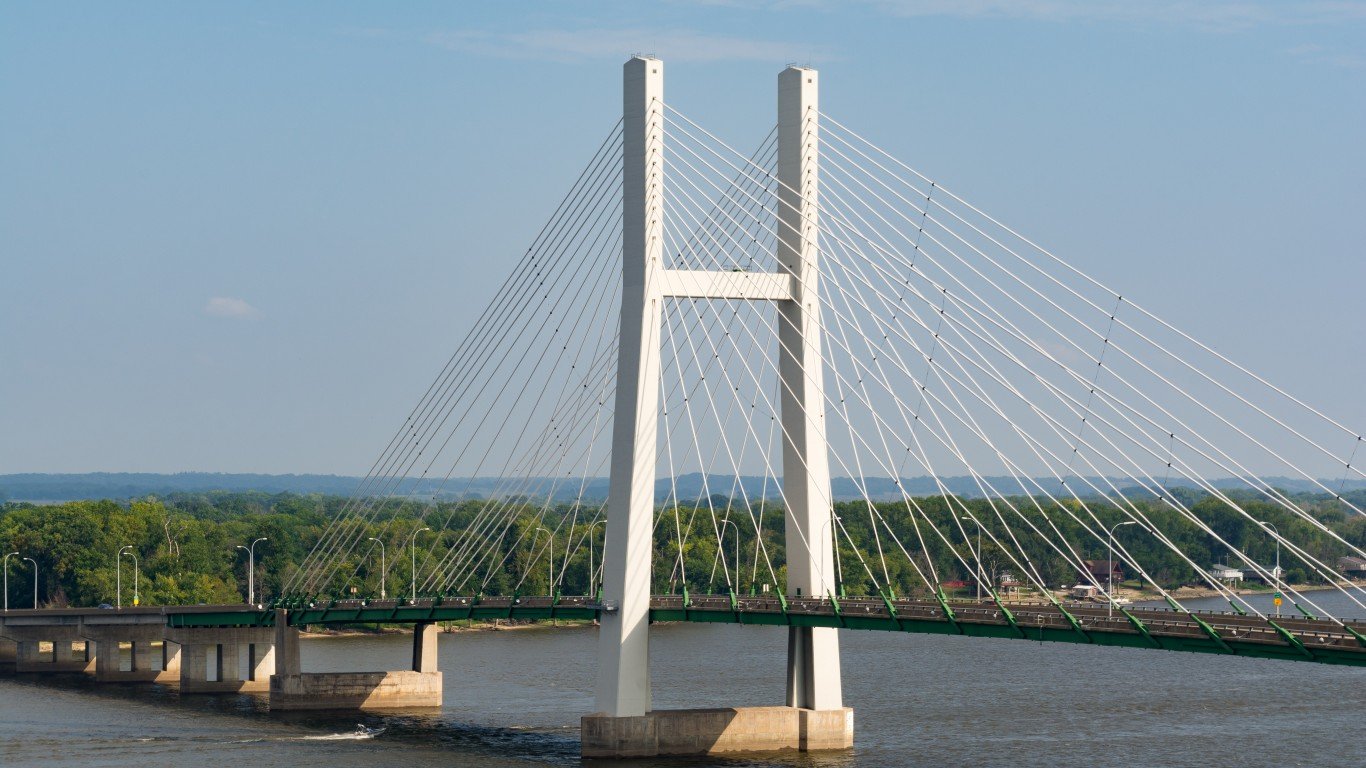
2. Iowa
>Percent of bridges that are structurally deficient: 18.9%
>Number of bridges: 23,870
[in-text-ad-2]

1. West Virginia
>Percent of bridges that are structurally deficient: 20.4%
>Number of bridges: 7,314
Contact [email protected] for any questions or corrections.