The U.S. property crime rate fell for the 19th consecutive year in 2020 – a bright spot in an otherwise bleak year defined largely by the COVID-19 pandemic and a historic surge in deadly violence.
Property crime is made up of three categories of offenses: larceny, defined as the unlawful taking of property; burglary, or the illegal entry of a structure to commit a crime; and vehicle theft, which can be either the theft, or the attempted theft, of a vehicle, such a car or ATV. Here is a look at the city in every state where your car is most likely to be stolen.
There were a total 6.5 million property crimes reported in the U.S. in 2020, or 1,958 for every 100,000 people, a decrease of 172 incidents per 100,000 people from the previous year. Not all parts of the country benefited from the decline, however. Many towns across the country bucked the national trend and reported a year over year surge in property crime.
Using data from the FBI’s 2020 Uniform Crime Report, 24/7 Wall St. identified the 50 towns where property crime is soaring. Towns are ranked by the year-over-year change in property crimes reported for every 100,000 residents. We considered all places covered by the U.S. Census Bureau with populations between 2,500 and 25,000.
Despite the decline in much of the country, property crimes remain the most common of the most serious crimes tracked by the FBI, known as Part I offenses. Each year, property crimes result in the loss of tens of billions of dollars worth of property – much of which is never recovered.
In every town on this list, the property crime rate increased by more than 1,125 incidents per 100,000 people in 2020. Close to half of the towns that reported the largest increase in property crime rate are in the South, including five in North Carolina alone. All but four of the towns on this list have a higher overall property crime rate than the U.S. as a whole.
Click here to see the towns where property crime is soaring
Click here to read our detailed methodology

50. Ridgefield, Washington
> 1-yr. change in property crime rate: 1,125.9 more crimes per 100k people
> Property crimes reported in 2020: 192 — 869th highest of 2,654 towns (tied)
> Property crimes reported in 2019: 74 — 921st lowest of 2,654 towns (tied)
> Property crimes per 100K people in 2020: 1,952.2 — 969th highest of 2,654 towns
> Property crimes per 100K people in 2019: 826.4 — 557th lowest of 2,654 towns
> Population: 7,767
[in-text-ad]
49. Ballinger, Texas
> 1-yr. change in property crime rate: 1,126.6 more crimes per 100k people
> Property crimes reported in 2020: 71 — 925th lowest of 2,654 towns (tied)
> Property crimes reported in 2019: 30 — 308th lowest of 2,654 towns (tied)
> Property crimes per 100K people in 2020: 1,956.5 — 965th highest of 2,654 towns
> Property crimes per 100K people in 2019: 829.9 — 562nd lowest of 2,654 towns
> Population: 3,659
[recirclink id=1015043]

48. Elm Grove, Wisconsin
> 1-yr. change in property crime rate: 1,140.8 more crimes per 100k people
> Property crimes reported in 2020: 118 — 1,261st highest of 2,654 towns (tied)
> Property crimes reported in 2019: 48 — 592nd lowest of 2,654 towns (tied)
> Property crimes per 100K people in 2020: 1,915.6 — 989th highest of 2,654 towns
> Property crimes per 100K people in 2019: 774.8 — 492nd lowest of 2,654 towns
> Population: 6,153
47. Baxter Springs, Kansas
> 1-yr. change in property crime rate: 1,170.3 more crimes per 100k people
> Property crimes reported in 2020: 136 — 1,141st highest of 2,654 towns (tied)
> Property crimes reported in 2019: 90 — 1,106th lowest of 2,654 towns (tied)
> Property crimes per 100K people in 2020: 3,473.8 — 321st highest of 2,654 towns
> Property crimes per 100K people in 2019: 2,303.6 — 833rd highest of 2,654 towns
> Population: 3,983
[in-text-ad-2]
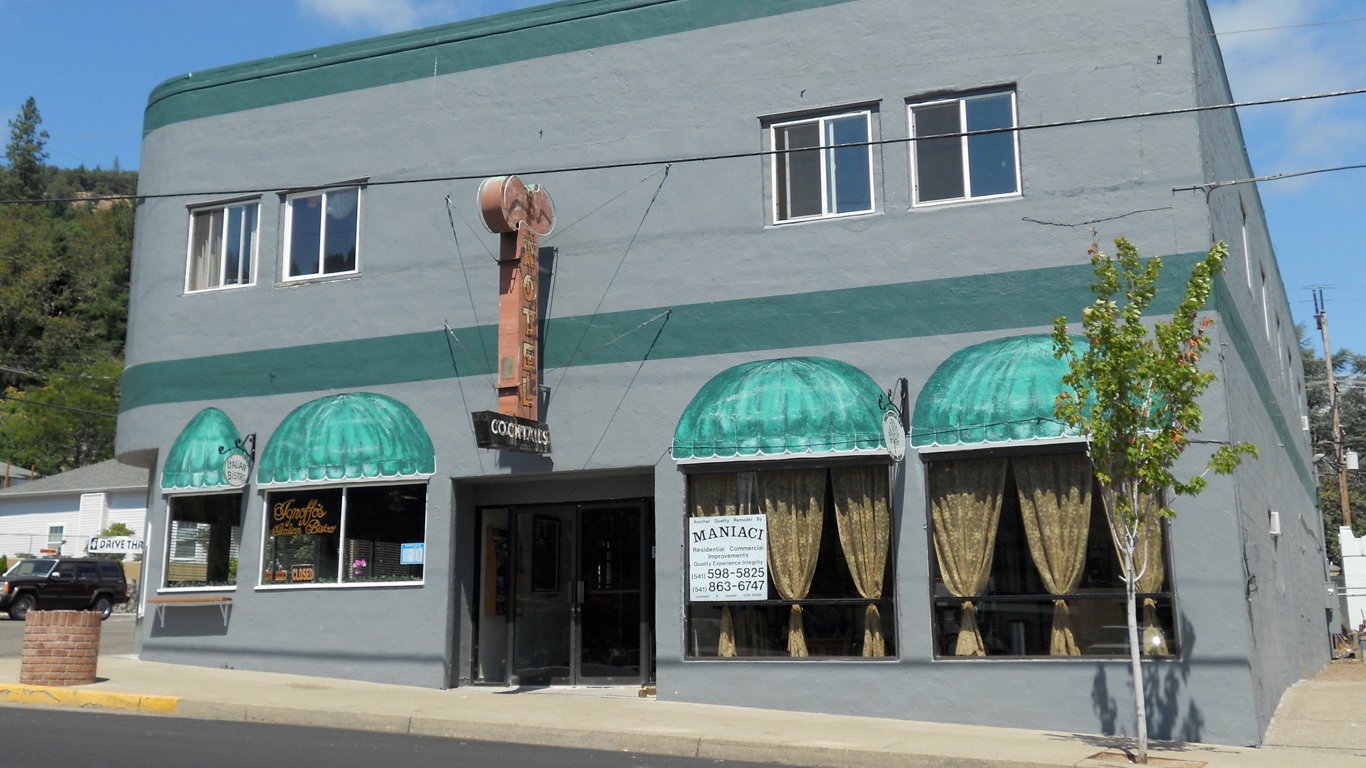
46. Myrtle Creek, Oregon
> 1-yr. change in property crime rate: 1,189.1 more crimes per 100k people
> Property crimes reported in 2020: 166 — 985th highest of 2,654 towns (tied)
> Property crimes reported in 2019: 125 — 1,288th highest of 2,654 towns (tied)
> Property crimes per 100K people in 2020: 4,752.4 — 123rd highest of 2,654 towns
> Property crimes per 100K people in 2019: 3,563.3 — 349th highest of 2,654 towns
> Population: 3,428
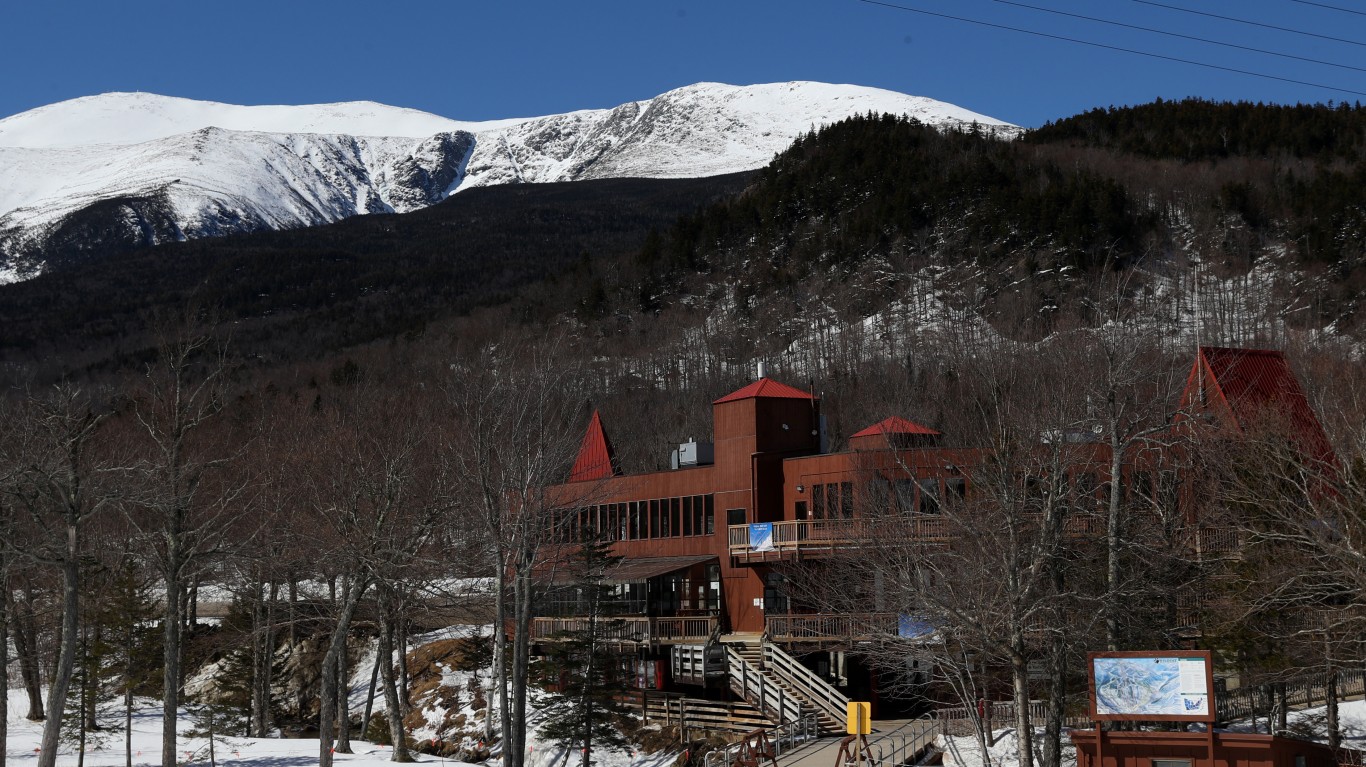
45. Gorham, New Hampshire
> 1-yr. change in property crime rate: 1,195.9 more crimes per 100k people
> Property crimes reported in 2020: 51 — 668th lowest of 2,654 towns (tied)
> Property crimes reported in 2019: 20 — 153rd lowest of 2,654 towns (tied)
> Property crimes per 100K people in 2020: 1,971.4 — 957th highest of 2,654 towns
> Property crimes per 100K people in 2019: 775.5 — 493rd lowest of 2,654 towns
> Population: 2,623
[in-text-ad]
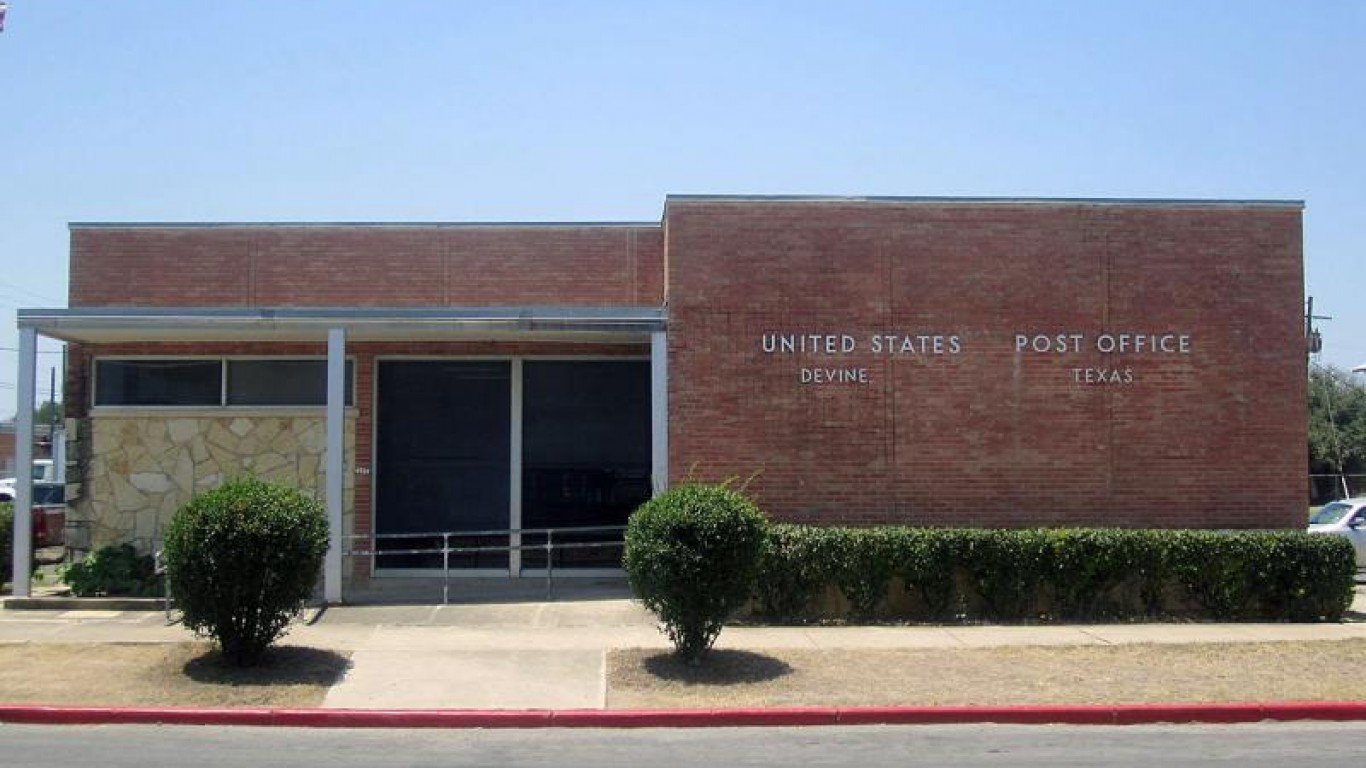
44. Devine, Texas
> 1-yr. change in property crime rate: 1,199.2 more crimes per 100k people
> Property crimes reported in 2020: 115 — 1,290th highest of 2,654 towns (tied)
> Property crimes reported in 2019: 57 — 713th lowest of 2,654 towns (tied)
> Property crimes per 100K people in 2020: 2,355.1 — 748th highest of 2,654 towns
> Property crimes per 100K people in 2019: 1,156.0 — 921st lowest of 2,654 towns
> Population: 4,733
[recirclink id=1030620]
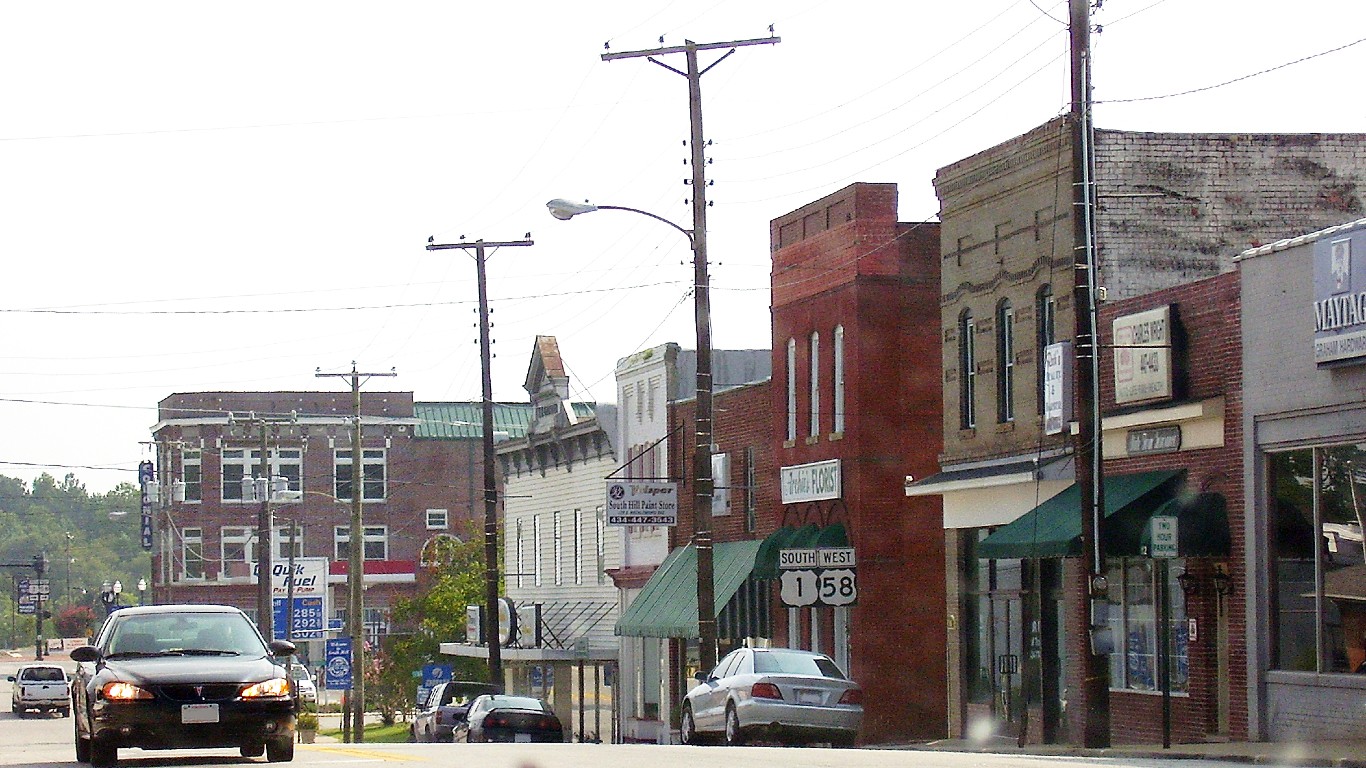
43. South Hill, Virginia
> 1-yr. change in property crime rate: 1,212.5 more crimes per 100k people
> Property crimes reported in 2020: 187 — 889th highest of 2,654 towns (tied)
> Property crimes reported in 2019: 135 — 1,199th highest of 2,654 towns (tied)
> Property crimes per 100K people in 2020: 4,326.7 — 163rd highest of 2,654 towns
> Property crimes per 100K people in 2019: 3,114.2 — 502nd highest of 2,654 towns
> Population: 4,377

42. Cle Elum, Washington
> 1-yr. change in property crime rate: 1,228.1 more crimes per 100k people
> Property crimes reported in 2020: 115 — 1,290th highest of 2,654 towns (tied)
> Property crimes reported in 2019: 77 — 960th lowest of 2,654 towns (tied)
> Property crimes per 100K people in 2020: 3,804.2 — 239th highest of 2,654 towns
> Property crimes per 100K people in 2019: 2,576.1 — 707th highest of 2,654 towns
> Population: 3,017
[in-text-ad-2]

41. Olney, Texas
> 1-yr. change in property crime rate: 1,239.3 more crimes per 100k people
> Property crimes reported in 2020: 86 — 1,084th lowest of 2,654 towns (tied)
> Property crimes reported in 2019: 48 — 592nd lowest of 2,654 towns (tied)
> Property crimes per 100K people in 2020: 2,792.2 — 552nd highest of 2,654 towns
> Property crimes per 100K people in 2019: 1,552.9 — 1,313th lowest of 2,654 towns
> Population: 3,117

40. Dyersburg, Tennessee
> 1-yr. change in property crime rate: 1,245.6 more crimes per 100k people
> Property crimes reported in 2020: 1,103 — 7th highest of 2,654 towns
> Property crimes reported in 2019: 905 — 35th highest of 2,654 towns (tied)
> Property crimes per 100K people in 2020: 6,797.7 — 29th highest of 2,654 towns
> Property crimes per 100K people in 2019: 5,552.1 — 96th highest of 2,654 towns
> Population: 16,476
[in-text-ad]
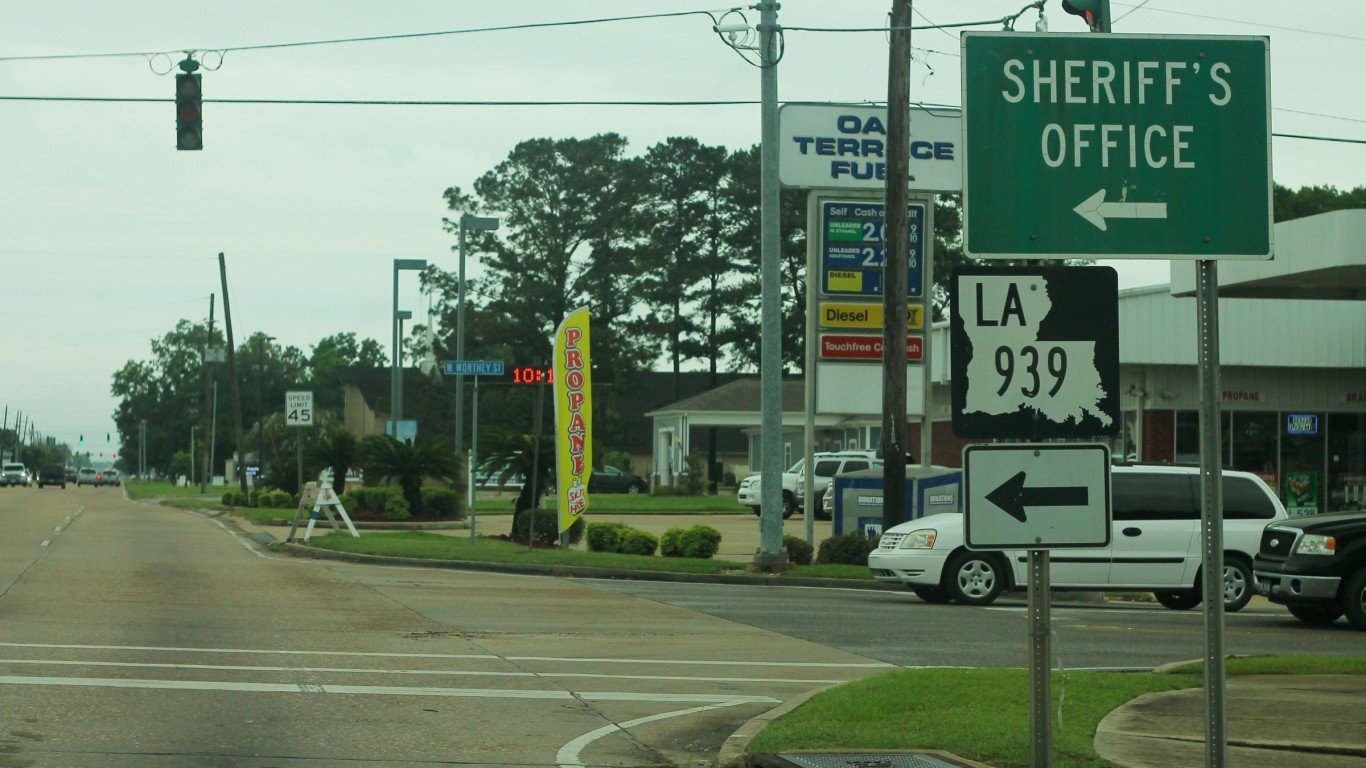
39. Gonzales, Louisiana
> 1-yr. change in property crime rate: 1,262.5 more crimes per 100k people
> Property crimes reported in 2020: 1,086 — 10th highest of 2,654 towns
> Property crimes reported in 2019: 933 — 33rd highest of 2,654 towns
> Property crimes per 100K people in 2020: 9,790.8 — 10th highest of 2,654 towns
> Property crimes per 100K people in 2019: 8,528.3 — 17th highest of 2,654 towns
> Population: 10,789
[recirclink id=1033410]
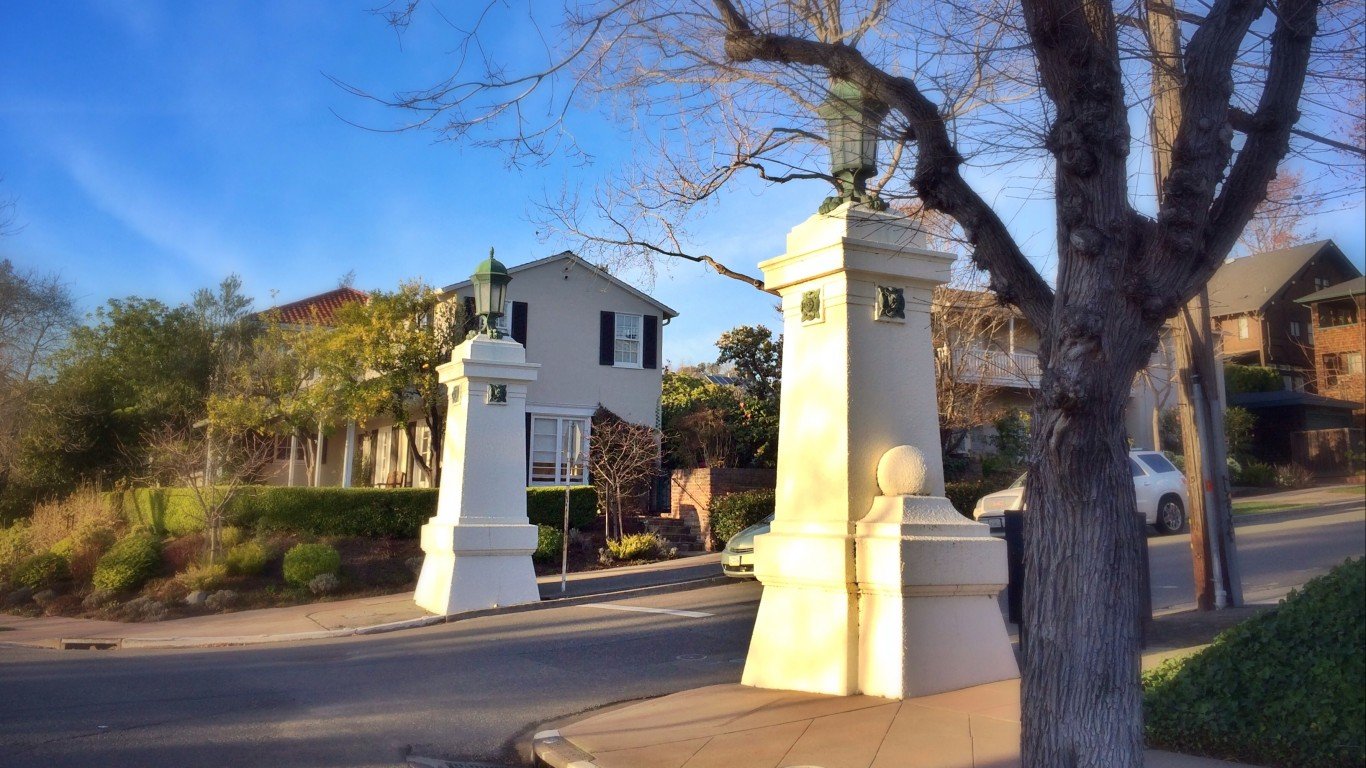
38. Piedmont, California
> 1-yr. change in property crime rate: 1,273.9 more crimes per 100k people
> Property crimes reported in 2020: 367 — 352nd highest of 2,654 towns (tied)
> Property crimes reported in 2019: 227 — 750th highest of 2,654 towns (tied)
> Property crimes per 100K people in 2020: 3,281.5 — 370th highest of 2,654 towns
> Property crimes per 100K people in 2019: 2,007.6 — 1,012th highest of 2,654 towns
> Population: 11,317

37. Live Oak, Florida
> 1-yr. change in property crime rate: 1,275.1 more crimes per 100k people
> Property crimes reported in 2020: 249 — 636th highest of 2,654 towns
> Property crimes reported in 2019: 160 — 1,051st highest of 2,654 towns (tied)
> Property crimes per 100K people in 2020: 3,564.8 — 296th highest of 2,654 towns
> Property crimes per 100K people in 2019: 2,289.6 — 840th highest of 2,654 towns
> Population: 6,890
[in-text-ad-2]
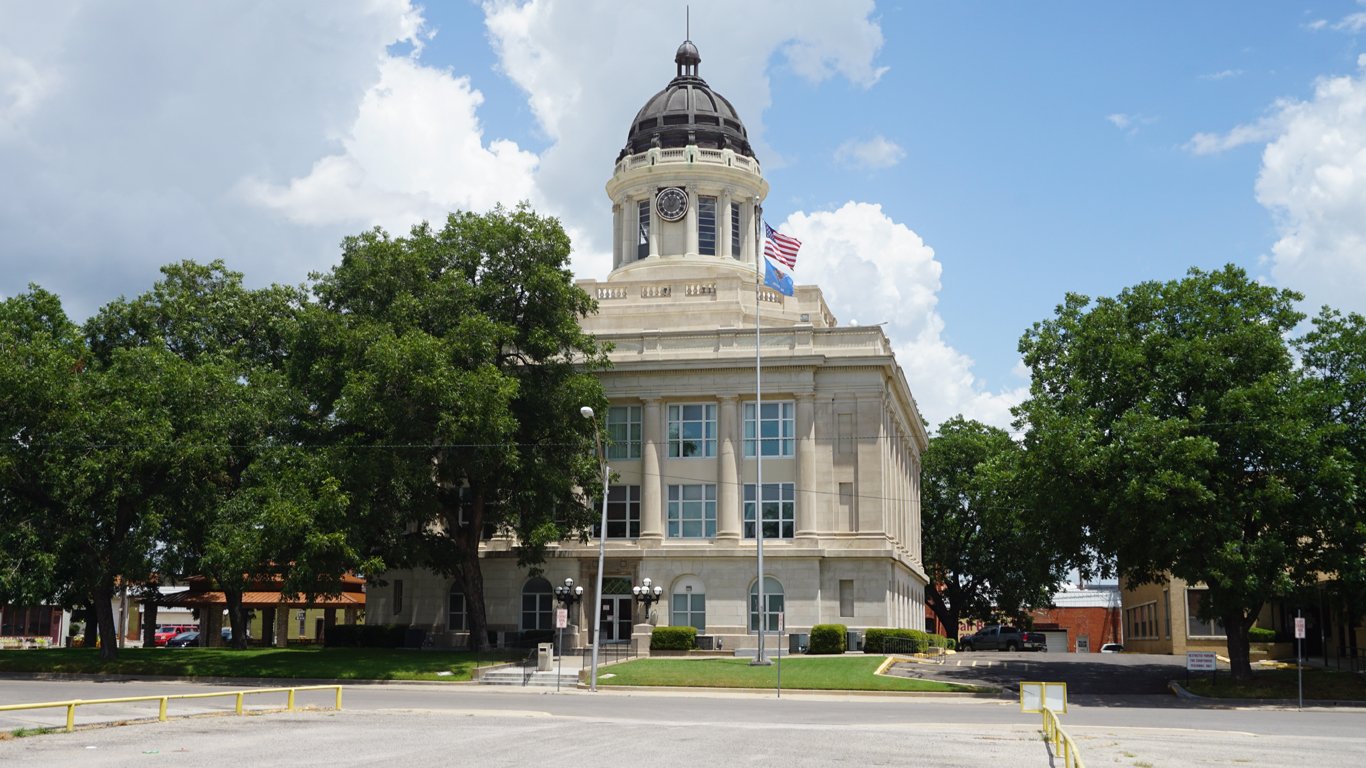
36. Lone Grove, Oklahoma
> 1-yr. change in property crime rate: 1,278.7 more crimes per 100k people
> Property crimes reported in 2020: 79 — 1,005th lowest of 2,654 towns (tied)
> Property crimes reported in 2019: 13 — 67th lowest of 2,654 towns (tied)
> Property crimes per 100K people in 2020: 1,533.1 — 1,305th highest of 2,654 towns
> Property crimes per 100K people in 2019: 254.4 — 60th lowest of 2,654 towns
> Population: 5,063
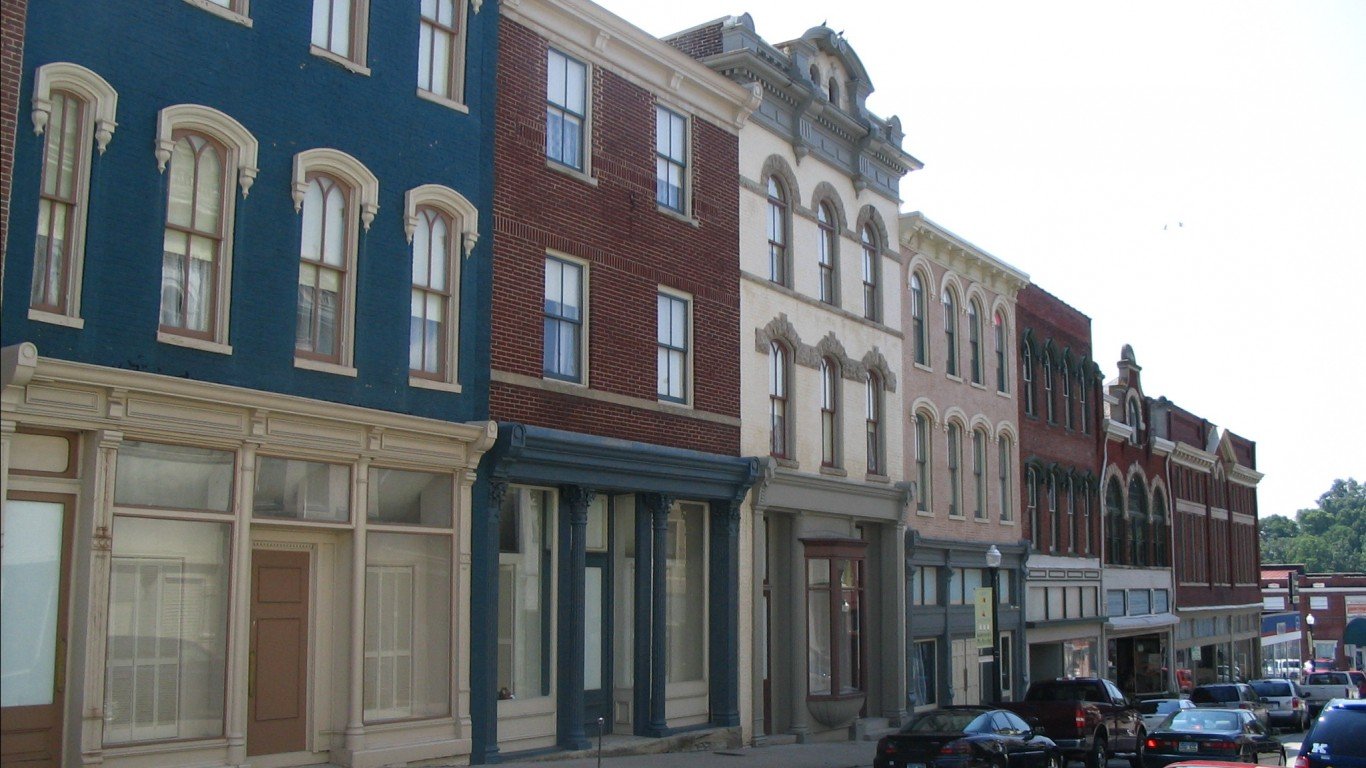
35. Mount Sterling, Kentucky
> 1-yr. change in property crime rate: 1,283.1 more crimes per 100k people
> Property crimes reported in 2020: 376 — 334th highest of 2,654 towns (tied)
> Property crimes reported in 2019: 285 — 573rd highest of 2,654 towns (tied)
> Property crimes per 100K people in 2020: 5,173.4 — 98th highest of 2,654 towns
> Property crimes per 100K people in 2019: 3,890.3 — 287th highest of 2,654 towns
> Population: 7,166
[in-text-ad]

34. Lake Forest Park, Washington
> 1-yr. change in property crime rate: 1,324.8 more crimes per 100k people
> Property crimes reported in 2020: 375 — 337th highest of 2,654 towns (tied)
> Property crimes reported in 2019: 196 — 892nd highest of 2,654 towns (tied)
> Property crimes per 100K people in 2020: 2,756.5 — 569th highest of 2,654 towns
> Property crimes per 100K people in 2019: 1,431.7 — 1,210th lowest of 2,654 towns
> Population: 13,430
[recirclink id=1039645]

33. West Columbia, South Carolina
> 1-yr. change in property crime rate: 1,347.8 more crimes per 100k people
> Property crimes reported in 2020: 1,454 — 2nd highest of 2,654 towns
> Property crimes reported in 2019: 1,199 — 10th highest of 2,654 towns
> Property crimes per 100K people in 2020: 8,014.1 — 17th highest of 2,654 towns
> Property crimes per 100K people in 2019: 6,666.3 — 43rd highest of 2,654 towns
> Population: 17,641
32. Mandan, North Dakota
> 1-yr. change in property crime rate: 1,352.2 more crimes per 100k people
> Property crimes reported in 2020: 980 — 22nd highest of 2,654 towns
> Property crimes reported in 2019: 660 — 106th highest of 2,654 towns
> Property crimes per 100K people in 2020: 4,220.3 — 176th highest of 2,654 towns
> Property crimes per 100K people in 2019: 2,868.1 — 589th highest of 2,654 towns
> Population: 22,301
[in-text-ad-2]

31. Pearisburg, Virginia
> 1-yr. change in property crime rate: 1,355.8 more crimes per 100k people
> Property crimes reported in 2020: 102 — 1,240th lowest of 2,654 towns (tied)
> Property crimes reported in 2019: 67 — 835th lowest of 2,654 towns (tied)
> Property crimes per 100K people in 2020: 3,894.6 — 224th highest of 2,654 towns
> Property crimes per 100K people in 2019: 2,538.8 — 726th highest of 2,654 towns
> Population: 2,652
30. Ecorse, Michigan
> 1-yr. change in property crime rate: 1,360.4 more crimes per 100k people
> Property crimes reported in 2020: 236 — 686th highest of 2,654 towns (tied)
> Property crimes reported in 2019: 106 — 1,225th lowest of 2,654 towns (tied)
> Property crimes per 100K people in 2020: 2,464.5 — 689th highest of 2,654 towns
> Property crimes per 100K people in 2019: 1,104.1 — 880th lowest of 2,654 towns
> Population: 9,432
[in-text-ad]

29. Brownfield, Texas
> 1-yr. change in property crime rate: 1,376.0 more crimes per 100k people
> Property crimes reported in 2020: 250 — 631st highest of 2,654 towns (tied)
> Property crimes reported in 2019: 121 — 1,319th highest of 2,654 towns (tied)
> Property crimes per 100K people in 2020: 2,681.3 — 606th highest of 2,654 towns
> Property crimes per 100K people in 2019: 1,305.3 — 1,073rd lowest of 2,654 towns
> Population: 9,525
[recirclink id=1055273]
28. Bolivar, Tennessee
> 1-yr. change in property crime rate: 1,387.7 more crimes per 100k people
> Property crimes reported in 2020: 209 — 797th highest of 2,654 towns (tied)
> Property crimes reported in 2019: 141 — 1,164th highest of 2,654 towns (tied)
> Property crimes per 100K people in 2020: 4,272.3 — 169th highest of 2,654 towns
> Property crimes per 100K people in 2019: 2,884.6 — 581st highest of 2,654 towns
> Population: 5,031
27. Roosevelt, Utah
> 1-yr. change in property crime rate: 1,426.3 more crimes per 100k people
> Property crimes reported in 2020: 323 — 428th highest of 2,654 towns (tied)
> Property crimes reported in 2019: 213 — 818th highest of 2,654 towns (tied)
> Property crimes per 100K people in 2020: 4,389.2 — 158th highest of 2,654 towns
> Property crimes per 100K people in 2019: 2,962.9 — 552nd highest of 2,654 towns
> Population: 7,041
[in-text-ad-2]
26. North Wilkesboro, North Carolina
> 1-yr. change in property crime rate: 1,452.0 more crimes per 100k people
> Property crimes reported in 2020: 191 — 873rd highest of 2,654 towns (tied)
> Property crimes reported in 2019: 131 — 1,235th highest of 2,654 towns (tied)
> Property crimes per 100K people in 2020: 4,556.3 — 136th highest of 2,654 towns
> Property crimes per 100K people in 2019: 3,104.3 — 504th highest of 2,654 towns
> Population: 4,194
25. Honea Path, South Carolina
> 1-yr. change in property crime rate: 1,457.1 more crimes per 100k people
> Property crimes reported in 2020: 204 — 814th highest of 2,654 towns (tied)
> Property crimes reported in 2019: 146 — 1,130th highest of 2,654 towns (tied)
> Property crimes per 100K people in 2020: 5,289.1 — 87th highest of 2,654 towns
> Property crimes per 100K people in 2019: 3,832.0 — 298th highest of 2,654 towns
> Population: 3,695
[in-text-ad]
24. Ava, Missouri
> 1-yr. change in property crime rate: 1,536.1 more crimes per 100k people
> Property crimes reported in 2020: 90 — 1,120th lowest of 2,654 towns (tied)
> Property crimes reported in 2019: 47 — 581st lowest of 2,654 towns (tied)
> Property crimes per 100K people in 2020: 3,155.7 — 406th highest of 2,654 towns
> Property crimes per 100K people in 2019: 1,619.6 — 1,285th highest of 2,654 towns
> Population: 2,889
[recirclink id=1015043]
23. Anadarko, Oklahoma
> 1-yr. change in property crime rate: 1,611.1 more crimes per 100k people
> Property crimes reported in 2020: 325 — 427th highest of 2,654 towns
> Property crimes reported in 2019: 223 — 770th highest of 2,654 towns (tied)
> Property crimes per 100K people in 2020: 5,020.9 — 103rd highest of 2,654 towns
> Property crimes per 100K people in 2019: 3,409.8 — 410th highest of 2,654 towns
> Population: 6,626
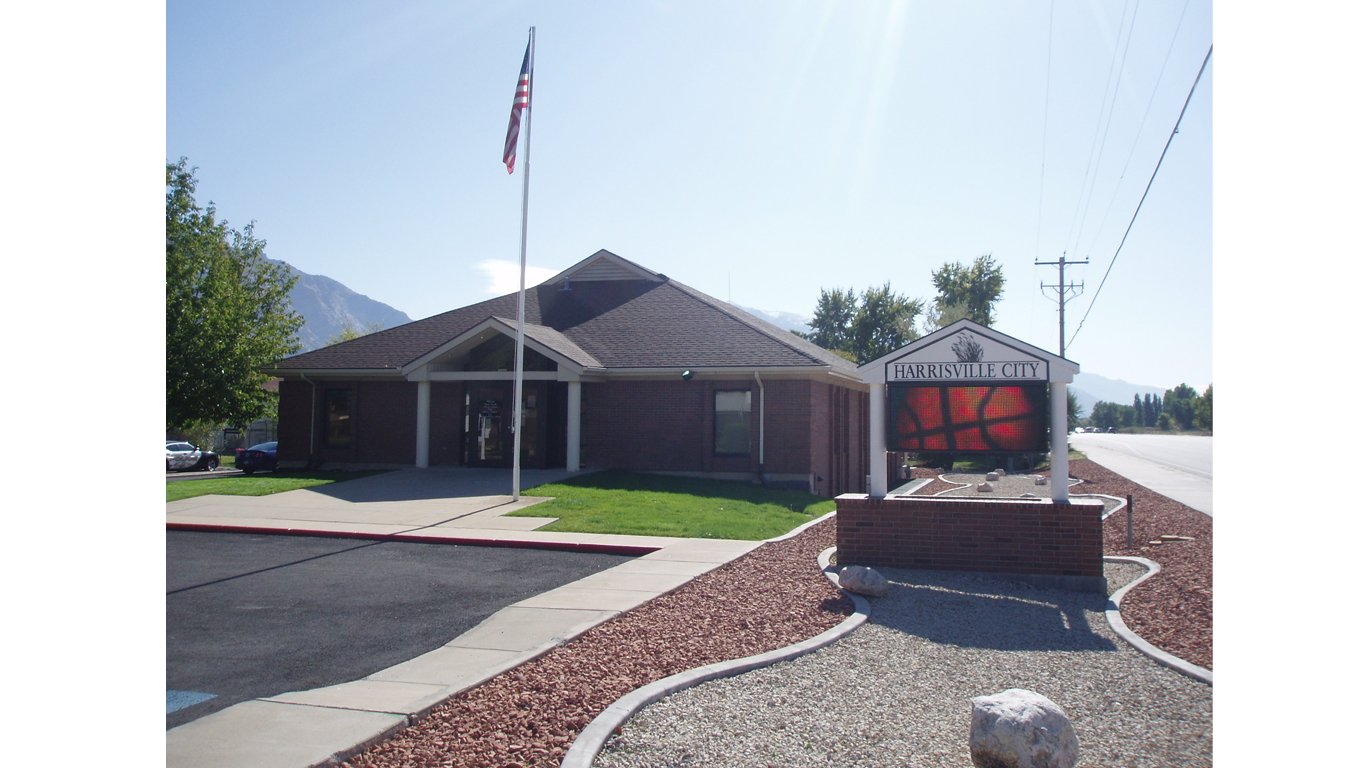
22. Harrisville, Utah
> 1-yr. change in property crime rate: 1,616.6 more crimes per 100k people
> Property crimes reported in 2020: 357 — 369th highest of 2,654 towns (tied)
> Property crimes reported in 2019: 237 — 711th highest of 2,654 towns (tied)
> Property crimes per 100K people in 2020: 5,079.0 — 102nd highest of 2,654 towns
> Property crimes per 100K people in 2019: 3,462.4 — 387th highest of 2,654 towns
> Population: 6,510
[in-text-ad-2]
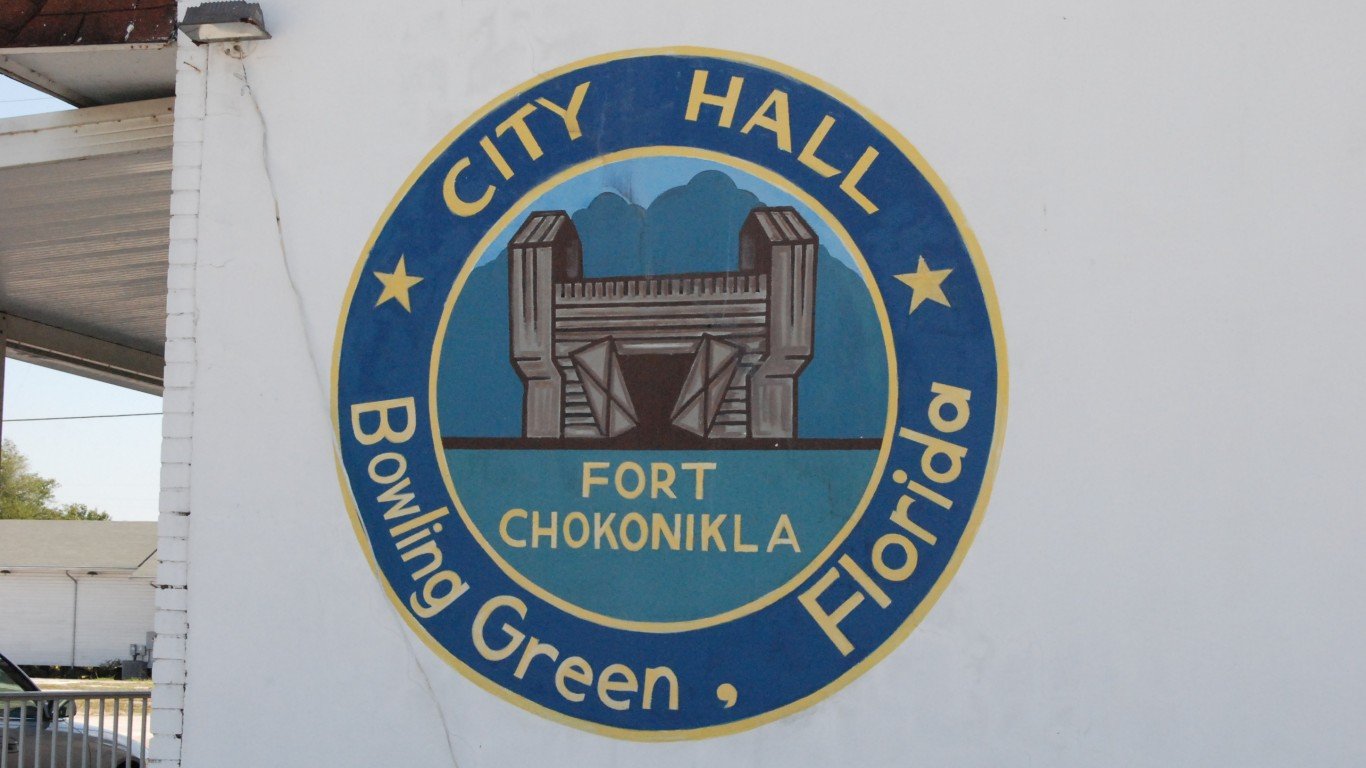
21. Bowling Green, Florida
> 1-yr. change in property crime rate: 1,640.2 more crimes per 100k people
> Property crimes reported in 2020: 93 — 1,155th lowest of 2,654 towns (tied)
> Property crimes reported in 2019: 46 — 564th lowest of 2,654 towns (tied)
> Property crimes per 100K people in 2020: 3,226.9 — 382nd highest of 2,654 towns
> Property crimes per 100K people in 2019: 1,586.8 — 1,317th highest of 2,654 towns
> Population: 2,893
20. Caro, Michigan
> 1-yr. change in property crime rate: 1,646.7 more crimes per 100k people
> Property crimes reported in 2020: 142 — 1,099th highest of 2,654 towns (tied)
> Property crimes reported in 2019: 77 — 960th lowest of 2,654 towns (tied)
> Property crimes per 100K people in 2020: 3,586.8 — 287th highest of 2,654 towns
> Property crimes per 100K people in 2019: 1,940.0 — 1,044th highest of 2,654 towns
> Population: 4,054
[in-text-ad]

19. Paradise, California
> 1-yr. change in property crime rate: 1,679.7 more crimes per 100k people
> Property crimes reported in 2020: 99 — 1,217th lowest of 2,654 towns (tied)
> Property crimes reported in 2019: 202 — 871st highest of 2,654 towns (tied)
> Property crimes per 100K people in 2020: 2,431.2 — 704th highest of 2,654 towns
> Property crimes per 100K people in 2019: 751.5 — 461st lowest of 2,654 towns
> Population: 22,135
[recirclink id=1030620]
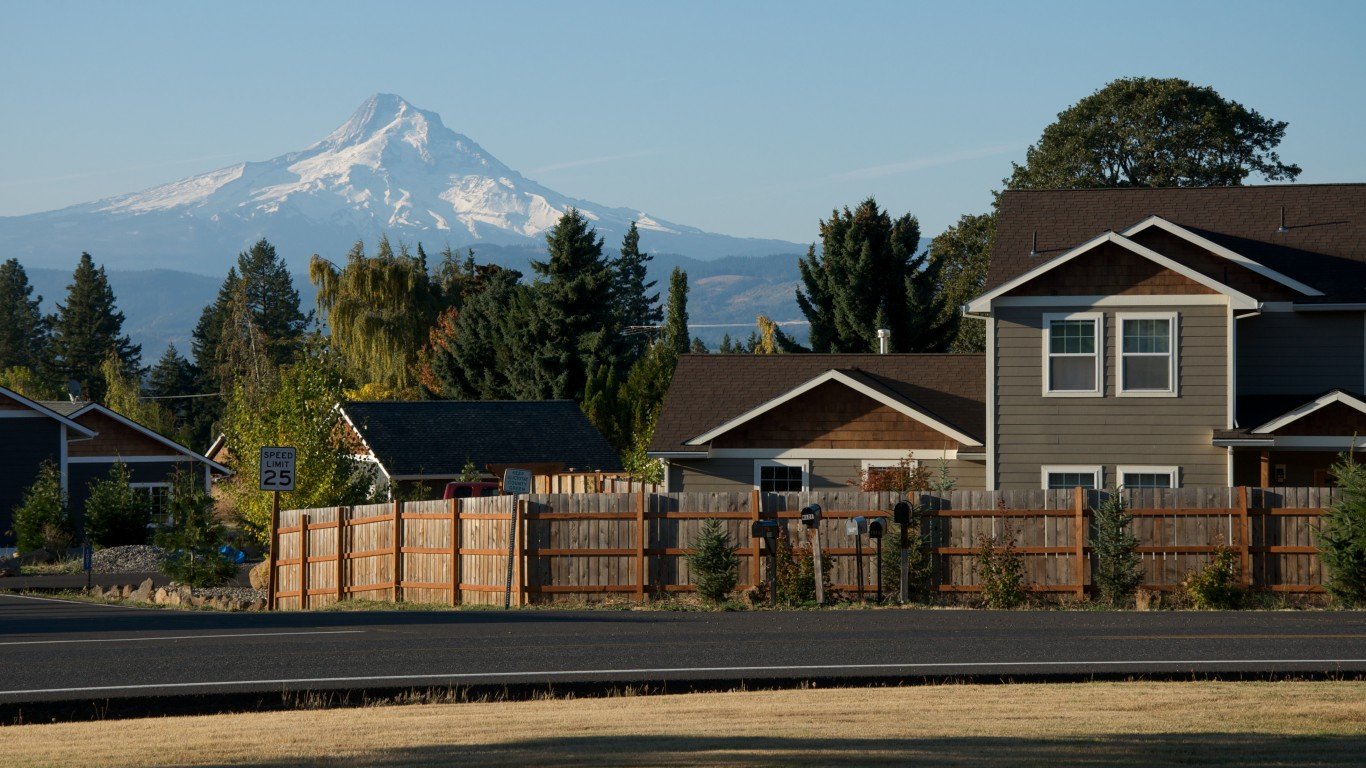
18. White Salmon, Washington
> 1-yr. change in property crime rate: 1,736.8 more crimes per 100k people
> Property crimes reported in 2020: 67 — 876th lowest of 2,654 towns (tied)
> Property crimes reported in 2019: 19 — 140th lowest of 2,654 towns (tied)
> Property crimes per 100K people in 2020: 2,452.4 — 695th highest of 2,654 towns
> Property crimes per 100K people in 2019: 715.6 — 430th lowest of 2,654 towns
> Population: 2,554
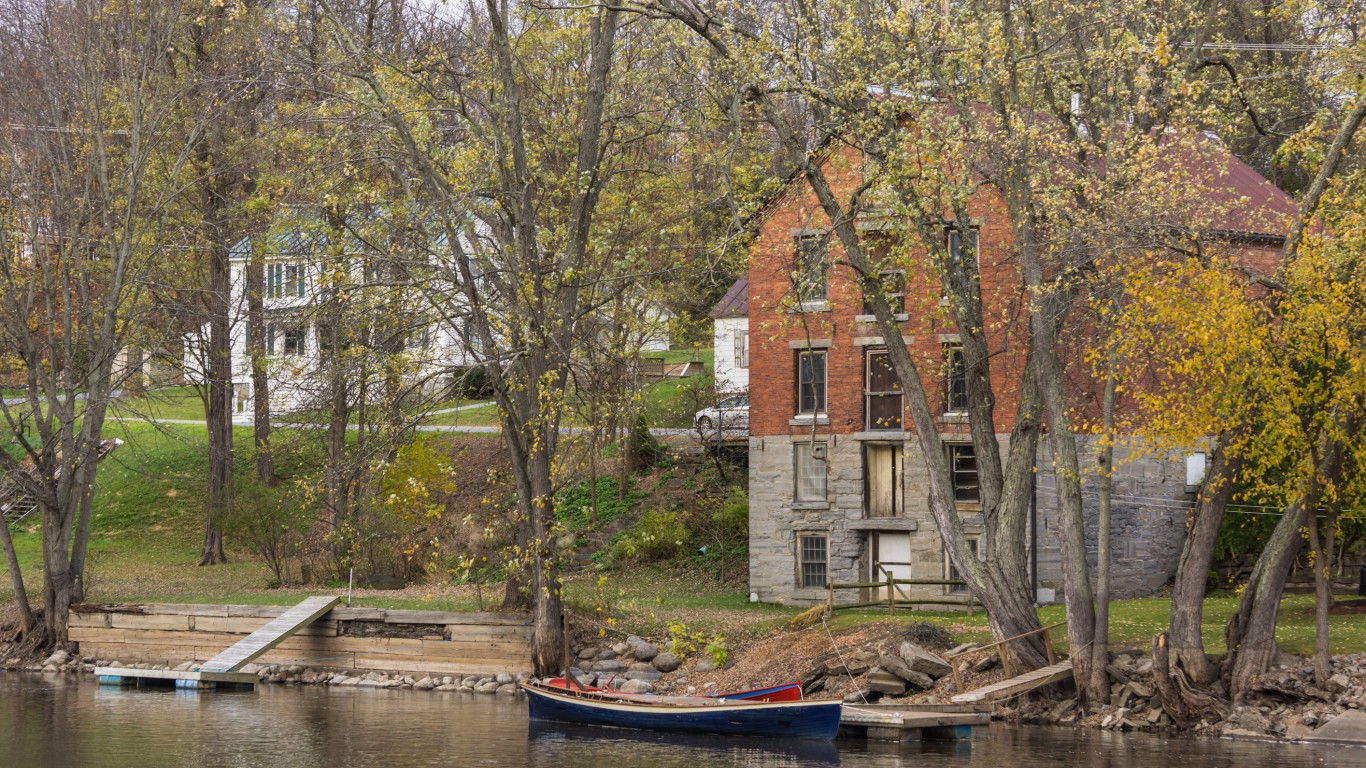
17. Vergennes, Vermont
> 1-yr. change in property crime rate: 1,753.9 more crimes per 100k people
> Property crimes reported in 2020: 72 — 937th lowest of 2,654 towns (tied)
> Property crimes reported in 2019: 27 — 255th lowest of 2,654 towns (tied)
> Property crimes per 100K people in 2020: 2,793.9 — 551st highest of 2,654 towns
> Property crimes per 100K people in 2019: 1,040.1 — 802nd lowest of 2,654 towns
> Population: 2,596
[in-text-ad-2]

16. Merriam, Kansas
> 1-yr. change in property crime rate: 1,792.7 more crimes per 100k people
> Property crimes reported in 2020: 678 — 72nd highest of 2,654 towns
> Property crimes reported in 2019: 484 — 235th highest of 2,654 towns (tied)
> Property crimes per 100K people in 2020: 6,115.3 — 47th highest of 2,654 towns
> Property crimes per 100K people in 2019: 4,322.6 — 220th highest of 2,654 towns
> Population: 11,185
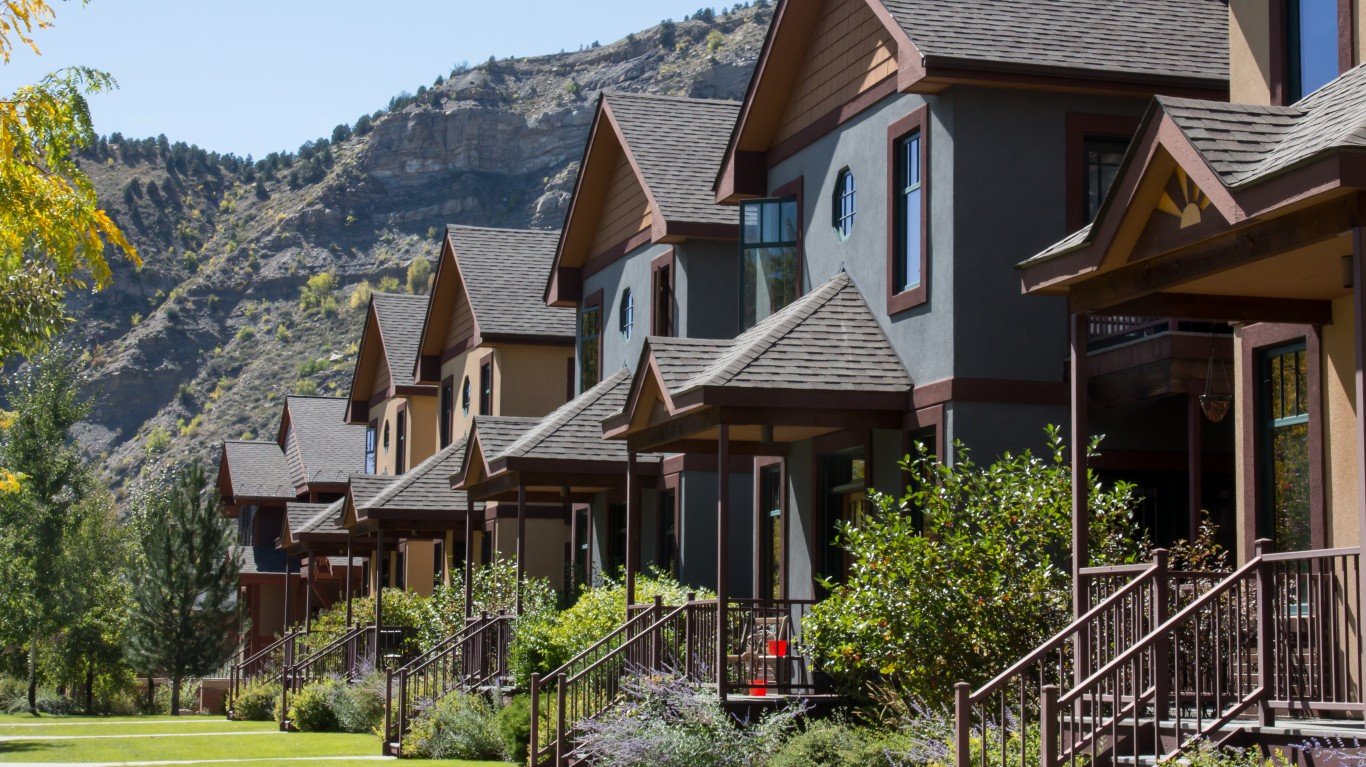
15. Durango, Colorado
> 1-yr. change in property crime rate: 1,808.6 more crimes per 100k people
> Property crimes reported in 2020: 957 — 23rd highest of 2,654 towns
> Property crimes reported in 2019: 611 — 137th highest of 2,654 towns
> Property crimes per 100K people in 2020: 4,979.2 — 108th highest of 2,654 towns
> Property crimes per 100K people in 2019: 3,170.6 — 484th highest of 2,654 towns
> Population: 18,588
[in-text-ad]
14. Long View, North Carolina
> 1-yr. change in property crime rate: 1,838.2 more crimes per 100k people
> Property crimes reported in 2020: 179 — 920th highest of 2,654 towns (tied)
> Property crimes reported in 2019: 88 — 1,084th lowest of 2,654 towns (tied)
> Property crimes per 100K people in 2020: 3,626.4 — 278th highest of 2,654 towns
> Property crimes per 100K people in 2019: 1,788.3 — 1,165th highest of 2,654 towns
> Population: 4,959
[recirclink id=1033410]

13. Leesville, Louisiana
> 1-yr. change in property crime rate: 1,962.5 more crimes per 100k people
> Property crimes reported in 2020: 346 — 395th highest of 2,654 towns (tied)
> Property crimes reported in 2019: 243 — 691st highest of 2,654 towns (tied)
> Property crimes per 100K people in 2020: 6,288.6 — 42nd highest of 2,654 towns
> Property crimes per 100K people in 2019: 4,326.2 — 219th highest of 2,654 towns
> Population: 5,891

12. Edenton, North Carolina
> 1-yr. change in property crime rate: 2,114.8 more crimes per 100k people
> Property crimes reported in 2020: 240 — 671st highest of 2,654 towns (tied)
> Property crimes reported in 2019: 145 — 1,139th highest of 2,654 towns (tied)
> Property crimes per 100K people in 2020: 5,245.9 — 91st highest of 2,654 towns
> Property crimes per 100K people in 2019: 3,131.1 — 493rd highest of 2,654 towns
> Population: 4,676
[in-text-ad-2]

11. Norton, Virginia
> 1-yr. change in property crime rate: 2,209.0 more crimes per 100k people
> Property crimes reported in 2020: 223 — 732nd highest of 2,654 towns (tied)
> Property crimes reported in 2019: 134 — 1,212th highest of 2,654 towns (tied)
> Property crimes per 100K people in 2020: 5,610.1 — 73rd highest of 2,654 towns
> Property crimes per 100K people in 2019: 3,401.0 — 413th highest of 2,654 towns
> Population: 3,970
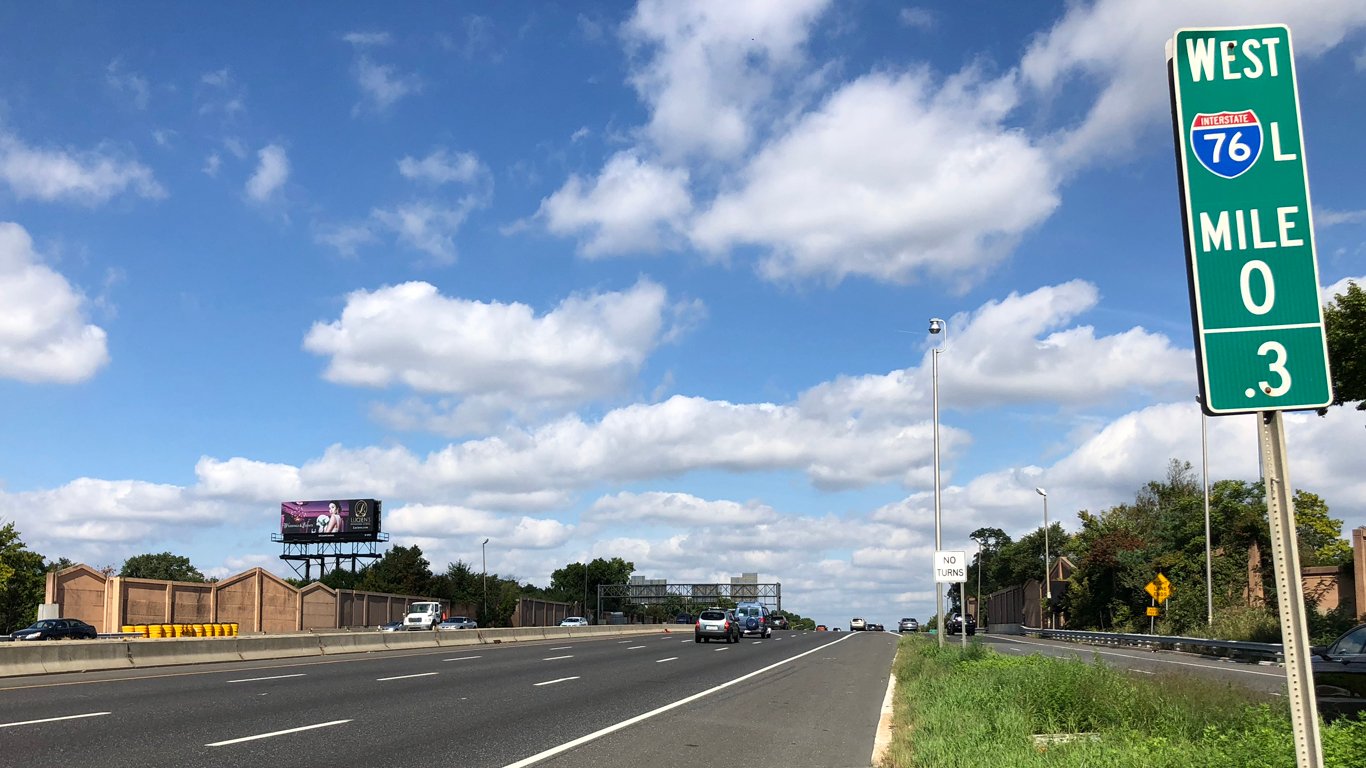
10. Mount Ephraim, New Jersey
> 1-yr. change in property crime rate: 2,312.8 more crimes per 100k people
> Property crimes reported in 2020: 285 — 522nd highest of 2,654 towns (tied)
> Property crimes reported in 2019: 179 — 971st highest of 2,654 towns (tied)
> Property crimes per 100K people in 2020: 6,232.2 — 43rd highest of 2,654 towns
> Property crimes per 100K people in 2019: 3,919.4 — 280th highest of 2,654 towns
> Population: 4,582
[in-text-ad]

9. Fife, Washington
> 1-yr. change in property crime rate: 2,315.1 more crimes per 100k people
> Property crimes reported in 2020: 901 — 34th highest of 2,654 towns
> Property crimes reported in 2019: 664 — 104th highest of 2,654 towns
> Property crimes per 100K people in 2020: 8,746.7 — 14th highest of 2,654 towns
> Property crimes per 100K people in 2019: 6,431.6 — 50th highest of 2,654 towns
> Population: 10,096
[recirclink id=1039645]

8. Dunn, North Carolina
> 1-yr. change in property crime rate: 2,409.7 more crimes per 100k people
> Property crimes reported in 2020: 749 — 54th highest of 2,654 towns
> Property crimes reported in 2019: 514 — 210th highest of 2,654 towns (tied)
> Property crimes per 100K people in 2020: 7,671.8 — 20th highest of 2,654 towns
> Property crimes per 100K people in 2019: 5,262.1 — 119th highest of 2,654 towns
> Population: 9,664

7. North Kansas City, Missouri
> 1-yr. change in property crime rate: 2,481.9 more crimes per 100k people
> Property crimes reported in 2020: 495 — 188th highest of 2,654 towns (tied)
> Property crimes reported in 2019: 377 — 374th highest of 2,654 towns (tied)
> Property crimes per 100K people in 2020: 10,725.9 — 7th highest of 2,654 towns
> Property crimes per 100K people in 2019: 8,244.0 — 18th highest of 2,654 towns
> Population: 4,477
[in-text-ad-2]
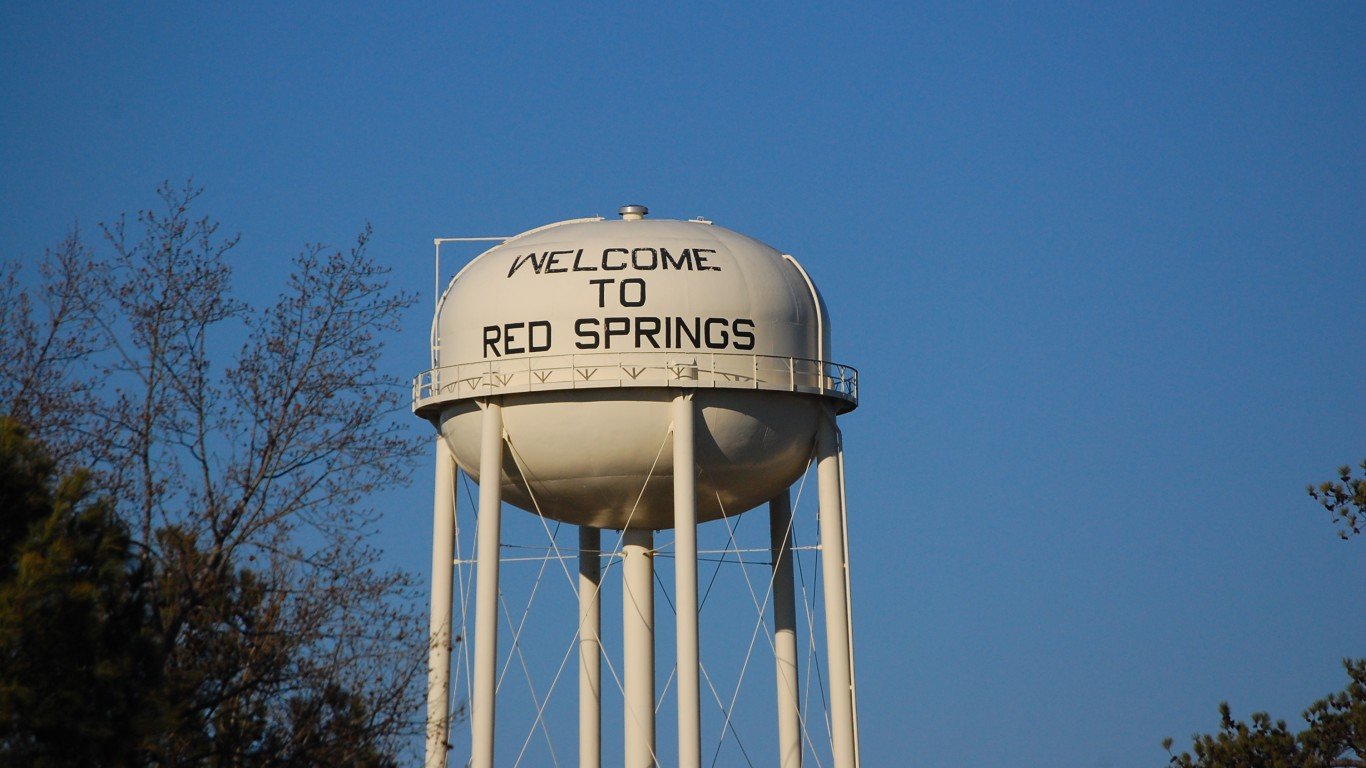
6. Red Springs, North Carolina
> 1-yr. change in property crime rate: 2,513.1 more crimes per 100k people
> Property crimes reported in 2020: 276 — 549th highest of 2,654 towns (tied)
> Property crimes reported in 2019: 197 — 887th highest of 2,654 towns (tied)
> Property crimes per 100K people in 2020: 8,409.5 — 16th highest of 2,654 towns
> Property crimes per 100K people in 2019: 5,896.4 — 73rd highest of 2,654 towns
> Population: 3,378
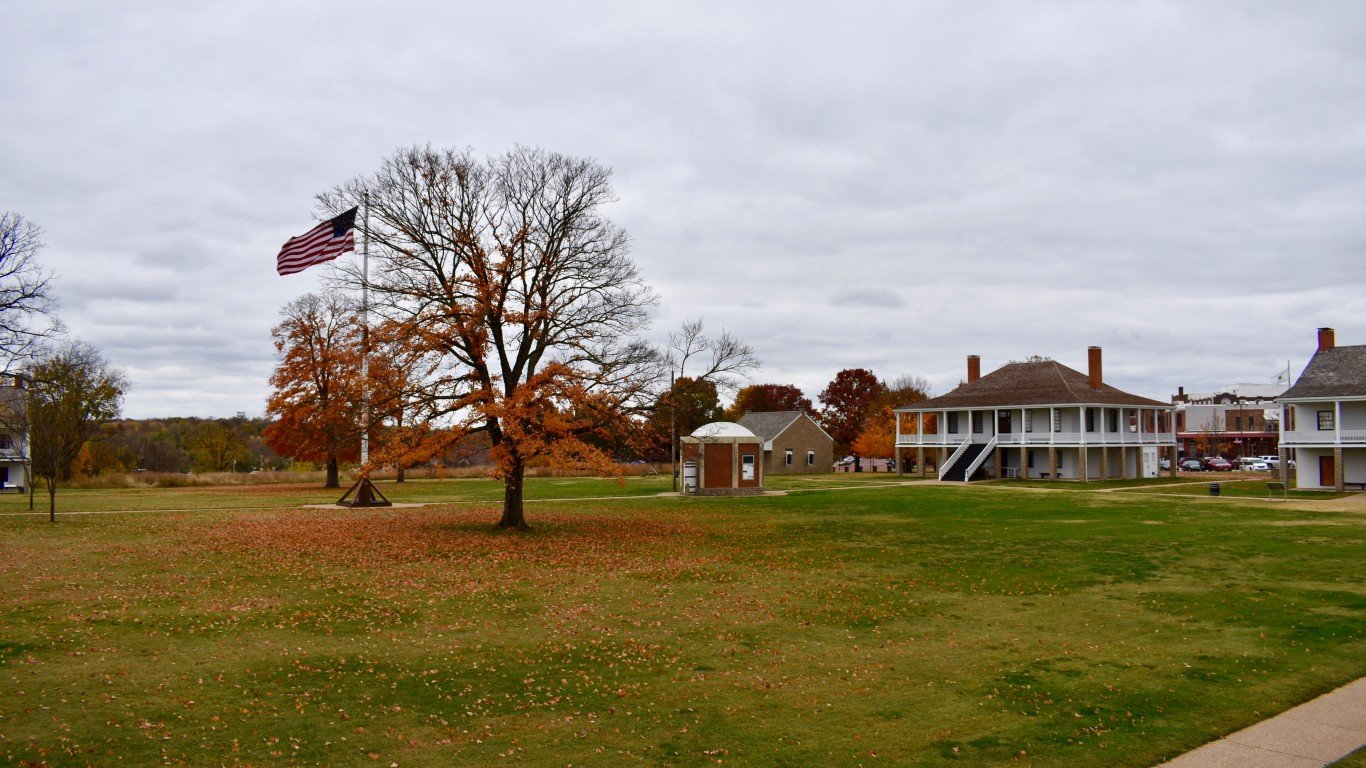
5. Fort Scott, Kansas
> 1-yr. change in property crime rate: 2,529.6 more crimes per 100k people
> Property crimes reported in 2020: 271 — 566th highest of 2,654 towns (tied)
> Property crimes reported in 2019: 78 — 975th lowest of 2,654 towns (tied)
> Property crimes per 100K people in 2020: 3,538.8 — 308th highest of 2,654 towns
> Property crimes per 100K people in 2019: 1,009.2 — 775th lowest of 2,654 towns
> Population: 7,742
[in-text-ad]
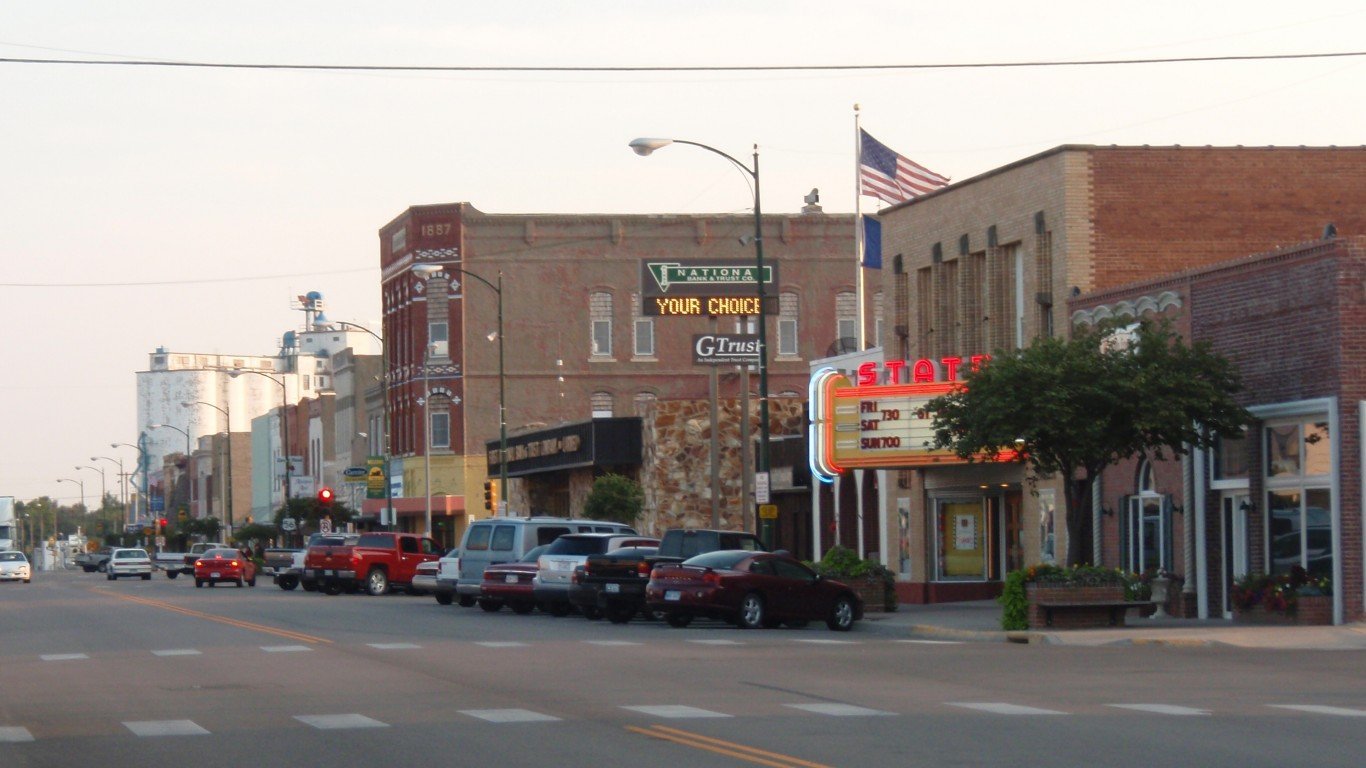
4. Larned, Kansas
> 1-yr. change in property crime rate: 2,611.0 more crimes per 100k people
> Property crimes reported in 2020: 123 — 1,221st highest of 2,654 towns (tied)
> Property crimes reported in 2019: 29 — 290th lowest of 2,654 towns (tied)
> Property crimes per 100K people in 2020: 3,386.6 — 343rd highest of 2,654 towns
> Property crimes per 100K people in 2019: 775.6 — 494th lowest of 2,654 towns
> Population: 3,813
[recirclink id=1055273]
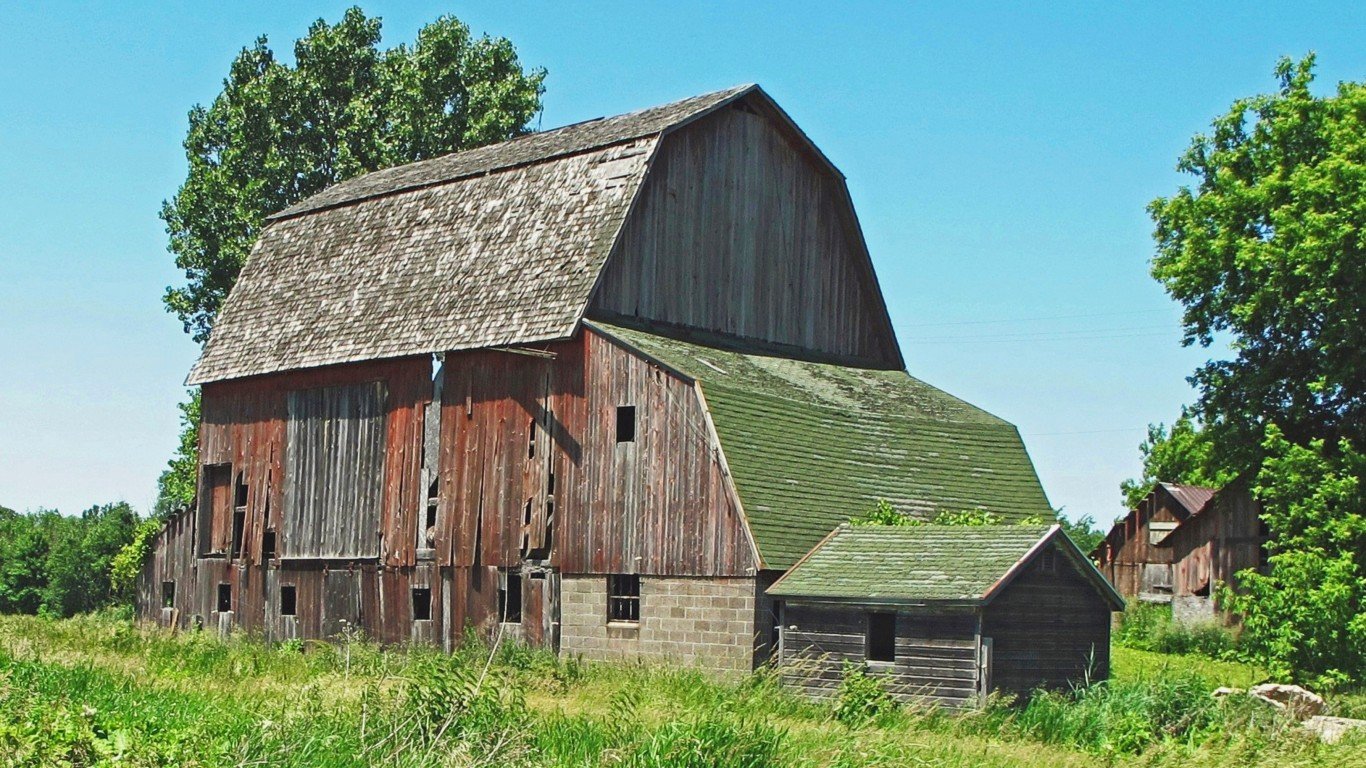
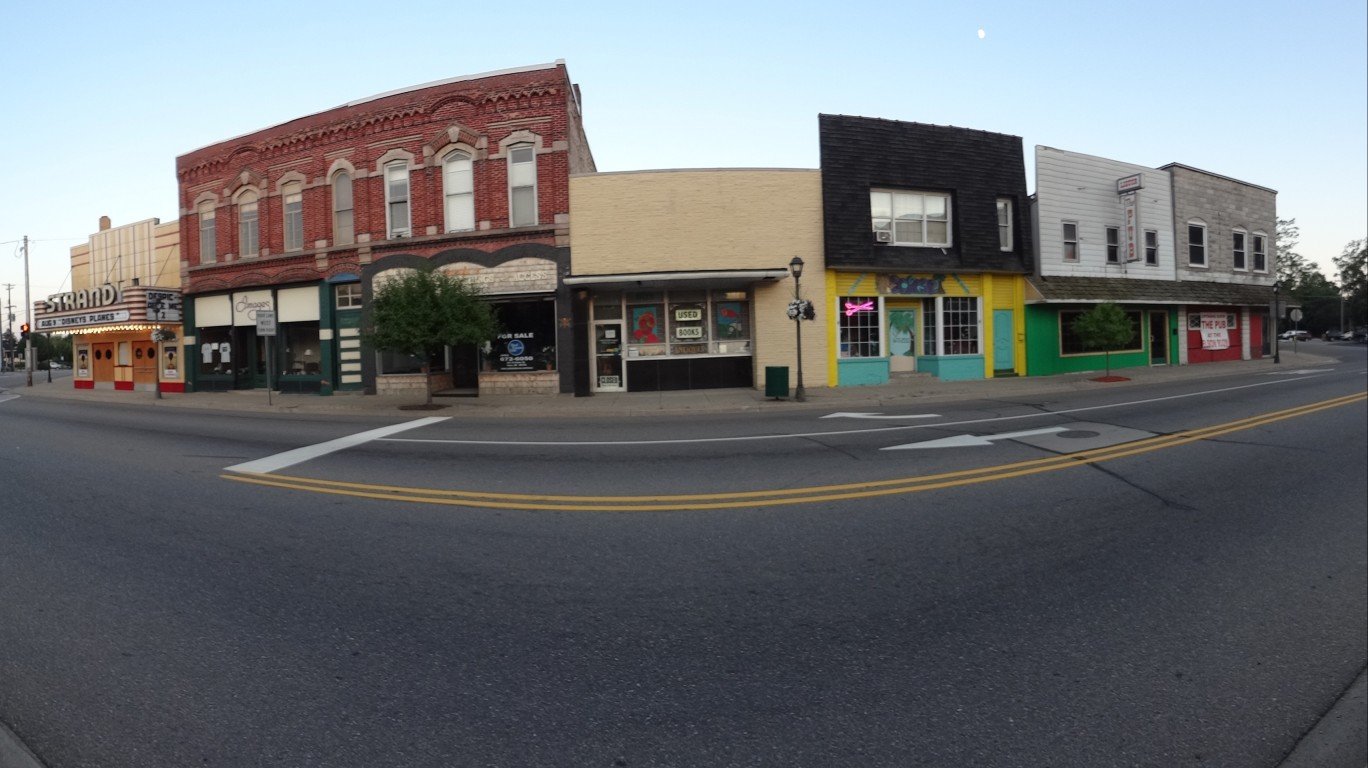
3. Fowlerville, Michigan
> 1-yr. change in property crime rate: 2,674.9 more crimes per 100k people
> Property crimes reported in 2020: 140 — 1,112th highest of 2,654 towns (tied)
> Property crimes reported in 2019: 62 — 779th lowest of 2,654 towns (tied)
> Property crimes per 100K people in 2020: 4,835.9 — 116th highest of 2,654 towns
> Property crimes per 100K people in 2019: 2,161.0 — 902nd highest of 2,654 towns
> Population: 2,881
2. Sheridan, Colorado
> 1-yr. change in property crime rate: 2,882.8 more crimes per 100k people
> Property crimes reported in 2020: 631 — 85th highest of 2,654 towns (tied)
> Property crimes reported in 2019: 450 — 274th highest of 2,654 towns (tied)
> Property crimes per 100K people in 2020: 10,102.5 — 9th highest of 2,654 towns
> Property crimes per 100K people in 2019: 7,219.6 — 31st highest of 2,654 towns
> Population: 6,089
[in-text-ad-2]

1. Tolleson, Arizona
> 1-yr. change in property crime rate: 3,167.5 more crimes per 100k people
> Property crimes reported in 2020: 909 — 31st highest of 2,654 towns
> Property crimes reported in 2019: 666 — 103rd highest of 2,654 towns
> Property crimes per 100K people in 2020: 12,168.7 — 5th highest of 2,654 towns
> Property crimes per 100K people in 2019: 9,001.2 — 11th highest of 2,654 towns
> Population: 7,246
Methodology
To determine the towns where property crime is soaring, 24/7 Wall St. reviewed the change in property crime rate per 100,000 people from the FBI’s 2019 and 2020 Uniform Crime Reports. Property crime includes larceny-theft, burglary, and motor vehicle theft.
We defined towns based on population thresholds — having at least 2,500 people and less than 25,000 people — using five-year estimates from the U.S. Census Bureau’s 2019 American Community Survey. Limited data was available in the 2020 UCR for areas in Alabama, Maryland, Pennsylvania, and Illinois, though towns in these states were not excluded from analysis. Because some state and local agencies changed reporting practices between 2019 and 2020, the figures are not comparable, and these areas were excluded.
Population figures are five-year estimates from the U.S. Census Bureau’s 2019 American Community Survey. However, these estimates were not used to calculate crime rates. Crime rates per 100,000 people were calculated using population figures provided by the FBI in the 2020 and 2019 UCR.
Contact [email protected] for any questions or corrections.