Motor vehicle theft, one of the most serious offenses tracked by the FBI, is on the rise in the United States. There were a total of 810,400 motor vehicle thefts nationwide in 2020, the most in over a decade.
Motor vehicle theft can be either the theft or attempted theft of a vehicle, such as a car, truck, ATV, or motorcycle. Some experts attribute the rising rates of vehicle theft to the COVID-19 pandemic, which led to vehicles sitting unattended and unused for longer than usual. Additionally, vehicle theft is often committed for monetary gain, and the pandemic sent unemployment soaring and left many Americans struggling financially.
While motorists nationwide now face a greater risk of vehicle theft than they have in many years, in some parts of the country, car owners are far more likely to be victims of car theft than in others.
Using data from the FBI’s 2020 Uniform Crime Report, 24/7 Wall St. identified the metro areas where your car is most likely to be stolen in every state. Metropolitan areas are ranked by the number of motor vehicle thefts reported for every 100,000 people.
It is important to note that in eight states, there is only one eligible metro area with available data. In each of these cases, which are noted, the metro area listed ranks as having the highest motor vehicle theft rate by default only. In two states — Alabama and Pennsylvania — there are no qualifying metro areas with available crime data.
Though each of the metro areas on this list ranks as having the highest motor vehicle rate in its respective state, vehicle theft rates in these places vary considerably, from 38 incidents per 100,000 people to 839 per 100,000. Still, in the majority of the metro areas on this list, vehicle theft rates exceed the statewide rate as well as the national rate of 246 per 100,000.
Motor vehicle theft — along with larceny and burglary — is one of three criminal offenses that make up the property crime category. Due in large part to higher than average vehicle theft rates, in most metro areas on this list, the overall property crime rate exceeds the comparable statewide rate. Here is a look at the 10 most stolen cars in America.
Click here to see the metro where your car is most likely to be stolen in every state
Click here to read our detailed methodology

Alabama: No eligible metros
> 2020 vehicle thefts per 100K people: N/A (Alabama: 222.0)
> Total vehicle thefts: N/A (Alabama: 10,926)
> Property crimes per 100K people: N/A (Alabama: 2,136.8)
> Total property crimes: N/A (Alabama: 105,161)
> Population: N/A
[in-text-ad]

Alaska: Fairbanks
> 2020 vehicle thefts per 100K people: 643.9 (Alaska: 269.3)
> Total vehicle thefts: 212 (Alaska: 1,969)
> Property crimes per 100K people: 4,152.2 (Alaska: 2,260.5)
> Total property crimes: 1,367 (Alaska: 16,528)
> Population: 96,849
[recirclink id=997124]

Arizona: Phoenix-Mesa-Chandler
> 2020 vehicle thefts per 100K people: 257.5 (Arizona: 241.7)
> Total vehicle thefts: 13,041 (Arizona: 17,937)
> Property crimes per 100K people: 2,217.4 (Arizona: 2,227.7)
> Total property crimes: 112,293 (Arizona: 165,323)
> Population: 4,948,203
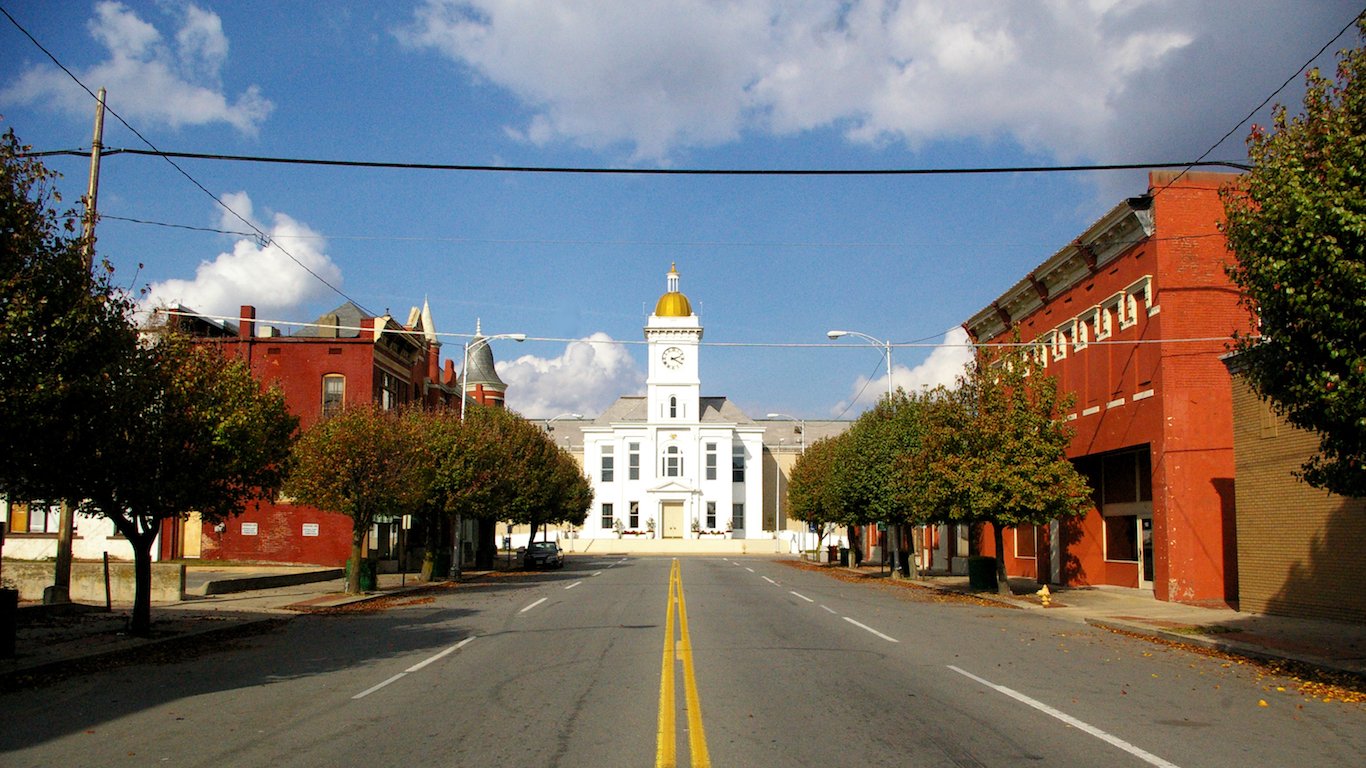
Arkansas: Pine Bluff
> 2020 vehicle thefts per 100K people: 404.4 (Arkansas: 261.8)
> Total vehicle thefts: 350 (Arkansas: 7,933)
> Property crimes per 100K people: 3,048.3 (Arkansas: 2,613.4)
> Total property crimes: 2,638 (Arkansas: 79,200)
> Population: 89,437
[in-text-ad-2]
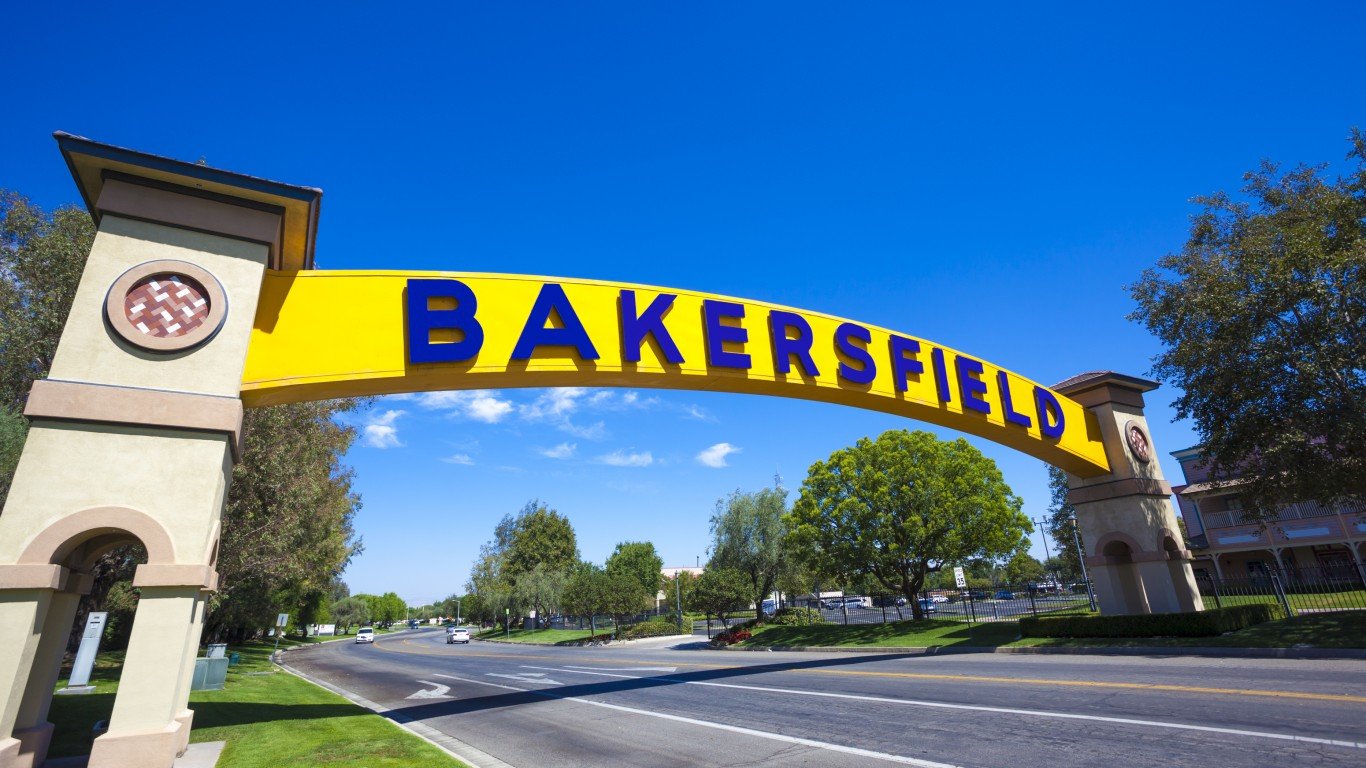
California: Bakersfield
> 2020 vehicle thefts per 100K people: 839.4 (California: 427.6)
> Total vehicle thefts: 7,537 (California: 168,323)
> Property crimes per 100K people: 3,106.0 (California: 2,138.9)
> Total property crimes: 27,890 (California: 842,054)
> Population: 900,202

Colorado: Denver-Aurora-Lakewood
> 2020 vehicle thefts per 100K people: 734.2 (Colorado: 524.3)
> Total vehicle thefts: 22,011 (Colorado: 30,452)
> Property crimes per 100K people: 3,302.7 (Colorado: 2,833.8)
> Total property crimes: 99,017 (Colorado: 164,582)
> Population: 2,967,239
[in-text-ad]

Connecticut: New Haven-Milford
> 2020 vehicle thefts per 100K people: 346.9 (Connecticut: 236.8)
> Total vehicle thefts: 2,773 (Connecticut: 8,422)
> Property crimes per 100K people: 2,169.2 (Connecticut: 1,565.1)
> Total property crimes: 17,342 (Connecticut: 55,670)
> Population: 854,757
[recirclink id=1000581]

Delaware: Dover
> 2020 vehicle thefts per 100K people: 110.5 (Delaware: 168.7)
> Total vehicle thefts: 203 (Delaware: 1,665)
> Property crimes per 100K people: 1,853.3 (Delaware: 1,961.4)
> Total property crimes: 3,404 (Delaware: 19,355)
> Population: 180,786
*Because Dover is the only eligible metro in Delaware, it is the metro where your car is most likely to be stolen by default.

Florida: Miami-Fort Lauderdale-Pompano Beach
> 2020 vehicle thefts per 100K people: 244.7 (Florida: 176.1)
> Total vehicle thefts: 15,212 (Florida: 38,271)
> Property crimes per 100K people: 2,192.4 (Florida: 1,769.4)
> Total property crimes: 136,292 (Florida: 384,556)
> Population: 6,166,488
[in-text-ad-2]

Georgia: Macon-Bibb County
> 2020 vehicle thefts per 100K people: 367.1 (Georgia: 238.2)
> Total vehicle thefts: 842 (Georgia: 25,506)
> Property crimes per 100K people: 2,745.9 (Georgia: 2,007.4)
> Total property crimes: 6,299 (Georgia: 214,988)
> Population: 231,130

Hawaii: Kahului-Wailuku-Lahaina
> 2020 vehicle thefts per 100K people: 256.6 (Hawaii: 379.8)
> Total vehicle thefts: 429 (Hawaii: 5,344)
> Property crimes per 100K people: 2,115.7 (Hawaii: 2,411.4)
> Total property crimes: 3,537 (Hawaii: 33,928)
> Population: 167,488
*Because Kahului-Wailuku-Lahaina is the only eligible metro in Hawaii, it is the metro where your car is most likely to be stolen by default.
[in-text-ad]

Idaho: Pocatello
> 2020 vehicle thefts per 100K people: 170.6 (Idaho: 96.7)
> Total vehicle thefts: 165 (Idaho: 1,767)
> Property crimes per 100K people: 1,806.1 (Idaho: 1,111.9)
> Total property crimes: 1,747 (Idaho: 20,313)
> Population: 94,588
[recirclink id=1007332]

Illinois: Danville
> 2020 vehicle thefts per 100K people: 227.5 (Illinois: 169.5)
> Total vehicle thefts: 170 (Illinois: 21,332)
> Property crimes per 100K people: N/A (Illinois: 1,559.4)
> Total property crimes: N/A (Illinois: 196,287)
> Population: 75,758

Indiana: South Bend-Mishawaka
> 2020 vehicle thefts per 100K people: 295.3 (Indiana: 228.5)
> Total vehicle thefts: 956 (Indiana: 15,435)
> Property crimes per 100K people: 2,172.1 (Indiana: 1,783.2)
> Total property crimes: 7,031 (Indiana: 120,453)
> Population: 323,613
[in-text-ad-2]

Iowa: Des Moines-West Des Moines
> 2020 vehicle thefts per 100K people: 288.8 (Iowa: 197.1)
> Total vehicle thefts: 2,049 (Iowa: 6,235)
> Property crimes per 100K people: 2,023.5 (Iowa: 1,698.2)
> Total property crimes: 14,354 (Iowa: 53,725)
> Population: 699,292
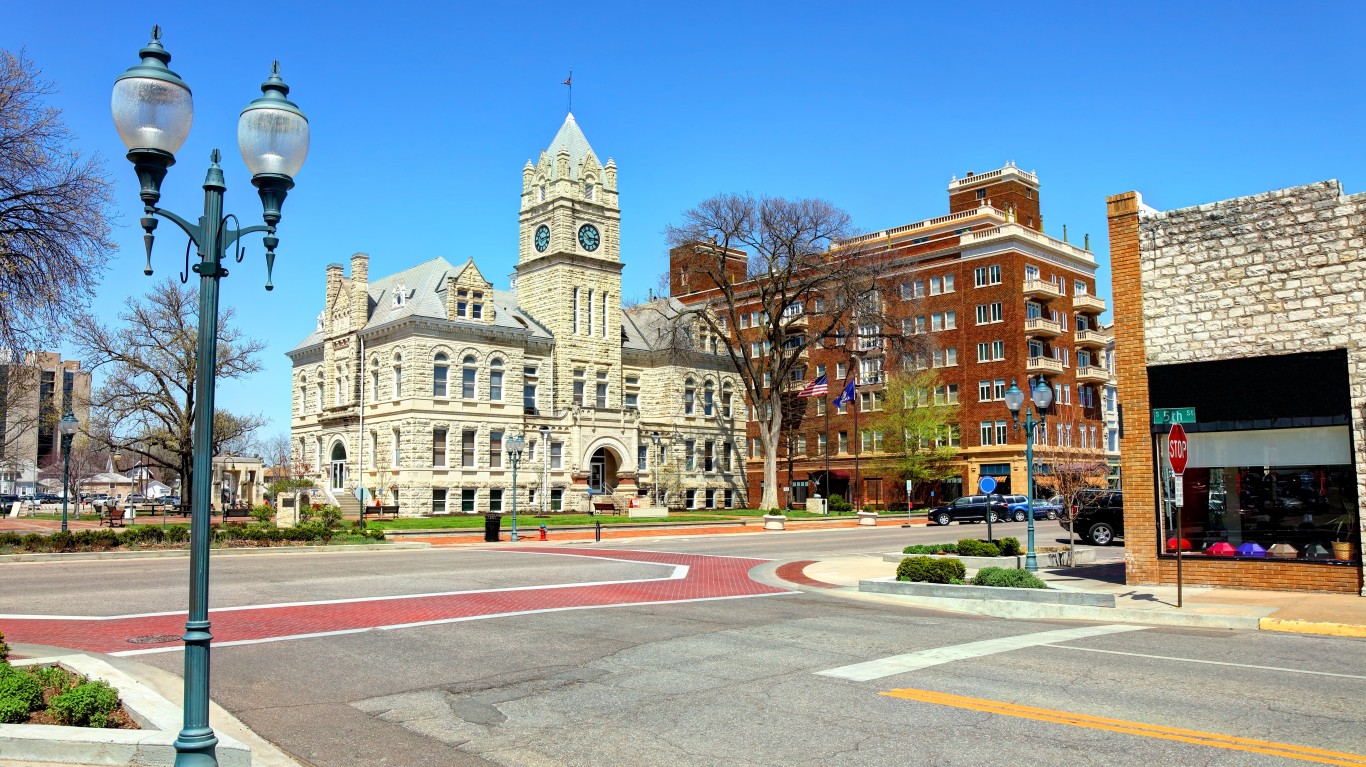
Kansas: Manhattan
> 2020 vehicle thefts per 100K people: 125.1 (Kansas: 248.1)
> Total vehicle thefts: 163 (Kansas: 7,229)
> Property crimes per 100K people: N/A (Kansas: 2,199.1)
> Total property crimes: N/A (Kansas: 64,077)
> Population: 130,285
*Because Manhattan is the only eligible metro in Kansas, it is the metro where your car is most likely to be stolen by default.
[in-text-ad]

Kentucky: Owensboro
> 2020 vehicle thefts per 100K people: 292.9 (Kentucky: 256.8)
> Total vehicle thefts: 351 (Kentucky: 11,497)
> Property crimes per 100K people: 2,330.6 (Kentucky: 1,779.5)
> Total property crimes: 2,793 (Kentucky: 79,673)
> Population: 121,128
[recirclink id=1011842]

Louisiana: New Orleans-Metairie
> 2020 vehicle thefts per 100K people: 367.5 (Louisiana: 266.9)
> Total vehicle thefts: 4,686 (Louisiana: 12,400)
> Property crimes per 100K people: 2,754.6 (Louisiana: 2,884.4)
> Total property crimes: 35,121 (Louisiana: 133,989)
> Population: 1,270,530

Maine: Bangor
> 2020 vehicle thefts per 100K people: 84.6 (Maine: 63.8)
> Total vehicle thefts: 129 (Maine: 862)
> Property crimes per 100K people: 1,534.7 (Maine: 1,156.2)
> Total property crimes: 2,339 (Maine: 15,610)
> Population: 152,148
[in-text-ad-2]
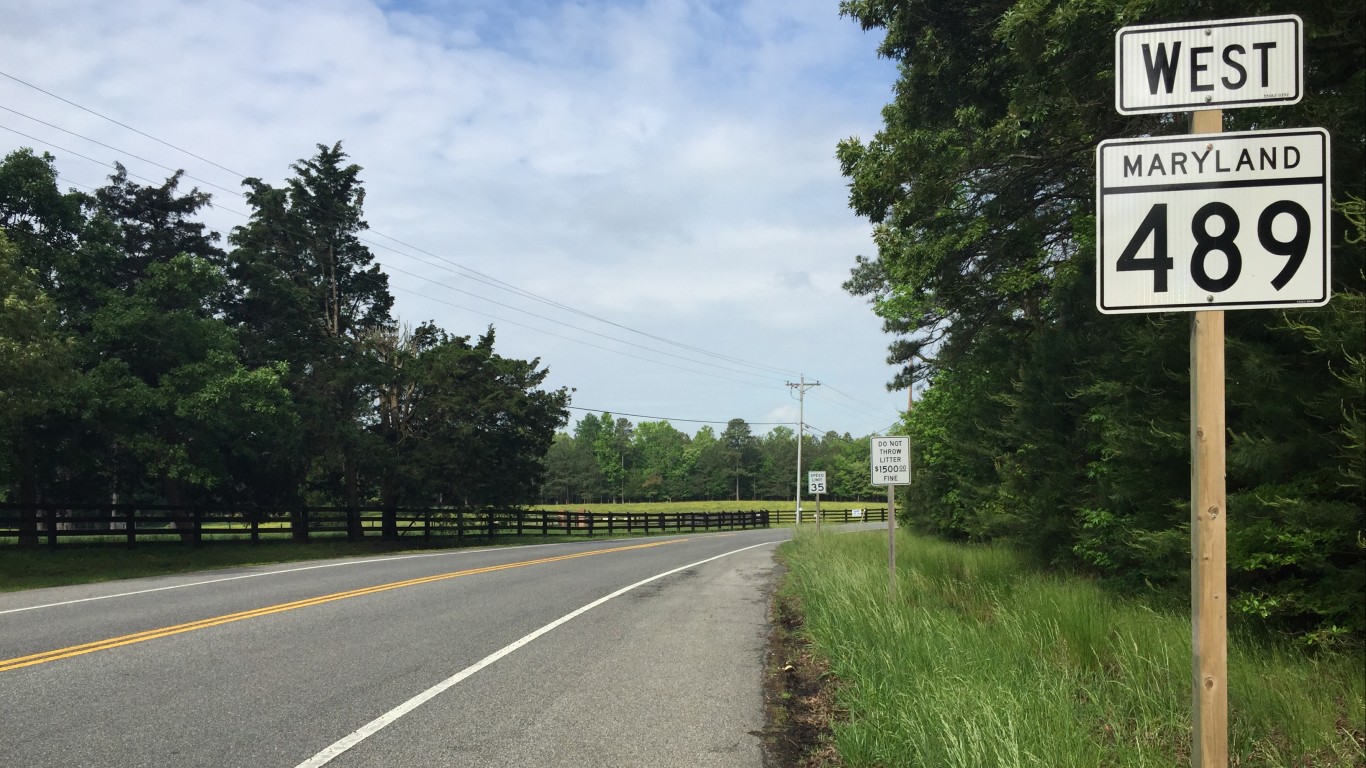
Maryland: California-Lexington Park
> 2020 vehicle thefts per 100K people: 76.3 (Maryland: 172.9)
> Total vehicle thefts: 87 (Maryland: 10,469)
> Property crimes per 100K people: 1,364.5 (Maryland: 1,609.8)
> Total property crimes: 1,556 (Maryland: 97,487)
> Population: 113,510
*Because California-Lexington Park is the only eligible metro in Maryland, it is the metro where your car is most likely to be stolen by default.

Massachusetts: Springfield
> 2020 vehicle thefts per 100K people: 150.3 (Massachusetts: 99.2)
> Total vehicle thefts: 1,043 (Massachusetts: 6,835)
> Property crimes per 100K people: 1,554.5 (Massachusetts: 1,053.2)
> Total property crimes: 10,788 (Massachusetts: 72,602)
> Population: 697,382
[in-text-ad]

Michigan: Kalamazoo-Portage
> 2020 vehicle thefts per 100K people: 404.1 (Michigan: 184.5)
> Total vehicle thefts: 1,074 (Michigan: 18,385)
> Property crimes per 100K people: 3,306.6 (Michigan: 1,360.9)
> Total property crimes: 8,789 (Michigan: 135,633)
> Population: 265,066
[recirclink id=1011738]

Minnesota: Duluth
> 2020 vehicle thefts per 100K people: 169.3 (Minnesota: 250.0)
> Total vehicle thefts: 487 (Minnesota: 14,146)
> Property crimes per 100K people: 2,407.5 (Minnesota: 2,124.9)
> Total property crimes: 6,924 (Minnesota: 120,212)
> Population: 289,383
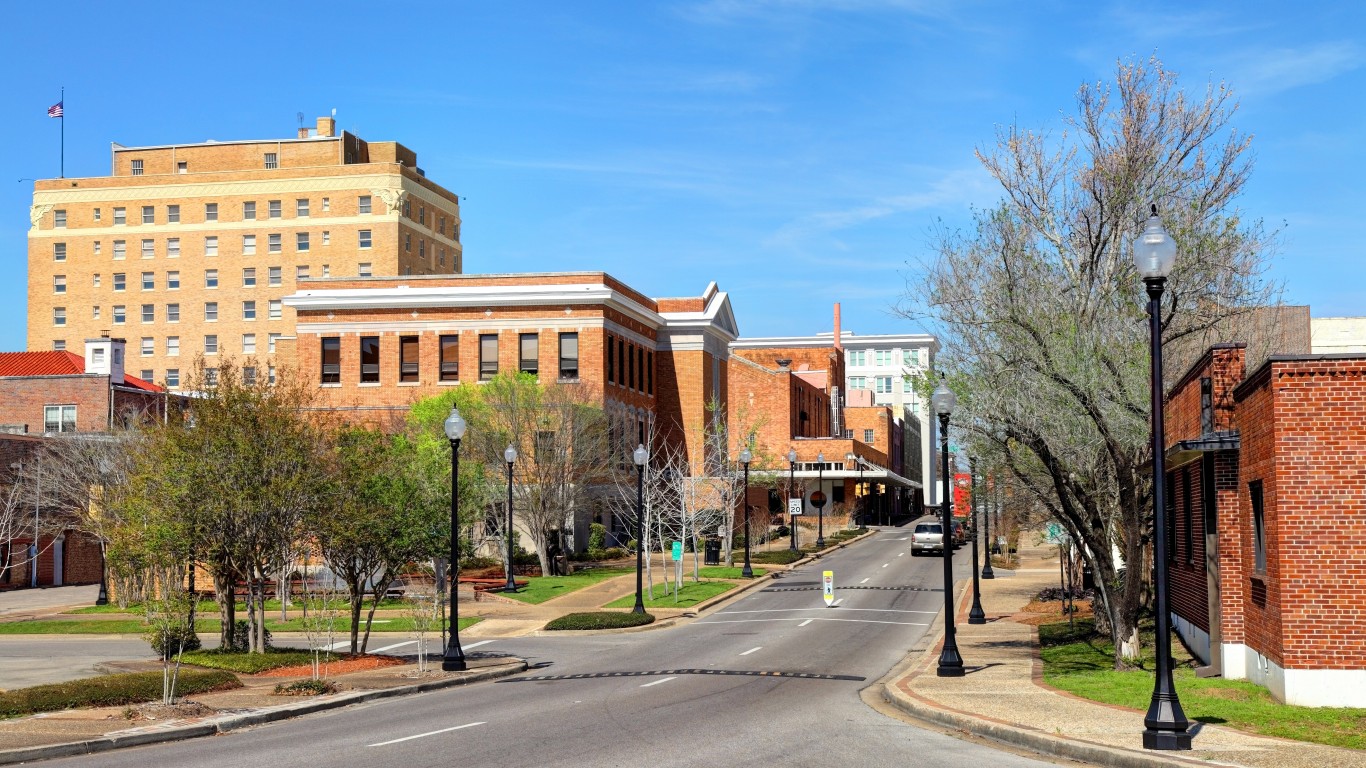
Mississippi: Hattiesburg
> 2020 vehicle thefts per 100K people: 188.2 (Mississippi: 205.0)
> Total vehicle thefts: 318 (Mississippi: 6,083)
> Property crimes per 100K people: 2,215.6 (Mississippi: 2,101.6)
> Total property crimes: 3,743 (Mississippi: 62,351)
> Population: 168,469
*Because Hattiesburg is the only eligible metro in Mississippi, it is the metro where your car is most likely to be stolen by default.
[in-text-ad-2]

Missouri: St. Joseph
> 2020 vehicle thefts per 100K people: 530.7 (Missouri: 393.2)
> Total vehicle thefts: 663 (Missouri: 24,189)
> Property crimes per 100K people: 3,541.3 (Missouri: 2,531.0)
> Total property crimes: 4,424 (Missouri: 155,698)
> Population: 125,411
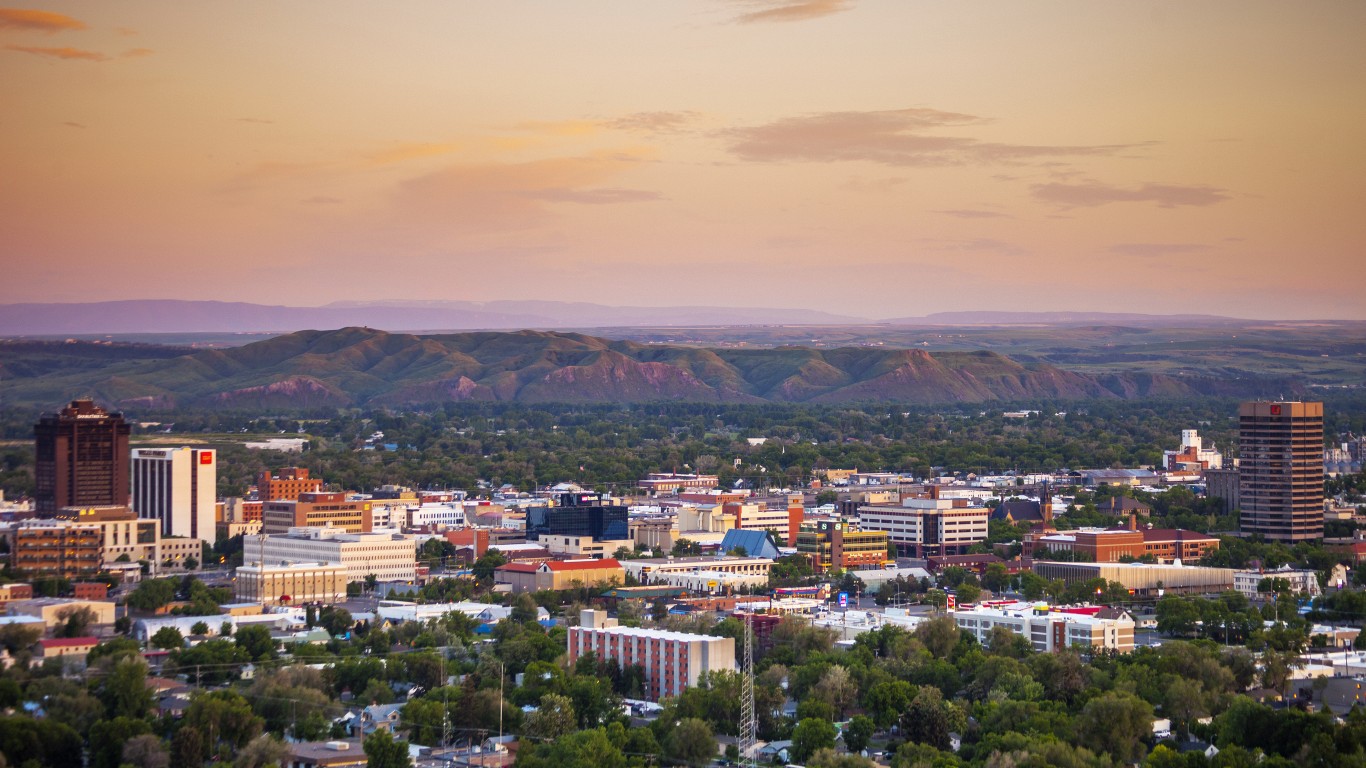
Montana: Billings
> 2020 vehicle thefts per 100K people: 543.3 (Montana: 247.6)
> Total vehicle thefts: 998 (Montana: 2,676)
> Property crimes per 100K people: 3,471.9 (Montana: 2,120.8)
> Total property crimes: 6,378 (Montana: 22,917)
> Population: 181,667
[in-text-ad]
Nebraska: Omaha-Council Bluffs
> 2020 vehicle thefts per 100K people: 420.2 (Nebraska: 260.5)
> Total vehicle thefts: 4,012 (Nebraska: 5,048)
> Property crimes per 100K people: 2,280.9 (Nebraska: 1,909.2)
> Total property crimes: 21,780 (Nebraska: 36,991)
> Population: 949,726
[recirclink id=997124]

Nevada: Las Vegas-Henderson-Paradise
> 2020 vehicle thefts per 100K people: 370.1 (Nevada: 336.4)
> Total vehicle thefts: 8,564 (Nevada: 10,556)
> Property crimes per 100K people: 2,046.5 (Nevada: 1,926.6)
> Total property crimes: 47,356 (Nevada: 60,462)
> Population: 2,266,715

New Hampshire: Manchester-Nashua
> 2020 vehicle thefts per 100K people: 77.7 (New Hampshire: 76.4)
> Total vehicle thefts: 326 (New Hampshire: 1,044)
> Property crimes per 100K people: 1,138.0 (New Hampshire: 1,098.9)
> Total property crimes: 4,772 (New Hampshire: 15,014)
> Population: 417,025
*Because Manchester-Nashua is the only eligible metro in New Hampshire, it is the metro where your car is most likely to be stolen by default.
[in-text-ad-2]

New Jersey: Trenton-Princeton
> 2020 vehicle thefts per 100K people: 130.0 (New Jersey: 115.7)
> Total vehicle thefts: 477 (New Jersey: 10,278)
> Property crimes per 100K people: 1,337.9 (New Jersey: 1,158.2)
> Total property crimes: 4,910 (New Jersey: 102,875)
> Population: 367,430

New Mexico: Albuquerque
> 2020 vehicle thefts per 100K people: 662.5 (New Mexico: 427.6)
> Total vehicle thefts: 6,120 (New Mexico: 9,006)
> Property crimes per 100K people: 3,654.1 (New Mexico: 2,841.9)
> Total property crimes: 33,754 (New Mexico: 59,859)
> Population: 914,480
[in-text-ad]

New York: Buffalo-Cheektowaga
> 2020 vehicle thefts per 100K people: 194.9 (New York: 101.7)
> Total vehicle thefts: 2,183 (New York: 19,656)
> Property crimes per 100K people: 1,926.3 (New York: 1,410.7)
> Total property crimes: 21,574 (New York: 272,788)
> Population: 1,127,983
[recirclink id=1000581]

North Carolina: Greensboro-High Point
> 2020 vehicle thefts per 100K people: 262.4 (North Carolina: 193.6)
> Total vehicle thefts: 2,040 (North Carolina: 20,520)
> Property crimes per 100K people: 2,674.6 (North Carolina: 2,226.5)
> Total property crimes: 20,792 (North Carolina: 236,026)
> Population: 771,851

North Dakota: Bismarck
> 2020 vehicle thefts per 100K people: 312.3 (North Dakota: 271.0)
> Total vehicle thefts: 405 (North Dakota: 2,074)
> Property crimes per 100K people: 2,847.1 (North Dakota: 2,124.1)
> Total property crimes: 3,692 (North Dakota: 16,256)
> Population: 129,115
[in-text-ad-2]
Ohio: Springfield
> 2020 vehicle thefts per 100K people: 276.5 (Ohio: 171.7)
> Total vehicle thefts: 369 (Ohio: 20,077)
> Property crimes per 100K people: 2,901.3 (Ohio: 1,850.3)
> Total property crimes: 3,872 (Ohio: 216,363)
> Population: 134,083

Oklahoma: Tulsa
> 2020 vehicle thefts per 100K people: 534.9 (Oklahoma: 378.0)
> Total vehicle thefts: 5,378 (Oklahoma: 15,047)
> Property crimes per 100K people: 3,109.7 (Oklahoma: 2,705.6)
> Total property crimes: 31,267 (Oklahoma: 107,705)
> Population: 998,655
[in-text-ad]

Oregon: Salem
> 2020 vehicle thefts per 100K people: 480.4 (Oregon: 391.0)
> Total vehicle thefts: 2,098 (Oregon: 16,585)
> Property crimes per 100K people: 2,853.6 (Oregon: 2,659.0)
> Total property crimes: 12,462 (Oregon: 112,782)
> Population: 433,903
[recirclink id=1007332]

Pennsylvania: No eligible metros
> 2020 vehicle thefts per 100K people: N/A (Pennsylvania: 121.0)
> Total vehicle thefts: N/A (Pennsylvania: 15,474)
> Property crimes per 100K people: N/A (Pennsylvania: 1,644.1)
> Total property crimes: N/A (Pennsylvania: 210,167)
> Population: N/A

Rhode Island: Providence-Warwick
> 2020 vehicle thefts per 100K people: 126.6 (Rhode Island: 142.7)
> Total vehicle thefts: 2,053 (Rhode Island: 1,509)
> Property crimes per 100K people: 1,160.2 (Rhode Island: 1,245.5)
> Total property crimes: 18,808 (Rhode Island: 13,166)
> Population: 1,624,578
*Because Providence-Warwick is the only eligible metro in Rhode Island, it is the metro where your car is most likely to be stolen by default.
[in-text-ad-2]

South Carolina: Florence
> 2020 vehicle thefts per 100K people: 403.8 (South Carolina: 282.1)
> Total vehicle thefts: 828 (South Carolina: 14,718)
> Property crimes per 100K people: 3,600.8 (South Carolina: 2,721.1)
> Total property crimes: 7,384 (South Carolina: 141,987)
> Population: 204,911

South Dakota: Rapid City
> 2020 vehicle thefts per 100K people: 405.9 (South Dakota: 259.3)
> Total vehicle thefts: 584 (South Dakota: 2,315)
> Property crimes per 100K people: 2,971.1 (South Dakota: 1,956.7)
> Total property crimes: 4,275 (South Dakota: 17,468)
> Population: 142,191
[in-text-ad]

Tennessee: Chattanooga
> 2020 vehicle thefts per 100K people: 513.6 (Tennessee: 306.4)
> Total vehicle thefts: 2,923 (Tennessee: 21,098)
> Property crimes per 100K people: 3,070.2 (Tennessee: 2,492.8)
> Total property crimes: 17,474 (Tennessee: 171,675)
> Population: 566,153
[recirclink id=1011842]

Texas: Odessa
> 2020 vehicle thefts per 100K people: 517.5 (Texas: 287.0)
> Total vehicle thefts: 876 (Texas: 84,276)
> Property crimes per 100K people: 2,956.8 (Texas: 2,245.0)
> Total property crimes: 5,005 (Texas: 659,160)
> Population: 166,223

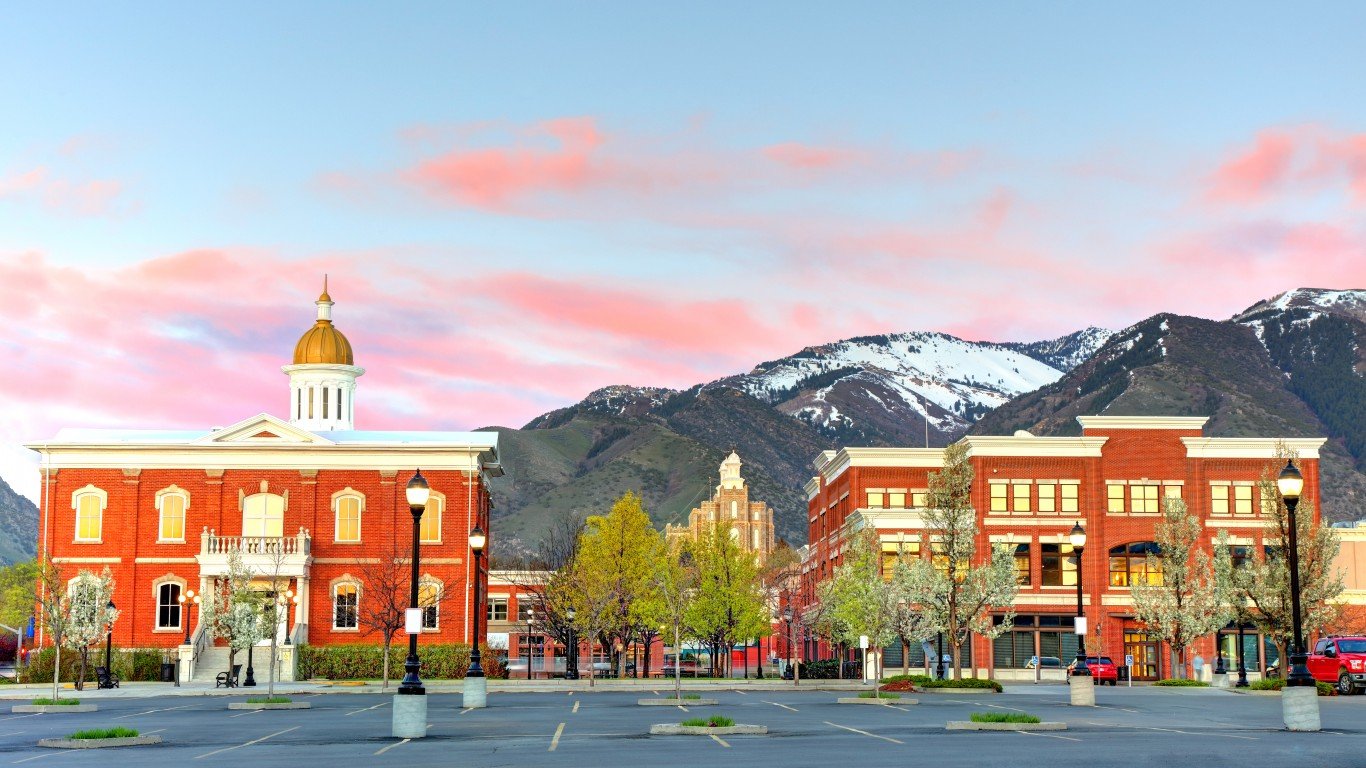
Utah: Salt Lake City
> 2020 vehicle thefts per 100K people: 544.4 (Utah: 316.6)
> Total vehicle thefts: 6,785 (Utah: 10,288)
> Property crimes per 100K people: 3,816.8 (Utah: 2,464.4)
> Total property crimes: 47,566 (Utah: 80,091)
> Population: 1,232,696
[in-text-ad-2]

Vermont: Burlington-South Burlington
> 2020 vehicle thefts per 100K people: 37.5 (Vermont: 42.4)
> Total vehicle thefts: 83 (Vermont: 264)
> Property crimes per 100K people: 1,609.5 (Vermont: 1,217.0)
> Total property crimes: 3,561 (Vermont: 7,586)
> Population: 219,433
*Because Burlington-South Burlington is the only eligible metro in Vermont, it is the metro where your car is most likely to be stolen by default.

Virginia: Roanoke
> 2020 vehicle thefts per 100K people: 189.5 (Virginia: 126.3)
> Total vehicle thefts: 594 (Virginia: 10,853)
> Property crimes per 100K people: 2,107.6 (Virginia: 1,456.4)
> Total property crimes: 6,607 (Virginia: 125,114)
> Population: 312,796
[in-text-ad]

Washington: Seattle-Tacoma-Bellevue
> 2020 vehicle thefts per 100K people: 457.2 (Washington: 356.1)
> Total vehicle thefts: 18,428 (Washington: 27,399)
> Property crimes per 100K people: 3,156.9 (Washington: 2,732.4)
> Total property crimes: 127,233 (Washington: 210,223)
> Population: 3,979,845
[recirclink id=1011738]

West Virginia: Charleston
> 2020 vehicle thefts per 100K people: 247.7 (West Virginia: 127.2)
> Total vehicle thefts: 631 (West Virginia: 2,271)
> Property crimes per 100K people: 2,305.7 (West Virginia: 1,399.4)
> Total property crimes: 5,873 (West Virginia: 24,976)
> Population: 257,814

Wisconsin: Milwaukee-Waukesha
> 2020 vehicle thefts per 100K people: 350.9 (Wisconsin: 161.0)
> Total vehicle thefts: 5,530 (Wisconsin: 9,393)
> Property crimes per 100K people: 1,955.8 (Wisconsin: 1,485.7)
> Total property crimes: 30,821 (Wisconsin: 86,654)
> Population: 1,575,179
[in-text-ad-2]

Wyoming: Cheyenne
> 2020 vehicle thefts per 100K people: 297.0 (Wyoming: 165.5)
> Total vehicle thefts: 299 (Wyoming: 964)
> Property crimes per 100K people: 2,599.8 (Wyoming: 1,610.6)
> Total property crimes: 2,617 (Wyoming: 9,379)
> Population: 99,500
Methodology
To determine the metro area where your car is most likely to be stolen in every state, 24/7 Wall St. reviewed motor vehicle theft figures from the FBI’s 2020 Uniform Crime Report.
Limited data was available in the 2020 UCR for areas in Alabama, Maryland, Pennsylvania, and Illinois, though these states were not excluded from analysis. Only metro areas for which the boundaries defined by the FBI match the boundaries as defined by the U.S. Census Bureau were considered.
Data for property crime — a category that includes larceny-theft, burglary, and motor vehicle theft — also came from the 2020 FBI UCR. Population figures are one-year estimates from the U.S. Census Bureau’s 2019 American Community Survey. However, these estimates were not used to calculate crime rates. Crime rates per 100,000 people were calculated using population figures provided by the FBI in the 2020 UCR.
Contact [email protected] for any questions or corrections.