
Driven by a surge in homicides and an increase in cases of aggravated assault, the U.S. violent crime rate rose in 2020, according to data from the FBI. One bright spot in the latest data was a decline in reported robberies. In a continuation of a multi-decade trend, the number of robberies committed in the U.S. fell by 9%, from about 268,500 in 2019 to 243,600 in 2020.
According to the FBI, robbery is a crime in which force or the threat of force or violence is used to take, or attempt to take, anything of value from another person. The largest share of robberies in the United States are committed on streets or sidewalks. Handguns are the most commonly used weapon in robberies, and more often than not, among the cases where a suspect can be identified, the offender and victim are strangers to one another.
The decline in the national robbery rate is being driven in part by particularly steep drops in certain metropolitan areas.
Using data from the FBI, 24/7 Wall St. identified the 50 metro areas where the robbery rate is falling fastest. Metro areas are ranked by the year-over-year change in the number of robberies per 100,000 people. Among the metro areas on this list, robbery rates have fallen by as much as 54 incidents per 100,000 people. For context, the U.S. robbery rate fell by 8 incidents per 100,000 in 2020.
Robbery – along with rаpe, aggravated assault, and homicide – is one component of the overall violent crime category. Robbery accounts for only a small percentage of all violent crimes, however, and despite falling robbery rates, most of the metro areas on this list reported an increase in violent crime overall in 2020. Here is a look at the states where crime is soaring.
The largest share of metro areas on this list are in the South, including eight in Florida alone. Most of the metro areas on this list have a lower robbery rate than the national rate of 74 incidents per 100,000 people. Here is a look at the states with the highest robbery rates.
Click here to see the metro areas where robberies are declining
Click here to read our detailed methodology

50. Clarksville, TN-KY
> 1-yr. change in reported robberies per 100K: -11.2
> Robberies reported in 2020: 117 — 104th highest of 213 metros
> Robberies per 100K people in 2020: 37.5 — 83rd lowest of 213 metros
> 1-yr. change in all violent crime per 100k people: +36.1 — 66th highest of 209 metros
> Violent crimes per 100K people in 2020: 423.6 — 75th highest of 211 metros
> Population: 311,073
[in-text-ad]

49. Burlington, NC
> 1-yr. change in reported robberies per 100K: -11.6
> Robberies reported in 2020: 80 — 88th lowest of 213 metros
> Robberies per 100K people in 2020: 46.6 — 103rd highest of 213 metros
> 1-yr. change in all violent crime per 100k people: +70.1 — 27th highest of 209 metros
> Violent crimes per 100K people in 2020: 477.7 — 52nd highest of 211 metros
> Population: 169,509
[recirclink id=1055273]

48. Cape Coral-Fort Myers, FL
> 1-yr. change in reported robberies per 100K: -11.6
> Robberies reported in 2020: 304 — 59th highest of 213 metros
> Robberies per 100K people in 2020: 38.6 — 89th lowest of 213 metros
> 1-yr. change in all violent crime per 100k people: +9.1 — 94th lowest of 209 metros
> Violent crimes per 100K people in 2020: 266.8 — 64th lowest of 211 metros
> Population: 770,577

47. Lafayette, LA
> 1-yr. change in reported robberies per 100K: -12.1
> Robberies reported in 2020: 276 — 63rd highest of 213 metros
> Robberies per 100K people in 2020: 56.3 — 81st highest of 213 metros
> 1-yr. change in all violent crime per 100k people: -16.5 — 36th lowest of 209 metros
> Violent crimes per 100K people in 2020: 450.0 — 61st highest of 211 metros
> Population: 489,207
[in-text-ad-2]

46. Trenton-Princeton, NJ
> 1-yr. change in reported robberies per 100K: -12.1
> Robberies reported in 2020: 343 — 53rd highest of 213 metros
> Robberies per 100K people in 2020: 93.5 — 24th highest of 213 metros
> 1-yr. change in all violent crime per 100k people: +11.9 — 100th lowest of 209 metros
> Violent crimes per 100K people in 2020: 358.6 — 105th highest of 211 metros
> Population: 367,430

45. Cincinnati, OH-KY-IN
> 1-yr. change in reported robberies per 100K: -12.4
> Robberies reported in 2020: 1,217 — 21st highest of 213 metros
> Robberies per 100K people in 2020: 54.6 — 83rd highest of 213 metros
> 1-yr. change in all violent crime per 100k people: -1.7 — 73rd lowest of 209 metros
> Violent crimes per 100K people in 2020: 235.7 — 50th lowest of 211 metros
> Population: 2,219,750
[in-text-ad]

44. Nashville-Davidson-Murfreesboro-Franklin, TN
> 1-yr. change in reported robberies per 100K: -12.6
> Robberies reported in 2020: 2,097 — 11th highest of 213 metros
> Robberies per 100K people in 2020: 106.5 — 17th highest of 213 metros
> 1-yr. change in all violent crime per 100k people: +45.8 — 52nd highest of 209 metros
> Violent crimes per 100K people in 2020: 616.3 — 25th highest of 211 metros
> Population: 1,933,860
[recirclink id=850453]

43. Jackson, TN
> 1-yr. change in reported robberies per 100K: -13.0
> Robberies reported in 2020: 106 — 102nd lowest of 213 metros (tied)
> Robberies per 100K people in 2020: 59.4 — 75th highest of 213 metros
> 1-yr. change in all violent crime per 100k people: +11.0 — 97th lowest of 209 metros
> Violent crimes per 100K people in 2020: 624.6 — 24th highest of 211 metros
> Population: 178,644

42. Niles, MI
> 1-yr. change in reported robberies per 100K: -13.5
> Robberies reported in 2020: 58 — 70th lowest of 213 metros (tied)
> Robberies per 100K people in 2020: 38.0 — 86th lowest of 213 metros
> 1-yr. change in all violent crime per 100k people: +113.4 — 11th highest of 209 metros
> Violent crimes per 100K people in 2020: 664.2 — 19th highest of 211 metros
> Population: 153,401
[in-text-ad-2]

41. Lakeland-Winter Haven, FL
> 1-yr. change in reported robberies per 100K: -13.5
> Robberies reported in 2020: 209 — 78th highest of 213 metros
> Robberies per 100K people in 2020: 28.3 — 57th lowest of 213 metros
> 1-yr. change in all violent crime per 100k people: +9.3 — 95th lowest of 209 metros
> Violent crimes per 100K people in 2020: 286.8 — 76th lowest of 211 metros
> Population: 724,777
40. Goldsboro, NC
> 1-yr. change in reported robberies per 100K: -13.8
> Robberies reported in 2020: 65 — 78th lowest of 213 metros
> Robberies per 100K people in 2020: 52.8 — 89th highest of 213 metros
> 1-yr. change in all violent crime per 100k people: +66.7 — 31st highest of 209 metros
> Violent crimes per 100K people in 2020: 481.4 — 50th highest of 211 metros
> Population: 123,131
[in-text-ad]

39. Richmond, VA
> 1-yr. change in reported robberies per 100K: -13.8
> Robberies reported in 2020: 605 — 33rd highest of 213 metros
> Robberies per 100K people in 2020: 46.4 — 104th highest of 213 metros
> 1-yr. change in all violent crime per 100k people: -12.0 — 45th lowest of 209 metros
> Violent crimes per 100K people in 2020: 215.7 — 39th lowest of 211 metros
> Population: 1,290,866
[recirclink id=990213]

38. Cleveland-Elyria, OH
> 1-yr. change in reported robberies per 100K: -14.1
> Robberies reported in 2020: 2,175 — 9th highest of 213 metros
> Robberies per 100K people in 2020: 106.5 — 18th highest of 213 metros
> 1-yr. change in all violent crime per 100k people: +37.4 — 62nd highest of 209 metros
> Violent crimes per 100K people in 2020: 440.6 — 65th highest of 211 metros
> Population: 2,048,449

37. Greenville, NC
> 1-yr. change in reported robberies per 100K: -14.1
> Robberies reported in 2020: 110 — 105th lowest of 213 metros
> Robberies per 100K people in 2020: 60.4 — 70th highest of 213 metros
> 1-yr. change in all violent crime per 100k people: +2.1 — 82nd lowest of 209 metros
> Violent crimes per 100K people in 2020: 364.6 — 100th highest of 211 metros
> Population: 180,742
[in-text-ad-2]

36. Akron, OH
> 1-yr. change in reported robberies per 100K: -14.3
> Robberies reported in 2020: 354 — 52nd highest of 213 metros
> Robberies per 100K people in 2020: 50.4 — 91st highest of 213 metros
> 1-yr. change in all violent crime per 100k people: +6.7 — 91st lowest of 209 metros
> Violent crimes per 100K people in 2020: 378.4 — 88th highest of 211 metros
> Population: 703,479

35. Sacramento-Roseville-Folsom, CA
> 1-yr. change in reported robberies per 100K: -14.5
> Robberies reported in 2020: 2,069 — 12th highest of 213 metros
> Robberies per 100K people in 2020: 87.5 — 32nd highest of 213 metros
> 1-yr. change in all violent crime per 100k people: +24.2 — 83rd highest of 209 metros
> Violent crimes per 100K people in 2020: 378.3 — 89th highest of 211 metros
> Population: 2,363,730
[in-text-ad]

34. Manhattan, KS
> 1-yr. change in reported robberies per 100K: -15.3
> Robberies reported in 2020: 21 — 20th lowest of 213 metros (tied)
> Robberies per 100K people in 2020: 16.1 — 26th lowest of 213 metros
> 1-yr. change in all violent crime per 100k people: -54.8 — 8th lowest of 209 metros
> Violent crimes per 100K people in 2020: 376.1 — 92nd highest of 211 metros
> Population: 130,285
[recirclink id=1000581]

33. Colorado Springs, CO
> 1-yr. change in reported robberies per 100K: -15.5
> Robberies reported in 2020: 441 — 42nd highest of 213 metros
> Robberies per 100K people in 2020: 58.6 — 78th highest of 213 metros
> 1-yr. change in all violent crime per 100k people: +20.9 — 90th highest of 209 metros
> Violent crimes per 100K people in 2020: 486.6 — 47th highest of 211 metros
> Population: 745,791

32. Orlando-Kissimmee-Sanford, FL
> 1-yr. change in reported robberies per 100K: -15.7
> Robberies reported in 2020: 1,919 — 13th highest of 213 metros
> Robberies per 100K people in 2020: 72.2 — 53rd highest of 213 metros
> 1-yr. change in all violent crime per 100k people: -3.2 — 67th lowest of 209 metros
> Violent crimes per 100K people in 2020: 426.7 — 73rd highest of 211 metros
> Population: 2,608,147
[in-text-ad-2]

31. Detroit-Warren-Dearborn, MI
> 1-yr. change in reported robberies per 100K: -15.8
> Robberies reported in 2020: 2,791 — 6th highest of 213 metros
> Robberies per 100K people in 2020: 64.8 — 63rd highest of 213 metros
> 1-yr. change in all violent crime per 100k people: +53.3 — 41st highest of 209 metros
> Violent crimes per 100K people in 2020: 570.2 — 33rd highest of 211 metros
> Population: 4,319,629

30. Vallejo, CA
> 1-yr. change in reported robberies per 100K: -16.1
> Robberies reported in 2020: 589 — 34th highest of 213 metros
> Robberies per 100K people in 2020: 131.8 — 7th highest of 213 metros
> 1-yr. change in all violent crime per 100k people: +52.8 — 43rd highest of 209 metros
> Violent crimes per 100K people in 2020: 525.7 — 38th highest of 211 metros
> Population: 447,643
[in-text-ad]

29. Panama City, FL
> 1-yr. change in reported robberies per 100K: -16.5
> Robberies reported in 2020: 68 — 82nd lowest of 213 metros
> Robberies per 100K people in 2020: 38.9 — 92nd lowest of 213 metros
> 1-yr. change in all violent crime per 100k people: +40.5 — 57th highest of 209 metros
> Violent crimes per 100K people in 2020: 484.4 — 49th highest of 211 metros
> Population: 174,705
[recirclink id=1001204]

28. Peoria, IL
> 1-yr. change in reported robberies per 100K: -18.3
> Robberies reported in 2020: 237 — 71st highest of 213 metros
> Robberies per 100K people in 2020: 59.7 — 74th highest of 213 metros
> 1-yr. change in all violent crime per 100k people: -26.3 — 25th lowest of 209 metros
> Violent crimes per 100K people in 2020: 425.7 — 74th highest of 211 metros
> Population: 400,912

27. Sebring-Avon Park, FL
> 1-yr. change in reported robberies per 100K: -18.4
> Robberies reported in 2020: 39 — 48th lowest of 213 metros
> Robberies per 100K people in 2020: 36.5 — 78th lowest of 213 metros
> 1-yr. change in all violent crime per 100k people: +11.9 — 99th lowest of 209 metros
> Violent crimes per 100K people in 2020: 277.2 — 72nd lowest of 211 metros
> Population: 106,221
[in-text-ad-2]

26. Florence, SC
> 1-yr. change in reported robberies per 100K: -19.5
> Robberies reported in 2020: 181 — 83rd highest of 213 metros
> Robberies per 100K people in 2020: 88.3 — 31st highest of 213 metros
> 1-yr. change in all violent crime per 100k people: +36.8 — 63rd highest of 209 metros
> Violent crimes per 100K people in 2020: 860.2 — 8th highest of 211 metros
> Population: 204,911

25. Elmira, NY
> 1-yr. change in reported robberies per 100K: -20.1
> Robberies reported in 2020: 28 — 30th lowest of 213 metros (tied)
> Robberies per 100K people in 2020: 34.0 — 69th lowest of 213 metros
> 1-yr. change in all violent crime per 100k people: -3.8 — 66th lowest of 209 metros
> Violent crimes per 100K people in 2020: 210.1 — 37th lowest of 211 metros
> Population: 83,456
[in-text-ad]

24. Riverside-San Bernardino-Ontario, CA
> 1-yr. change in reported robberies per 100K: -21.3
> Robberies reported in 2020: 4,281 — 5th highest of 213 metros
> Robberies per 100K people in 2020: 92.0 — 25th highest of 213 metros
> 1-yr. change in all violent crime per 100k people: +5.3 — 88th lowest of 209 metros
> Violent crimes per 100K people in 2020: 431.1 — 69th highest of 211 metros
> Population: 4,650,631
[recirclink id=1055273]
23. Ocala, FL
> 1-yr. change in reported robberies per 100K: -21.5
> Robberies reported in 2020: 136 — 96th highest of 213 metros
> Robberies per 100K people in 2020: 36.9 — 79th lowest of 213 metros
> 1-yr. change in all violent crime per 100k people: -8.4 — 51st lowest of 209 metros
> Violent crimes per 100K people in 2020: 422.5 — 76th highest of 211 metros
> Population: 365,579

22. Bloomington, IL
> 1-yr. change in reported robberies per 100K: -21.8
> Robberies reported in 2020: 45 — 53rd lowest of 213 metros
> Robberies per 100K people in 2020: 26.3 — 50th lowest of 213 metros
> 1-yr. change in all violent crime per 100k people: -71.0 — 5th lowest of 209 metros
> Violent crimes per 100K people in 2020: 282.8 — 73rd lowest of 211 metros
> Population: 171,517
[in-text-ad-2]

21. Dover, DE
> 1-yr. change in reported robberies per 100K: -22.3
> Robberies reported in 2020: 58 — 70th lowest of 213 metros (tied)
> Robberies per 100K people in 2020: 31.6 — 62nd lowest of 213 metros
> 1-yr. change in all violent crime per 100k people: +15.3 — 100th highest of 209 metros
> Violent crimes per 100K people in 2020: 442.6 — 64th highest of 211 metros
> Population: 180,786

20. Albuquerque, NM
> 1-yr. change in reported robberies per 100K: -22.4
> Robberies reported in 2020: 1,585 — 16th highest of 213 metros
> Robberies per 100K people in 2020: 171.6 — 3rd highest of 213 metros
> 1-yr. change in all violent crime per 100k people: -37.1 — 16th lowest of 209 metros
> Violent crimes per 100K people in 2020: 1,006.4 — 5th highest of 211 metros
> Population: 914,480
[in-text-ad]

19. Kalamazoo-Portage, MI
> 1-yr. change in reported robberies per 100K: -22.5
> Robberies reported in 2020: 199 — 79th highest of 213 metros
> Robberies per 100K people in 2020: 74.9 — 50th highest of 213 metros
> 1-yr. change in all violent crime per 100k people: +90.7 — 20th highest of 209 metros
> Violent crimes per 100K people in 2020: 663.3 — 21st highest of 211 metros
> Population: 265,066
[recirclink id=850453]

18. Anchorage, AK
> 1-yr. change in reported robberies per 100K: -23.0
> Robberies reported in 2020: 566 — 37th highest of 213 metros
> Robberies per 100K people in 2020: 185.4 — the highest of 213 metros
> 1-yr. change in all violent crime per 100k people: -23.1 — 32nd lowest of 209 metros
> Violent crimes per 100K people in 2020: 1,171.5 — 2nd highest of 211 metros
> Population: 396,317

17. Las Vegas-Henderson-Paradise, NV
> 1-yr. change in reported robberies per 100K: -23.3
> Robberies reported in 2020: 2,322 — 8th highest of 213 metros
> Robberies per 100K people in 2020: 100.3 — 21st highest of 213 metros
> 1-yr. change in all violent crime per 100k people: -47.0 — 10th lowest of 209 metros
> Violent crimes per 100K people in 2020: 478.7 — 51st highest of 211 metros
> Population: 2,266,715
[in-text-ad-2]

16. Los Angeles-Long Beach-Anaheim, CA
> 1-yr. change in reported robberies per 100K: -24.8
> Robberies reported in 2020: 17,385 — the highest of 213 metros
> Robberies per 100K people in 2020: 132.5 — 6th highest of 213 metros
> 1-yr. change in all violent crime per 100k people: -4.8 — 64th lowest of 209 metros
> Violent crimes per 100K people in 2020: 472.6 — 55th highest of 211 metros
> Population: 13,214,799

15. Modesto, CA
> 1-yr. change in reported robberies per 100K: -24.8
> Robberies reported in 2020: 587 — 35th highest of 213 metros
> Robberies per 100K people in 2020: 106.9 — 16th highest of 213 metros
> 1-yr. change in all violent crime per 100k people: -15.1 — 41st lowest of 209 metros
> Violent crimes per 100K people in 2020: 514.0 — 40th highest of 211 metros
> Population: 550,660
[in-text-ad]
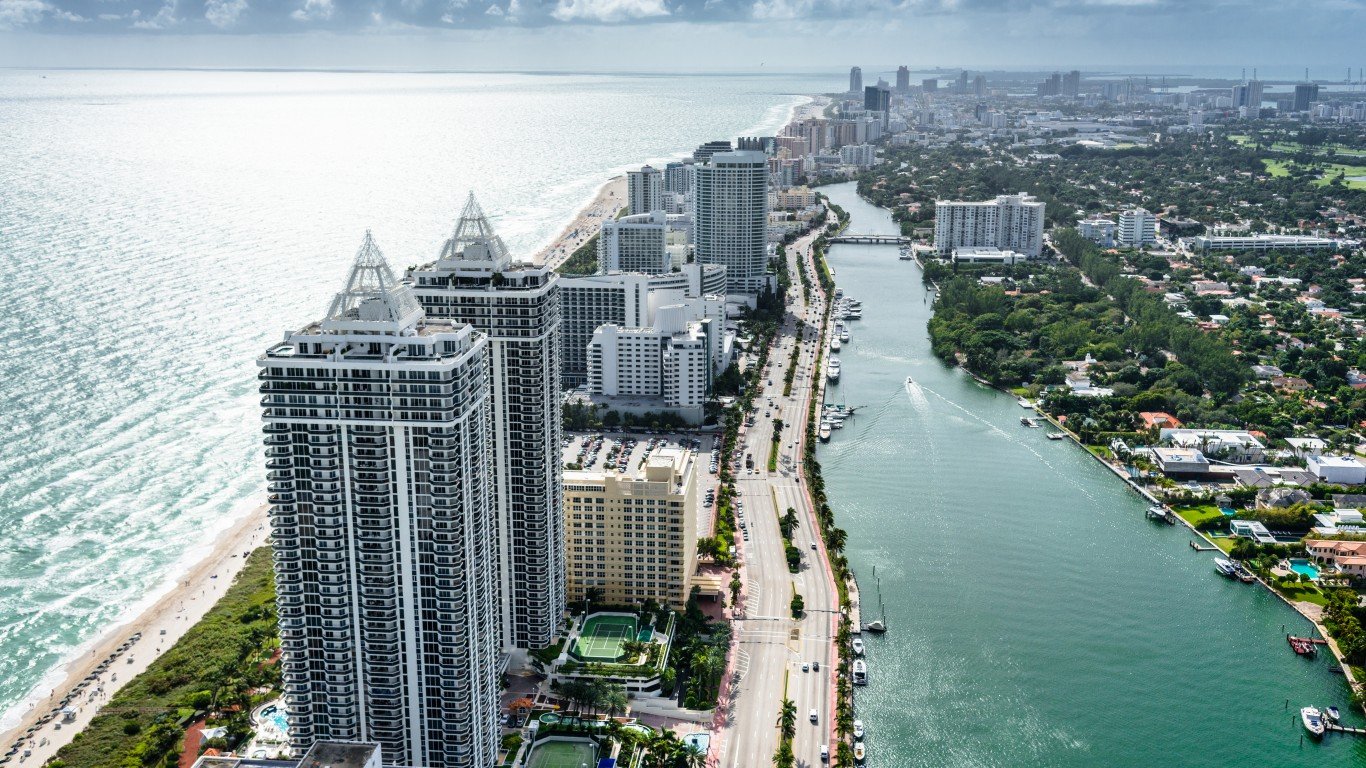
14. Miami-Fort Lauderdale-Pompano Beach, FL
> 1-yr. change in reported robberies per 100K: -25.0
> Robberies reported in 2020: 5,529 — 3rd highest of 213 metros
> Robberies per 100K people in 2020: 88.9 — 29th highest of 213 metros
> 1-yr. change in all violent crime per 100k people: -5.1 — 63rd lowest of 209 metros
> Violent crimes per 100K people in 2020: 417.0 — 78th highest of 211 metros
> Population: 6,166,488
[recirclink id=990213]

13. Jacksonville, FL
> 1-yr. change in reported robberies per 100K: -25.4
> Robberies reported in 2020: 1,085 — 23rd highest of 213 metros
> Robberies per 100K people in 2020: 68.6 — 56th highest of 213 metros
> 1-yr. change in all violent crime per 100k people: +25.1 — 82nd highest of 209 metros
> Violent crimes per 100K people in 2020: 499.8 — 44th highest of 211 metros
> Population: 1,559,514

12. Toledo, OH
> 1-yr. change in reported robberies per 100K: -25.5
> Robberies reported in 2020: 552 — 38th highest of 213 metros
> Robberies per 100K people in 2020: 86.3 — 34th highest of 213 metros
> 1-yr. change in all violent crime per 100k people: +14.0 — 102nd highest of 209 metros
> Violent crimes per 100K people in 2020: 485.6 — 48th highest of 211 metros
> Population: 641,816
[in-text-ad-2]

11. Muskegon, MI
> 1-yr. change in reported robberies per 100K: -25.9
> Robberies reported in 2020: 58 — 70th lowest of 213 metros (tied)
> Robberies per 100K people in 2020: 33.5 — 66th lowest of 213 metros
> 1-yr. change in all violent crime per 100k people: -41.1 — 15th lowest of 209 metros
> Violent crimes per 100K people in 2020: 412.3 — 81st highest of 211 metros
> Population: 173,566

10. Fairbanks, AK
> 1-yr. change in reported robberies per 100K: -27.2
> Robberies reported in 2020: 42 — 49th lowest of 213 metros (tied)
> Robberies per 100K people in 2020: 127.6 — 8th highest of 213 metros
> 1-yr. change in all violent crime per 100k people: +46.8 — 49th highest of 209 metros
> Violent crimes per 100K people in 2020: 841.4 — 9th highest of 211 metros
> Population: 96,849
[in-text-ad]

9. Battle Creek, MI
> 1-yr. change in reported robberies per 100K: -32.0
> Robberies reported in 2020: 48 — 56th lowest of 213 metros (tied)
> Robberies per 100K people in 2020: 36.0 — 75th lowest of 213 metros
> 1-yr. change in all violent crime per 100k people: +39.6 — 58th highest of 209 metros
> Violent crimes per 100K people in 2020: 663.6 — 20th highest of 211 metros
> Population: 134,159
[recirclink id=1000581]

8. Fort Wayne, IN
> 1-yr. change in reported robberies per 100K: -32.9
> Robberies reported in 2020: 269 — 65th highest of 213 metros (tied)
> Robberies per 100K people in 2020: 64.7 — 64th highest of 213 metros
> 1-yr. change in all violent crime per 100k people: +29.9 — 70th highest of 209 metros
> Violent crimes per 100K people in 2020: 334.9 — 94th lowest of 211 metros
> Population: 413,263

7. Atlantic City-Hammonton, NJ
> 1-yr. change in reported robberies per 100K: -33.6
> Robberies reported in 2020: 183 — 82nd highest of 213 metros
> Robberies per 100K people in 2020: 69.8 — 55th highest of 213 metros
> 1-yr. change in all violent crime per 100k people: -1.8 — 71st lowest of 209 metros
> Violent crimes per 100K people in 2020: 253.6 — 60th lowest of 211 metros
> Population: 263,670
[in-text-ad-2]
6. Kankakee, IL
> 1-yr. change in reported robberies per 100K: -34.7
> Robberies reported in 2020: 52 — 62nd lowest of 213 metros (tied)
> Robberies per 100K people in 2020: 47.8 — 98th highest of 213 metros
> 1-yr. change in all violent crime per 100k people: -33.2 — 20th lowest of 209 metros
> Violent crimes per 100K people in 2020: 355.4 — 105th lowest of 211 metros
> Population: 109,862

5. Hilton Head Island-Bluffton, SC
> 1-yr. change in reported robberies per 100K: -34.9
> Robberies reported in 2020: 67 — 80th lowest of 213 metros (tied)
> Robberies per 100K people in 2020: 29.6 — 59th lowest of 213 metros
> 1-yr. change in all violent crime per 100k people: -70.6 — 6th lowest of 209 metros
> Violent crimes per 100K people in 2020: 326.9 — 91st lowest of 211 metros
> Population: 222,195
[in-text-ad]
4. Pine Bluff, AR
> 1-yr. change in reported robberies per 100K: -35.0
> Robberies reported in 2020: 70 — 83rd lowest of 213 metros
> Robberies per 100K people in 2020: 80.9 — 39th highest of 213 metros
> 1-yr. change in all violent crime per 100k people: +202.4 — 2nd highest of 209 metros
> Violent crimes per 100K people in 2020: 1,097.8 — 3rd highest of 211 metros
> Population: 89,437
[recirclink id=1001204]

3. Stockton, CA
> 1-yr. change in reported robberies per 100K: -38.8
> Robberies reported in 2020: 1,281 — 20th highest of 213 metros
> Robberies per 100K people in 2020: 167.8 — 4th highest of 213 metros
> 1-yr. change in all violent crime per 100k people: -65.7 — 7th lowest of 209 metros
> Violent crimes per 100K people in 2020: 722.8 — 14th highest of 211 metros
> Population: 762,148

2. San Francisco-Oakland-Berkeley, CA
> 1-yr. change in reported robberies per 100K: -38.9
> Robberies reported in 2020: 8,440 — 2nd highest of 213 metros
> Robberies per 100K people in 2020: 178.5 — 2nd highest of 213 metros
> 1-yr. change in all violent crime per 100k people: -30.7 — 22nd lowest of 209 metros
> Violent crimes per 100K people in 2020: 440.1 — 67th highest of 211 metros
> Population: 4,731,803
[in-text-ad-2]

1. Vineland-Bridgeton, NJ
> 1-yr. change in reported robberies per 100K: -53.5
> Robberies reported in 2020: 154 — 90th highest of 213 metros
> Robberies per 100K people in 2020: 103.6 — 20th highest of 213 metros
> 1-yr. change in all violent crime per 100k people: +28.4 — 74th highest of 209 metros
> Violent crimes per 100K people in 2020: 450.2 — 60th highest of 211 metros
> Population: 149,527
Methodology
To determine the metro areas where the robbery rate is falling fastest, 24/7 Wall St. reviewed the change in robberies per 100,000 people from the FBI’s 2019 and 2020 Uniform Crime Reports.
Limited data was available in the 2020 UCR for areas in Alabama, Maryland, Pennsylvania, and Illinois, though metro areas in these states were not excluded from analysis. Only metro areas for which the boundaries defined by the FBI match the boundaries as defined by the U.S. Census Bureau were considered. Because some state and local agencies changed reporting practices between 2019 and 2020, the figures are not comparable, and the areas were excluded.
Population figures are one-year estimates from the U.S. Census Bureau’s 2019 American Community Survey. However, these estimates were not used to calculate crime rates. Crime rates per 100,000 people were calculated using population figures provided by the FBI in the 2020 and 2019 UCR.
Contact [email protected] for any questions or corrections.