The U.S. property crime rate fell for the 19th consecutive year in 2020 – a bright spot in an otherwise bleak year defined largely by the COVID-19 pandemic and a historic surge in deadly violence.
Property crime is made up of three categories of offenses: larceny, defined as the unlawful taking of property; burglary, defined as the illegal entry of a structure to commit a crime; and vehicle theft, defined as the theft, or the attempted theft, of a vehicle, such a car or ATV. Here is a look at the city in every state where your car is most likely to be stolen.
There were a total 6.5 million property crimes reported in the U.S. in 2020, or 1,958 for every 100,000 people, a decrease of 172 incidents per 100,000 people from the previous year. The decline nationwide is being driven by especially steep drops in some major metropolitan areas.
Using data from the FBI’s 2020 Uniform Crime Report, 24/7 Wall St. identified the 50 metro areas where property crime is falling fastest. Metro areas are ranked by the year-over-year change in property crimes reported for every 100,000 residents.
Despite the decline in much of the country, property crimes remain the most common of the most serious crimes tracked by the FBI, known as Part I offenses. Each year, property crimes result in the loss of billions of dollars worth of property – much of which is never recovered.
The largest share of metro areas that reported the strongest improvement in property crime rates in 2020 are in the South, including nine in Florida alone. It is important to note that while each of the metro areas on this list reported a decline in property crime, most of them still have a higher overall property crime rate than the national average. Here is a look at the city with the highest rate of property crime in each state.
Click here to see metros where property crime is falling
Click here to read our detailed methodology
50. Fort Smith, AR-OK
> Change in reported property crime rate, 2019-2020: -299.8
> Property crimes reported in 2020: 7,224 — 69th highest of 188 metros
> Property crimes reported in 2019: 7,944 — 68th highest of 188 metros
> Property crimes per 100K people in 2020: 2,882.6 — 19th highest of 188 metros
> Property crimes per 100K people in 2019: 3,182.4 — 14th highest of 188 metros
> Population: 249,152
[in-text-ad]
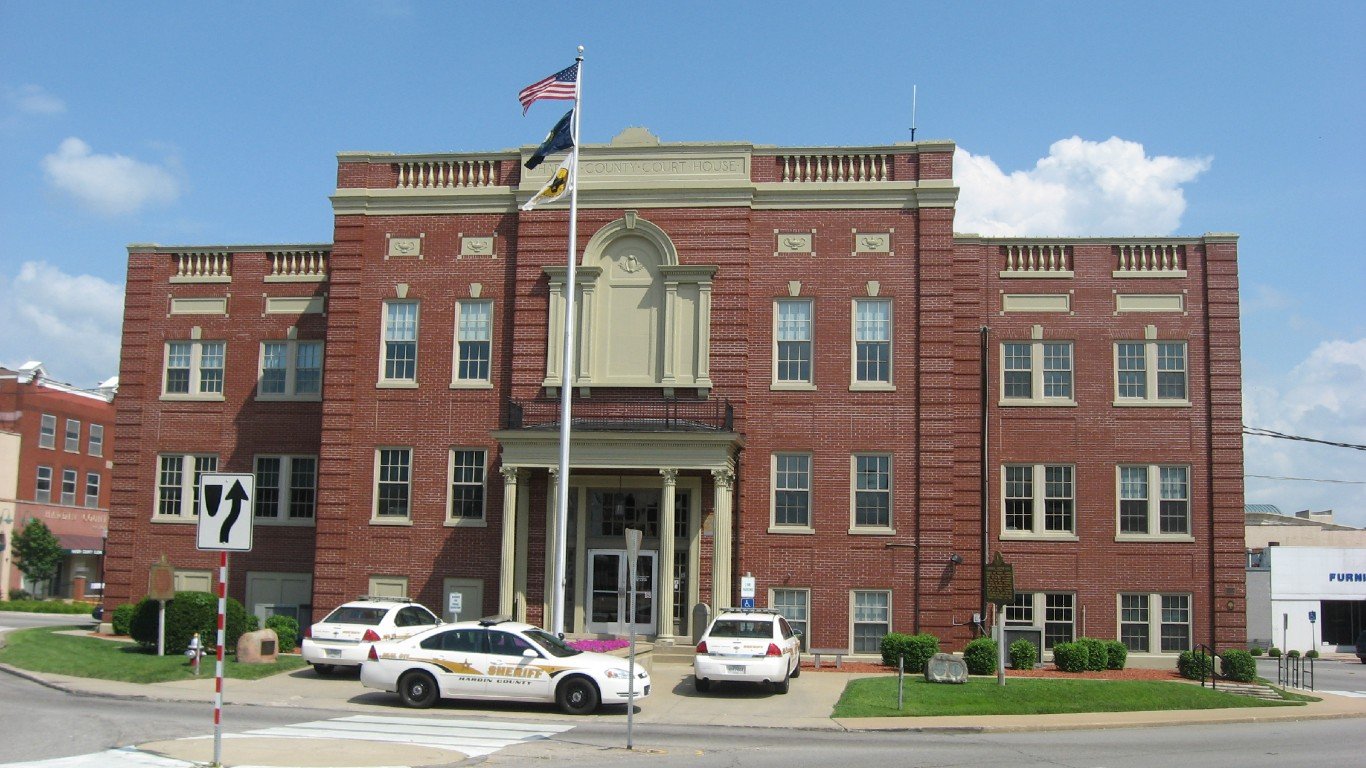
49. Elizabethtown-Fort Knox, KY
> Change in reported property crime rate, 2019-2020: -300.2
> Property crimes reported in 2020: 1,286 — 6th lowest of 188 metros
> Property crimes reported in 2019: 1,738 — 18th lowest of 188 metros
> Property crimes per 100K people in 2020: 833.8 — 4th lowest of 188 metros
> Property crimes per 100K people in 2019: 1,134.1 — 13th lowest of 188 metros
> Population: 154,713
[recirclink id=1015043]

48. Chico, CA
> Change in reported property crime rate, 2019-2020: -311.4
> Property crimes reported in 2020: 4,328 — 86th lowest of 188 metros
> Property crimes reported in 2019: 5,322 — 93rd lowest of 188 metros
> Property crimes per 100K people in 2020: 1,995.0 — 91st highest of 188 metros
> Property crimes per 100K people in 2019: 2,306.4 — 78th highest of 188 metros
> Population: 219,186
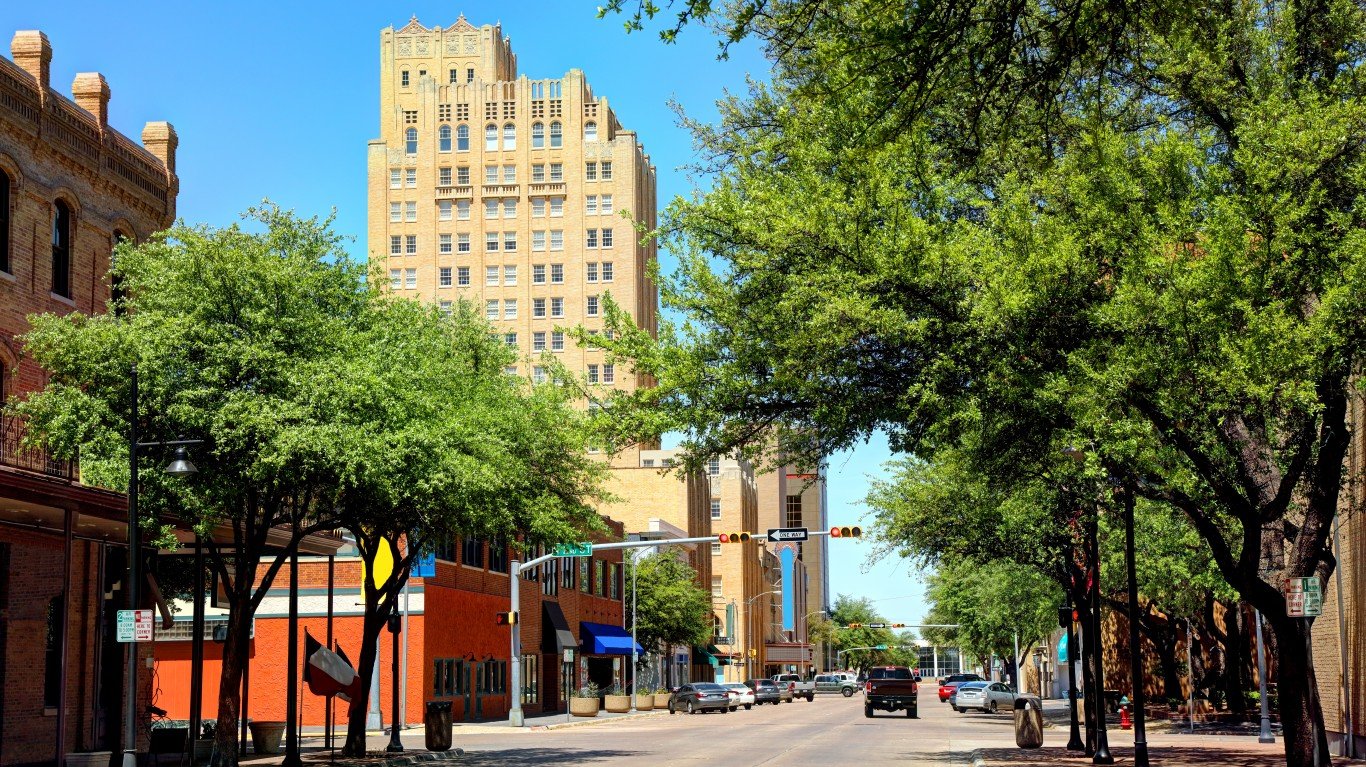
47. Abilene, TX
> Change in reported property crime rate, 2019-2020: -312.3
> Property crimes reported in 2020: 3,088 — 58th lowest of 188 metros
> Property crimes reported in 2019: 3,603 — 66th lowest of 188 metros
> Property crimes per 100K people in 2020: 1,793.1 — 76th lowest of 188 metros
> Property crimes per 100K people in 2019: 2,105.5 — 90th lowest of 188 metros
> Population: 171,795
[in-text-ad-2]

46. Crestview-Fort Walton Beach-Destin, FL
> Change in reported property crime rate, 2019-2020: -316.0
> Property crimes reported in 2020: 3,927 — 80th lowest of 188 metros
> Property crimes reported in 2019: 4,718 — 86th lowest of 188 metros
> Property crimes per 100K people in 2020: 1,354.0 — 38th lowest of 188 metros
> Property crimes per 100K people in 2019: 1,669.9 — 53rd lowest of 188 metros
> Population: 284,809

45. Cincinnati, OH-KY-IN
> Change in reported property crime rate, 2019-2020: -318.2
> Property crimes reported in 2020: 36,953 — 16th highest of 188 metros
> Property crimes reported in 2019: 43,841 — 16th highest of 188 metros
> Property crimes per 100K people in 2020: 1,658.8 — 62nd lowest of 188 metros
> Property crimes per 100K people in 2019: 1,976.9 — 77th lowest of 188 metros
> Population: 2,219,750
[in-text-ad]

44. Tampa-St. Petersburg-Clearwater, FL
> Change in reported property crime rate, 2019-2020: -321.7
> Property crimes reported in 2020: 44,114 — 15th highest of 188 metros
> Property crimes reported in 2019: 53,394 — 11th highest of 188 metros
> Property crimes per 100K people in 2020: 1,363.9 — 41st lowest of 188 metros
> Property crimes per 100K people in 2019: 1,685.6 — 58th lowest of 188 metros
> Population: 3,194,831
[recirclink id=1030620]

43. Richmond, VA
> Change in reported property crime rate, 2019-2020: -326.6
> Property crimes reported in 2020: 23,905 — 21st highest of 188 metros
> Property crimes reported in 2019: 27,824 — 21st highest of 188 metros
> Property crimes per 100K people in 2020: 1,834.5 — 81st lowest of 188 metros
> Property crimes per 100K people in 2019: 2,161.2 — 94th highest of 188 metros
> Population: 1,290,866

42. St. Joseph, MO-KS
> Change in reported property crime rate, 2019-2020: -331.2
> Property crimes reported in 2020: 4,424 — 88th lowest of 188 metros
> Property crimes reported in 2019: 4,889 — 88th lowest of 188 metros
> Property crimes per 100K people in 2020: 3,541.3 — 7th highest of 188 metros
> Property crimes per 100K people in 2019: 3,872.5 — 7th highest of 188 metros
> Population: 125,411
[in-text-ad-2]

41. Jackson, MI
> Change in reported property crime rate, 2019-2020: -331.3
> Property crimes reported in 2020: 2,641 — 46th lowest of 188 metros
> Property crimes reported in 2019: 3,173 — 54th lowest of 188 metros
> Property crimes per 100K people in 2020: 1,673.7 — 64th lowest of 188 metros
> Property crimes per 100K people in 2019: 2,004.9 — 81st lowest of 188 metros
> Population: 158,510

40. Walla Walla, WA
> Change in reported property crime rate, 2019-2020: -341.1
> Property crimes reported in 2020: 1,267 — 5th lowest of 188 metros
> Property crimes reported in 2019: 1,479 — 9th lowest of 188 metros
> Property crimes per 100K people in 2020: 2,085.0 — 79th highest of 188 metros
> Property crimes per 100K people in 2019: 2,426.1 — 63rd highest of 188 metros
> Population: 60,760
[in-text-ad]
39. Lewiston, ID-WA
> Change in reported property crime rate, 2019-2020: -346.2
> Property crimes reported in 2020: 1,307 — 7th lowest of 188 metros
> Property crimes reported in 2019: 1,525 — 12th lowest of 188 metros
> Property crimes per 100K people in 2020: 2,060.3 — 81st highest of 188 metros
> Property crimes per 100K people in 2019: 2,406.5 — 66th highest of 188 metros
> Population: 62,990
[recirclink id=1033410]

38. Detroit-Warren-Dearborn, MI
> Change in reported property crime rate, 2019-2020: -349.1
> Property crimes reported in 2020: 57,445 — 6th highest of 188 metros
> Property crimes reported in 2019: 72,684 — 5th highest of 188 metros
> Property crimes per 100K people in 2020: 1,333.3 — 36th lowest of 188 metros
> Property crimes per 100K people in 2019: 1,682.4 — 57th lowest of 188 metros
> Population: 4,319,629

37. Madera, CA
> Change in reported property crime rate, 2019-2020: -350.6
> Property crimes reported in 2020: 2,132 — 33rd lowest of 188 metros
> Property crimes reported in 2019: 2,693 — 43rd lowest of 188 metros
> Property crimes per 100K people in 2020: 1,362.6 — 40th lowest of 188 metros
> Property crimes per 100K people in 2019: 1,713.2 — 60th lowest of 188 metros
> Population: 157,327
[in-text-ad-2]

36. Jacksonville, FL
> Change in reported property crime rate, 2019-2020: -352.3
> Property crimes reported in 2020: 34,037 — 18th highest of 188 metros
> Property crimes reported in 2019: 38,810 — 17th highest of 188 metros
> Property crimes per 100K people in 2020: 2,153.1 — 67th highest of 188 metros
> Property crimes per 100K people in 2019: 2,505.4 — 53rd highest of 188 metros
> Population: 1,559,514
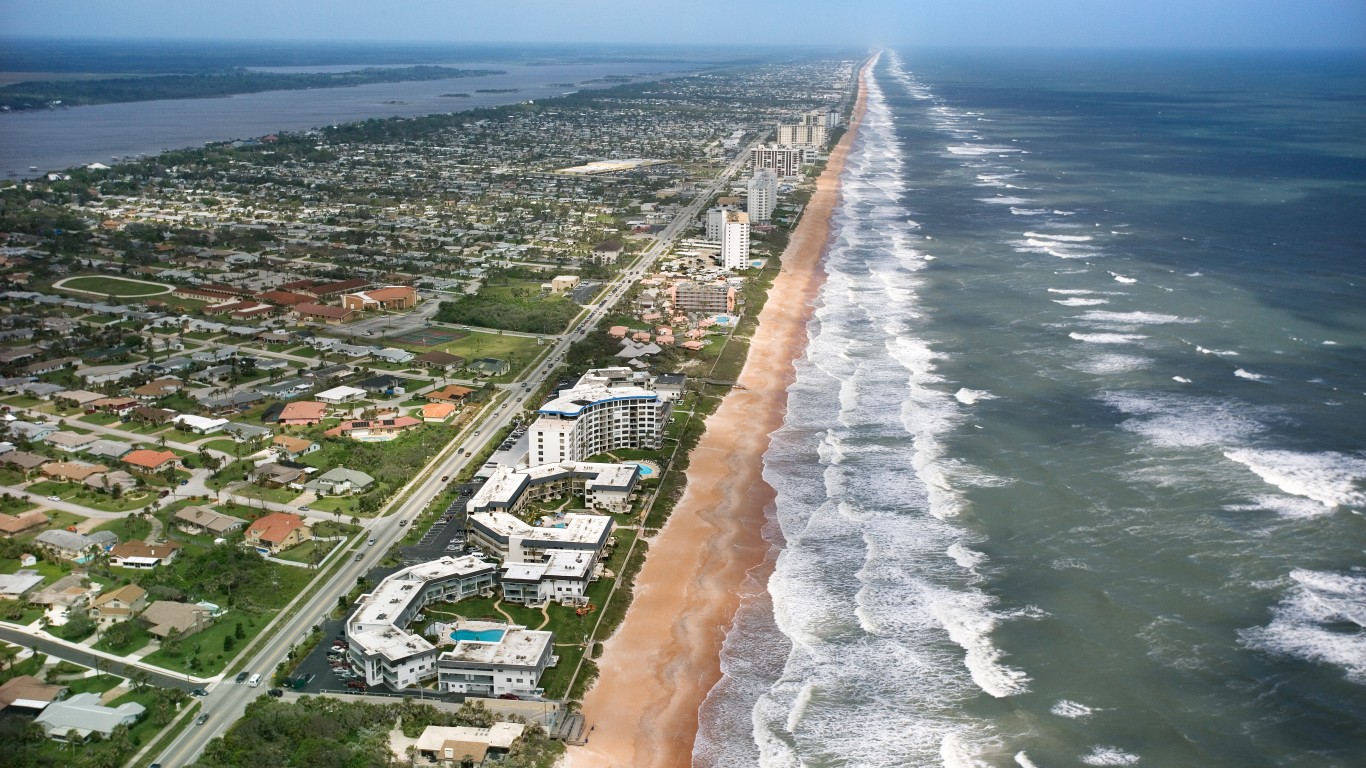
35. Deltona-Daytona Beach-Ormond Beach, FL
> Change in reported property crime rate, 2019-2020: -352.7
> Property crimes reported in 2020: 9,815 — 52nd highest of 188 metros
> Property crimes reported in 2019: 11,988 — 48th highest of 188 metros
> Property crimes per 100K people in 2020: 1,452.7 — 44th lowest of 188 metros
> Property crimes per 100K people in 2019: 1,805.3 — 67th lowest of 188 metros
> Population: 668,365
[in-text-ad]

34. Merced, CA
> Change in reported property crime rate, 2019-2020: -364.4
> Property crimes reported in 2020: 5,951 — 84th highest of 188 metros
> Property crimes reported in 2019: 6,898 — 76th highest of 188 metros
> Property crimes per 100K people in 2020: 2,146.0 — 71st highest of 188 metros
> Property crimes per 100K people in 2019: 2,510.5 — 52nd highest of 188 metros
> Population: 277,680
[recirclink id=1039645]

33. Fort Wayne, IN
> Change in reported property crime rate, 2019-2020: -365.5
> Property crimes reported in 2020: 7,266 — 68th highest of 188 metros
> Property crimes reported in 2019: 8,726 — 61st highest of 188 metros
> Property crimes per 100K people in 2020: 1,748.2 — 70th lowest of 188 metros
> Property crimes per 100K people in 2019: 2,113.7 — 91st lowest of 188 metros
> Population: 413,263
32. Omaha-Council Bluffs, NE-IA
> Change in reported property crime rate, 2019-2020: -365.7
> Property crimes reported in 2020: 21,780 — 22nd highest of 188 metros
> Property crimes reported in 2019: 25,089 — 22nd highest of 188 metros
> Property crimes per 100K people in 2020: 2,280.9 — 53rd highest of 188 metros
> Property crimes per 100K people in 2019: 2,646.6 — 41st highest of 188 metros
> Population: 949,726
[in-text-ad-2]

31. Spokane-Spokane Valley, WA
> Change in reported property crime rate, 2019-2020: -367.6
> Property crimes reported in 2020: 19,927 — 28th highest of 188 metros
> Property crimes reported in 2019: 21,682 — 24th highest of 188 metros
> Property crimes per 100K people in 2020: 3,478.6 — 8th highest of 188 metros
> Property crimes per 100K people in 2019: 3,846.2 — 8th highest of 188 metros
> Population: 568,521

30. Dover, DE
> Change in reported property crime rate, 2019-2020: -377.4
> Property crimes reported in 2020: 3,404 — 69th lowest of 188 metros
> Property crimes reported in 2019: 4,019 — 75th lowest of 188 metros
> Property crimes per 100K people in 2020: 1,853.3 — 83rd lowest of 188 metros
> Property crimes per 100K people in 2019: 2,230.7 — 83rd highest of 188 metros
> Population: 180,786
[in-text-ad]

29. Ann Arbor, MI
> Change in reported property crime rate, 2019-2020: -383.8
> Property crimes reported in 2020: 4,670 — 93rd lowest of 188 metros
> Property crimes reported in 2019: 6,159 — 84th highest of 188 metros
> Property crimes per 100K people in 2020: 1,266.0 — 28th lowest of 188 metros
> Property crimes per 100K people in 2019: 1,649.8 — 48th lowest of 188 metros
> Population: 367,601
[recirclink id=1055273]

28. Lafayette, LA
> Change in reported property crime rate, 2019-2020: -395.5
> Property crimes reported in 2020: 12,188 — 42nd highest of 188 metros
> Property crimes reported in 2019: 14,108 — 38th highest of 188 metros
> Property crimes per 100K people in 2020: 2,487.4 — 39th highest of 188 metros
> Property crimes per 100K people in 2019: 2,882.9 — 23rd highest of 188 metros
> Population: 489,207
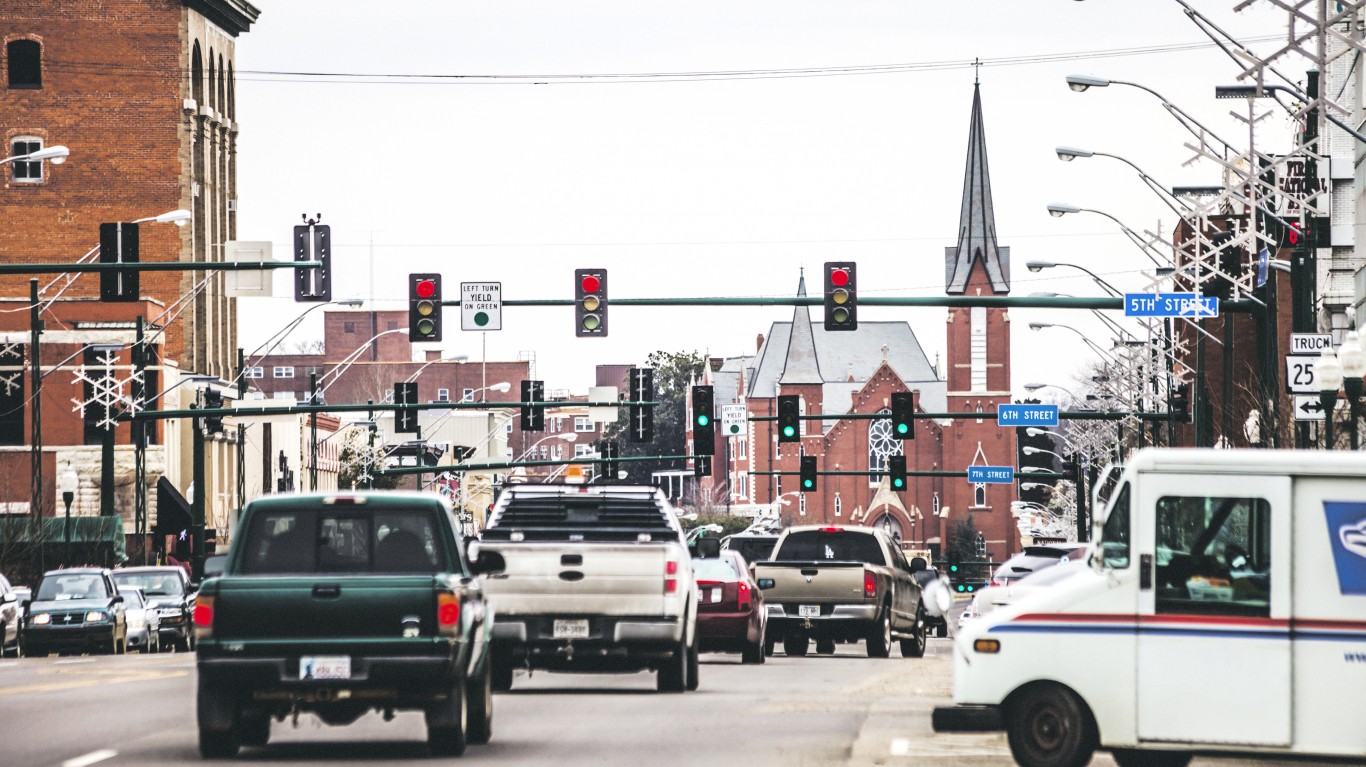
27. Enid, OK
> Change in reported property crime rate, 2019-2020: -401.9
> Property crimes reported in 2020: 1,576 — 18th lowest of 188 metros
> Property crimes reported in 2019: 1,812 — 21st lowest of 188 metros
> Property crimes per 100K people in 2020: 2,579.7 — 32nd highest of 188 metros
> Property crimes per 100K people in 2019: 2,981.6 — 19th highest of 188 metros
> Population: 61,056
[in-text-ad-2]

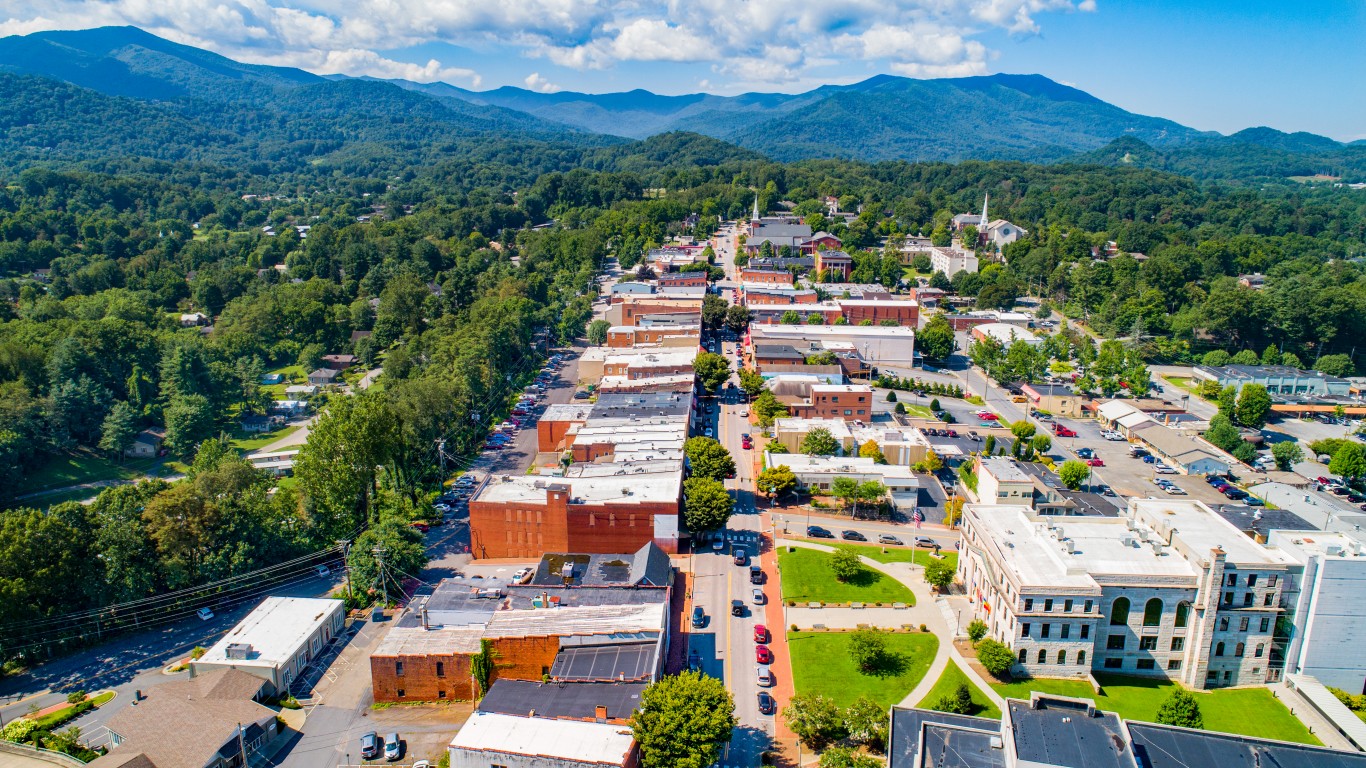
26. Greenville, NC
> Change in reported property crime rate, 2019-2020: -406.0
> Property crimes reported in 2020: 3,665 — 74th lowest of 188 metros
> Property crimes reported in 2019: 4,383 — 82nd lowest of 188 metros
> Property crimes per 100K people in 2020: 2,012.3 — 88th highest of 188 metros
> Property crimes per 100K people in 2019: 2,418.3 — 64th highest of 188 metros
> Population: 180,742
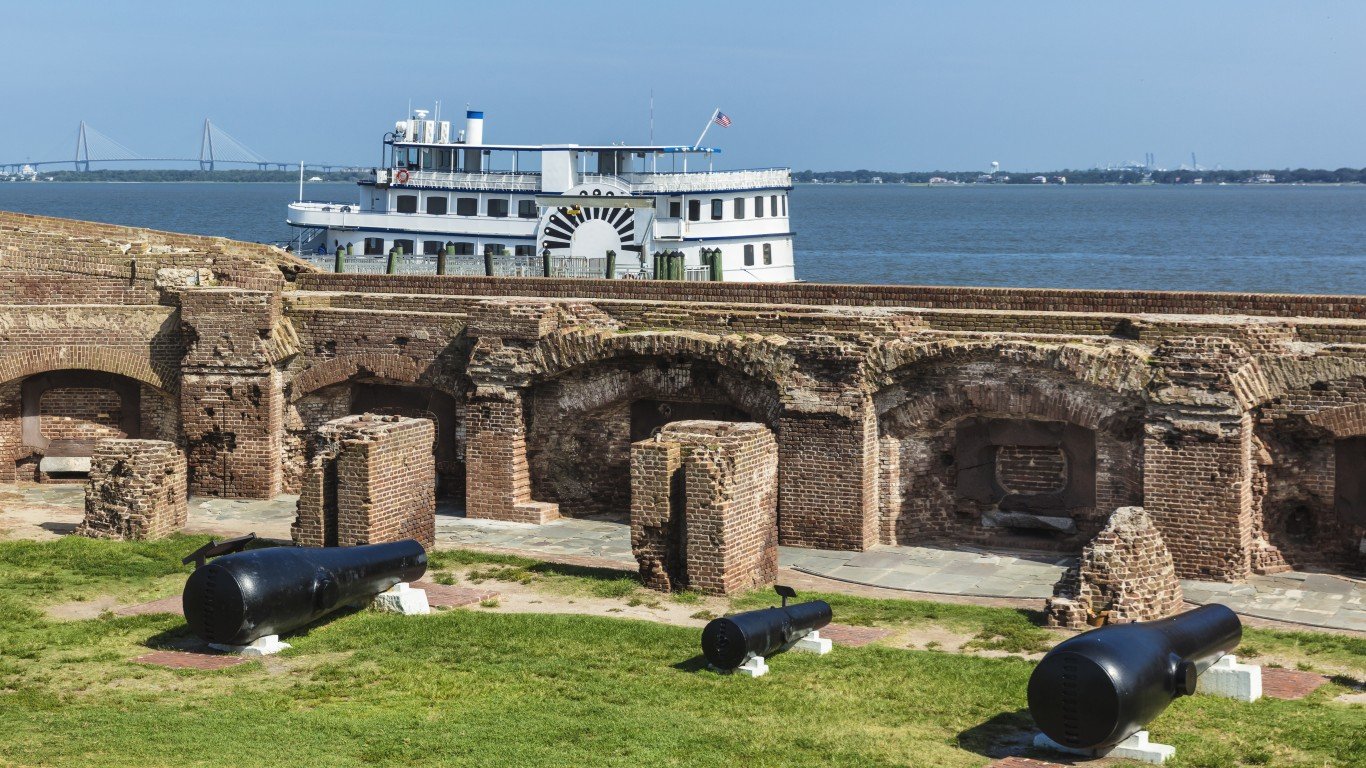
25. Sumter, SC
> Change in reported property crime rate, 2019-2020: -407.1
> Property crimes reported in 2020: 3,852 — 78th lowest of 188 metros
> Property crimes reported in 2019: 4,411 — 83rd lowest of 188 metros
> Property crimes per 100K people in 2020: 2,743.6 — 24th highest of 188 metros
> Property crimes per 100K people in 2019: 3,150.7 — 15th highest of 188 metros
> Population: 140,466
[in-text-ad]
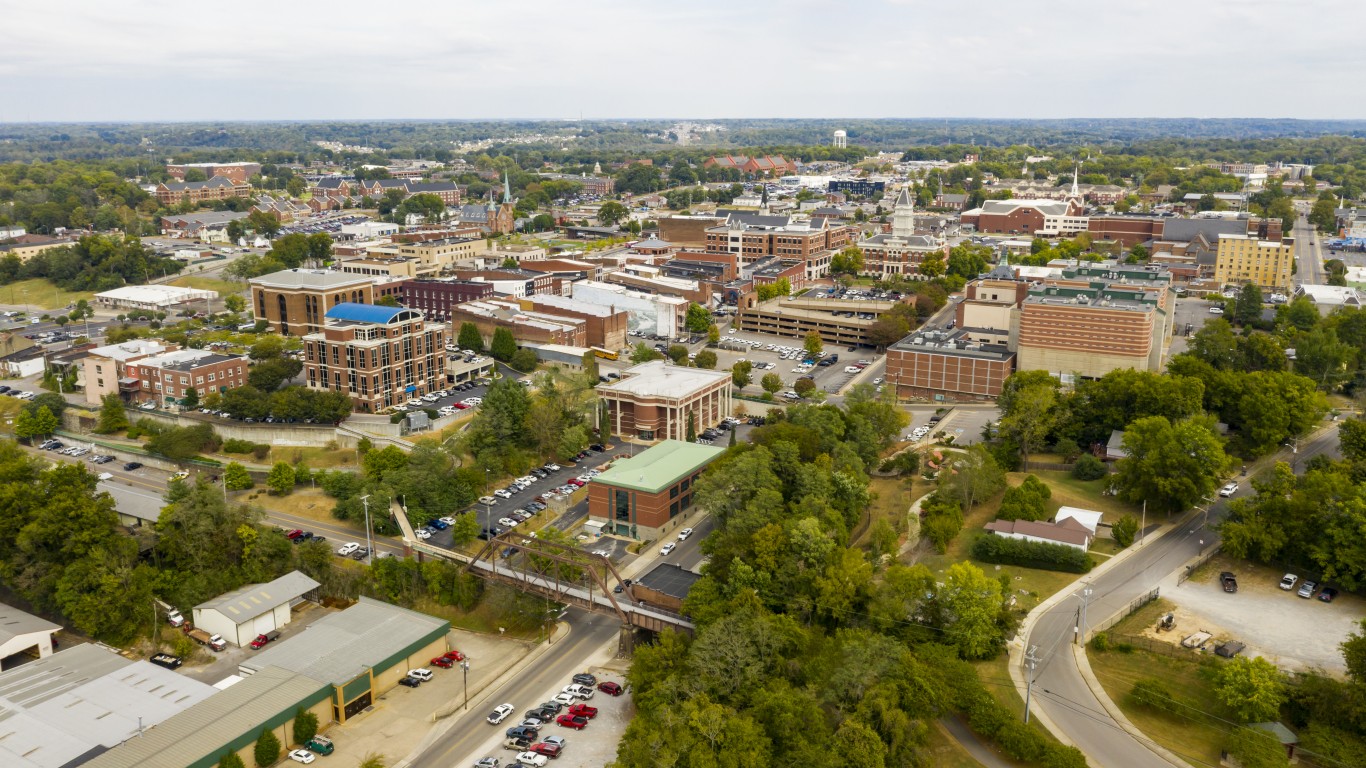
24. Clarksville, TN-KY
> Change in reported property crime rate, 2019-2020: -407.9
> Property crimes reported in 2020: 5,777 — 86th highest of 188 metros
> Property crimes reported in 2019: 7,005 — 72nd highest of 188 metros (tied)
> Property crimes per 100K people in 2020: 1,852.5 — 82nd lowest of 188 metros
> Property crimes per 100K people in 2019: 2,260.4 — 82nd highest of 188 metros
> Population: 311,073
[recirclink id=1015043]

23. Panama City, FL
> Change in reported property crime rate, 2019-2020: -421.7
> Property crimes reported in 2020: 4,626 — 91st lowest of 188 metros
> Property crimes reported in 2019: 5,707 — 89th highest of 188 metros
> Property crimes per 100K people in 2020: 2,645.6 — 30th highest of 188 metros
> Property crimes per 100K people in 2019: 3,067.2 — 17th highest of 188 metros
> Population: 174,705

22. Toledo, OH
> Change in reported property crime rate, 2019-2020: -428.4
> Property crimes reported in 2020: 12,956 — 38th highest of 188 metros
> Property crimes reported in 2019: 15,736 — 33rd highest of 188 metros
> Property crimes per 100K people in 2020: 2,024.4 — 86th highest of 188 metros
> Property crimes per 100K people in 2019: 2,452.9 — 58th highest of 188 metros
> Population: 641,816
[in-text-ad-2]
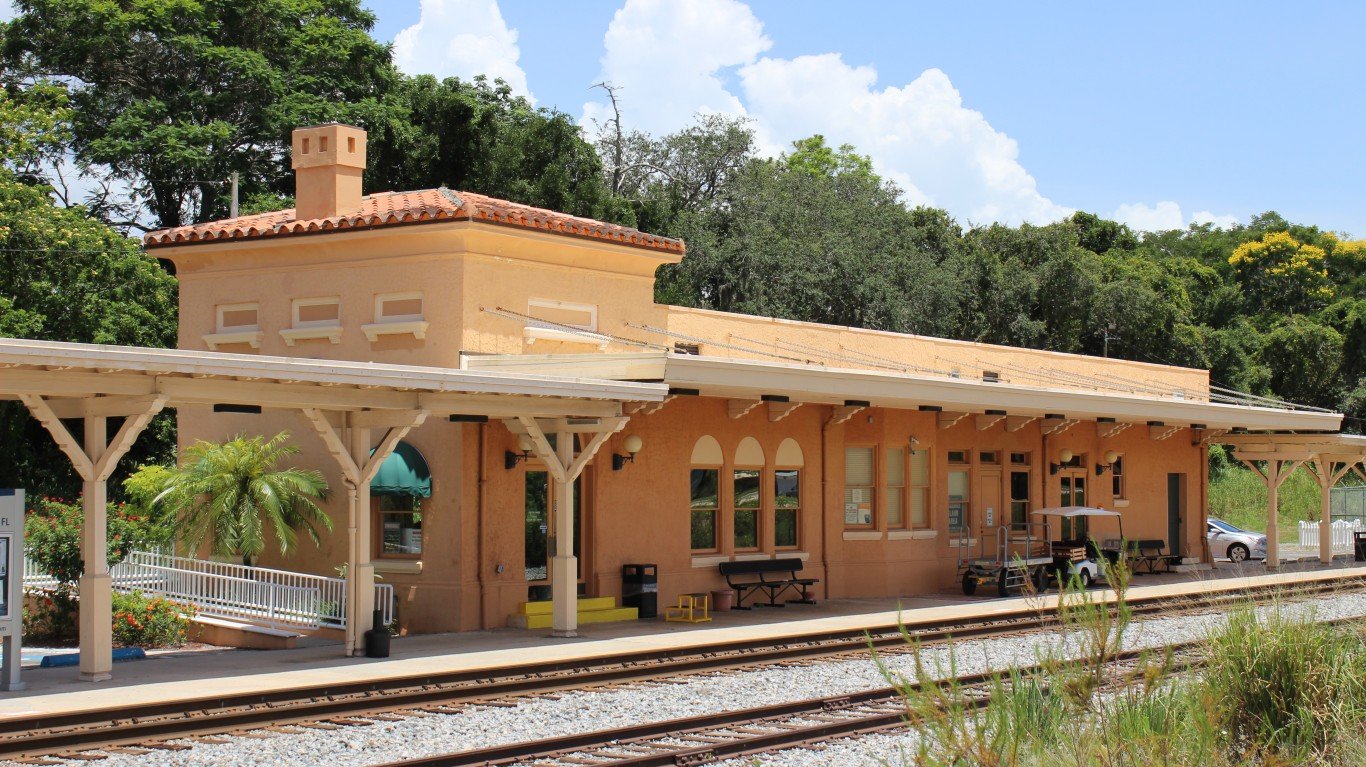
21. Sebring-Avon Park, FL
> Change in reported property crime rate, 2019-2020: -449.0
> Property crimes reported in 2020: 1,889 — 28th lowest of 188 metros
> Property crimes reported in 2019: 2,341 — 35th lowest of 188 metros
> Property crimes per 100K people in 2020: 1,769.0 — 72nd lowest of 188 metros
> Property crimes per 100K people in 2019: 2,218.0 — 85th highest of 188 metros
> Population: 106,221
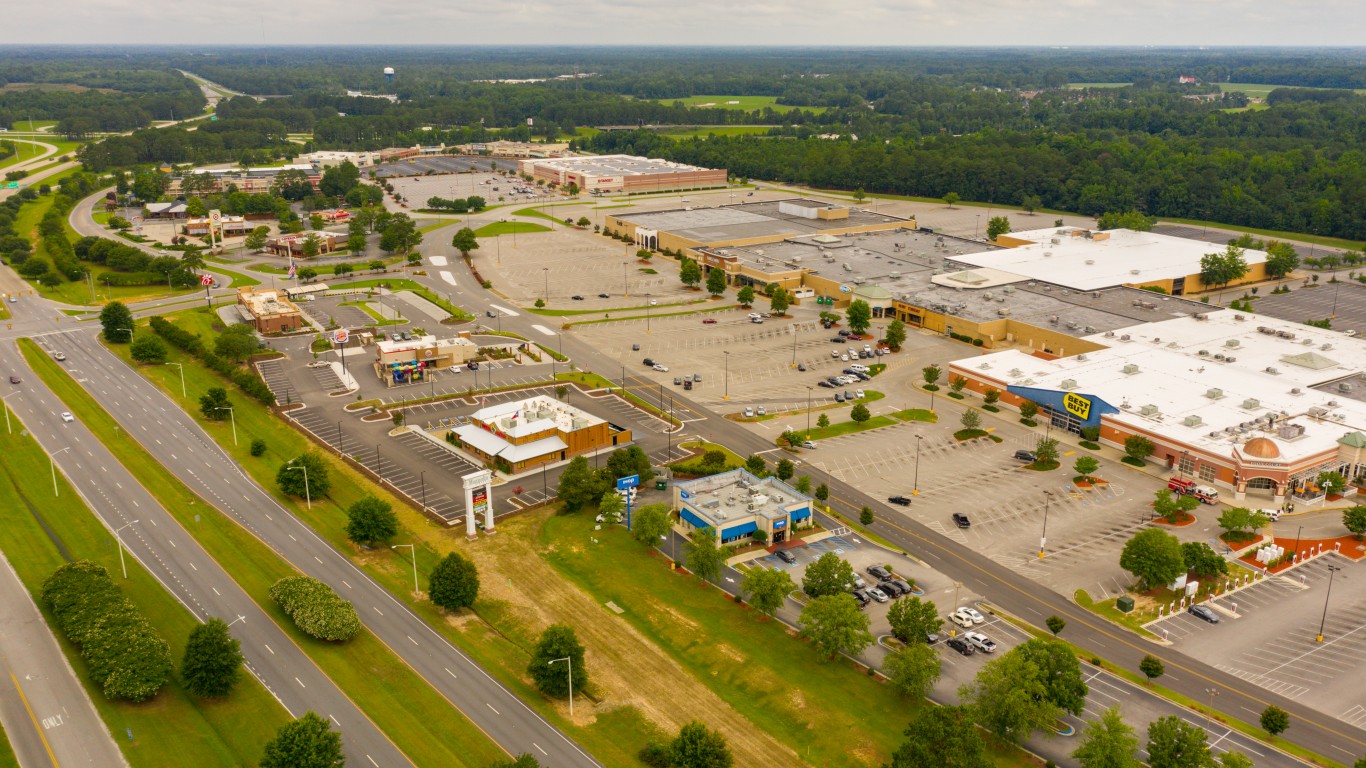
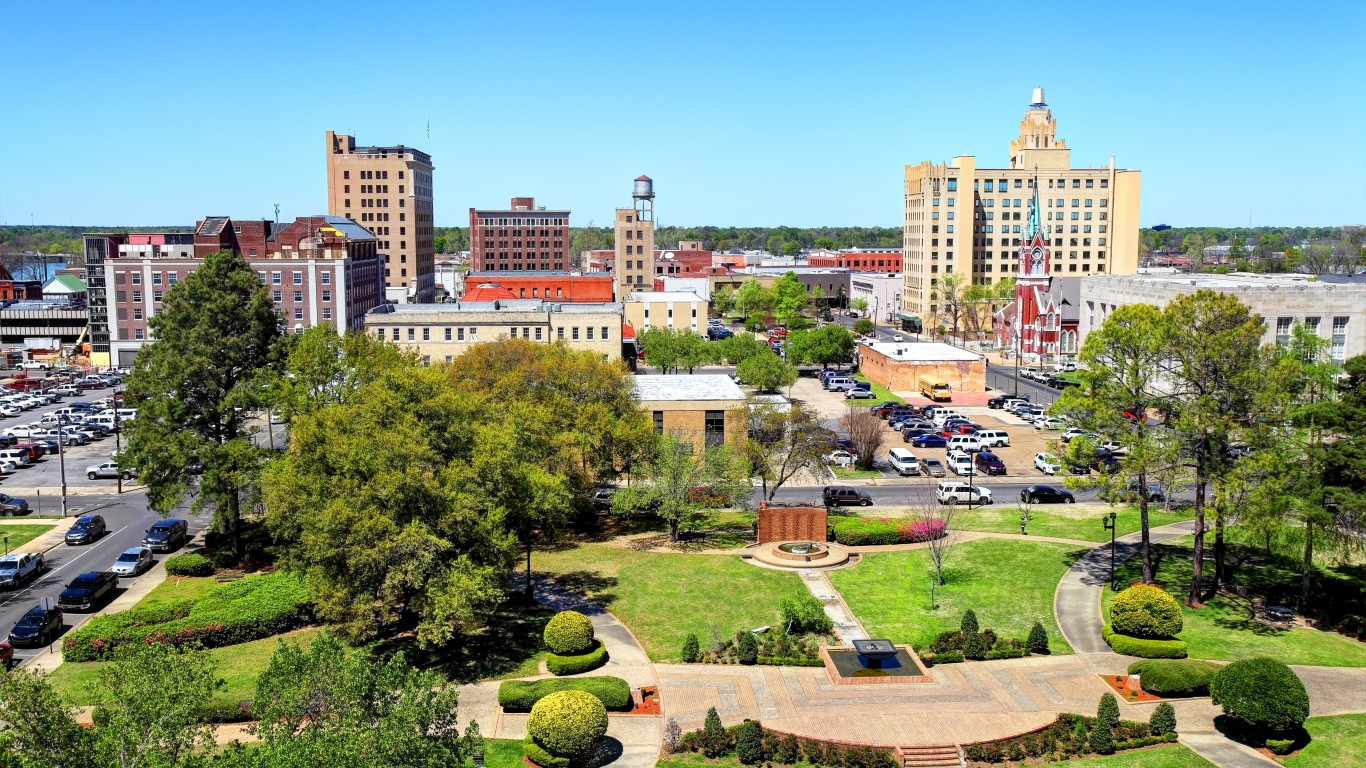
20. Florence, SC
> Change in reported property crime rate, 2019-2020: -458.4
> Property crimes reported in 2020: 7,384 — 66th highest of 188 metros
> Property crimes reported in 2019: 8,321 — 65th highest of 188 metros
> Property crimes per 100K people in 2020: 3,600.8 — 5th highest of 188 metros
> Property crimes per 100K people in 2019: 4,059.2 — 6th highest of 188 metros
> Population: 204,911
[in-text-ad]

19. Atlantic City-Hammonton, NJ
> Change in reported property crime rate, 2019-2020: -472.3
> Property crimes reported in 2020: 5,054 — 92nd highest of 188 metros
> Property crimes reported in 2019: 6,314 — 82nd highest of 188 metros
> Property crimes per 100K people in 2020: 1,927.5 — 91st lowest of 188 metros
> Property crimes per 100K people in 2019: 2,399.8 — 70th highest of 188 metros
> Population: 263,670
[recirclink id=1030620]

18. Lake Havasu City-Kingman, AZ
> Change in reported property crime rate, 2019-2020: -475.5
> Property crimes reported in 2020: 4,643 — 92nd lowest of 188 metros
> Property crimes reported in 2019: 5,564 — 92nd highest of 188 metros
> Property crimes per 100K people in 2020: 2,163.3 — 63rd highest of 188 metros
> Property crimes per 100K people in 2019: 2,638.8 — 43rd highest of 188 metros
> Population: 212,181

17. Great Falls, MT
> Change in reported property crime rate, 2019-2020: -486.9
> Property crimes reported in 2020: 3,261 — 65th lowest of 188 metros
> Property crimes reported in 2019: 3,653 — 68th lowest of 188 metros
> Property crimes per 100K people in 2020: 3,999.8 — 3rd highest of 188 metros
> Property crimes per 100K people in 2019: 4,486.7 — 2nd highest of 188 metros
> Population: 81,366
[in-text-ad-2]
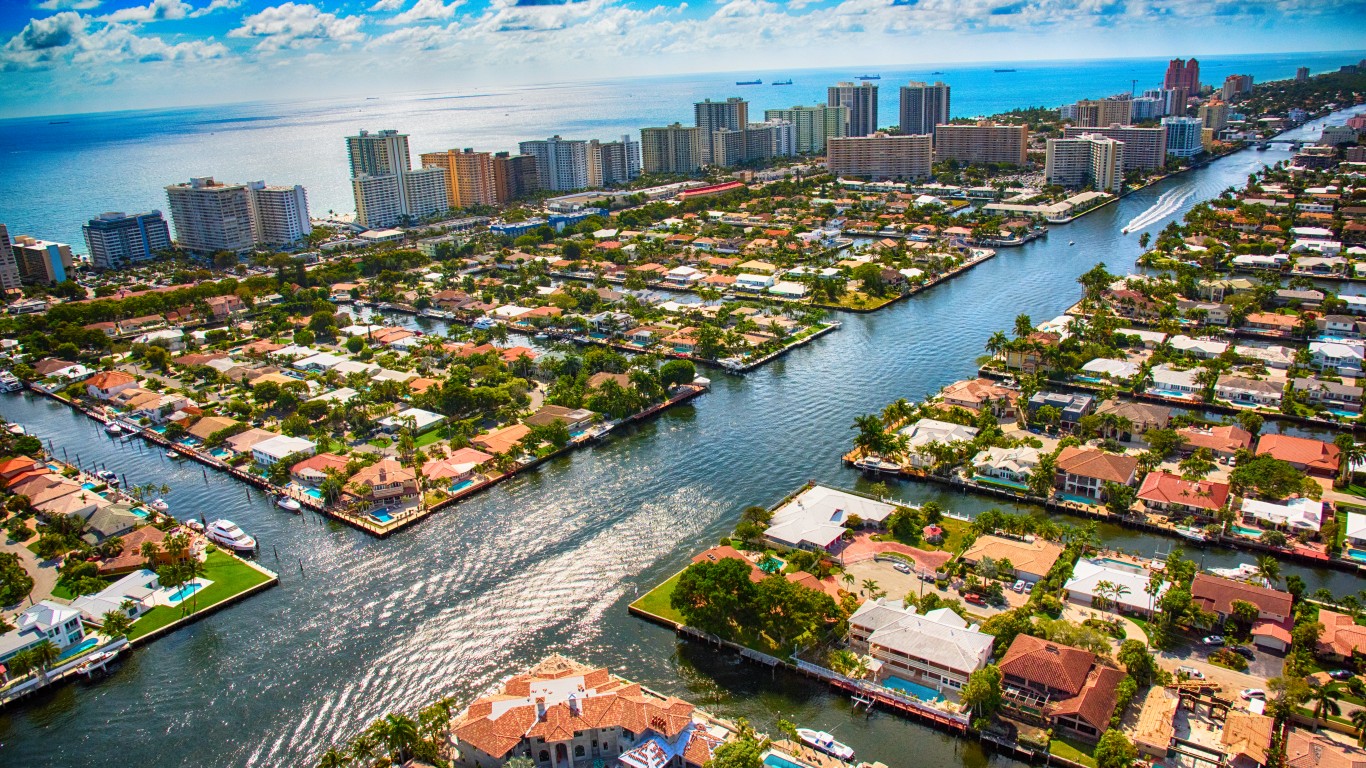
16. Miami-Fort Lauderdale-Pompano Beach, FL
> Change in reported property crime rate, 2019-2020: -493.8
> Property crimes reported in 2020: 136,292 — 3rd highest of 188 metros
> Property crimes reported in 2019: 167,498 — 2nd highest of 188 metros
> Property crimes per 100K people in 2020: 2,192.4 — 61st highest of 188 metros
> Property crimes per 100K people in 2019: 2,686.2 — 37th highest of 188 metros
> Population: 6,166,488
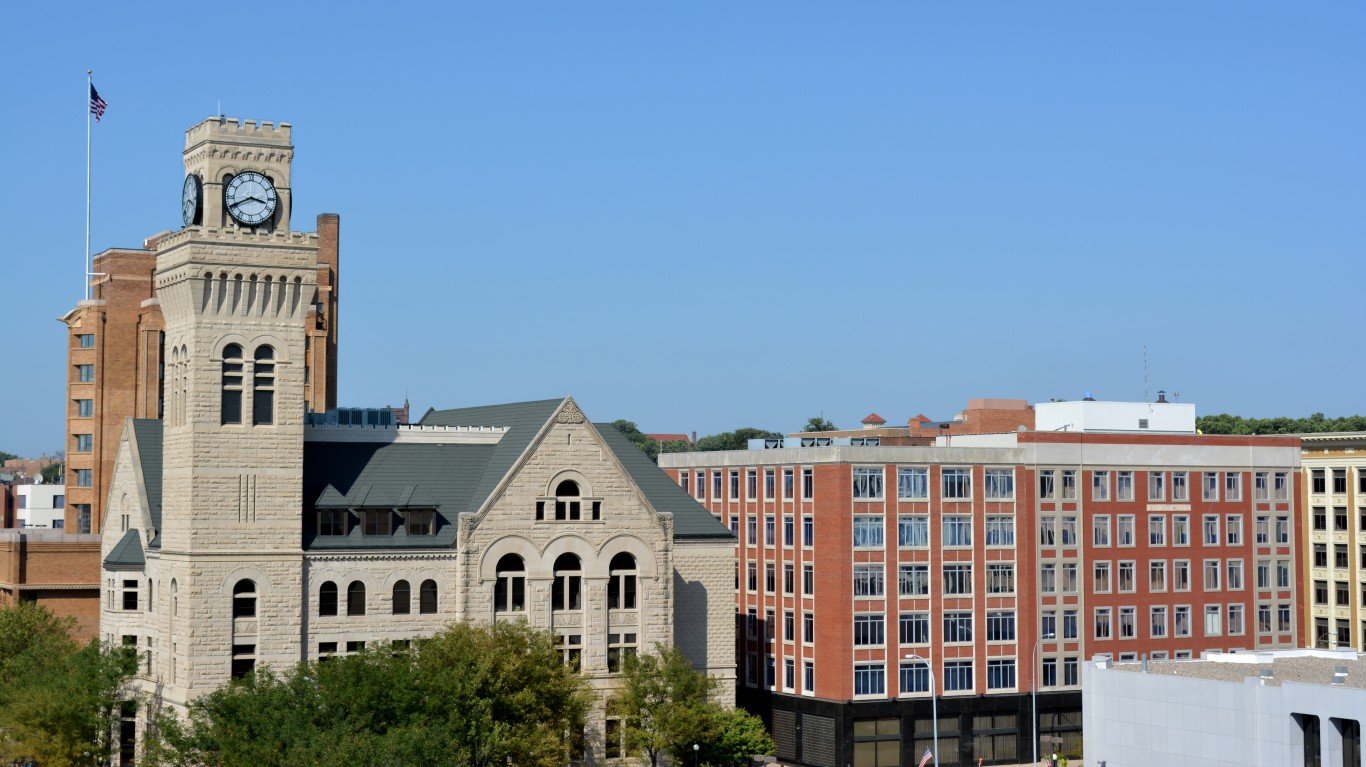
15. Sioux City, IA-NE-SD
> Change in reported property crime rate, 2019-2020: -500.3
> Property crimes reported in 2020: 3,326 — 66th lowest of 188 metros
> Property crimes reported in 2019: 4,013 — 74th lowest of 188 metros
> Property crimes per 100K people in 2020: 2,301.4 — 51st highest of 188 metros
> Property crimes per 100K people in 2019: 2,801.7 — 28th highest of 188 metros
> Population: 144,670
[in-text-ad]

14. Stockton, CA
> Change in reported property crime rate, 2019-2020: -503.4
> Property crimes reported in 2020: 17,805 — 30th highest of 188 metros
> Property crimes reported in 2019: 21,409 — 26th highest of 188 metros
> Property crimes per 100K people in 2020: 2,332.8 — 49th highest of 188 metros
> Property crimes per 100K people in 2019: 2,836.2 — 26th highest of 188 metros
> Population: 762,148
[recirclink id=1033410]
13. Monroe, LA
> Change in reported property crime rate, 2019-2020: -506.8
> Property crimes reported in 2020: 7,275 — 67th highest of 188 metros
> Property crimes reported in 2019: 8,353 — 64th highest of 188 metros
> Property crimes per 100K people in 2020: 3,654.3 — 4th highest of 188 metros
> Property crimes per 100K people in 2019: 4,161.1 — 5th highest of 188 metros
> Population: 200,261

12. San Francisco-Oakland-Berkeley, CA
> Change in reported property crime rate, 2019-2020: -515.4
> Property crimes reported in 2020: 142,267 — 2nd highest of 188 metros
> Property crimes reported in 2019: 167,013 — 3rd highest of 188 metros
> Property crimes per 100K people in 2020: 3,008.2 — 14th highest of 188 metros
> Property crimes per 100K people in 2019: 3,523.6 — 10th highest of 188 metros
> Population: 4,731,803
[in-text-ad-2]

11. Las Vegas-Henderson-Paradise, NV
> Change in reported property crime rate, 2019-2020: -517.5
> Property crimes reported in 2020: 47,356 — 12th highest of 188 metros
> Property crimes reported in 2019: 58,207 — 8th highest of 188 metros
> Property crimes per 100K people in 2020: 2,046.5 — 83rd highest of 188 metros
> Property crimes per 100K people in 2019: 2,564.1 — 47th highest of 188 metros
> Population: 2,266,715
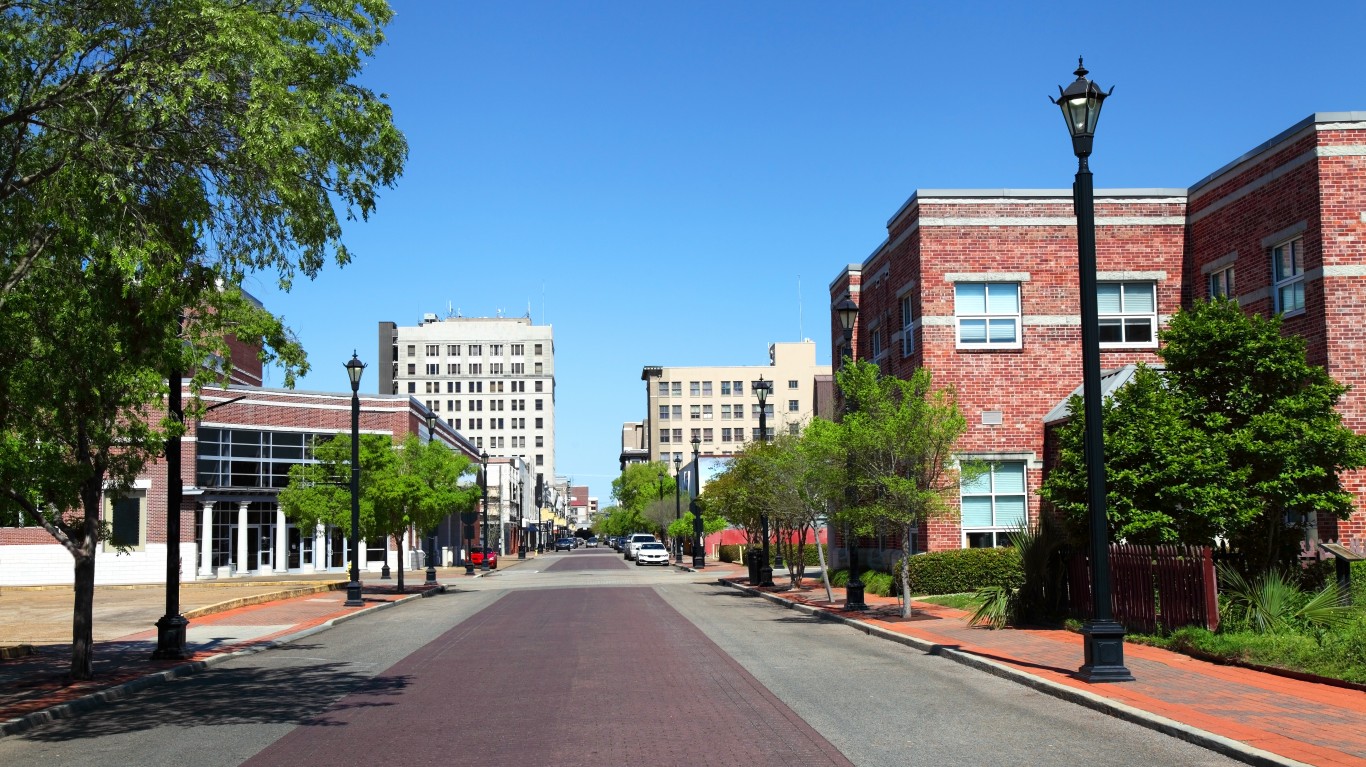
10. Alexandria, LA
> Change in reported property crime rate, 2019-2020: -520.0
> Property crimes reported in 2020: 6,079 — 81st highest of 188 metros
> Property crimes reported in 2019: 6,900 — 75th highest of 188 metros
> Property crimes per 100K people in 2020: 4,018.7 — 2nd highest of 188 metros
> Property crimes per 100K people in 2019: 4,538.7 — the highest of 188 metros
> Population: 152,037
[in-text-ad]

9. Orlando-Kissimmee-Sanford, FL
> Change in reported property crime rate, 2019-2020: -537.9
> Property crimes reported in 2020: 49,514 — 8th highest of 188 metros
> Property crimes reported in 2019: 62,756 — 7th highest of 188 metros
> Property crimes per 100K people in 2020: 1,862.1 — 85th lowest of 188 metros
> Property crimes per 100K people in 2019: 2,400.0 — 69th highest of 188 metros
> Population: 2,608,147
[recirclink id=1039645]

8. Vallejo, CA
> Change in reported property crime rate, 2019-2020: -552.7
> Property crimes reported in 2020: 10,689 — 47th highest of 188 metros
> Property crimes reported in 2019: 13,161 — 42nd highest of 188 metros
> Property crimes per 100K people in 2020: 2,391.1 — 44th highest of 188 metros
> Property crimes per 100K people in 2019: 2,943.8 — 21st highest of 188 metros
> Population: 447,643

7. Vineland-Bridgeton, NJ
> Change in reported property crime rate, 2019-2020: -557.2
> Property crimes reported in 2020: 3,192 — 62nd lowest of 188 metros
> Property crimes reported in 2019: 4,047 — 76th lowest of 188 metros
> Property crimes per 100K people in 2020: 2,148.1 — 70th highest of 188 metros
> Property crimes per 100K people in 2019: 2,705.4 — 35th highest of 188 metros
> Population: 149,527
[in-text-ad-2]
6. Brownsville-Harlingen, TX
> Change in reported property crime rate, 2019-2020: -578.1
> Property crimes reported in 2020: 8,261 — 60th highest of 188 metros
> Property crimes reported in 2019: 10,705 — 54th highest of 188 metros
> Property crimes per 100K people in 2020: 1,950.8 — 94th lowest of 188 metros
> Property crimes per 100K people in 2019: 2,528.9 — 51st highest of 188 metros
> Population: 423,163

5. Modesto, CA
> Change in reported property crime rate, 2019-2020: -622.7
> Property crimes reported in 2020: 10,843 — 45th highest of 188 metros
> Property crimes reported in 2019: 14,274 — 36th highest of 188 metros
> Property crimes per 100K people in 2020: 1,974.3 — 93rd highest of 188 metros
> Property crimes per 100K people in 2019: 2,597.0 — 45th highest of 188 metros
> Population: 550,660
[in-text-ad]

4. Tallahassee, FL
> Change in reported property crime rate, 2019-2020: -703.9
> Property crimes reported in 2020: 8,643 — 57th highest of 188 metros
> Property crimes reported in 2019: 11,266 — 51st highest of 188 metros
> Property crimes per 100K people in 2020: 2,226.7 — 57th highest of 188 metros
> Property crimes per 100K people in 2019: 2,930.5 — 22nd highest of 188 metros
> Population: 386,454
[recirclink id=1055273]

3. Lawton, OK
> Change in reported property crime rate, 2019-2020: -804.5
> Property crimes reported in 2020: 2,343 — 40th lowest of 188 metros
> Property crimes reported in 2019: 3,338 — 57th lowest of 188 metros
> Property crimes per 100K people in 2020: 1,861.6 — 84th lowest of 188 metros
> Property crimes per 100K people in 2019: 2,666.0 — 39th highest of 188 metros
> Population: 126,043

2. Kahului-Wailuku-Lahaina, HI
> Change in reported property crime rate, 2019-2020: -860.3
> Property crimes reported in 2020: 3,537 — 71st lowest of 188 metros
> Property crimes reported in 2019: 4,984 — 89th lowest of 188 metros
> Property crimes per 100K people in 2020: 2,115.7 — 74th highest of 188 metros
> Property crimes per 100K people in 2019: 2,976.0 — 20th highest of 188 metros
> Population: 167,488
[in-text-ad-2]

1. Anchorage, AK
> Change in reported property crime rate, 2019-2020: -914.3
> Property crimes reported in 2020: 10,393 — 49th highest of 188 metros
> Property crimes reported in 2019: 13,222 — 41st highest of 188 metros
> Property crimes per 100K people in 2020: 3,404.7 — 10th highest of 188 metros
> Property crimes per 100K people in 2019: 4,319.0 — 4th highest of 188 metros
> Population: 396,317
Methodology
To determine the metro areas where property crime is falling, 24/7 Wall St. reviewed the change in property crimes per 100,000 people from the FBI’s 2019 and 2020 Uniform Crime Reports. Property crime includes larceny-theft, burglary, and motor vehicle theft. Crime rates were calculated using population figures provided by the FBI in the 2020 and 2019 UCR.
Limited data was available in the 2020 UCR for areas in Alabama, Maryland, Pennsylvania, and Illinois, though metro areas in these states were not excluded from analysis. Only metro areas for which the boundaries defined by the FBI match the boundaries as defined by the U.S. Census Bureau were considered. Because some state and local agencies changed reporting practices between 2019 and 2020, the figures are not comparable, and these areas were excluded.
Population figures are one-year estimates from the U.S. Census Bureau’s 2019 American Community Survey. However, these estimates were not used to calculate crime rates.
Contact [email protected] for any questions or corrections.