
Burglary – defined as the unlawful entry of a structure, such as a home or business, to commit a theft or felony – is the most serious nonviolent offense tracked by the FBI. There were just over 1 million burglaries reported in the United States in 2020, a 7% decline from the previous year.
Most burglaries in the U.S. are committed in residential properties, and more often during the day than at night. These crimes are typically committed for monetary gain and result in billions of dollars in stolen property each year. Not only do victims of burglaries typically suffer material loss, but they can also be impacted psychologically. Many burglary victims have reported heightened anxiety, difficulty sleeping, feelings of vulnerability, and even post-traumatic stress disorder in some cases.
While the burglary rates have been declining in most of the country, some major metropolitan areas are bucking the national trend, reporting a year-over-year uptick in break-ins. Here is a look at the American cities with the most break-ins.
Using data from the FBI’s 2020 Uniform Crime Report, 24/7 Wall St. identified the 50 metro areas where the burglary rate is rising fastest. Metro areas are ranked by the year-over-year change in the number of burglaries reported for every 100,000 people.
Among the metro areas on this list, burglary rates have climbed anywhere from 7 incidents for every 100,000 people to 207 per 100,000. Nationwide, the burglary rate fell by 26 incidents per 100,000 people. The largest share of metro areas on this list are in the West, including six in California and six in Washington.
In most metro areas on this list, the burglary rate exceeds the national rate of 314 per 100,000 people. Burglary – along with vehicle theft and larceny – is one component of the overall property crime category. In half of the metro areas on this list, the property crime rate also climbed in the last year. Here is a look at the states where property crime is soaring.
Click here to see metros where the burglary rate is soaring
Click here to read our detailed methodology

50. Wenatchee, WA
> 1-yr. change in reported burglaries per 100K people: +7.2
> Burglaries reported in 2020: 239 — 17th lowest of 200 metros
> Burglaries per 100K people in 2020: 197.0 — 36th lowest of 200 metros
> 1-yr. change in all property crime per 100K people: +3.6 — 37th highest of 188 metros
> Property crimes per 100K people in 2020: 1,147.4 — 20th lowest of 190 metros
> Population: 120,629
[in-text-ad]

49. Santa Rosa-Petaluma, CA
> 1-yr. change in reported burglaries per 100K people: +12.6
> Burglaries reported in 2020: 1,272 — 78th highest of 200 metros
> Burglaries per 100K people in 2020: 259.4 — 72nd lowest of 200 metros
> 1-yr. change in all property crime per 100K people: -51.0 — 50th highest of 188 metros
> Property crimes per 100K people in 2020: 1,307.4 — 35th lowest of 190 metros
> Population: 494,336
[recirclink id=1059954]

48. Colorado Springs, CO
> 1-yr. change in reported burglaries per 100K people: +15.3
> Burglaries reported in 2020: 3,106 — 25th highest of 200 metros
> Burglaries per 100K people in 2020: 412.8 — 56th highest of 200 metros
> 1-yr. change in all property crime per 100K people: -194.7 — 84th lowest of 188 metros
> Property crimes per 100K people in 2020: 2,653.0 — 29th highest of 190 metros
> Population: 745,791
47. Green Bay, WI
> 1-yr. change in reported burglaries per 100K people: +15.5
> Burglaries reported in 2020: 475 — 55th lowest of 200 metros
> Burglaries per 100K people in 2020: 146.4 — 17th lowest of 200 metros
> 1-yr. change in all property crime per 100K people: -107.3 — 70th highest of 188 metros
> Property crimes per 100K people in 2020: 991.1 — 10th lowest of 190 metros
> Population: 322,906
[in-text-ad-2]

46. Oshkosh-Neenah, WI
> 1-yr. change in reported burglaries per 100K people: +15.7
> Burglaries reported in 2020: 368 — 41st lowest of 200 metros
> Burglaries per 100K people in 2020: 213.6 — 48th lowest of 200 metros
> 1-yr. change in all property crime per 100K people: +152.9 — 15th highest of 188 metros
> Property crimes per 100K people in 2020: 1,325.0 — 36th lowest of 190 metros
> Population: 171,907

45. St. Joseph, MO-KS
> 1-yr. change in reported burglaries per 100K people: +16.2
> Burglaries reported in 2020: 698 — 85th lowest of 200 metros
> Burglaries per 100K people in 2020: 558.7 — 22nd highest of 200 metros
> 1-yr. change in all property crime per 100K people: -331.2 — 42nd lowest of 188 metros
> Property crimes per 100K people in 2020: 3,541.3 — 7th highest of 190 metros
> Population: 125,411
[in-text-ad]

44. Nashville-Davidson-Murfreesboro-Franklin, TN
> 1-yr. change in reported burglaries per 100K people: +16.6
> Burglaries reported in 2020: 6,307 — 15th highest of 200 metros
> Burglaries per 100K people in 2020: 320.3 — 99th highest of 200 metros
> 1-yr. change in all property crime per 100K people: -97.0 — 63rd highest of 188 metros
> Property crimes per 100K people in 2020: 2,352.5 — 48th highest of 190 metros
> Population: 1,933,860
[recirclink id=1066891]

43. Fairbanks, AK
> 1-yr. change in reported burglaries per 100K people: +17.0
> Burglaries reported in 2020: 180 — 7th lowest of 200 metros
> Burglaries per 100K people in 2020: 546.7 — 23rd highest of 200 metros
> 1-yr. change in all property crime per 100K people: -284.7 — 59th lowest of 188 metros
> Property crimes per 100K people in 2020: 4,152.2 — the highest of 190 metros
> Population: 96,849

42. Pueblo, CO
> 1-yr. change in reported burglaries per 100K people: +18.8
> Burglaries reported in 2020: 1,112 — 86th highest of 200 metros
> Burglaries per 100K people in 2020: 660.4 — 8th highest of 200 metros
> 1-yr. change in all property crime per 100K people: N/A
> Property crimes per 100K people in 2020: N/A
> Population: 168,424
[in-text-ad-2]

41. Bellingham, WA
> 1-yr. change in reported burglaries per 100K people: +21.9
> Burglaries reported in 2020: 885 — 96th highest of 200 metros
> Burglaries per 100K people in 2020: 381.8 — 69th highest of 200 metros
> 1-yr. change in all property crime per 100K people: +254.4 — 10th highest of 188 metros
> Property crimes per 100K people in 2020: 2,355.2 — 47th highest of 190 metros
> Population: 229,247

40. Appleton, WI
> 1-yr. change in reported burglaries per 100K people: +22.0
> Burglaries reported in 2020: 319 — 31st lowest of 200 metros
> Burglaries per 100K people in 2020: 133.4 — 12th lowest of 200 metros
> 1-yr. change in all property crime per 100K people: +81.3 — 24th highest of 188 metros
> Property crimes per 100K people in 2020: 1,170.0 — 26th lowest of 190 metros
> Population: 237,974
[in-text-ad]

39. Bend, OR
> 1-yr. change in reported burglaries per 100K people: +22.7
> Burglaries reported in 2020: 397 — 48th lowest of 200 metros
> Burglaries per 100K people in 2020: 196.8 — 35th lowest of 200 metros
> 1-yr. change in all property crime per 100K people: -104.8 — 68th highest of 188 metros
> Property crimes per 100K people in 2020: 1,816.5 — 80th lowest of 190 metros
> Population: 197,692
[recirclink id=1023032]

38. Austin-Round Rock-Georgetown, TX
> 1-yr. change in reported burglaries per 100K people: +22.8
> Burglaries reported in 2020: 7,687 — 10th highest of 200 metros
> Burglaries per 100K people in 2020: 336.6 — 93rd highest of 200 metros
> 1-yr. change in all property crime per 100K people: -43.6 — 48th highest of 188 metros
> Property crimes per 100K people in 2020: 2,366.6 — 46th highest of 190 metros
> Population: 2,227,083

37. Lewiston, ID-WA
> 1-yr. change in reported burglaries per 100K people: +23.3
> Burglaries reported in 2020: 254 — 19th lowest of 200 metros
> Burglaries per 100K people in 2020: 400.4 — 59th highest of 200 metros
> 1-yr. change in all property crime per 100K people: -346.2 — 39th lowest of 188 metros
> Property crimes per 100K people in 2020: 2,060.3 — 82nd highest of 190 metros
> Population: 62,990
[in-text-ad-2]

36. San Jose-Sunnyvale-Santa Clara, CA
> 1-yr. change in reported burglaries per 100K people: +23.5
> Burglaries reported in 2020: 7,338 — 11th highest of 200 metros
> Burglaries per 100K people in 2020: 369.1 — 77th highest of 200 metros
> 1-yr. change in all property crime per 100K people: -174.0 — 94th highest of 188 metros
> Property crimes per 100K people in 2020: 2,226.6 — 58th highest of 190 metros
> Population: 1,990,660

35. Tyler, TX
> 1-yr. change in reported burglaries per 100K people: +23.5
> Burglaries reported in 2020: 994 — 89th highest of 200 metros
> Burglaries per 100K people in 2020: 423.7 — 51st highest of 200 metros
> 1-yr. change in all property crime per 100K people: -5.1 — 38th highest of 188 metros
> Property crimes per 100K people in 2020: 2,170.8 — 62nd highest of 190 metros
> Population: 232,751
[in-text-ad]

34. Hanford-Corcoran, CA
> 1-yr. change in reported burglaries per 100K people: +24.3
> Burglaries reported in 2020: 451 — 52nd lowest of 200 metros
> Burglaries per 100K people in 2020: 297.7 — 87th lowest of 200 metros
> 1-yr. change in all property crime per 100K people: +10.0 — 35th highest of 188 metros
> Property crimes per 100K people in 2020: 1,654.4 — 62nd lowest of 190 metros
> Population: 152,940
[recirclink id=1030620]

33. Bangor, ME
> 1-yr. change in reported burglaries per 100K people: +24.5
> Burglaries reported in 2020: 260 — 23rd lowest of 200 metros
> Burglaries per 100K people in 2020: 170.6 — 25th lowest of 200 metros
> 1-yr. change in all property crime per 100K people: -22.4 — 43rd highest of 188 metros
> Property crimes per 100K people in 2020: 1,534.7 — 55th lowest of 190 metros
> Population: 152,148
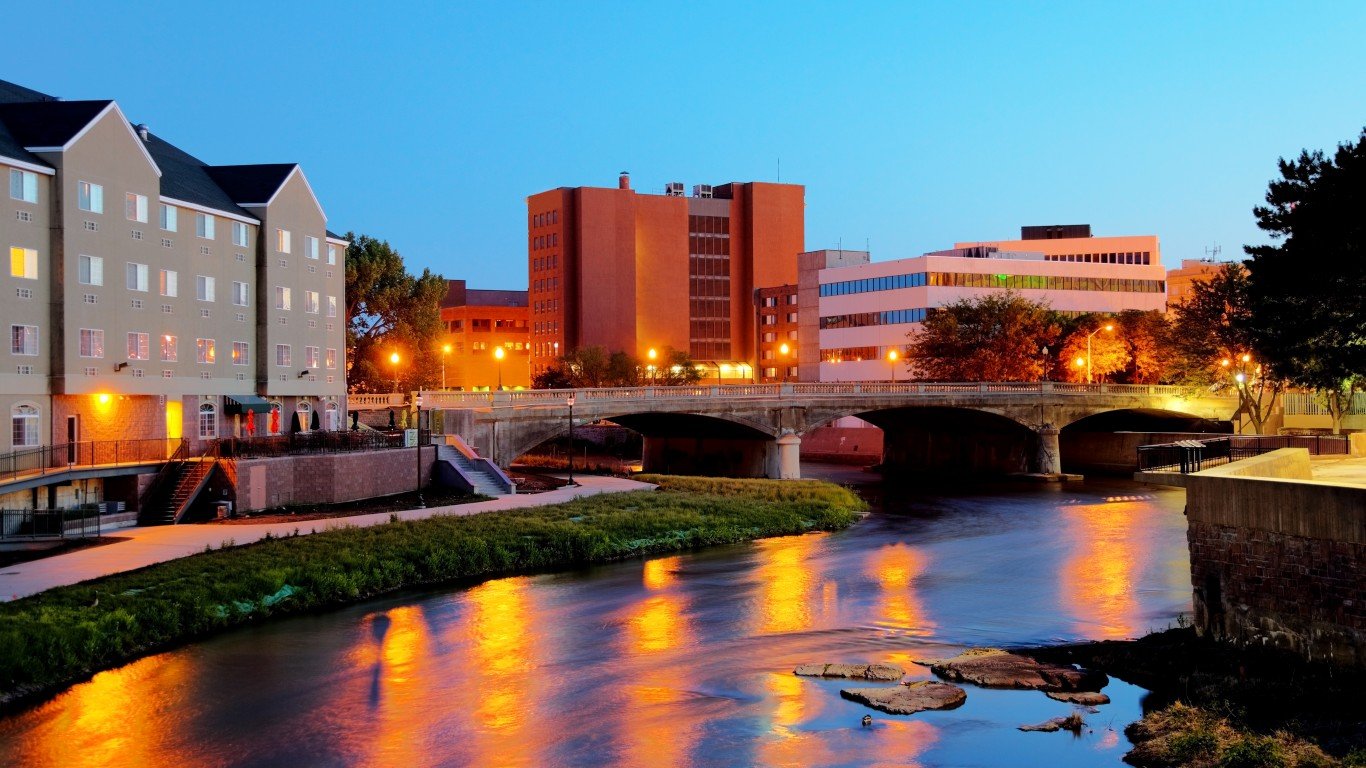
32. Sioux Falls, SD
> 1-yr. change in reported burglaries per 100K people: +26.1
> Burglaries reported in 2020: 1,080 — 87th highest of 200 metros
> Burglaries per 100K people in 2020: 395.6 — 62nd highest of 200 metros
> 1-yr. change in all property crime per 100K people: +97.1 — 20th highest of 188 metros
> Property crimes per 100K people in 2020: 2,524.2 — 36th highest of 190 metros
> Population: 268,833
[in-text-ad-2]
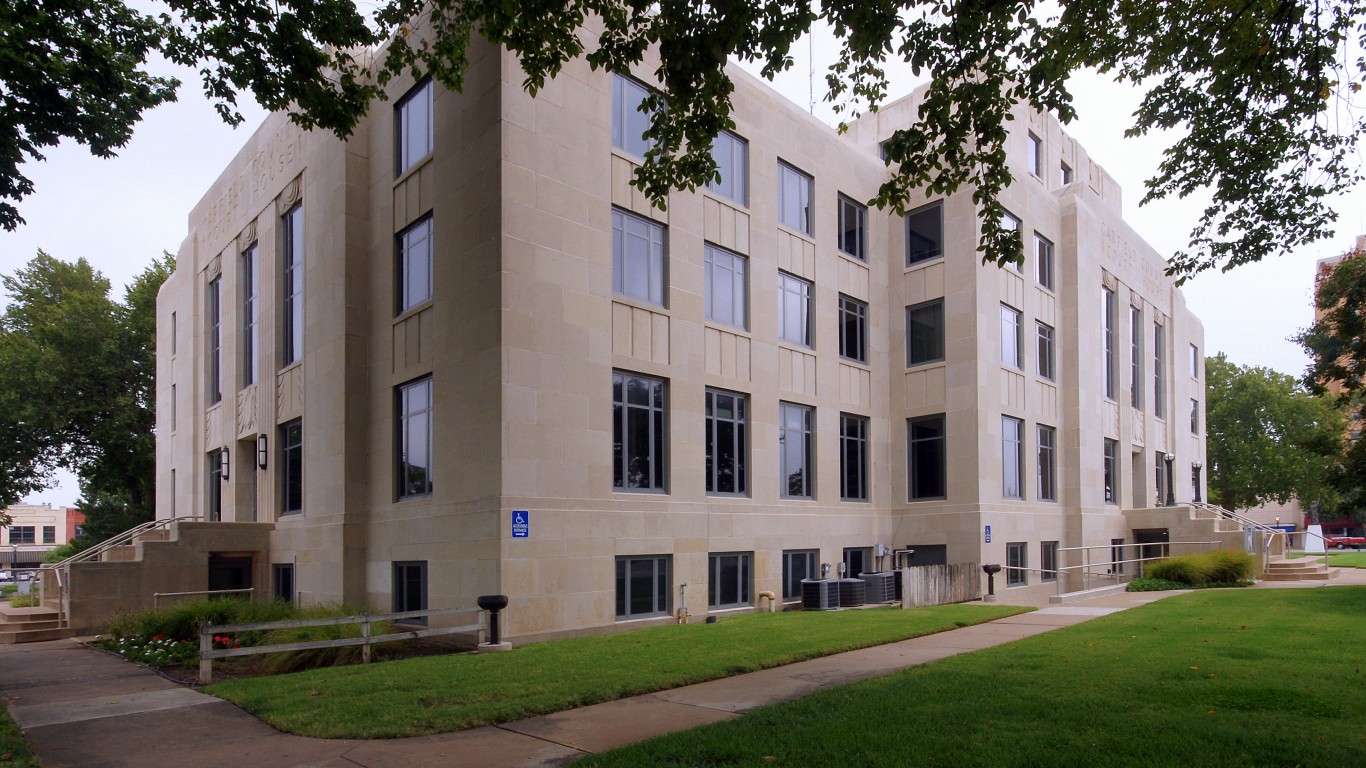
31. Enid, OK
> 1-yr. change in reported burglaries per 100K people: +27.6
> Burglaries reported in 2020: 430 — 50th lowest of 200 metros
> Burglaries per 100K people in 2020: 703.9 — 6th highest of 200 metros
> 1-yr. change in all property crime per 100K people: -401.9 — 27th lowest of 188 metros
> Property crimes per 100K people in 2020: 2,579.7 — 32nd highest of 190 metros
> Population: 61,056
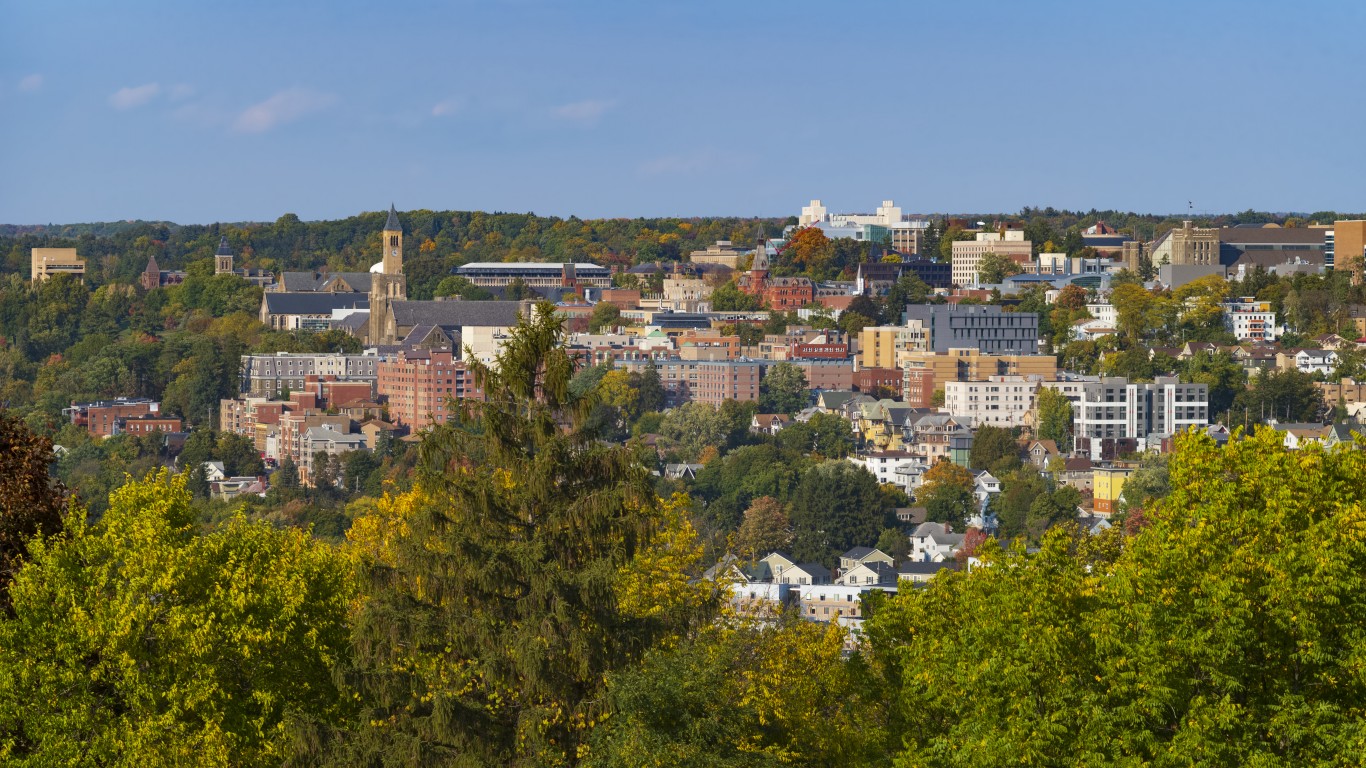
30. Ithaca, NY
> 1-yr. change in reported burglaries per 100K people: +28.1
> Burglaries reported in 2020: 224 — 14th lowest of 200 metros
> Burglaries per 100K people in 2020: 220.5 — 52nd lowest of 200 metros
> 1-yr. change in all property crime per 100K people: +226.5 — 12th highest of 188 metros
> Property crimes per 100K people in 2020: 1,894.1 — 89th lowest of 190 metros
> Population: 102,180
[in-text-ad]

29. Spokane-Spokane Valley, WA
> 1-yr. change in reported burglaries per 100K people: +28.2
> Burglaries reported in 2020: 3,277 — 23rd highest of 200 metros
> Burglaries per 100K people in 2020: 572.1 — 19th highest of 200 metros
> 1-yr. change in all property crime per 100K people: -367.6 — 31st lowest of 188 metros
> Property crimes per 100K people in 2020: 3,478.6 — 8th highest of 190 metros
> Population: 568,521
[recirclink id=1020198]

28. Madison, WI
> 1-yr. change in reported burglaries per 100K people: +30.8
> Burglaries reported in 2020: 1,951 — 43rd highest of 200 metros
> Burglaries per 100K people in 2020: 290.7 — 84th lowest of 200 metros
> 1-yr. change in all property crime per 100K people: +90.7 — 21st highest of 188 metros
> Property crimes per 100K people in 2020: 1,805.4 — 78th lowest of 190 metros
> Population: 664,865
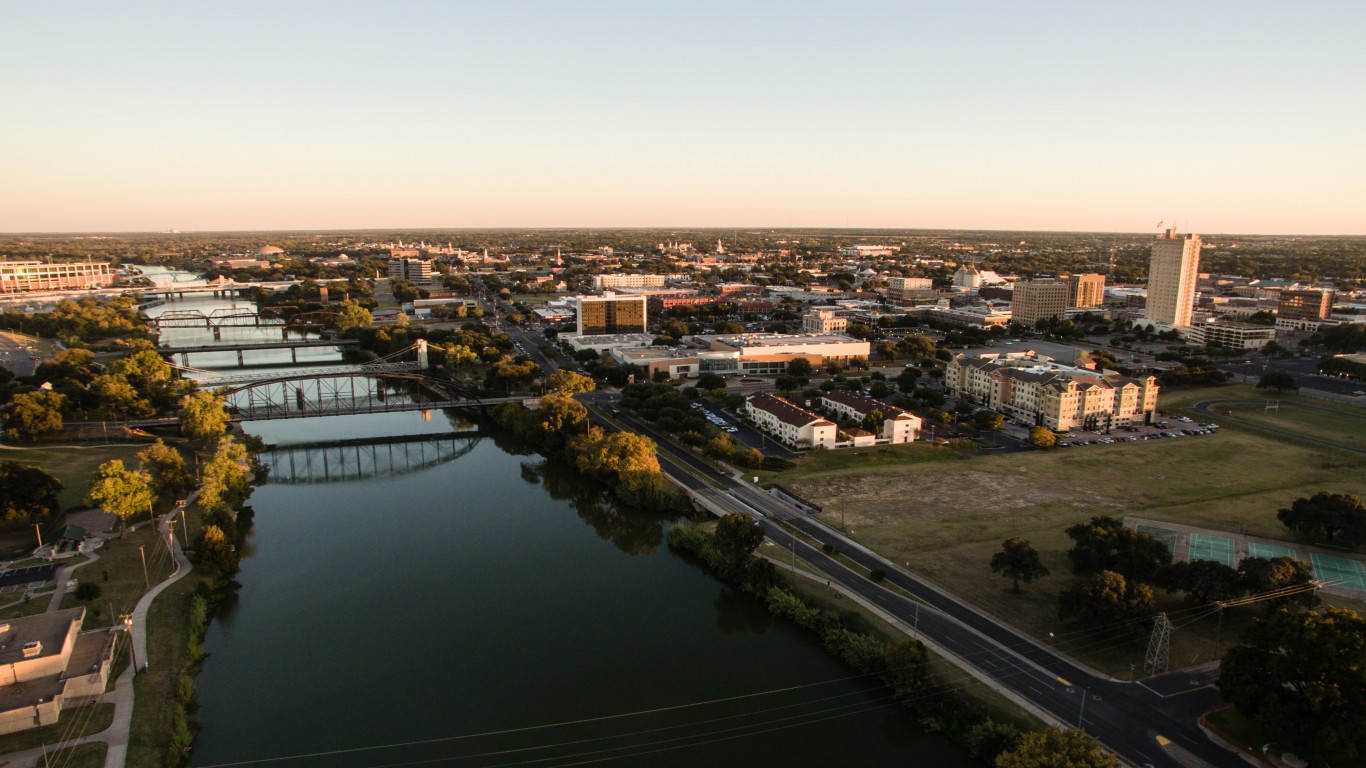
27. Waco, TX
> 1-yr. change in reported burglaries per 100K people: +31.1
> Burglaries reported in 2020: 1,332 — 72nd highest of 200 metros
> Burglaries per 100K people in 2020: 483.8 — 38th highest of 200 metros
> 1-yr. change in all property crime per 100K people: +11.6 — 34th highest of 188 metros
> Property crimes per 100K people in 2020: 2,570.8 — 33rd highest of 190 metros
> Population: 270,868
[in-text-ad-2]

26. Greeley, CO
> 1-yr. change in reported burglaries per 100K people: +34.8
> Burglaries reported in 2020: 838 — 98th lowest of 200 metros
> Burglaries per 100K people in 2020: 253.0 — 67th lowest of 200 metros
> 1-yr. change in all property crime per 100K people: +530.5 — 3rd highest of 188 metros
> Property crimes per 100K people in 2020: 2,162.8 — 64th highest of 190 metros
> Population: 324,492

25. Hartford-East Hartford-Middletown, CT
> 1-yr. change in reported burglaries per 100K people: +37.9
> Burglaries reported in 2020: 2,381 — 36th highest of 200 metros
> Burglaries per 100K people in 2020: 234.7 — 63rd lowest of 200 metros
> 1-yr. change in all property crime per 100K people: N/A
> Property crimes per 100K people in 2020: 2,088.9 — 79th highest of 190 metros
> Population: 1,204,877
[in-text-ad]

24. Owensboro, KY
> 1-yr. change in reported burglaries per 100K people: +38.8
> Burglaries reported in 2020: 539 — 66th lowest of 200 metros
> Burglaries per 100K people in 2020: 449.8 — 44th highest of 200 metros
> 1-yr. change in all property crime per 100K people: -98.6 — 64th highest of 188 metros
> Property crimes per 100K people in 2020: 2,330.6 — 50th highest of 190 metros
> Population: 121,128
[recirclink id=1059954]

23. Syracuse, NY
> 1-yr. change in reported burglaries per 100K people: +39.6
> Burglaries reported in 2020: 1,874 — 46th highest of 200 metros
> Burglaries per 100K people in 2020: 291.5 — 85th lowest of 200 metros
> 1-yr. change in all property crime per 100K people: +31.8 — 32nd highest of 188 metros
> Property crimes per 100K people in 2020: 1,708.7 — 68th lowest of 190 metros
> Population: 648,593

22. El Centro, CA
> 1-yr. change in reported burglaries per 100K people: +39.8
> Burglaries reported in 2020: 873 — 97th highest of 200 metros (tied)
> Burglaries per 100K people in 2020: 484.7 — 37th highest of 200 metros
> 1-yr. change in all property crime per 100K people: -39.8 — 45th highest of 188 metros
> Property crimes per 100K people in 2020: 1,957.5 — 95th highest of 190 metros
> Population: 181,215
[in-text-ad-2]

21. Niles, MI
> 1-yr. change in reported burglaries per 100K people: +43.3
> Burglaries reported in 2020: 566 — 68th lowest of 200 metros
> Burglaries per 100K people in 2020: 371.1 — 76th highest of 200 metros
> 1-yr. change in all property crime per 100K people: -287.3 — 58th lowest of 188 metros
> Property crimes per 100K people in 2020: 1,889.6 — 88th lowest of 190 metros
> Population: 153,401

20. Idaho Falls, ID
> 1-yr. change in reported burglaries per 100K people: +52.8
> Burglaries reported in 2020: 534 — 65th lowest of 200 metros
> Burglaries per 100K people in 2020: 345.0 — 86th highest of 200 metros
> 1-yr. change in all property crime per 100K people: +199.1 — 14th highest of 188 metros
> Property crimes per 100K people in 2020: 1,288.2 — 33rd lowest of 190 metros
> Population: 151,516
[in-text-ad]

19. San Francisco-Oakland-Berkeley, CA
> 1-yr. change in reported burglaries per 100K people: +59.1
> Burglaries reported in 2020: 20,761 — 2nd highest of 200 metros
> Burglaries per 100K people in 2020: 439.0 — 47th highest of 200 metros
> 1-yr. change in all property crime per 100K people: -515.4 — 12th lowest of 188 metros
> Property crimes per 100K people in 2020: 3,008.2 — 14th highest of 190 metros
> Population: 4,731,803
[recirclink id=1066891]
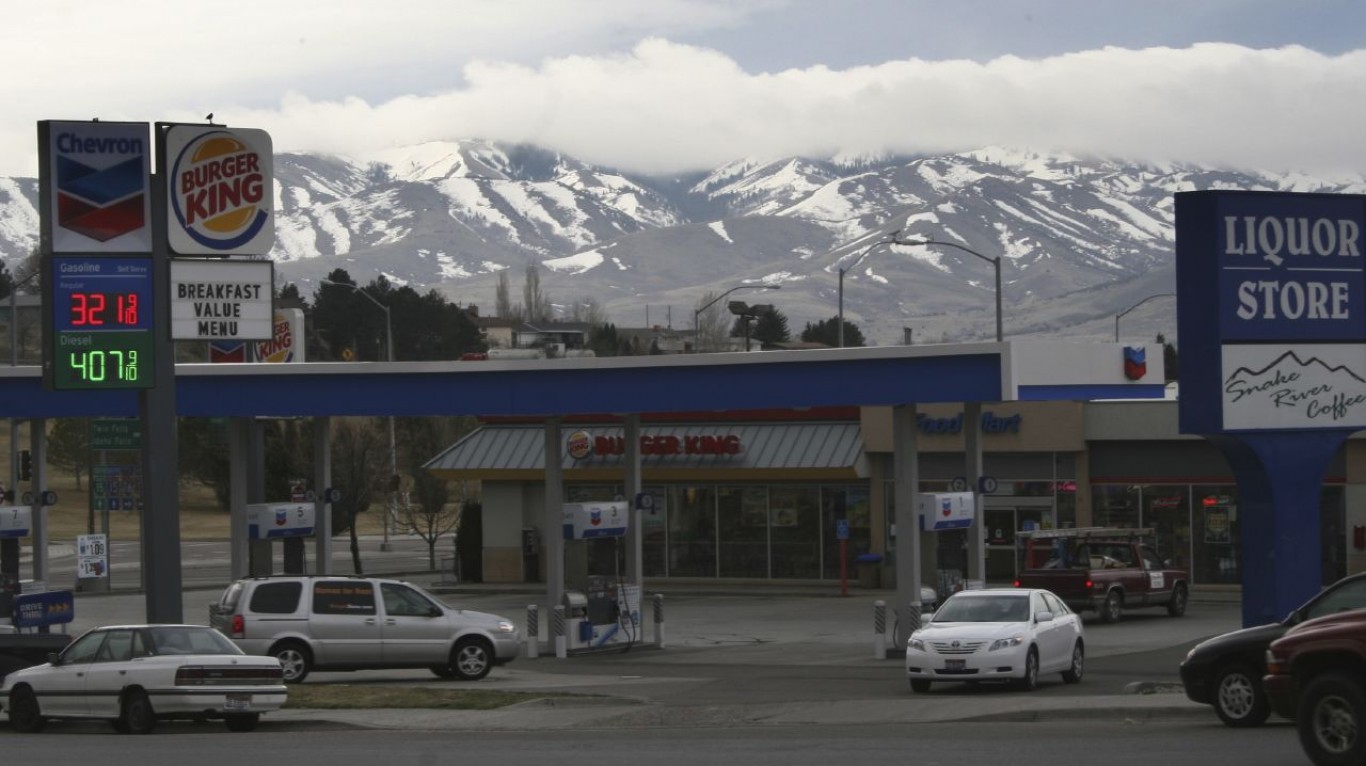
18. Pocatello, ID
> 1-yr. change in reported burglaries per 100K people: +60.3
> Burglaries reported in 2020: 349 — 37th lowest of 200 metros
> Burglaries per 100K people in 2020: 360.8 — 82nd highest of 200 metros
> 1-yr. change in all property crime per 100K people: -299.3 — 51st lowest of 188 metros
> Property crimes per 100K people in 2020: 1,806.1 — 79th lowest of 190 metros
> Population: 94,588
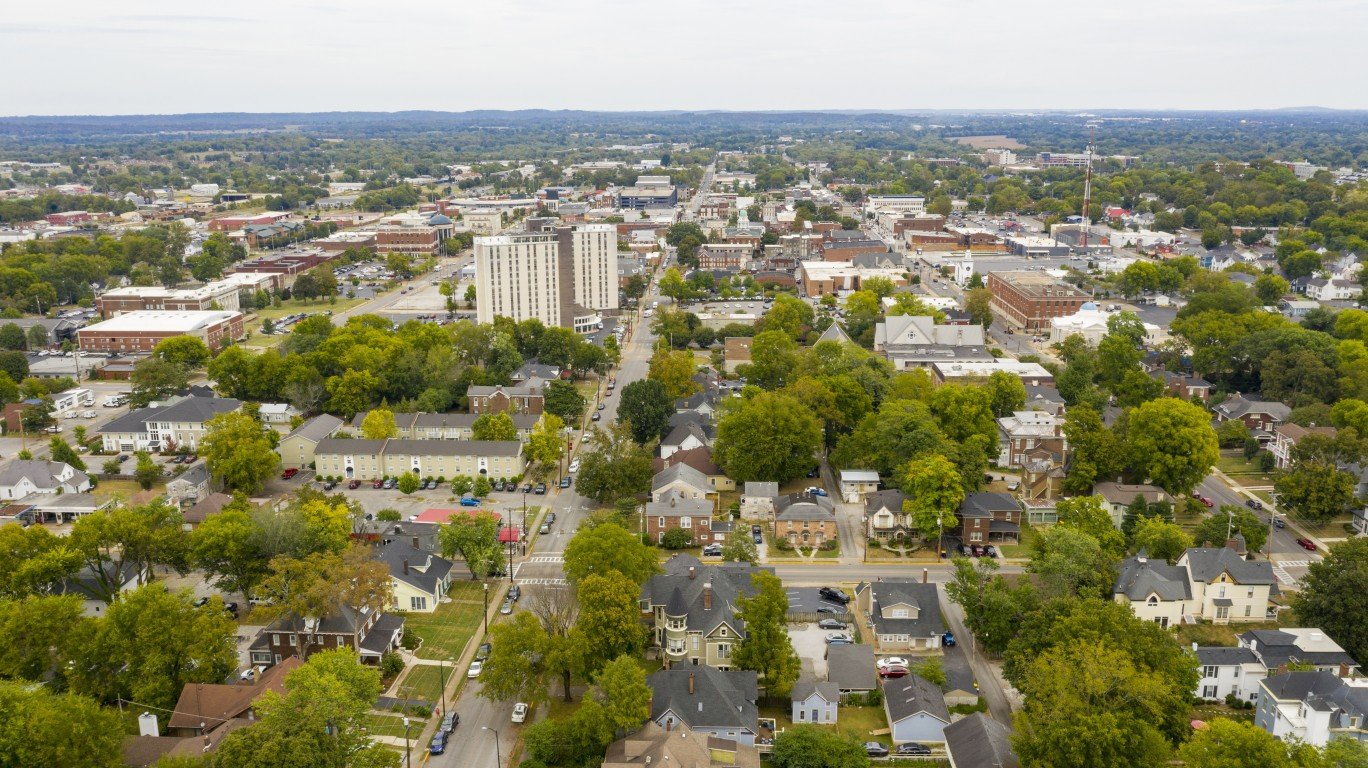
17. Bowling Green, KY
> 1-yr. change in reported burglaries per 100K people: +60.6
> Burglaries reported in 2020: 763 — 93rd lowest of 200 metros
> Burglaries per 100K people in 2020: 420.5 — 52nd highest of 200 metros
> 1-yr. change in all property crime per 100K people: -42.7 — 47th highest of 188 metros
> Property crimes per 100K people in 2020: 2,294.5 — 52nd highest of 190 metros
> Population: 176,816
[in-text-ad-2]

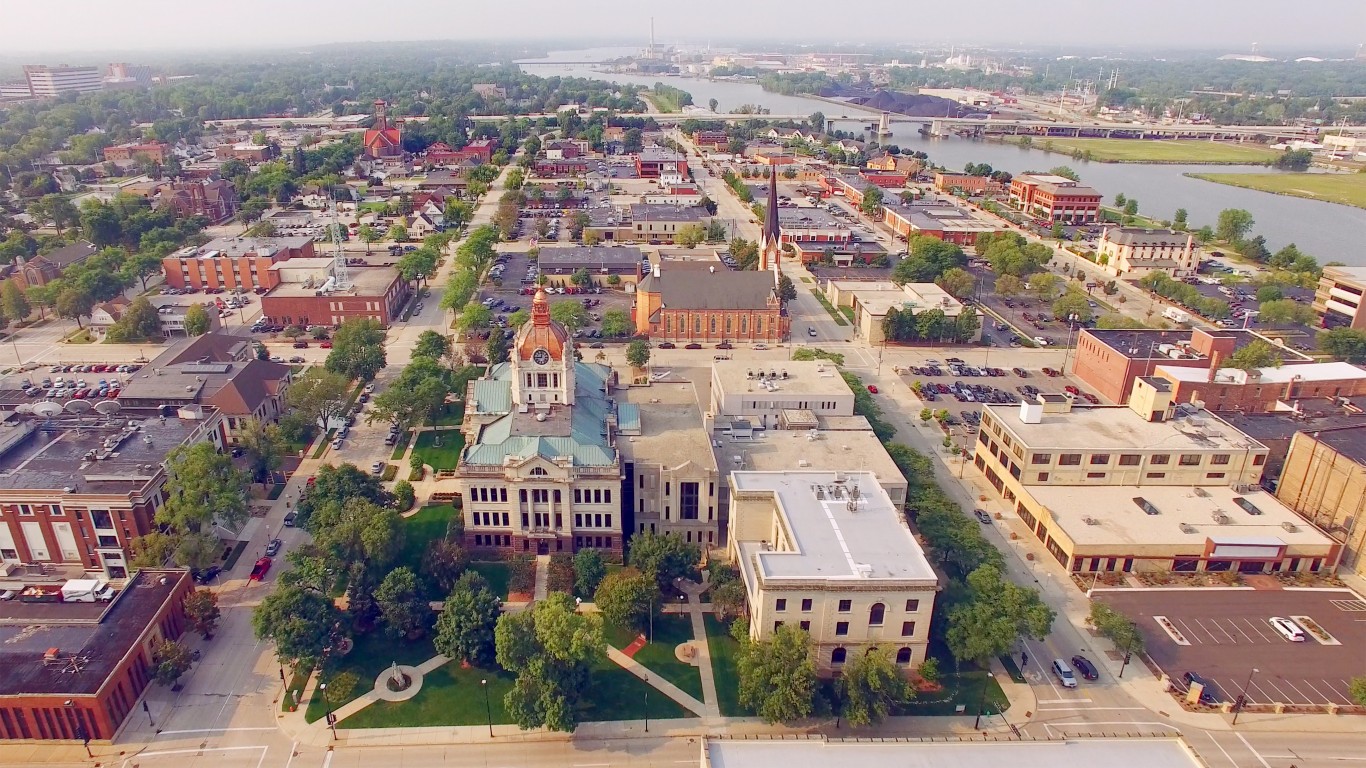
16. Cedar Rapids, IA
> 1-yr. change in reported burglaries per 100K people: +65.9
> Burglaries reported in 2020: 1,278 — 77th highest of 200 metros
> Burglaries per 100K people in 2020: 465.9 — 42nd highest of 200 metros
> 1-yr. change in all property crime per 100K people: +74.6 — 26th highest of 188 metros
> Property crimes per 100K people in 2020: 2,115.5 — 75th highest of 190 metros
> Population: 273,032
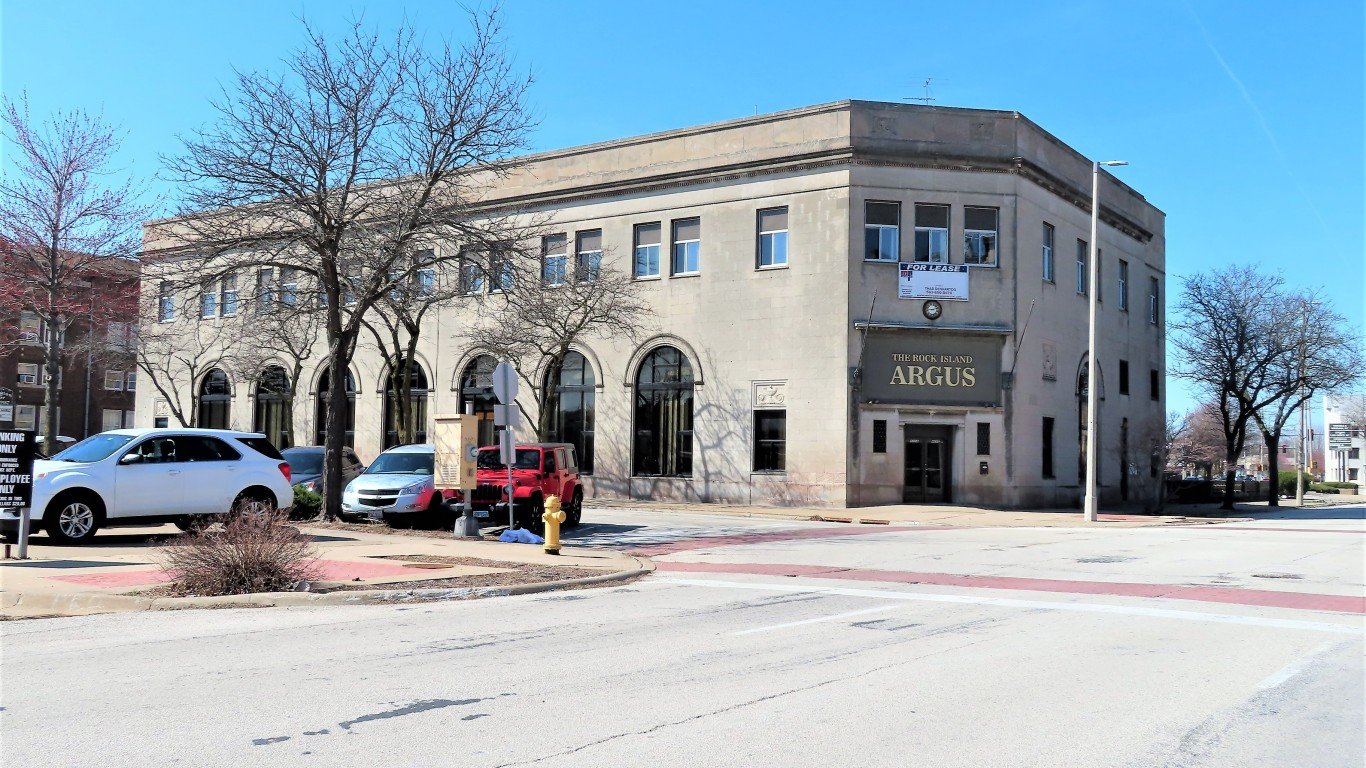
15. Davenport-Moline-Rock Island, IA-IL
> 1-yr. change in reported burglaries per 100K people: +73.8
> Burglaries reported in 2020: 1,866 — 47th highest of 200 metros
> Burglaries per 100K people in 2020: 493.9 — 32nd highest of 200 metros
> 1-yr. change in all property crime per 100K people: N/A
> Property crimes per 100K people in 2020: N/A
> Population: 378,923
[in-text-ad]
14. Billings, MT
> 1-yr. change in reported burglaries per 100K people: +75.3
> Burglaries reported in 2020: 868 — 99th highest of 200 metros (tied)
> Burglaries per 100K people in 2020: 472.5 — 39th highest of 200 metros
> 1-yr. change in all property crime per 100K people: +459.4 — 5th highest of 188 metros
> Property crimes per 100K people in 2020: 3,471.9 — 9th highest of 190 metros
> Population: 181,667
[recirclink id=1023032]

13. Eau Claire, WI
> 1-yr. change in reported burglaries per 100K people: +78.4
> Burglaries reported in 2020: 558 — 67th lowest of 200 metros
> Burglaries per 100K people in 2020: 328.2 — 98th highest of 200 metros
> 1-yr. change in all property crime per 100K people: +200.4 — 13th highest of 188 metros
> Property crimes per 100K people in 2020: 1,735.6 — 70th lowest of 190 metros
> Population: 169,304

12. Longview, WA
> 1-yr. change in reported burglaries per 100K people: +78.8
> Burglaries reported in 2020: 436 — 51st lowest of 200 metros
> Burglaries per 100K people in 2020: 392.1 — 66th highest of 200 metros
> 1-yr. change in all property crime per 100K people: +123.9 — 18th highest of 188 metros
> Property crimes per 100K people in 2020: 2,000.3 — 91st highest of 190 metros
> Population: 110,593
[in-text-ad-2]

11. Danville, IL
> 1-yr. change in reported burglaries per 100K people: +87.0
> Burglaries reported in 2020: 658 — 82nd lowest of 200 metros
> Burglaries per 100K people in 2020: 880.4 — 3rd highest of 200 metros
> 1-yr. change in all property crime per 100K people: N/A
> Property crimes per 100K people in 2020: N/A
> Population: 75,758

10. Dubuque, IA
> 1-yr. change in reported burglaries per 100K people: +87.6
> Burglaries reported in 2020: 267 — 24th lowest of 200 metros
> Burglaries per 100K people in 2020: 273.7 — 78th lowest of 200 metros
> 1-yr. change in all property crime per 100K people: +257.1 — 9th highest of 188 metros
> Property crimes per 100K people in 2020: 1,397.2 — 44th lowest of 190 metros
> Population: 97,311
[in-text-ad]

9. Napa, CA
> 1-yr. change in reported burglaries per 100K people: +97.4
> Burglaries reported in 2020: 522 — 64th lowest of 200 metros
> Burglaries per 100K people in 2020: 382.5 — 68th highest of 200 metros
> 1-yr. change in all property crime per 100K people: +129.5 — 16th highest of 188 metros
> Property crimes per 100K people in 2020: 1,689.7 — 66th lowest of 190 metros
> Population: 137,744
[recirclink id=1030620]

8. Boulder, CO
> 1-yr. change in reported burglaries per 100K people: +101.2
> Burglaries reported in 2020: 1,328 — 73rd highest of 200 metros
> Burglaries per 100K people in 2020: 405.2 — 57th highest of 200 metros
> 1-yr. change in all property crime per 100K people: +314.5 — 7th highest of 188 metros
> Property crimes per 100K people in 2020: 2,760.1 — 23rd highest of 190 metros
> Population: 326,196

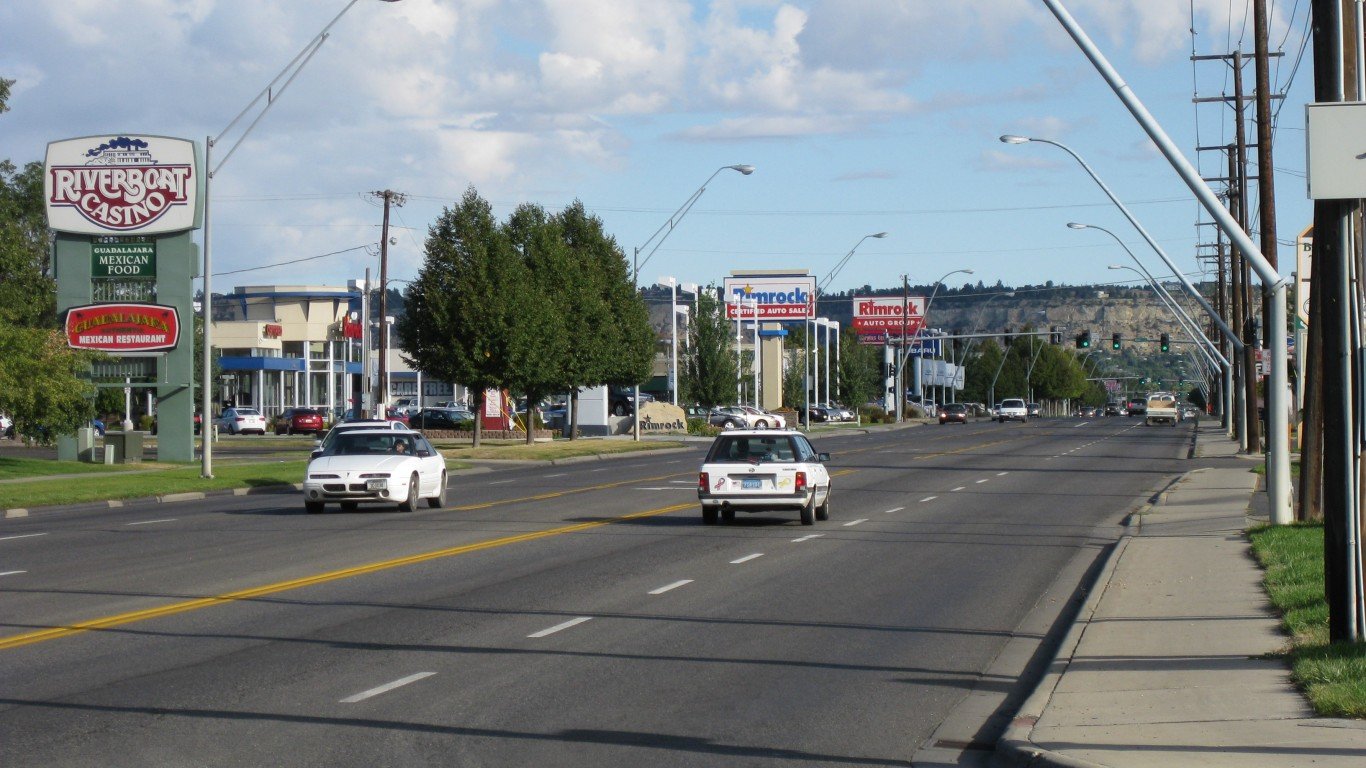
7. Yakima, WA
> 1-yr. change in reported burglaries per 100K people: +112.9
> Burglaries reported in 2020: 1,420 — 68th highest of 200 metros
> Burglaries per 100K people in 2020: 566.2 — 20th highest of 200 metros
> 1-yr. change in all property crime per 100K people: +126.3 — 17th highest of 188 metros
> Property crimes per 100K people in 2020: 2,725.4 — 25th highest of 190 metros
> Population: 250,873
[in-text-ad-2]

6. Grand Junction, CO
> 1-yr. change in reported burglaries per 100K people: +121.0
> Burglaries reported in 2020: 751 — 91st lowest of 200 metros
> Burglaries per 100K people in 2020: 487.3 — 35th highest of 200 metros
> 1-yr. change in all property crime per 100K people: +443.3 — 6th highest of 188 metros
> Property crimes per 100K people in 2020: 2,980.7 — 15th highest of 190 metros
> Population: 154,210

5. Kennewick-Richland, WA
> 1-yr. change in reported burglaries per 100K people: +121.0
> Burglaries reported in 2020: 1,323 — 74th highest of 200 metros
> Burglaries per 100K people in 2020: 435.3 — 49th highest of 200 metros
> 1-yr. change in all property crime per 100K people: +314.1 — 8th highest of 188 metros
> Property crimes per 100K people in 2020: 2,259.8 — 55th highest of 190 metros
> Population: 299,612
[in-text-ad]

4. Rapid City, SD
> 1-yr. change in reported burglaries per 100K people: +124.1
> Burglaries reported in 2020: 887 — 95th highest of 200 metros
> Burglaries per 100K people in 2020: 616.5 — 11th highest of 200 metros
> 1-yr. change in all property crime per 100K people: +568.2 — the highest of 188 metros
> Property crimes per 100K people in 2020: 2,971.1 — 16th highest of 190 metros
> Population: 142,191
[recirclink id=1020198]

3. Decatur, IL
> 1-yr. change in reported burglaries per 100K people: +156.6
> Burglaries reported in 2020: 677 — 83rd lowest of 200 metros
> Burglaries per 100K people in 2020: 658.9 — 9th highest of 200 metros
> 1-yr. change in all property crime per 100K people: N/A
> Property crimes per 100K people in 2020: N/A
> Population: 104,009
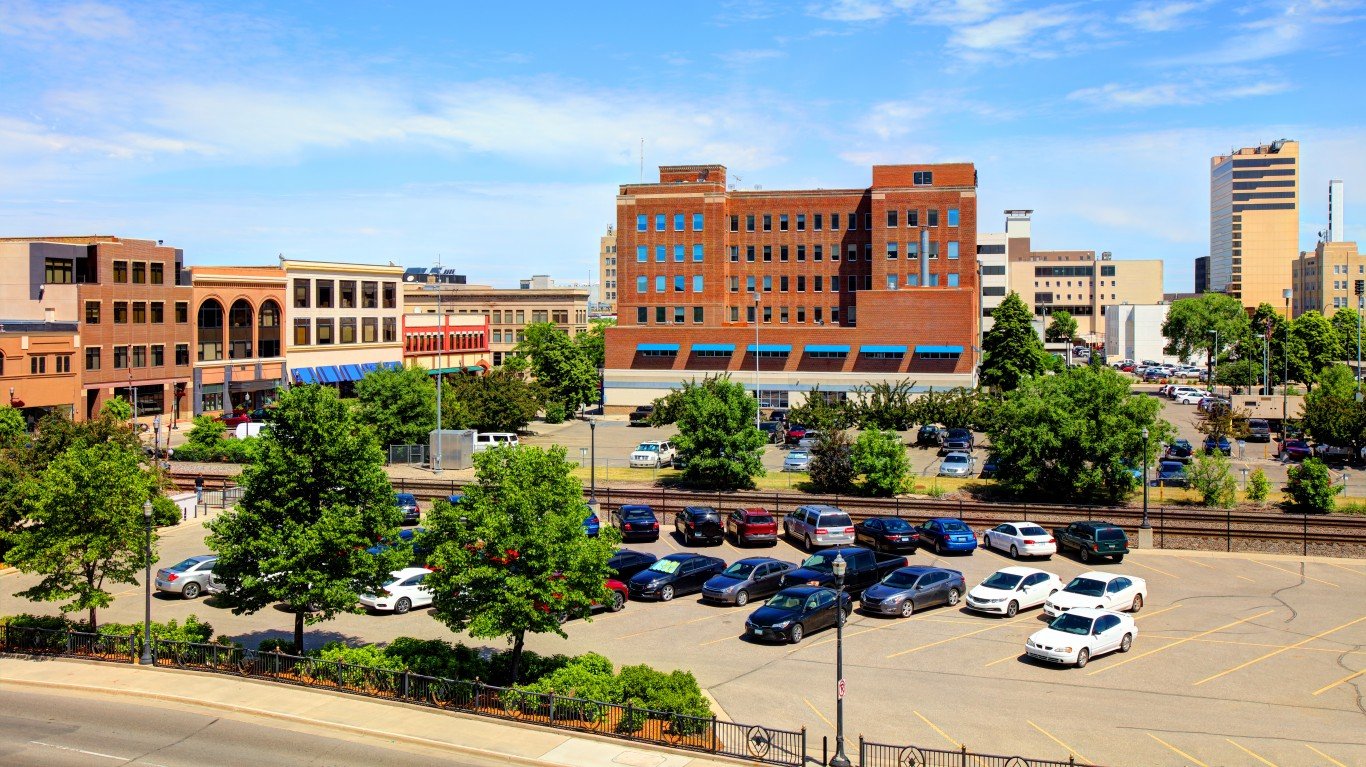
2. Fargo, ND-MN
> 1-yr. change in reported burglaries per 100K people: +178.8
> Burglaries reported in 2020: 1,611 — 57th highest of 200 metros
> Burglaries per 100K people in 2020: 648.6 — 10th highest of 200 metros
> 1-yr. change in all property crime per 100K people: +490.7 — 4th highest of 188 metros
> Property crimes per 100K people in 2020: 2,829.3 — 22nd highest of 190 metros
> Population: 246,145
[in-text-ad-2]
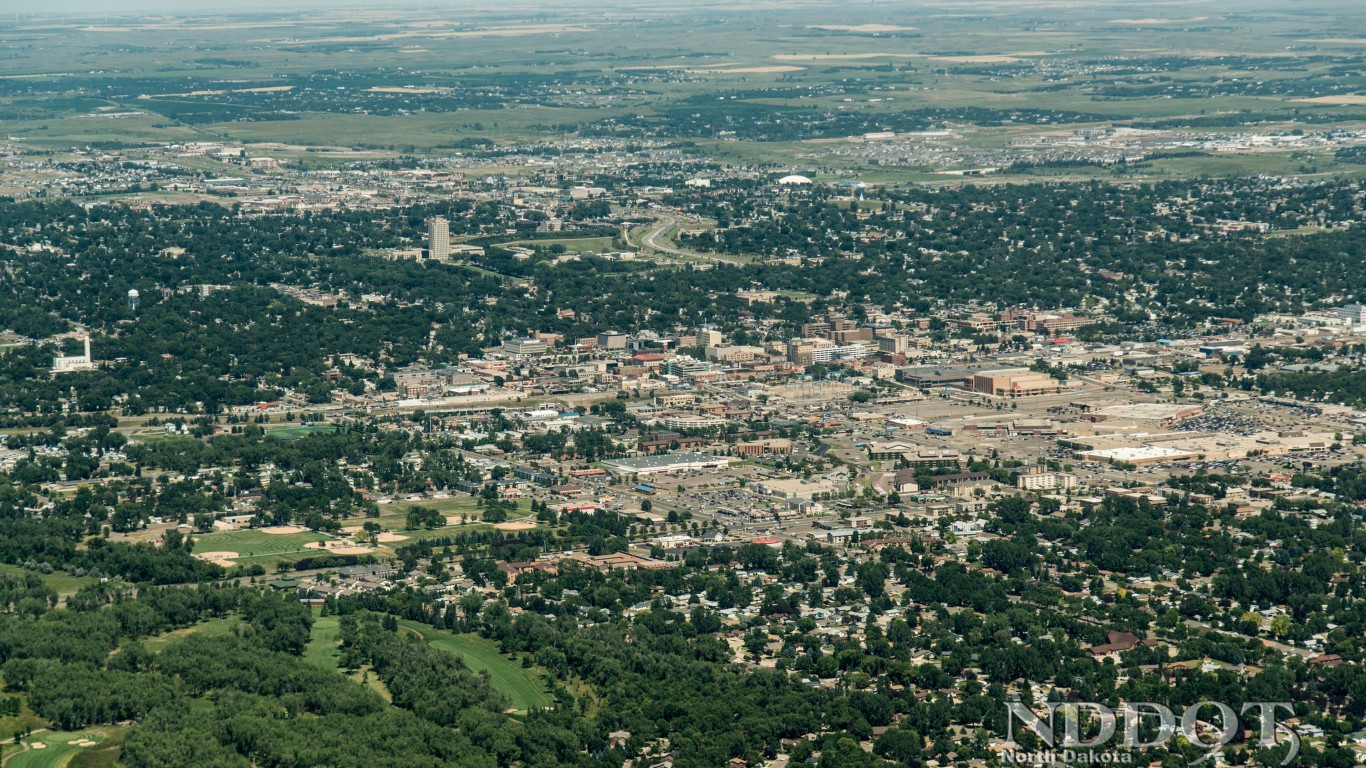
1. Bismarck, ND
> 1-yr. change in reported burglaries per 100K people: +206.6
> Burglaries reported in 2020: 610 — 75th lowest of 200 metros
> Burglaries per 100K people in 2020: 470.4 — 41st highest of 200 metros
> 1-yr. change in all property crime per 100K people: +532.4 — 2nd highest of 188 metros
> Property crimes per 100K people in 2020: 2,847.1 — 21st highest of 190 metros
> Population: 129,115
Methodology
To determine the metro areas where the burglary rate is rising, 24/7 Wall St. reviewed the change in burglaries per 100,000 people from the FBI’s 2019 and 2020 Uniform Crime Reports.
Limited data was available in the 2020 UCR for areas in Alabama, Maryland, Pennsylvania, and Illinois, though metro areas in these states were not excluded from analysis. Only metro areas for which the boundaries defined by the FBI match the boundaries as defined by the U.S. Census Bureau were considered. Because some state and local agencies changed reporting practices between 2019 and 2020, the figures are not comparable, and the areas were excluded.
Population figures are one-year estimates from the U.S. Census Bureau’s 2019 American Community Survey. However, these estimates were not used to calculate crime rates. Crime rates per 100,000 people were calculated using population figures provided by the FBI in the 2020 and 2019 UCR.
Contact [email protected] for any questions or corrections.