Gun violence has become a regular part of the news headlines this year. Murders in American cities spiked in 2021, particularly in large cities. So far this year, the trend has continued. The Wall Street Journal recently reported on a surge in gun violence in Seattle, which is generally considered a relatively safe city. (These are the metros where murder rate is soaring.)
According to the Gun Violence Archive, there already have been 9,558 gun deaths in America so far in 2022. Even with stricter gun ownership and purchasing laws, the difficult fact is that about 400 million guns are currently owned by private citizens, the police, and the military. The chance that civilians who own guns will turn them into the government, no matter what the incentive, is small. (Violent crime in general has been rising. These are the states where crime is soaring.)
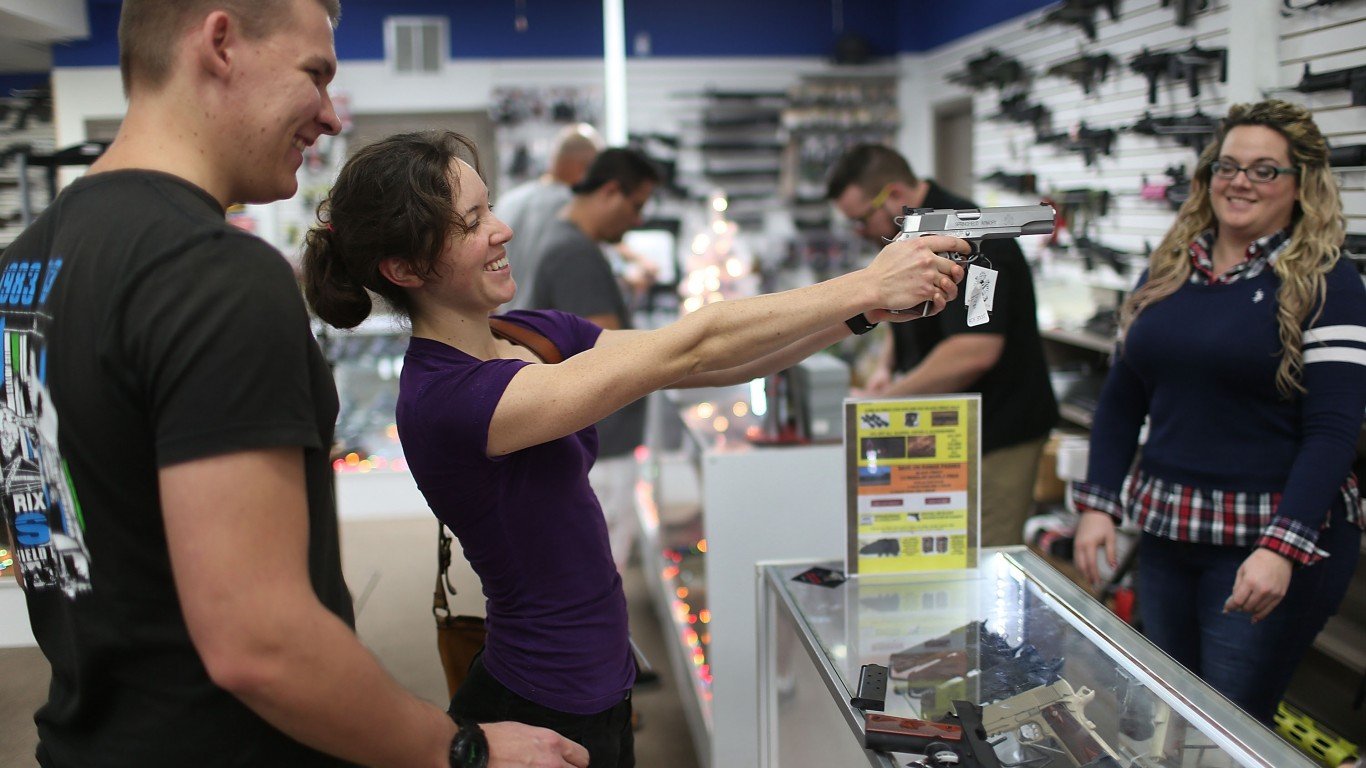
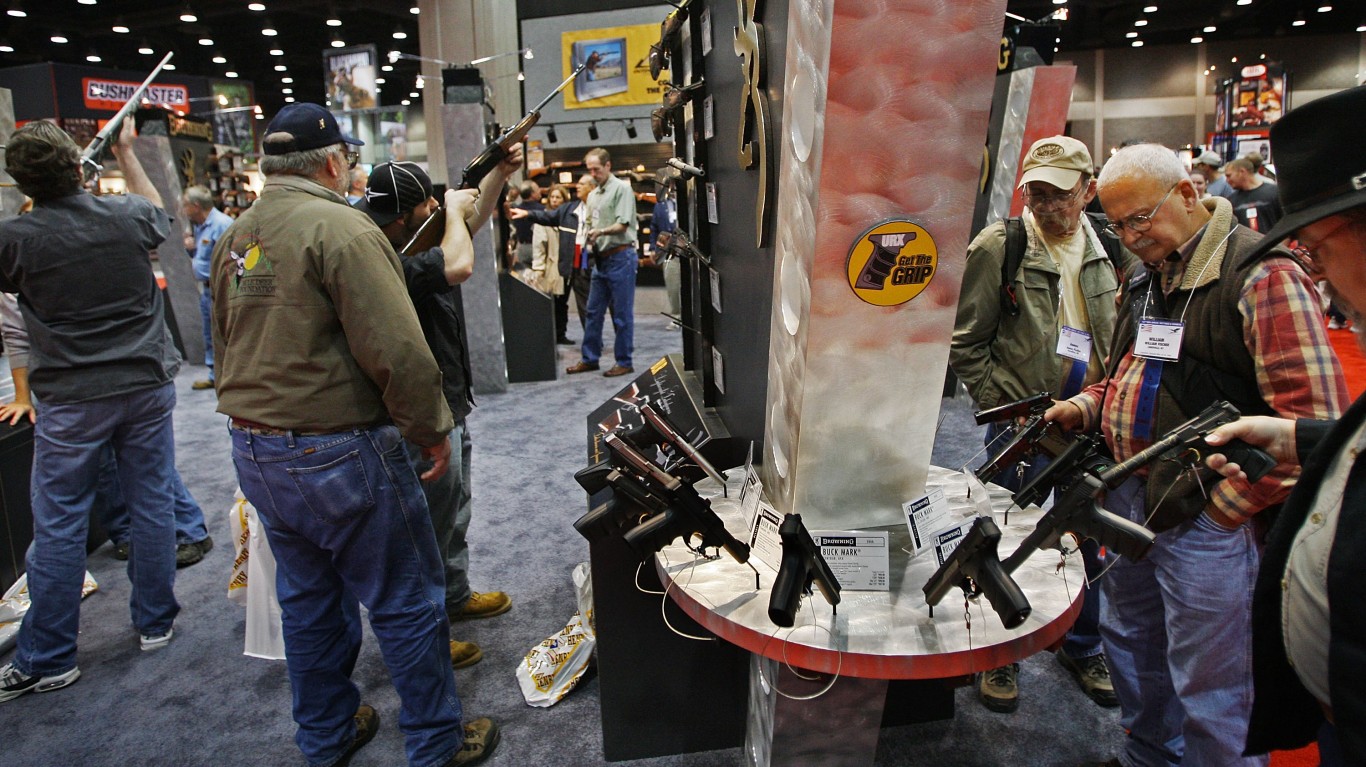
Gun sales, meanwhile, have been increasing in recent years. There are several theories explaining the sharp rise in gun sales, particularly in 2020. Among them is the violence in American cities during protests. Another theory is that the pandemic, perhaps irrationally, has increased concerns about protecting one’s property. The 2022 background checks figures show that some of these trends may have started to taper off.
The trend in gun sales began to change already in 2021 compared to most other years in the past decade, though gun sales still remained at elevated levels compared to previous years. Gun sales, using the FBI’s firearms background checks as a proxy, reached 38,876,673 in 2021. This was down slightly from the record set in 2020 of 39,695,315.
Inexplicably, gun sales collapsed in the first two months of this year, compared to the same period in 2021. So far, the FBI’s National Instant Criminal Background Check System reported 5,146,500 background checks, compared to 7,760,581 in January and February of 2021. That means the 2022 number was only 66% of the number for 2021.
Total gun sales remained high in some states. They were particularly large in Illinois, with 782,222 background checks during January and February.
To find out by how much gun sales plunged in each state so far this year, 24/7 Wall St. reviewed background checks data from Jan. 1, 2022, to Feb. 28, 2022, from the FBI’s NICS Firearm Checks. States were ranked by the change in gun sales in the first two months of 2022 compared to the same period in 2021. We used background checks as a proxy for gun sales. Population data came from the U.S. Census Bureau.
Here are the gun sales figures for the first two months of 2022 for all 50 states

50. Hawaii
> Jan-Feb 2022 gun sales, compared to 2021: -10.7%
> Jan-Feb gun sales: 2,690 (the least)
> Jan-Feb gun sales per capita: 1.9 per 1,000 residents (the least)
> Total population: 1.4 million (11th smallest)
[in-text-ad]

49. Kentucky
> 1-year change in YTD gun sales: -11.0%
> Jan-Feb gun sales: 712,367 (2nd most)
> Jan-Feb gun sales per capita: 158.0 per 1,000 residents (the most)
> Total population: 4.5 million (25th smallest)
[recirclink id=1038777]

48. Tennessee
> 1-year change in YTD gun sales: -11.6%
> Jan-Feb gun sales: 138,446 (9th most)
> Jan-Feb gun sales per capita: 19.8 per 1,000 residents (7th most)
> Total population: 7.0 million (16th largest)

47. Louisiana
> 1-year change in YTD gun sales: -12.4%
> Jan-Feb gun sales: 58,604 (25th most)
> Jan-Feb gun sales per capita: 12.7 per 1,000 residents (24th least)
> Total population: 4.6 million (25th largest)
[in-text-ad-2]

46. Connecticut
> 1-year change in YTD gun sales: -13.7%
> Jan-Feb gun sales: 39,127 (22nd least)
> Jan-Feb gun sales per capita: 10.9 per 1,000 residents (20th least)
> Total population: 3.6 million (22nd smallest)

45. Wisconsin
> 1-year change in YTD gun sales: -15.6%
> Jan-Feb gun sales: 106,469 (15th most)
> Jan-Feb gun sales per capita: 18.1 per 1,000 residents (11th most)
> Total population: 5.9 million (20th largest)
[in-text-ad]

44. Mississippi
> 1-year change in YTD gun sales: -16.6%
> Jan-Feb gun sales: 45,915 (24th least)
> Jan-Feb gun sales per capita: 15.6 per 1,000 residents (13th most)
> Total population: 2.9 million (17th smallest)
[recirclink id=1065324]

43. California
> 1-year change in YTD gun sales: -17.2%
> Jan-Feb gun sales: 210,577 (6th most)
> Jan-Feb gun sales per capita: 5.4 per 1,000 residents (6th least)
> Total population: 39.2 million (the largest)

42. Utah
> 1-year change in YTD gun sales: -17.3%
> Jan-Feb gun sales: 158,066 (8th most)
> Jan-Feb gun sales per capita: 47.4 per 1,000 residents (3rd most)
> Total population: 3.3 million (21st smallest)
[in-text-ad-2]

41. Minnesota
> 1-year change in YTD gun sales: -17.3%
> Jan-Feb gun sales: 135,238 (10th most)
> Jan-Feb gun sales per capita: 23.7 per 1,000 residents (6th most)
> Total population: 5.7 million (22nd largest)

40. Washington
> 1-year change in YTD gun sales: -19.3%
> Jan-Feb gun sales: 108,721 (13th most)
> Jan-Feb gun sales per capita: 14.0 per 1,000 residents (22nd most)
> Total population: 7.7 million (13th largest)
[in-text-ad]
39. Texas
> 1-year change in YTD gun sales: -22.7%
> Jan-Feb gun sales: 267,878 (3rd most)
> Jan-Feb gun sales per capita: 9.1 per 1,000 residents (11th least)
> Total population: 29.5 million (2nd largest)
[recirclink id=1016354]

38. Delaware
> 1-year change in YTD gun sales: -23.5%
> Jan-Feb gun sales: 9,684 (4th least)
> Jan-Feb gun sales per capita: 9.7 per 1,000 residents (13th least)
> Total population: 1.0 million (6th smallest)

37. New Mexico
> 1-year change in YTD gun sales: -23.9%
> Jan-Feb gun sales: 26,845 (15th least)
> Jan-Feb gun sales per capita: 12.7 per 1,000 residents (25th least)
> Total population: 2.1 million (15th smallest)
[in-text-ad-2]

36. Arkansas
> 1-year change in YTD gun sales: -25.5%
> Jan-Feb gun sales: 36,489 (21st least)
> Jan-Feb gun sales per capita: 12.1 per 1,000 residents (22nd least)
> Total population: 3.0 million (18th smallest)

35. Oklahoma
> 1-year change in YTD gun sales: -26.3%
> Jan-Feb gun sales: 56,928 (25th least)
> Jan-Feb gun sales per capita: 14.3 per 1,000 residents (20th most)
> Total population: 4.0 million (23rd smallest)
[in-text-ad]

34. Oregon
> 1-year change in YTD gun sales: -26.6%
> Jan-Feb gun sales: 62,150 (24th most)
> Jan-Feb gun sales per capita: 14.6 per 1,000 residents (17th most)
> Total population: 4.2 million (24th smallest)
[recirclink id=1052433]

33. Alabama
> 1-year change in YTD gun sales: -26.9%
> Jan-Feb gun sales: 131,862 (11th most)
> Jan-Feb gun sales per capita: 26.2 per 1,000 residents (5th most)
> Total population: 5.0 million (24th largest)

32. South Carolina
> 1-year change in YTD gun sales: -27.0%
> Jan-Feb gun sales: 67,657 (22nd most)
> Jan-Feb gun sales per capita: 13.0 per 1,000 residents (25th most)
> Total population: 5.2 million (23rd largest)
[in-text-ad-2]

31. New York
> 1-year change in YTD gun sales: -27.1%
> Jan-Feb gun sales: 62,162 (23rd most)
> Jan-Feb gun sales per capita: 3.1 per 1,000 residents (3rd least)
> Total population: 19.8 million (4th largest)

30. Idaho
> 1-year change in YTD gun sales: -27.2%
> Jan-Feb gun sales: 35,993 (19th least)
> Jan-Feb gun sales per capita: 18.9 per 1,000 residents (8th most)
> Total population: 1.9 million (13th smallest)
[in-text-ad]

29. Colorado
> 1-year change in YTD gun sales: -27.6%
> Jan-Feb gun sales: 83,591 (19th most)
> Jan-Feb gun sales per capita: 14.4 per 1,000 residents (18th most)
> Total population: 5.8 million (21st largest)
[recirclink id=1058013]

28. Pennsylvania
> 1-year change in YTD gun sales: -27.8%
> Jan-Feb gun sales: 198,355 (7th most)
> Jan-Feb gun sales per capita: 15.3 per 1,000 residents (15th most)
> Total population: 13.0 million (5th largest)

27. North Dakota
> 1-year change in YTD gun sales: -27.8%
> Jan-Feb gun sales: 10,622 (6th least)
> Jan-Feb gun sales per capita: 13.7 per 1,000 residents (23rd most)
> Total population: 774,948 (4th smallest)
[in-text-ad-2]

26. Virginia
> 1-year change in YTD gun sales: -28.2%
> Jan-Feb gun sales: 90,239 (18th most)
> Jan-Feb gun sales per capita: 10.4 per 1,000 residents (16th least)
> Total population: 8.6 million (12th largest)

25. Kansas
> 1-year change in YTD gun sales: -28.3%
> Jan-Feb gun sales: 31,367 (17th least)
> Jan-Feb gun sales per capita: 10.7 per 1,000 residents (18th least)
> Total population: 2.9 million (16th smallest)
[in-text-ad]

24. Nevada
> 1-year change in YTD gun sales: -28.3%
> Jan-Feb gun sales: 25,001 (13th least)
> Jan-Feb gun sales per capita: 8.0 per 1,000 residents (9th least)
> Total population: 3.1 million (19th smallest)
[recirclink id=1038777]

23. Florida
> 1-year change in YTD gun sales: -28.9%
> Jan-Feb gun sales: 234,405 (4th most)
> Jan-Feb gun sales per capita: 10.8 per 1,000 residents (19th least)
> Total population: 21.8 million (3rd largest)

22. Iowa
> 1-year change in YTD gun sales: -29.3%
> Jan-Feb gun sales: 45,842 (23rd least)
> Jan-Feb gun sales per capita: 14.4 per 1,000 residents (19th most)
> Total population: 3.2 million (20th smallest)
[in-text-ad-2]

21. Vermont
> 1-year change in YTD gun sales: -30.2%
> Jan-Feb gun sales: 6,900 (3rd least)
> Jan-Feb gun sales per capita: 10.7 per 1,000 residents (17th least)
> Total population: 645,570 (2nd smallest)

20. Alaska
> 1-year change in YTD gun sales: -30.5%
> Jan-Feb gun sales: 10,902 (7th least)
> Jan-Feb gun sales per capita: 14.9 per 1,000 residents (16th most)
> Total population: 732,673 (3rd smallest)
[in-text-ad]

19. Maine
> 1-year change in YTD gun sales: -30.9%
> Jan-Feb gun sales: 15,668 (10th least)
> Jan-Feb gun sales per capita: 11.4 per 1,000 residents (21st least)
> Total population: 1.4 million (9th smallest)
[recirclink id=1065324]

18. Arizona
> 1-year change in YTD gun sales: -31.2%
> Jan-Feb gun sales: 73,004 (21st most)
> Jan-Feb gun sales per capita: 10.0 per 1,000 residents (14th least)
> Total population: 7.3 million (14th largest)

17. Nebraska
> 1-year change in YTD gun sales: -31.4%
> Jan-Feb gun sales: 12,601 (8th least)
> Jan-Feb gun sales per capita: 6.4 per 1,000 residents (8th least)
> Total population: 2.0 million (14th smallest)
[in-text-ad-2]

16. Missouri
> 1-year change in YTD gun sales: -31.4%
> Jan-Feb gun sales: 82,865 (20th most)
> Jan-Feb gun sales per capita: 13.4 per 1,000 residents (24th most)
> Total population: 6.2 million (18th largest)

15. North Carolina
> 1-year change in YTD gun sales: -31.9%
> Jan-Feb gun sales: 107,866 (14th most)
> Jan-Feb gun sales per capita: 10.2 per 1,000 residents (15th least)
> Total population: 10.6 million (9th largest)
[in-text-ad]

14. Wyoming
> 1-year change in YTD gun sales: -32.3%
> Jan-Feb gun sales: 10,592 (5th least)
> Jan-Feb gun sales per capita: 18.3 per 1,000 residents (9th most)
> Total population: 578,803 (the smallest)
[recirclink id=1016354]

13. West Virginia
> 1-year change in YTD gun sales: -33.2%
> Jan-Feb gun sales: 29,768 (16th least)
> Jan-Feb gun sales per capita: 16.7 per 1,000 residents (12th most)
> Total population: 1.8 million (12th smallest)
12. Montana
> 1-year change in YTD gun sales: -33.5%
> Jan-Feb gun sales: 19,976 (12th least)
> Jan-Feb gun sales per capita: 18.1 per 1,000 residents (10th most)
> Total population: 1.1 million (8th smallest)
[in-text-ad-2]

11. Massachusetts
> 1-year change in YTD gun sales: -33.5%
> Jan-Feb gun sales: 35,433 (18th least)
> Jan-Feb gun sales per capita: 5.1 per 1,000 residents (5th least)
> Total population: 7.0 million (15th largest)

10. Maryland
> 1-year change in YTD gun sales: -34.1%
> Jan-Feb gun sales: 36,211 (20th least)
> Jan-Feb gun sales per capita: 5.9 per 1,000 residents (7th least)
> Total population: 6.2 million (19th largest)
[in-text-ad]

9. South Dakota
> 1-year change in YTD gun sales: -36.4%
> Jan-Feb gun sales: 13,858 (9th least)
> Jan-Feb gun sales per capita: 15.5 per 1,000 residents (14th most)
> Total population: 895,376 (5th smallest)
[recirclink id=1052433]

8. Ohio
> 1-year change in YTD gun sales: -36.7%
> Jan-Feb gun sales: 105,585 (16th most)
> Jan-Feb gun sales per capita: 9.0 per 1,000 residents (10th least)
> Total population: 11.8 million (7th largest)

7. Michigan
> 1-year change in YTD gun sales: -37.8%
> Jan-Feb gun sales: 125,187 (12th most)
> Jan-Feb gun sales per capita: 12.5 per 1,000 residents (23rd least)
> Total population: 10.1 million (10th largest)
[in-text-ad-2]

6. New Hampshire
> 1-year change in YTD gun sales: -38.2%
> Jan-Feb gun sales: 19,682 (11th least)
> Jan-Feb gun sales per capita: 14.2 per 1,000 residents (21st most)
> Total population: 1.4 million (10th smallest)

5. Georgia
> 1-year change in YTD gun sales: -38.4%
> Jan-Feb gun sales: 102,272 (17th most)
> Jan-Feb gun sales per capita: 9.5 per 1,000 residents (12th least)
> Total population: 10.8 million (8th largest)
[in-text-ad]

4. New Jersey
> 1-year change in YTD gun sales: -46.9%
> Jan-Feb gun sales: 25,758 (14th least)
> Jan-Feb gun sales per capita: 2.8 per 1,000 residents (2nd least)
> Total population: 9.3 million (11th largest)
[recirclink id=1058013]

3. Rhode Island
> 1-year change in YTD gun sales: -50.2%
> Jan-Feb gun sales: 4,572 (2nd least)
> Jan-Feb gun sales per capita: 4.2 per 1,000 residents (4th least)
> Total population: 1.1 million (7th smallest)

2. Indiana
> 1-year change in YTD gun sales: -52.4%
> Jan-Feb gun sales: 218,109 (5th most)
> Jan-Feb gun sales per capita: 32.0 per 1,000 residents (4th most)
> Total population: 6.8 million (17th largest)
[in-text-ad-2]

1. Illinois
> 1-year change in YTD gun sales: -58.9%
> Jan-Feb gun sales: 782,222 (the most)
> Jan-Feb gun sales per capita: 61.7 per 1,000 residents (2nd most)
> Total population: 12.7 million (6th largest)
Contact [email protected] for any questions or corrections.