Last November, Oregon’s voters passed measure 114, which banned the use of firearm magazines of more than 10 bullets among other regulations that would add safeguards to who can buy and operate a gun in the state. The measure has since been challenged by gun rights activists, and a circuit court judge placed a stay on the measure. The measure will remain blocked until the resolution of a state court trial, which is slated to resume in September.
In addition to cutting down the maximum size of gun clips, the measure has additional requirements on background checks. For example, it would close a loophole that allows people to buy a gun before a background check is completed if the check takes longer than three days to process.
Halfway through 2023, just under 16 million firearm background checks were conducted in the United States, according to data compiled by the FBI. That figure is more or less in line with the same period in 2022. Firearm background checks are often used to approximate the level of gun sales in the United States. (These are America’s most popular .22 handgun companies.)
There are, however, many reasons to initiate a background check, some of which clearly not tied to gun sales, including pawn shop transactions and rentals. After controlling for some of these non-purchase causes, the adjusted figure is more likely tied to the purchase of a firearm, and in the first half of the year, there were 9.9 million adjusted background checks, or 29.7 checks per 1,000 Americans. (These are America’s largest gun makers.)
To find the states where the most people bought guns so far this year, 24/7 Wall St. used data from the FBI’s National Instant Criminal Background Check System. States are ranked based on the number of gun checks per 1,000 people in the first six months of 2023, adjusted by removing several categories of checks, including pawn shop transactions, returns, rentals, and rechecks (which are conducted periodically by some states on existing permit holders).
It may be that the looming legislation inspired a rush to buy guns in the state before greater restrictions are actually set in place because no state bought more guns per capita so far this year than Oregon. From January through June, an estimated 351,000 background checks that are likely tied directly to the sale of a gun were conducted in Oregon, equal to 66.5 per 1,000 state residents. That figure is a 43% increase compared to the same period in 2022.
Click here to see the states where the most people have bought guns so far this year.
Click here to read our detailed methodology.

50. Hawaii
> Firearm background checks per 1,000 residents, Jan-June 2023: 8.2
> Firearm background checks, Jan-June 2023: 11,863 — the fewest
> Most common type of firearm check: No data available
> Firearm background checks per 1,000 residents, Jan-June 2022: 6.3 — the fewest
> Firearm background checks, Jan-June 2022: 9,095 — the fewest
> Change in background checks, Jan-June 2022 – Jan-June 2023: +2,768 (+30.4% — 3rd largest increase)
> 2022 Population: 1.4 million — 11th smallest
[in-text-ad]

49. New York
> Firearm background checks per 1,000 residents, Jan-June 2023: 9.0
> Firearm background checks, Jan-June 2023: 176,289 — 22nd most
> Most common type of firearm check: Long guns
> Firearm background checks per 1,000 residents, Jan-June 2022: 10.4 — 3rd fewest
> Firearm background checks, Jan-June 2022: 204,287 — 20th most
> Change in background checks, Jan-June 2022 – Jan-June 2023: -27,998 (-13.7% — 6th largest decrease)
> 2022 Population: 19.7 million — 4th largest
[recirclink id=1254010]

48. New Jersey
> Firearm background checks per 1,000 residents, Jan-June 2023: 9.2
> Firearm background checks, Jan-June 2023: 85,138 — 17th fewest
> Most common type of firearm check: Handguns
> Firearm background checks per 1,000 residents, Jan-June 2022: 8.8 — 2nd fewest
> Firearm background checks, Jan-June 2022: 81,184 — 15th fewest
> Change in background checks, Jan-June 2022 – Jan-June 2023: +3,954 (+4.9% — 6th smallest increase)
> 2022 Population: 9.3 million — 11th largest

47. Rhode Island
> Firearm background checks per 1,000 residents, Jan-June 2023: 11.6
> Firearm background checks, Jan-June 2023: 12,708 — 2nd fewest
> Most common type of firearm check: Handguns
> Firearm background checks per 1,000 residents, Jan-June 2022: 13.7 — 4th fewest
> Firearm background checks, Jan-June 2022: 14,958 — 2nd fewest
> Change in background checks, Jan-June 2022 – Jan-June 2023: -2,250 (-15.0% — 5th largest decrease)
> 2022 Population: 1.1 million — 7th smallest
[in-text-ad-2]

46. California
> Firearm background checks per 1,000 residents, Jan-June 2023: 15.4
> Firearm background checks, Jan-June 2023: 599,402 — 3rd most
> Most common type of firearm check: Handguns
> Firearm background checks per 1,000 residents, Jan-June 2022: 15.4 — 5th fewest
> Firearm background checks, Jan-June 2022: 599,381 — 4th most
> Change in background checks, Jan-June 2022 – Jan-June 2023: effectively unchanged
> 2022 Population: 39.0 million — the largest

45. Massachusetts
> Firearm background checks per 1,000 residents, Jan-June 2023: 16.3
> Firearm background checks, Jan-June 2023: 113,843 — 22nd fewest
> Most common type of firearm check: Handguns
> Firearm background checks per 1,000 residents, Jan-June 2022: 16.2 — 6th fewest
> Firearm background checks, Jan-June 2022: 113,285 — 21st fewest
> Change in background checks, Jan-June 2022 – Jan-June 2023: +558 (+0.5% — the smallest increase)
> 2022 Population: 7.0 million — 16th largest
[in-text-ad]

44. Nebraska
> Firearm background checks per 1,000 residents, Jan-June 2023: 20.2
> Firearm background checks, Jan-June 2023: 39,670 — 9th fewest
> Most common type of firearm check: Long guns
> Firearm background checks per 1,000 residents, Jan-June 2022: 19.1 — 8th fewest
> Firearm background checks, Jan-June 2022: 37,536 — 7th fewest
> Change in background checks, Jan-June 2022 – Jan-June 2023: +2,134 (+5.7% — 7th largest increase)
> 2022 Population: 2.0 million — 14th smallest
[recirclink id=1259310]

43. Iowa
> Firearm background checks per 1,000 residents, Jan-June 2023: 20.6
> Firearm background checks, Jan-June 2023: 66,053 — 13th fewest
> Most common type of firearm check: Handguns
> Firearm background checks per 1,000 residents, Jan-June 2022: 20.1 — 9th fewest
> Firearm background checks, Jan-June 2022: 64,216 — 11th fewest
> Change in background checks, Jan-June 2022 – Jan-June 2023: +1,837 (+2.9% — 5th smallest increase)
> 2022 Population: 3.2 million — 20th smallest

42. Nevada
> Firearm background checks per 1,000 residents, Jan-June 2023: 21.9
> Firearm background checks, Jan-June 2023: 69,652 — 14th fewest
> Most common type of firearm check: Handguns
> Firearm background checks per 1,000 residents, Jan-June 2022: 24.8 — 10th fewest
> Firearm background checks, Jan-June 2022: 78,891 — 14th fewest
> Change in background checks, Jan-June 2022 – Jan-June 2023: -9,239 (-11.7% — 8th largest decrease)
> 2022 Population: 3.2 million — 19th smallest
[in-text-ad-2]

41. Georgia
> Firearm background checks per 1,000 residents, Jan-June 2023: 24.2
> Firearm background checks, Jan-June 2023: 263,684 — 15th most
> Most common type of firearm check: Handguns
> Firearm background checks per 1,000 residents, Jan-June 2022: 26.2 — 11th fewest
> Firearm background checks, Jan-June 2022: 285,735 — 13th most
> Change in background checks, Jan-June 2022 – Jan-June 2023: -22,051 (-7.7% — 16th largest decrease)
> 2022 Population: 10.9 million — 8th largest

40. Texas
> Firearm background checks per 1,000 residents, Jan-June 2023: 24.5
> Firearm background checks, Jan-June 2023: 735,624 — the most
> Most common type of firearm check: Handguns
> Firearm background checks per 1,000 residents, Jan-June 2022: 26.5 — 12th fewest
> Firearm background checks, Jan-June 2022: 795,128 — the most
> Change in background checks, Jan-June 2022 – Jan-June 2023: -59,504 (-7.5% — 17th smallest decrease)
> 2022 Population: 30.0 million — 2nd largest
[in-text-ad]

39. Delaware
> Firearm background checks per 1,000 residents, Jan-June 2023: 25.5
> Firearm background checks, Jan-June 2023: 26,008 — 4th fewest
> Most common type of firearm check: Handguns
> Firearm background checks per 1,000 residents, Jan-June 2022: 33.3 — 21st fewest
> Firearm background checks, Jan-June 2022: 33,927 — 5th fewest
> Change in background checks, Jan-June 2022 – Jan-June 2023: -7,919 (-23.3% — the largest decrease)
> 2022 Population: 1.0 million — 6th smallest
[recirclink id=1215627]

38. Ohio
> Firearm background checks per 1,000 residents, Jan-June 2023: 25.6
> Firearm background checks, Jan-June 2023: 301,140 — 10th most
> Most common type of firearm check: Handguns
> Firearm background checks per 1,000 residents, Jan-June 2022: 27.6 — 14th fewest
> Firearm background checks, Jan-June 2022: 324,186 — 10th most
> Change in background checks, Jan-June 2022 – Jan-June 2023: -23,046 (-7.1% — 15th smallest decrease)
> 2022 Population: 11.8 million — 7th largest

37. Kentucky
> Firearm background checks per 1,000 residents, Jan-June 2023: 27.8
> Firearm background checks, Jan-June 2023: 125,242 — 24th fewest
> Most common type of firearm check: Handguns
> Firearm background checks per 1,000 residents, Jan-June 2022: 30.0 — 15th fewest
> Firearm background checks, Jan-June 2022: 135,415 — 25th fewest
> Change in background checks, Jan-June 2022 – Jan-June 2023: -10,173 (-7.5% — 18th largest decrease)
> 2022 Population: 4.5 million — 25th smallest
[in-text-ad-2]

36. Louisiana
> Firearm background checks per 1,000 residents, Jan-June 2023: 28.5
> Firearm background checks, Jan-June 2023: 130,944 — 25th fewest
> Most common type of firearm check: Handguns
> Firearm background checks per 1,000 residents, Jan-June 2022: 34.7 — 24th fewest
> Firearm background checks, Jan-June 2022: 159,063 — 24th most
> Change in background checks, Jan-June 2022 – Jan-June 2023: -28,119 (-17.7% — 3rd largest decrease)
> 2022 Population: 4.6 million — 25th largest

35. Kansas
> Firearm background checks per 1,000 residents, Jan-June 2023: 28.8
> Firearm background checks, Jan-June 2023: 84,705 — 16th fewest
> Most common type of firearm check: Handguns
> Firearm background checks per 1,000 residents, Jan-June 2022: 30.6 — 17th fewest
> Firearm background checks, Jan-June 2022: 89,826 — 18th fewest
> Change in background checks, Jan-June 2022 – Jan-June 2023: -5,121 (-5.7% — 12th smallest decrease)
> 2022 Population: 2.9 million — 16th smallest
[in-text-ad]

34. Maryland
> Firearm background checks per 1,000 residents, Jan-June 2023: 29.7
> Firearm background checks, Jan-June 2023: 182,870 — 21st most
> Most common type of firearm check: Handguns
> Firearm background checks per 1,000 residents, Jan-June 2022: 18.2 — 7th fewest
> Firearm background checks, Jan-June 2022: 112,190 — 20th fewest
> Change in background checks, Jan-June 2022 – Jan-June 2023: +70,680 (+63.0% — the largest increase)
> 2022 Population: 6.2 million — 19th largest
[recirclink id=1265908]

33. Florida
> Firearm background checks per 1,000 residents, Jan-June 2023: 29.9
> Firearm background checks, Jan-June 2023: 664,572 — 2nd most
> Most common type of firearm check: Handguns
> Firearm background checks per 1,000 residents, Jan-June 2022: 32.0 — 19th fewest
> Firearm background checks, Jan-June 2022: 712,562 — 2nd most
> Change in background checks, Jan-June 2022 – Jan-June 2023: -47,990 (-6.7% — 14th smallest decrease)
> 2022 Population: 22.2 million — 3rd largest

32. Virginia
> Firearm background checks per 1,000 residents, Jan-June 2023: 30.2
> Firearm background checks, Jan-June 2023: 262,266 — 16th most
> Most common type of firearm check: Handguns
> Firearm background checks per 1,000 residents, Jan-June 2022: 31.6 — 18th fewest
> Firearm background checks, Jan-June 2022: 274,801 — 14th most
> Change in background checks, Jan-June 2022 – Jan-June 2023: -12,535 (-4.6% — 6th smallest decrease)
> 2022 Population: 8.7 million — 12th largest
[in-text-ad-2]

31. Connecticut
> Firearm background checks per 1,000 residents, Jan-June 2023: 30.8
> Firearm background checks, Jan-June 2023: 111,521 — 21st fewest
> Most common type of firearm check: Handguns
> Firearm background checks per 1,000 residents, Jan-June 2022: 33.8 — 22nd fewest
> Firearm background checks, Jan-June 2022: 122,509 — 24th fewest
> Change in background checks, Jan-June 2022 – Jan-June 2023: -10,988 (-9.0% — 12th largest decrease)
> 2022 Population: 3.6 million — 22nd smallest
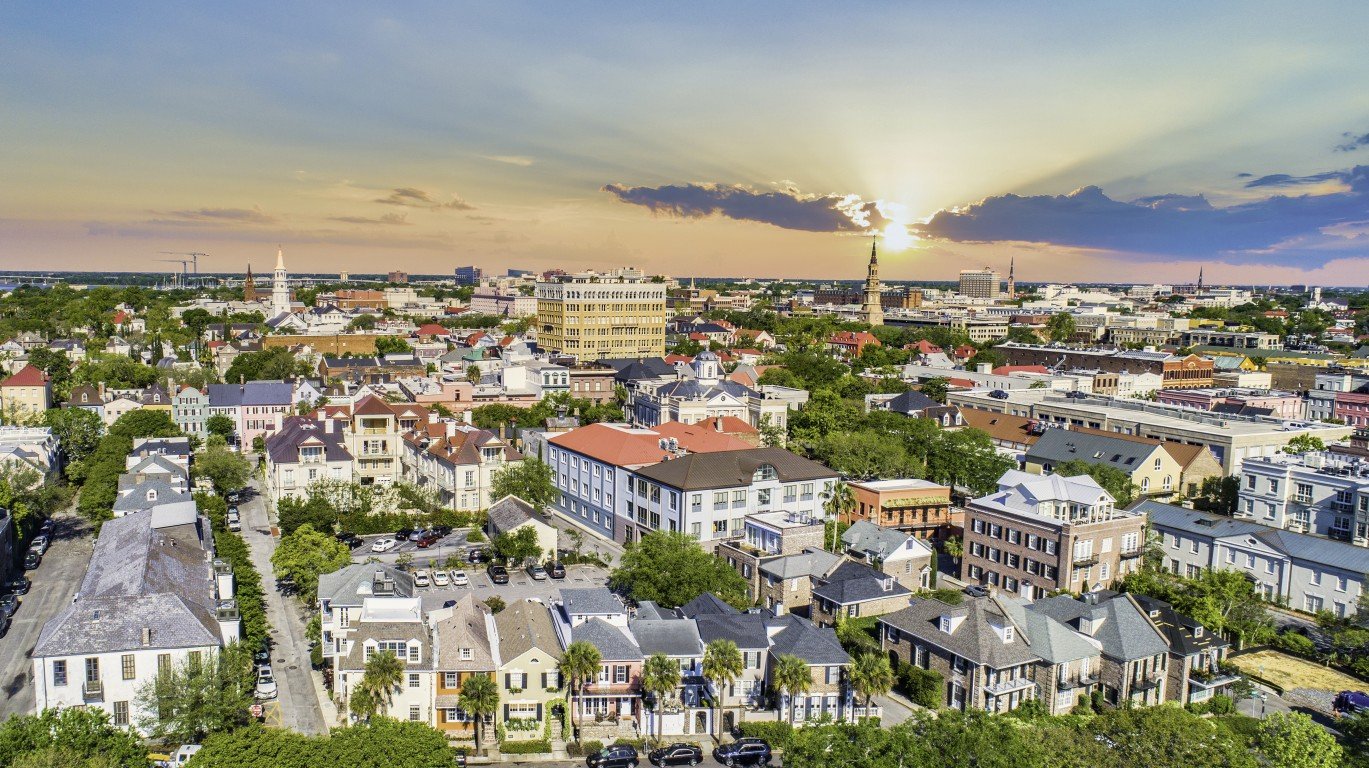
30. South Carolina
> Firearm background checks per 1,000 residents, Jan-June 2023: 31.1
> Firearm background checks, Jan-June 2023: 164,406 — 23rd most
> Most common type of firearm check: Handguns
> Firearm background checks per 1,000 residents, Jan-June 2022: 37.5 — 23rd most
> Firearm background checks, Jan-June 2022: 198,343 — 21st most
> Change in background checks, Jan-June 2022 – Jan-June 2023: -33,937 (-17.1% — 4th largest decrease)
> 2022 Population: 5.3 million — 23rd largest
[in-text-ad]

29. Arkansas
> Firearm background checks per 1,000 residents, Jan-June 2023: 32.5
> Firearm background checks, Jan-June 2023: 98,963 — 19th fewest
> Most common type of firearm check: Handguns
> Firearm background checks per 1,000 residents, Jan-June 2022: 32.5 — 20th fewest
> Firearm background checks, Jan-June 2022: 98,948 — 19th fewest
> Change in background checks, Jan-June 2022 – Jan-June 2023: effectively unchanged
> 2022 Population: 3.0 million — 18th smallest
[recirclink id=1215966]

28. Indiana
> Firearm background checks per 1,000 residents, Jan-June 2023: 32.5
> Firearm background checks, Jan-June 2023: 222,389 — 19th most
> Most common type of firearm check: Handguns
> Firearm background checks per 1,000 residents, Jan-June 2022: 35.4 — 25th most
> Firearm background checks, Jan-June 2022: 241,580 — 18th most
> Change in background checks, Jan-June 2022 – Jan-June 2023: -19,191 (-7.9% — 15th largest decrease)
> 2022 Population: 6.8 million — 17th largest

27. Arizona
> Firearm background checks per 1,000 residents, Jan-June 2023: 32.9
> Firearm background checks, Jan-June 2023: 242,397 — 17th most
> Most common type of firearm check: Handguns
> Firearm background checks per 1,000 residents, Jan-June 2022: 34.9 — 25th fewest
> Firearm background checks, Jan-June 2022: 256,583 — 16th most
> Change in background checks, Jan-June 2022 – Jan-June 2023: -14,186 (-5.5% — 11th smallest decrease)
> 2022 Population: 7.4 million — 14th largest
[in-text-ad-2]

26. Vermont
> Firearm background checks per 1,000 residents, Jan-June 2023: 33.3
> Firearm background checks, Jan-June 2023: 21,544 — 3rd fewest
> Most common type of firearm check: Handguns
> Firearm background checks per 1,000 residents, Jan-June 2022: 34.1 — 23rd fewest
> Firearm background checks, Jan-June 2022: 22,037 — 3rd fewest
> Change in background checks, Jan-June 2022 – Jan-June 2023: -493 (-2.2% — 4th smallest decrease)
> 2022 Population: 647,064 — 2nd smallest

25. North Carolina
> Firearm background checks per 1,000 residents, Jan-June 2023: 33.4
> Firearm background checks, Jan-June 2023: 357,003 — 9th most
> Most common type of firearm check: Handguns
> Firearm background checks per 1,000 residents, Jan-June 2022: 27.4 — 13th fewest
> Firearm background checks, Jan-June 2022: 293,356 — 12th most
> Change in background checks, Jan-June 2022 – Jan-June 2023: +63,647 (+21.7% — 4th largest increase)
> 2022 Population: 10.7 million — 9th largest
[in-text-ad]
24. Illinois
> Firearm background checks per 1,000 residents, Jan-June 2023: 35.6
> Firearm background checks, Jan-June 2023: 447,936 — 5th most
> Most common type of firearm check: Handguns
> Firearm background checks per 1,000 residents, Jan-June 2022: 30.5 — 16th fewest
> Firearm background checks, Jan-June 2022: 384,168 — 7th most
> Change in background checks, Jan-June 2022 – Jan-June 2023: +63,768 (+16.6% — 5th largest increase)
> 2022 Population: 12.6 million — 6th largest
[recirclink id=1254010]

23. Michigan
> Firearm background checks per 1,000 residents, Jan-June 2023: 35.7
> Firearm background checks, Jan-June 2023: 358,075 — 8th most
> Most common type of firearm check: Handguns
> Firearm background checks per 1,000 residents, Jan-June 2022: 36.3 — 24th most
> Firearm background checks, Jan-June 2022: 364,649 — 8th most
> Change in background checks, Jan-June 2022 – Jan-June 2023: -6,574 (-1.8% — 2nd smallest decrease)
> 2022 Population: 10.0 million — 10th largest

22. Maine
> Firearm background checks per 1,000 residents, Jan-June 2023: 36.2
> Firearm background checks, Jan-June 2023: 50,177 — 10th fewest
> Most common type of firearm check: Handguns
> Firearm background checks per 1,000 residents, Jan-June 2022: 38.1 — 22nd most
> Firearm background checks, Jan-June 2022: 52,839 — 10th fewest
> Change in background checks, Jan-June 2022 – Jan-June 2023: -2,662 (-5.0% — 9th smallest decrease)
> 2022 Population: 1.4 million — 9th smallest
[in-text-ad-2]
21. Missouri
> Firearm background checks per 1,000 residents, Jan-June 2023: 36.5
> Firearm background checks, Jan-June 2023: 225,255 — 18th most
> Most common type of firearm check: Handguns
> Firearm background checks per 1,000 residents, Jan-June 2022: 40.1 — 20th most
> Firearm background checks, Jan-June 2022: 247,537 — 17th most
> Change in background checks, Jan-June 2022 – Jan-June 2023: -22,282 (-9.0% — 11th largest decrease)
> 2022 Population: 6.2 million — 18th largest

20. Mississippi
> Firearm background checks per 1,000 residents, Jan-June 2023: 37.4
> Firearm background checks, Jan-June 2023: 110,080 — 20th fewest
> Most common type of firearm check: Handguns
> Firearm background checks per 1,000 residents, Jan-June 2022: 41.0 — 17th most
> Firearm background checks, Jan-June 2022: 120,493 — 23rd fewest
> Change in background checks, Jan-June 2022 – Jan-June 2023: -10,413 (-8.6% — 13th largest decrease)
> 2022 Population: 2.9 million — 17th smallest
[in-text-ad]

19. New Mexico
> Firearm background checks per 1,000 residents, Jan-June 2023: 37.9
> Firearm background checks, Jan-June 2023: 80,111 — 15th fewest
> Most common type of firearm check: Handguns
> Firearm background checks per 1,000 residents, Jan-June 2022: 38.5 — 21st most
> Firearm background checks, Jan-June 2022: 81,371 — 16th fewest
> Change in background checks, Jan-June 2022 – Jan-June 2023: -1,260 (-1.5% — the smallest decrease)
> 2022 Population: 2.1 million — 15th smallest
[recirclink id=1259310]

18. South Dakota
> Firearm background checks per 1,000 residents, Jan-June 2023: 38.2
> Firearm background checks, Jan-June 2023: 34,786 — 7th fewest
> Most common type of firearm check: Long guns
> Firearm background checks per 1,000 residents, Jan-June 2022: 44.1 — 15th most
> Firearm background checks, Jan-June 2022: 40,081 — 9th fewest
> Change in background checks, Jan-June 2022 – Jan-June 2023: -5,295 (-13.2% — 7th largest decrease)
> 2022 Population: 909,824 — 5th smallest

17. Minnesota
> Firearm background checks per 1,000 residents, Jan-June 2023: 38.5
> Firearm background checks, Jan-June 2023: 220,105 — 20th most
> Most common type of firearm check: Handguns
> Firearm background checks per 1,000 residents, Jan-June 2022: 41.9 — 16th most
> Firearm background checks, Jan-June 2022: 239,731 — 19th most
> Change in background checks, Jan-June 2022 – Jan-June 2023: -19,626 (-8.2% — 14th largest decrease)
> 2022 Population: 5.7 million — 22nd largest
[in-text-ad-2]

16. Oklahoma
> Firearm background checks per 1,000 residents, Jan-June 2023: 38.8
> Firearm background checks, Jan-June 2023: 155,978 — 24th most
> Most common type of firearm check: Handguns
> Firearm background checks per 1,000 residents, Jan-June 2022: 40.7 — 18th most
> Firearm background checks, Jan-June 2022: 163,617 — 23rd most
> Change in background checks, Jan-June 2022 – Jan-June 2023: -7,639 (-4.7% — 8th smallest decrease)
> 2022 Population: 4.0 million — 23rd smallest
15. North Dakota
> Firearm background checks per 1,000 residents, Jan-June 2023: 41.3
> Firearm background checks, Jan-June 2023: 32,181 — 6th fewest
> Most common type of firearm check: Long guns
> Firearm background checks per 1,000 residents, Jan-June 2022: 44.7 — 14th most
> Firearm background checks, Jan-June 2022: 34,810 — 6th fewest
> Change in background checks, Jan-June 2022 – Jan-June 2023: -2,629 (-7.6% — 17th largest decrease)
> 2022 Population: 779,261 — 4th smallest
[in-text-ad]

14. Utah
> Firearm background checks per 1,000 residents, Jan-June 2023: 45.5
> Firearm background checks, Jan-June 2023: 153,703 — 25th most
> Most common type of firearm check: Handguns
> Firearm background checks per 1,000 residents, Jan-June 2022: 40.6 — 19th most
> Firearm background checks, Jan-June 2022: 137,338 — 25th most
> Change in background checks, Jan-June 2022 – Jan-June 2023: +16,365 (+11.9% — 6th largest increase)
> 2022 Population: 3.4 million — 21st smallest
[recirclink id=1215627]

13. Pennsylvania
> Firearm background checks per 1,000 residents, Jan-June 2023: 45.7
> Firearm background checks, Jan-June 2023: 593,445 — 4th most
> Most common type of firearm check: Handguns
> Firearm background checks per 1,000 residents, Jan-June 2022: 47.4 — 9th most
> Firearm background checks, Jan-June 2022: 614,364 — 3rd most
> Change in background checks, Jan-June 2022 – Jan-June 2023: -20,919 (-3.4% — 5th smallest decrease)
> 2022 Population: 13.0 million — 5th largest

12. New Hampshire
> Firearm background checks per 1,000 residents, Jan-June 2023: 45.9
> Firearm background checks, Jan-June 2023: 63,998 — 12th fewest
> Most common type of firearm check: Handguns
> Firearm background checks per 1,000 residents, Jan-June 2022: 46.7 — 11th most
> Firearm background checks, Jan-June 2022: 65,186 — 13th fewest
> Change in background checks, Jan-June 2022 – Jan-June 2023: -1,188 (-1.8% — 3rd smallest decrease)
> 2022 Population: 1.4 million — 10th smallest
[in-text-ad-2]
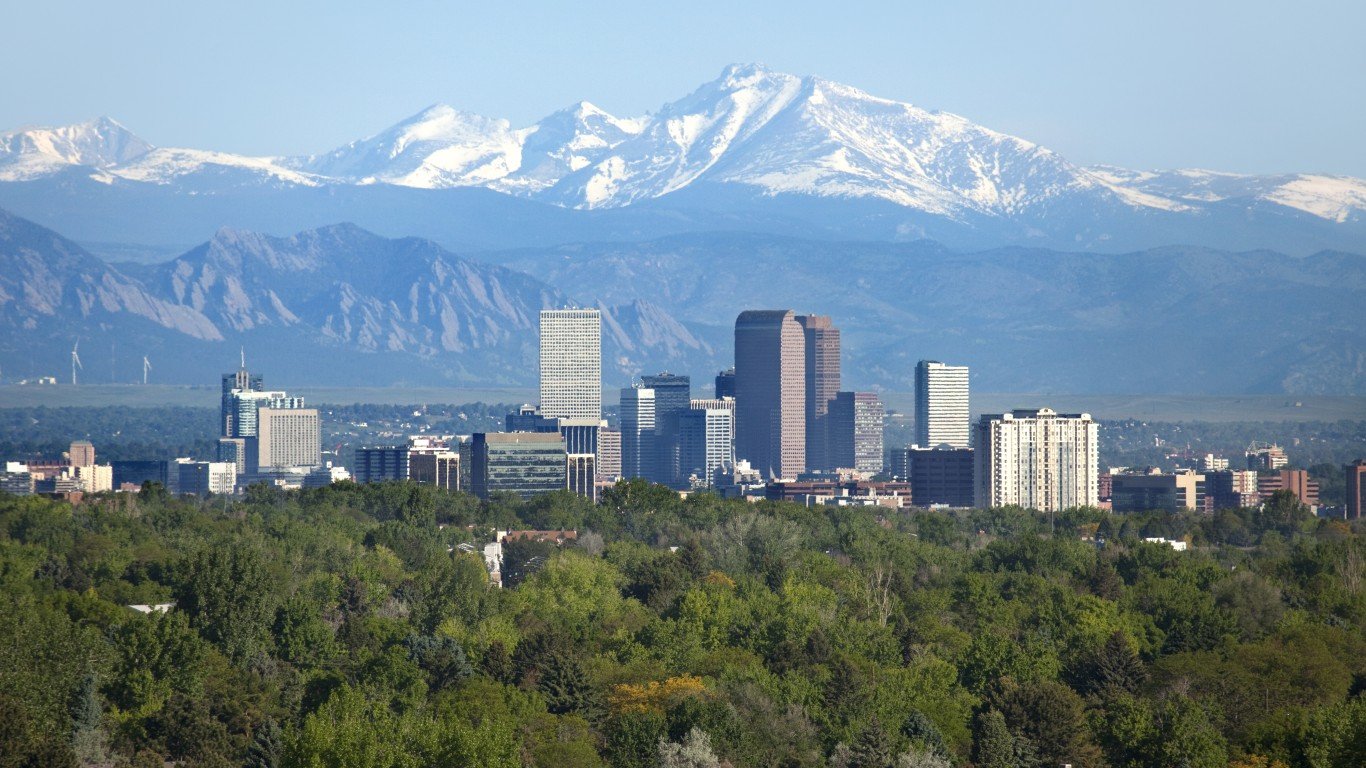
11. Colorado
> Firearm background checks per 1,000 residents, Jan-June 2023: 45.9
> Firearm background checks, Jan-June 2023: 268,304 — 14th most
> Most common type of firearm check: Handguns
> Firearm background checks per 1,000 residents, Jan-June 2022: 45.2 — 13th most
> Firearm background checks, Jan-June 2022: 264,069 — 15th most
> Change in background checks, Jan-June 2022 – Jan-June 2023: +4,235 (+1.6% — 2nd smallest increase)
> 2022 Population: 5.8 million — 21st largest

10. Washington
> Firearm background checks per 1,000 residents, Jan-June 2023: 47.6
> Firearm background checks, Jan-June 2023: 370,843 — 7th most
> Most common type of firearm check: Handguns
> Firearm background checks per 1,000 residents, Jan-June 2022: 49.9 — 8th most
> Firearm background checks, Jan-June 2022: 388,887 — 6th most
> Change in background checks, Jan-June 2022 – Jan-June 2023: -18,044 (-4.6% — 7th smallest decrease)
> 2022 Population: 7.8 million — 13th largest
[in-text-ad]

9. West Virginia
> Firearm background checks per 1,000 residents, Jan-June 2023: 48.1
> Firearm background checks, Jan-June 2023: 85,450 — 18th fewest
> Most common type of firearm check: Handguns
> Firearm background checks per 1,000 residents, Jan-June 2022: 47.2 — 10th most
> Firearm background checks, Jan-June 2022: 83,709 — 17th fewest
> Change in background checks, Jan-June 2022 – Jan-June 2023: +1,741 (+2.1% — 3rd smallest increase)
> 2022 Population: 1.8 million — 12th smallest
[recirclink id=1265908]

8. Wisconsin
> Firearm background checks per 1,000 residents, Jan-June 2023: 48.5
> Firearm background checks, Jan-June 2023: 285,581 — 11th most
> Most common type of firearm check: Handguns
> Firearm background checks per 1,000 residents, Jan-June 2022: 52.4 — 6th most
> Firearm background checks, Jan-June 2022: 308,660 — 11th most
> Change in background checks, Jan-June 2022 – Jan-June 2023: -23,079 (-7.5% — 16th smallest decrease)
> 2022 Population: 5.9 million — 20th largest

7. Alaska
> Firearm background checks per 1,000 residents, Jan-June 2023: 49.3
> Firearm background checks, Jan-June 2023: 36,157 — 8th fewest
> Most common type of firearm check: Handguns
> Firearm background checks per 1,000 residents, Jan-June 2022: 52.0 — 7th most
> Firearm background checks, Jan-June 2022: 38,112 — 8th fewest
> Change in background checks, Jan-June 2022 – Jan-June 2023: -1,955 (-5.1% — 10th smallest decrease)
> 2022 Population: 733,583 — 3rd smallest
[in-text-ad-2]
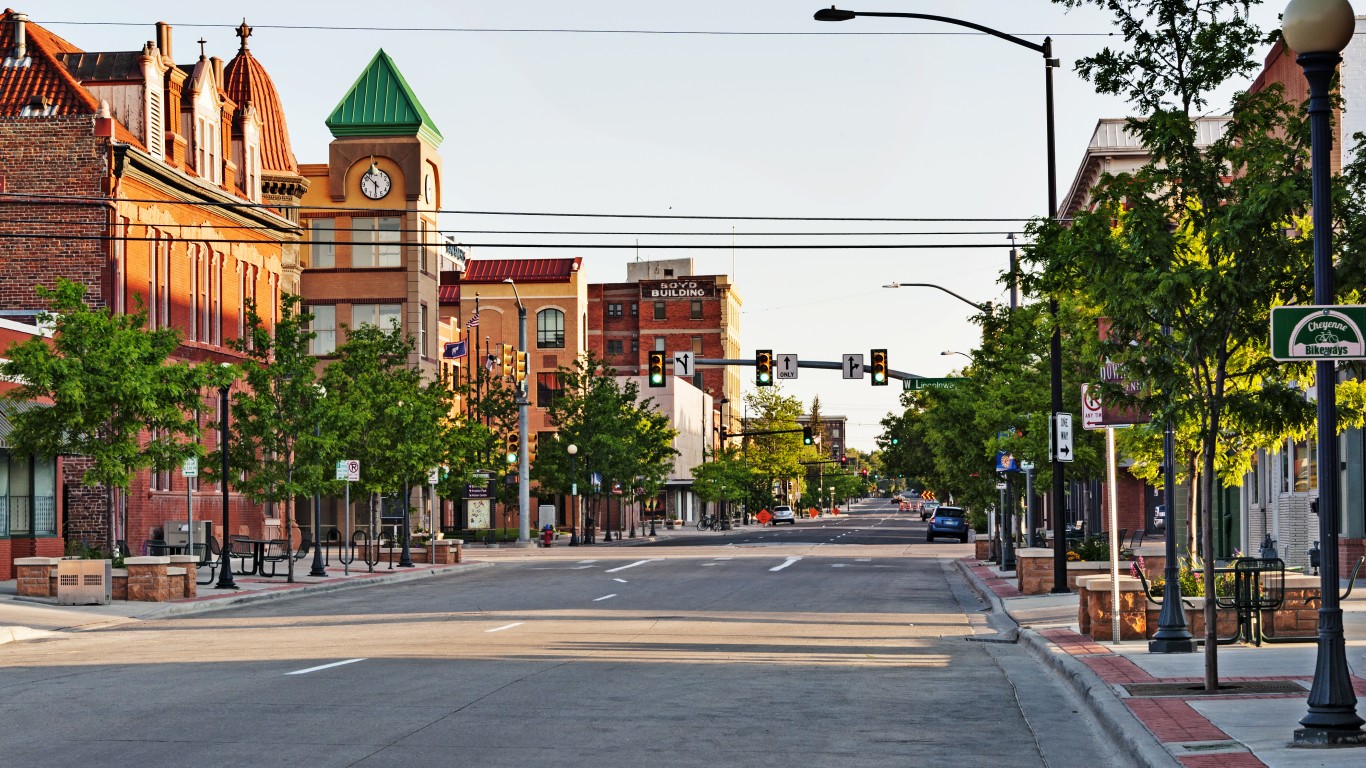
6. Wyoming
> Firearm background checks per 1,000 residents, Jan-June 2023: 51.8
> Firearm background checks, Jan-June 2023: 30,115 — 5th fewest
> Most common type of firearm check: Handguns
> Firearm background checks per 1,000 residents, Jan-June 2022: 57.1 — 5th most
> Firearm background checks, Jan-June 2022: 33,218 — 4th fewest
> Change in background checks, Jan-June 2022 – Jan-June 2023: -3,103 (-9.3% — 10th largest decrease)
> 2022 Population: 581,381 — the smallest

5. Tennessee
> Firearm background checks per 1,000 residents, Jan-June 2023: 53.0
> Firearm background checks, Jan-June 2023: 373,887 — 6th most
> Most common type of firearm check: Handguns
> Firearm background checks per 1,000 residents, Jan-June 2022: 59.2 — 3rd most
> Firearm background checks, Jan-June 2022: 417,432 — 5th most
> Change in background checks, Jan-June 2022 – Jan-June 2023: -43,545 (-10.4% — 9th largest decrease)
> 2022 Population: 7.1 million — 15th largest
[in-text-ad]
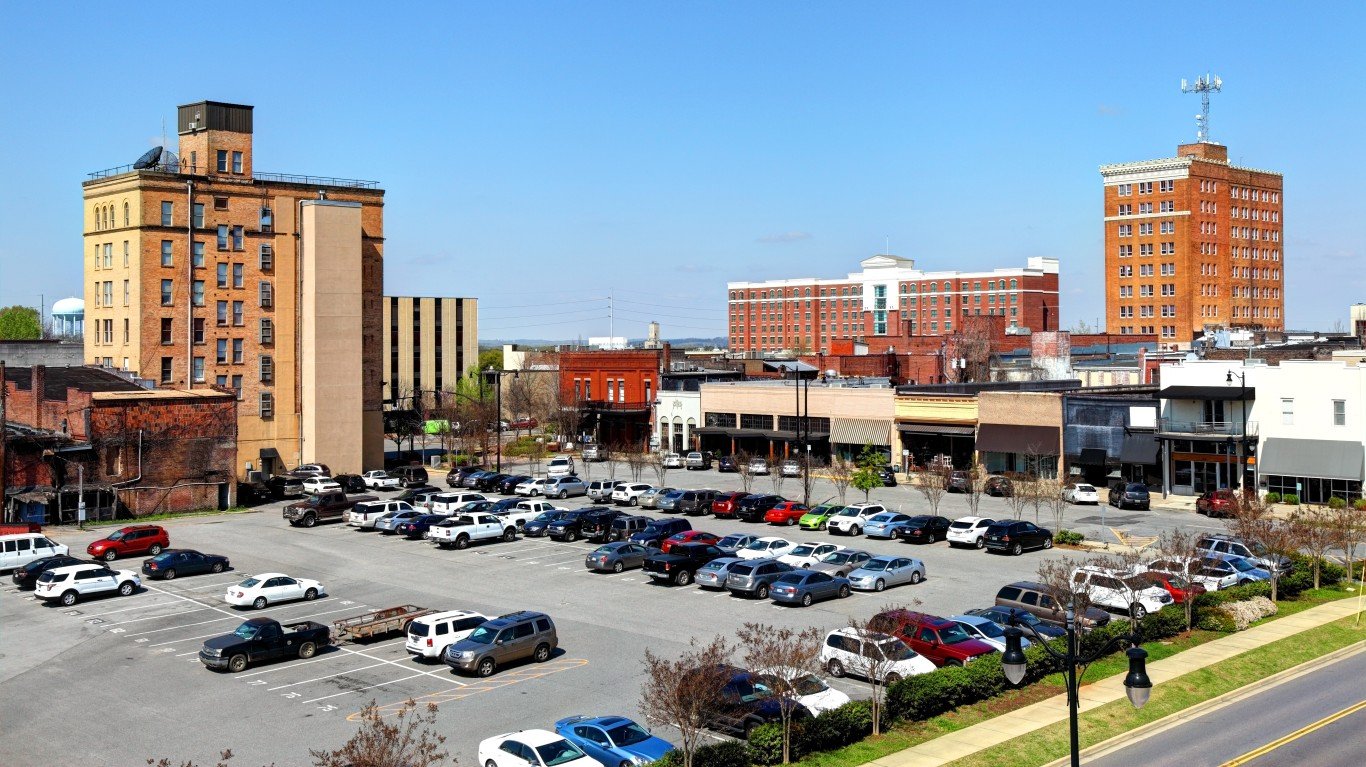
4. Alabama
> Firearm background checks per 1,000 residents, Jan-June 2023: 54.5
> Firearm background checks, Jan-June 2023: 276,529 — 13th most
> Most common type of firearm check: Handguns
> Firearm background checks per 1,000 residents, Jan-June 2022: 69.3 — the most
> Firearm background checks, Jan-June 2022: 351,705 — 9th most
> Change in background checks, Jan-June 2022 – Jan-June 2023: -75,176 (-21.4% — 2nd largest decrease)
> 2022 Population: 5.1 million — 24th largest
[recirclink id=1215966]
3. Montana
> Firearm background checks per 1,000 residents, Jan-June 2023: 54.7
> Firearm background checks, Jan-June 2023: 61,385 — 11th fewest
> Most common type of firearm check: Handguns
> Firearm background checks per 1,000 residents, Jan-June 2022: 58.1 — 4th most
> Firearm background checks, Jan-June 2022: 65,183 — 12th fewest
> Change in background checks, Jan-June 2022 – Jan-June 2023: -3,798 (-5.8% — 13th smallest decrease)
> 2022 Population: 1.1 million — 8th smallest

2. Idaho
> Firearm background checks per 1,000 residents, Jan-June 2023: 61.0
> Firearm background checks, Jan-June 2023: 118,285 — 23rd fewest
> Most common type of firearm check: Handguns
> Firearm background checks per 1,000 residents, Jan-June 2022: 59.6 — 2nd most
> Firearm background checks, Jan-June 2022: 115,522 — 22nd fewest
> Change in background checks, Jan-June 2022 – Jan-June 2023: +2,763 (+2.4% — 4th smallest increase)
> 2022 Population: 1.9 million — 13th smallest
[in-text-ad-2]

1. Oregon
> Firearm background checks per 1,000 residents, Jan-June 2023: 66.5
> Firearm background checks, Jan-June 2023: 282,164 — 12th most
> Most common type of firearm check: Handguns
> Firearm background checks per 1,000 residents, Jan-June 2022: 46.5 — 12th most
> Firearm background checks, Jan-June 2022: 197,216 — 22nd most
> Change in background checks, Jan-June 2022 – Jan-June 2023: +84,948 (+43.1% — 2nd largest increase)
> 2022 Population: 4.2 million — 24th smallest
Methodology
To find the states where the most people bought guns so far this year, 24/7 Wall St. used FBI data from its National Instant Criminal Background Check System for the first six months of 2023. To get a more accurate approximation of gun sales, we excluded several categories of checks, including pawn shop transactions, returns, rentals, and rechecks, which are conducted periodically by some states on existing permit holders. We ranked states based on the combined number of gun checks through the first six months of 2023 per 1,000 people.
Even after removing some types of checks that are clearly unrelated to a new firearm purchase, because every state has different laws in terms of when background checks are required and different accounting practices, background checks still only serve as a rough approximation.
The most glaring example of this is Illinois, which alone accounted for about half of the background checks in the country after excluding the aforementioned categories of checks. Illinois no longer breaks down background checks separately, but did from July 2016 through July 2021. During the four full years of data, an average of 9.2% of Illinois’s non-private sale or gun-specific permit checks were non-rechecks. We applied that average to the most recent state figures to estimate Illinois’ count. This was done only because Illinois is such a glaring example of inconsistency and because there was historical data to produce an estimate.
There are likely other states for which the background check figures listed are inflated or underestimated proxies for gun sales.
Population data came from the U.S. Census Bureau’s Population and Housing Unit Estimates Program, and are for July of 2022, the most recent data available.
Contact [email protected] for any questions or corrections.