The U.S. property crime rate fell for the 19th consecutive year in 2020 – a bright spot in an otherwise bleak year defined largely by the COVID-19 pandemic and a historic surge in deadly violence.
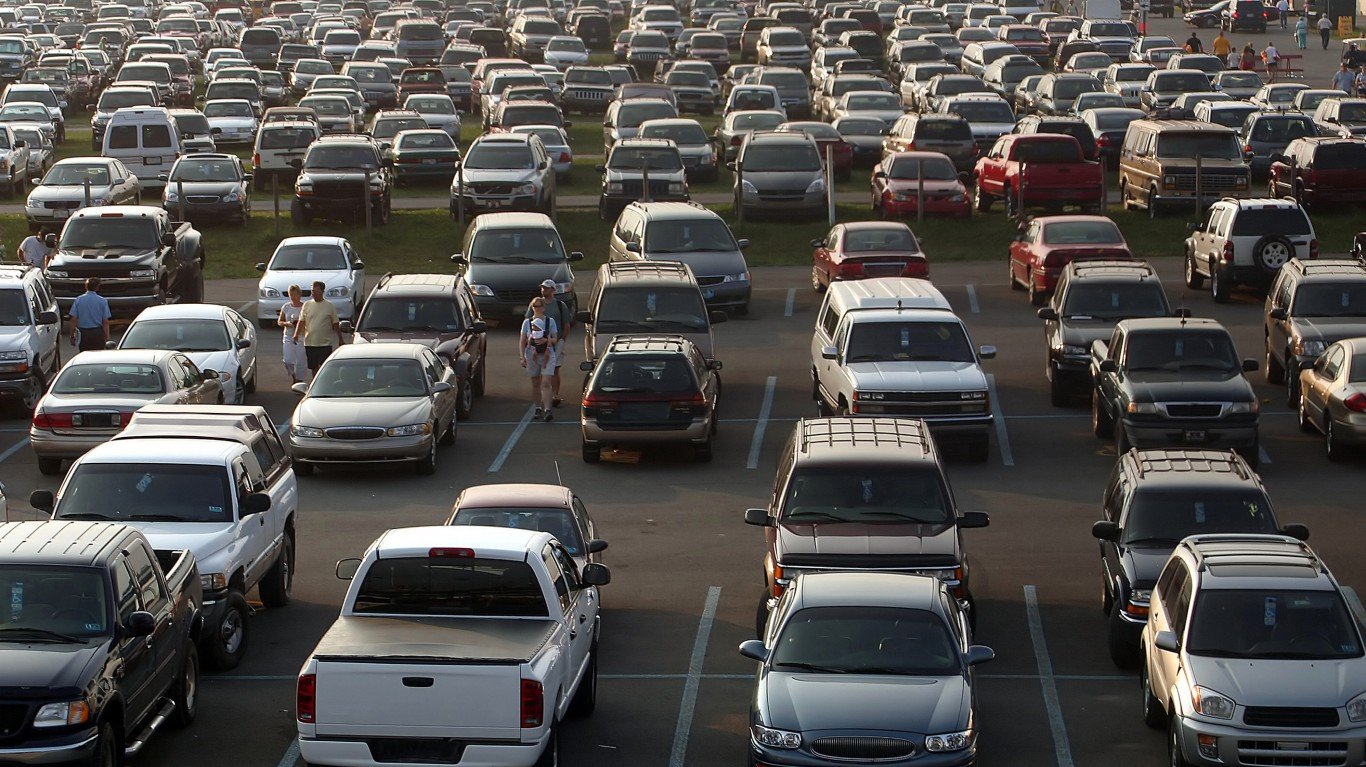
Property crime is made up of three categories of offenses: larceny, defined as the unlawful taking of property; burglary, defined as the illegal entry of a structure to commit a crime; and vehicle theft, defined as the theft, or the attempted theft, of a vehicle, such a car or ATV. Here is a look at the city in every state where your car is most likely to be stolen.
There were a total 6.5 million property crimes reported in the U.S. in 2020, or 1,958 for every 100,000 people, a decrease of 172 incidents per 100,000 people from the previous year. The decline nationwide is being led by especially steep drops in some U.S. cities.
Using data from the FBI’s 2020 Uniform Crime Report, 24/7 Wall St. identified the 50 cities where property crime is falling fastest. Cities, defined as places with populations above 25,000, are ranked by the year-over-year change in property crimes reported for every 100,000 residents.
Despite the decline in much of the country, property crimes remain the most common of the most serious crimes tracked by the FBI, known as Part I offenses. Each year, property crimes result in the loss of billions of dollars worth of property – much of which is never recovered.
In every city on this list, the property crime rate fell by more than 850 incidents per 100,000 people in 2020. Most of the cities that reported the largest decline in the property crime rate are in the South, including 18 in Florida state alone. It is important to note that while each of the cities on this list reported a decline in property crime, all but three still have a higher overall property crime rate than the national average. Here is a look at the city with the highest rate of property crime in each state.
Click here to see cities where property crime is falling
Click here to see our detailed methodology

50. Kingman, Arizona
> Change in reported property crime rate, 2019-2020: -857.8
> Property crimes reported in 2020: 1,106 — 481st lowest of 1,037 cities (tied)
> Property crimes reported in 2019: 1,342 — 495th highest of 1,037 cities (tied)
> Property crimes per 100K people in 2020: 3,527.8 — 140th highest of 1,037 cities
> Property crimes per 100K people in 2019: 4,385.6 — 77th highest of 1,037 cities
> Population: 29,726
[in-text-ad]
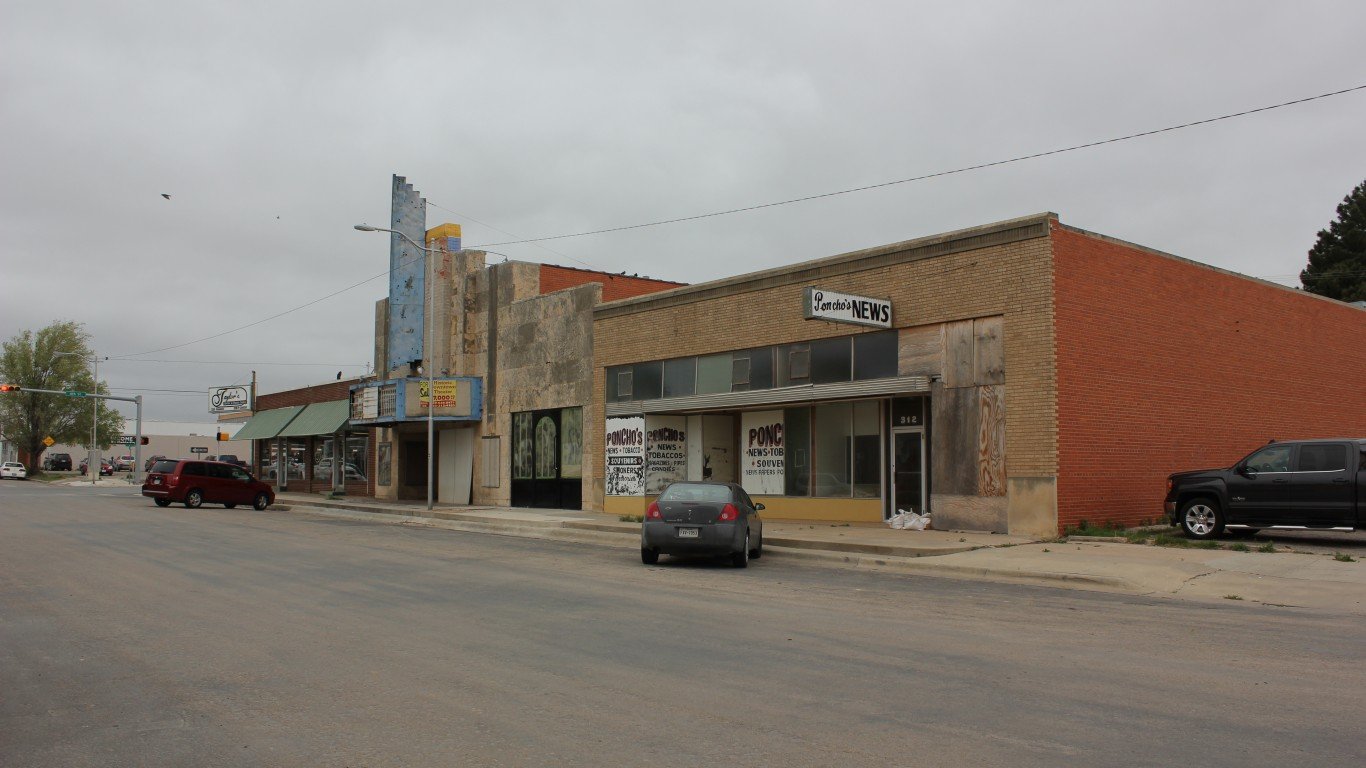
49. Big Spring, Texas
> Change in reported property crime rate, 2019-2020: -864.5
> Property crimes reported in 2020: 805 — 347th lowest of 1,037 cities (tied)
> Property crimes reported in 2019: 1,049 — 430th lowest of 1,037 cities
> Property crimes per 100K people in 2020: 2,845.1 — 271st highest of 1,037 cities
> Property crimes per 100K people in 2019: 3,709.6 — 151st highest of 1,037 cities
> Population: 28,041
[recirclink id=1015043]
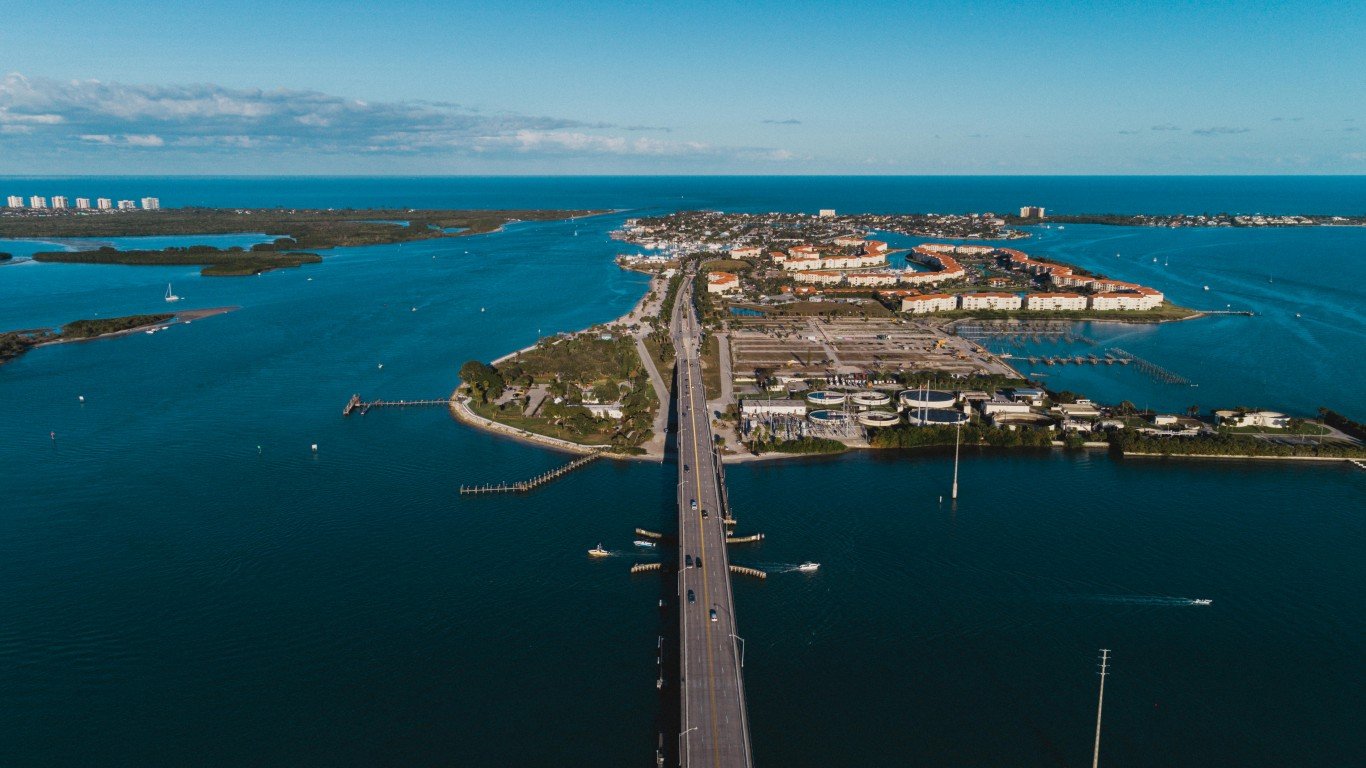
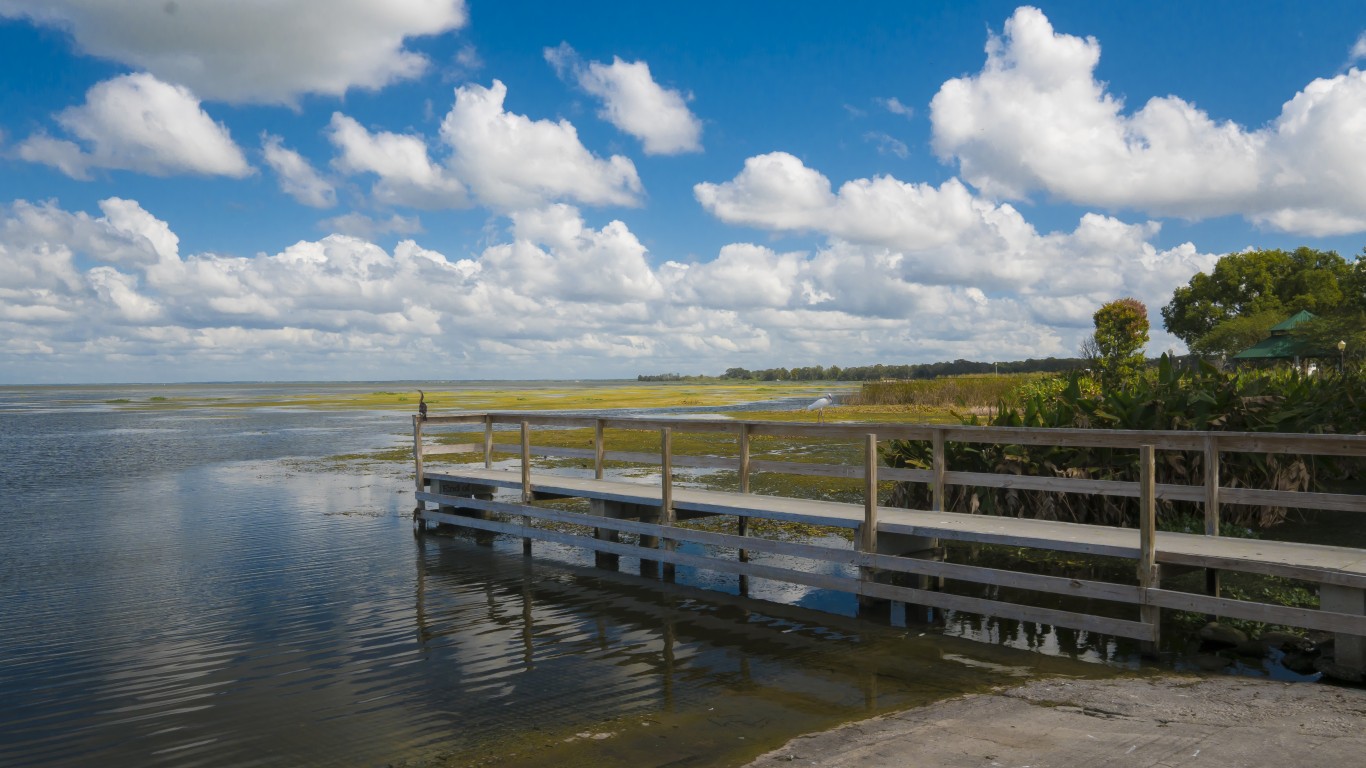
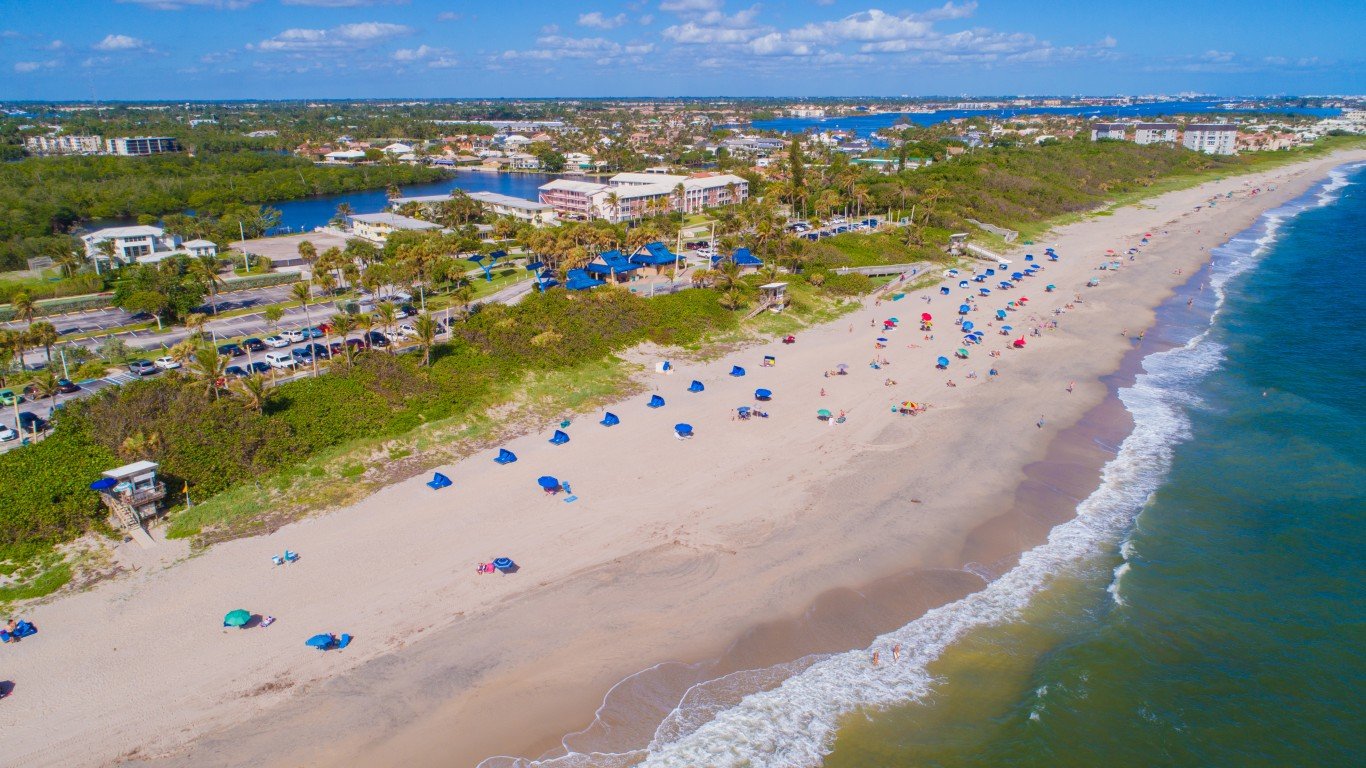
48. Fort Pierce, Florida
> Change in reported property crime rate, 2019-2020: -866.0
> Property crimes reported in 2020: 938 — 421st lowest of 1,037 cities (tied)
> Property crimes reported in 2019: 1,342 — 495th highest of 1,037 cities (tied)
> Property crimes per 100K people in 2020: 2,014.0 — 510th lowest of 1,037 cities
> Property crimes per 100K people in 2019: 2,880.0 — 320th highest of 1,037 cities
> Population: 45,329

47. El Paso de Robles, California
> Change in reported property crime rate, 2019-2020: -866.6
> Property crimes reported in 2020: 363 — 98th lowest of 1,037 cities (tied)
> Property crimes reported in 2019: 646 — 243rd lowest of 1,037 cities
> Property crimes per 100K people in 2020: 1,119.4 — 174th lowest of 1,037 cities
> Property crimes per 100K people in 2019: 1,986.0 — 447th lowest of 1,037 cities
> Population: 31,822
[in-text-ad-2]
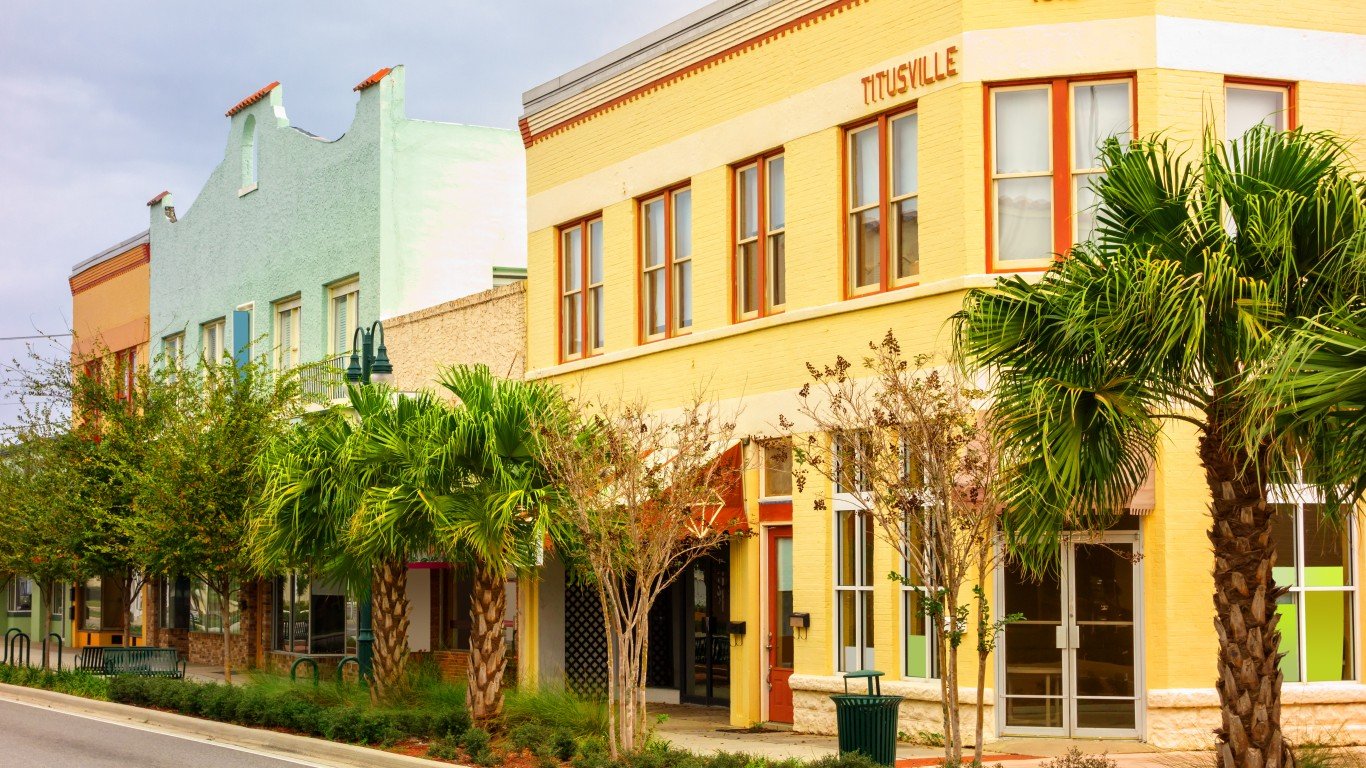
46. Titusville, Florida
> Change in reported property crime rate, 2019-2020: -879.6
> Property crimes reported in 2020: 1,081 — 475th lowest of 1,037 cities
> Property crimes reported in 2019: 1,492 — 437th highest of 1,037 cities
> Property crimes per 100K people in 2020: 2,304.0 — 424th highest of 1,037 cities
> Property crimes per 100K people in 2019: 3,183.5 — 245th highest of 1,037 cities
> Population: 45,932
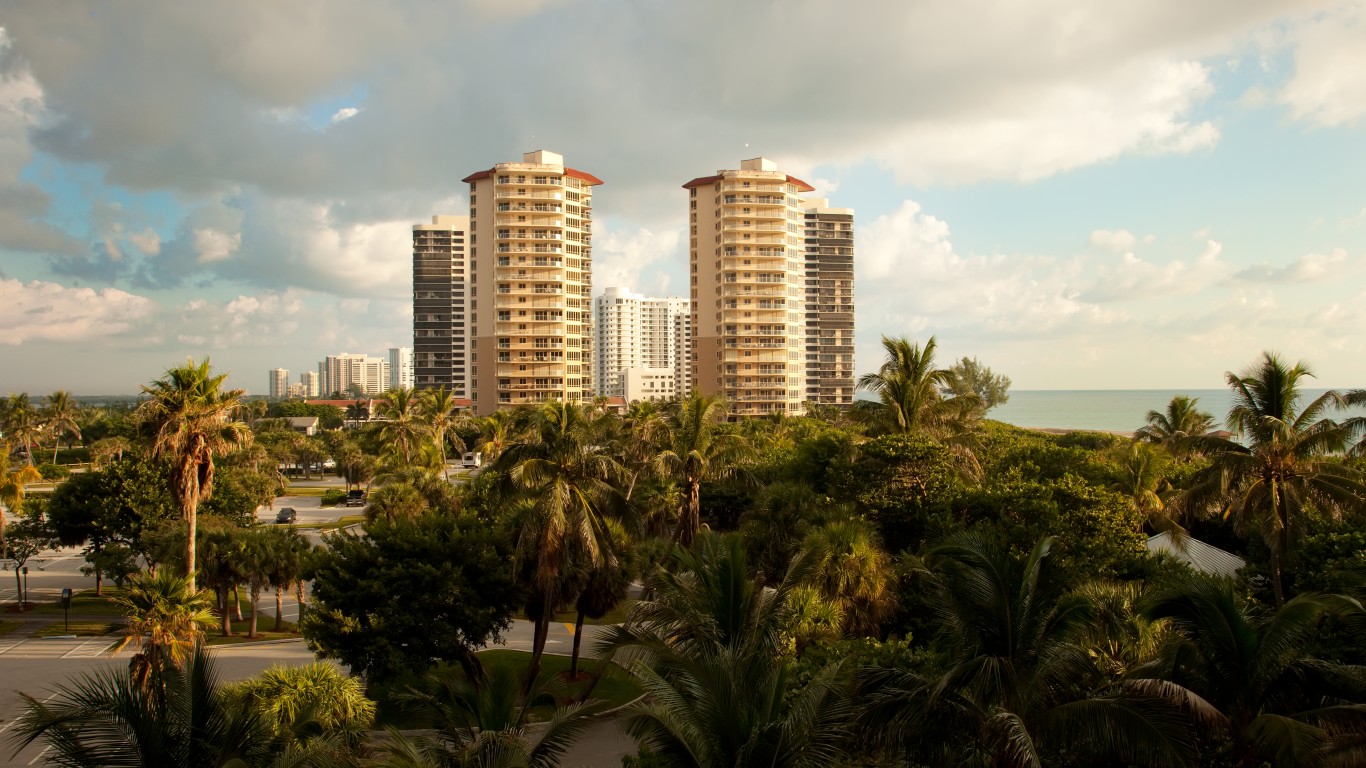
45. Riviera Beach, Florida
> Change in reported property crime rate, 2019-2020: -893.6
> Property crimes reported in 2020: 1,174 — 515th highest of 1,037 cities
> Property crimes reported in 2019: 1,466 — 452nd highest of 1,037 cities
> Property crimes per 100K people in 2020: 3,279.5 — 180th highest of 1,037 cities
> Property crimes per 100K people in 2019: 4,173.1 — 100th highest of 1,037 cities
> Population: 34,702
[in-text-ad]
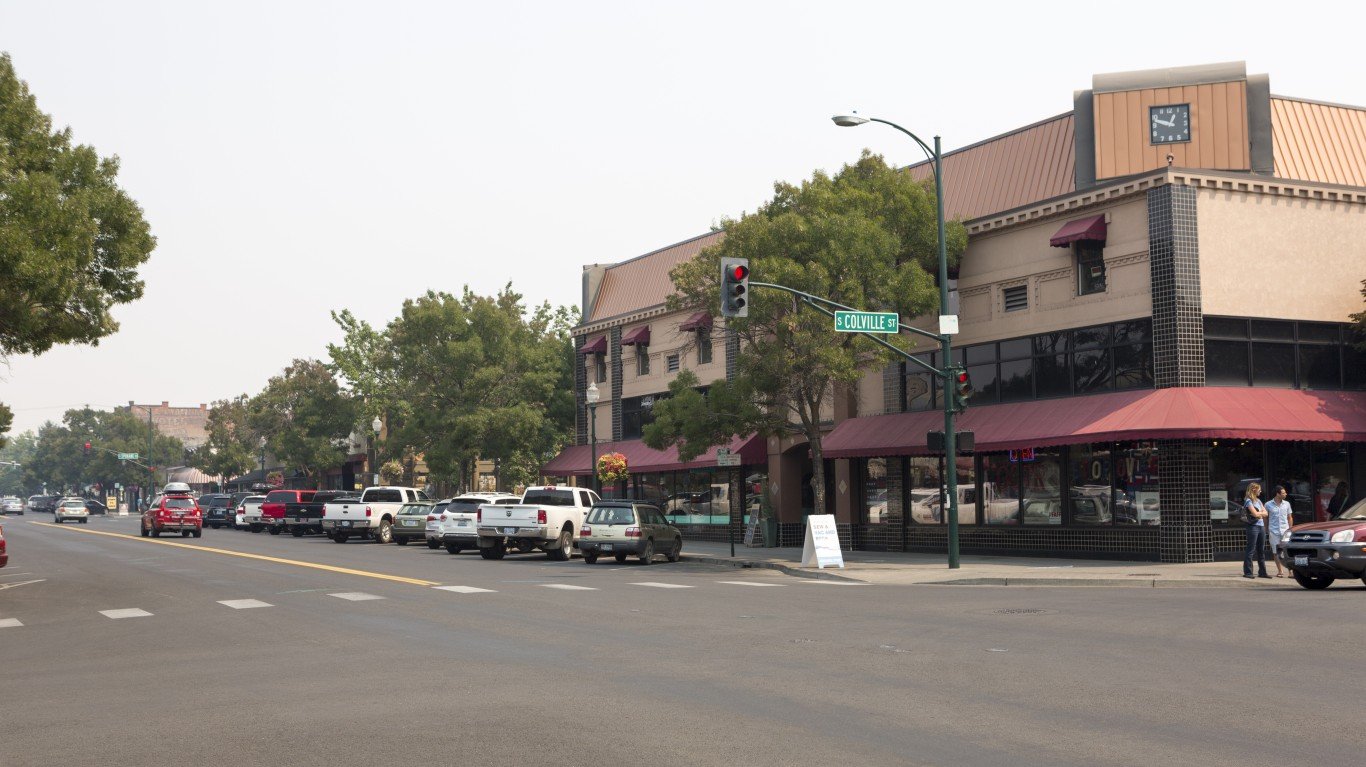
44. Walla Walla, Washington
> Change in reported property crime rate, 2019-2020: -909.8
> Property crimes reported in 2020: 749 — 319th lowest of 1,037 cities (tied)
> Property crimes reported in 2019: 1,052 — 432nd lowest of 1,037 cities (tied)
> Property crimes per 100K people in 2020: 2,273.6 — 430th highest of 1,037 cities
> Property crimes per 100K people in 2019: 3,183.3 — 246th highest of 1,037 cities
> Population: 32,793
[recirclink id=1030620]
43. Altamonte Springs, Florida
> Change in reported property crime rate, 2019-2020: -910.3
> Property crimes reported in 2020: 999 — 445th lowest of 1,037 cities (tied)
> Property crimes reported in 2019: 1,408 — 470th highest of 1,037 cities
> Property crimes per 100K people in 2020: 2,248.0 — 442nd highest of 1,037 cities
> Property crimes per 100K people in 2019: 3,158.2 — 252nd highest of 1,037 cities
> Population: 43,810

42. North Charleston, South Carolina
> Change in reported property crime rate, 2019-2020: -914.8
> Property crimes reported in 2020: 5,998 — 79th highest of 1,037 cities
> Property crimes reported in 2019: 6,941 — 77th highest of 1,037 cities
> Property crimes per 100K people in 2020: 5,104.6 — 29th highest of 1,037 cities
> Property crimes per 100K people in 2019: 6,019.3 — 15th highest of 1,037 cities
> Population: 111,501
[in-text-ad-2]

41. Miami, Florida
> Change in reported property crime rate, 2019-2020: -918.0
> Property crimes reported in 2020: 13,092 — 36th highest of 1,037 cities
> Property crimes reported in 2019: 17,624 — 29th highest of 1,037 cities
> Property crimes per 100K people in 2020: 2,749.8 — 297th highest of 1,037 cities
> Property crimes per 100K people in 2019: 3,667.8 — 156th highest of 1,037 cities
> Population: 454,279

40. Hemet, California
> Change in reported property crime rate, 2019-2020: -944.9
> Property crimes reported in 2020: 2,063 — 296th highest of 1,037 cities (tied)
> Property crimes reported in 2019: 2,877 — 217th highest of 1,037 cities
> Property crimes per 100K people in 2020: 2,397.2 — 390th highest of 1,037 cities
> Property crimes per 100K people in 2019: 3,342.2 — 205th highest of 1,037 cities
> Population: 84,542
[in-text-ad]
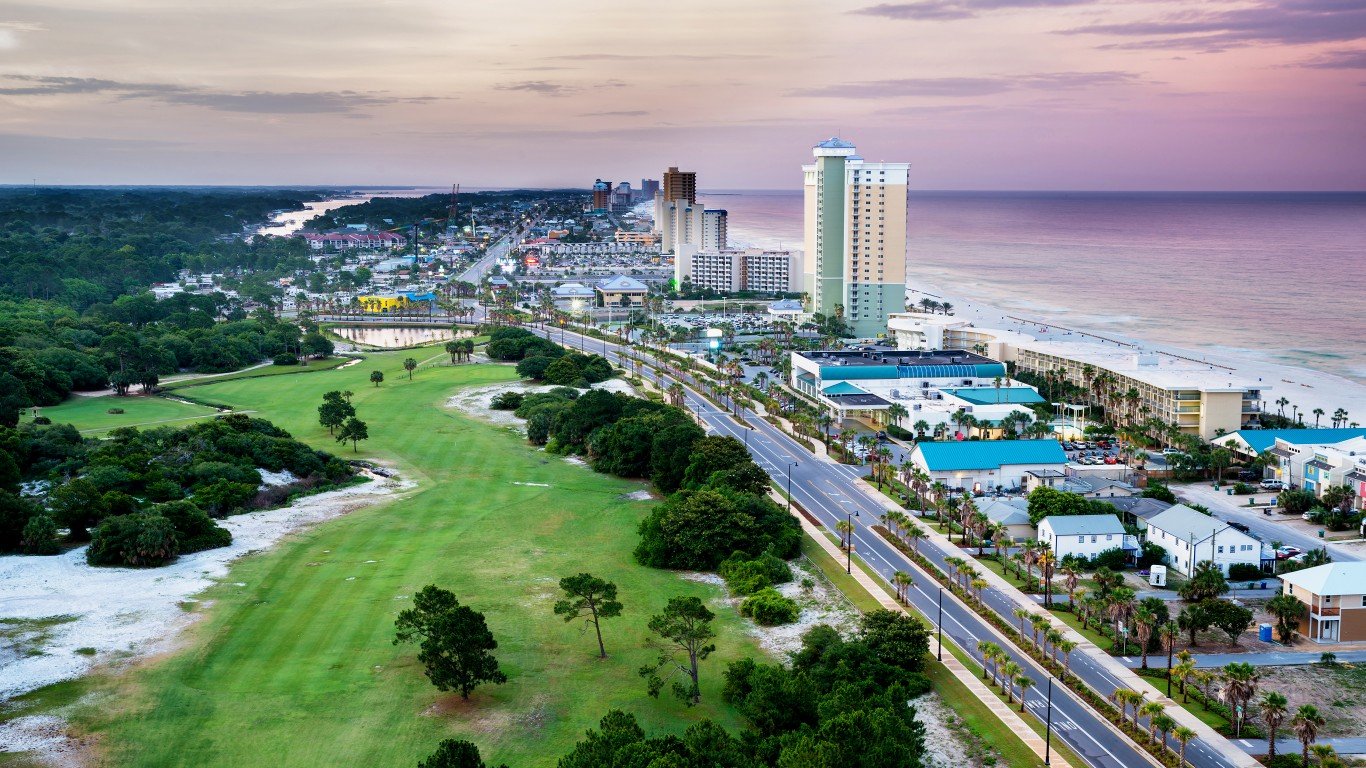
39. Panama City, Florida
> Change in reported property crime rate, 2019-2020: -954.6
> Property crimes reported in 2020: 1,453 — 418th highest of 1,037 cities
> Property crimes reported in 2019: 1,914 — 344th highest of 1,037 cities
> Property crimes per 100K people in 2020: 4,190.7 — 73rd highest of 1,037 cities
> Property crimes per 100K people in 2019: 5,145.3 — 41st highest of 1,037 cities
> Population: 36,640
[recirclink id=1033410]

38. Stockton, California
> Change in reported property crime rate, 2019-2020: -962.1
> Property crimes reported in 2020: 9,391 — 54th highest of 1,037 cities
> Property crimes reported in 2019: 12,367 — 39th highest of 1,037 cities
> Property crimes per 100K people in 2020: 2,981.4 — 243rd highest of 1,037 cities
> Property crimes per 100K people in 2019: 3,943.5 — 120th highest of 1,037 cities
> Population: 309,228
37. Apopka, Florida
> Change in reported property crime rate, 2019-2020: -962.6
> Property crimes reported in 2020: 1,395 — 434th highest of 1,037 cities
> Property crimes reported in 2019: 1,931 — 342nd highest of 1,037 cities
> Property crimes per 100K people in 2020: 2,543.7 — 349th highest of 1,037 cities
> Property crimes per 100K people in 2019: 3,506.3 — 181st highest of 1,037 cities
> Population: 51,800
[in-text-ad-2]

36. Lawton, Oklahoma
> Change in reported property crime rate, 2019-2020: -982.7
> Property crimes reported in 2020: 2,071 — 294th highest of 1,037 cities
> Property crimes reported in 2019: 2,972 — 211th highest of 1,037 cities
> Property crimes per 100K people in 2020: 2,238.7 — 450th highest of 1,037 cities
> Property crimes per 100K people in 2019: 3,221.5 — 237th highest of 1,037 cities
> Population: 94,017

35. Daytona Beach, Florida
> Change in reported property crime rate, 2019-2020: -996.2
> Property crimes reported in 2020: 2,145 — 284th highest of 1,037 cities (tied)
> Property crimes reported in 2019: 2,833 — 222nd highest of 1,037 cities
> Property crimes per 100K people in 2020: 3,060.6 — 224th highest of 1,037 cities
> Property crimes per 100K people in 2019: 4,056.8 — 108th highest of 1,037 cities
> Population: 67,604
[in-text-ad]
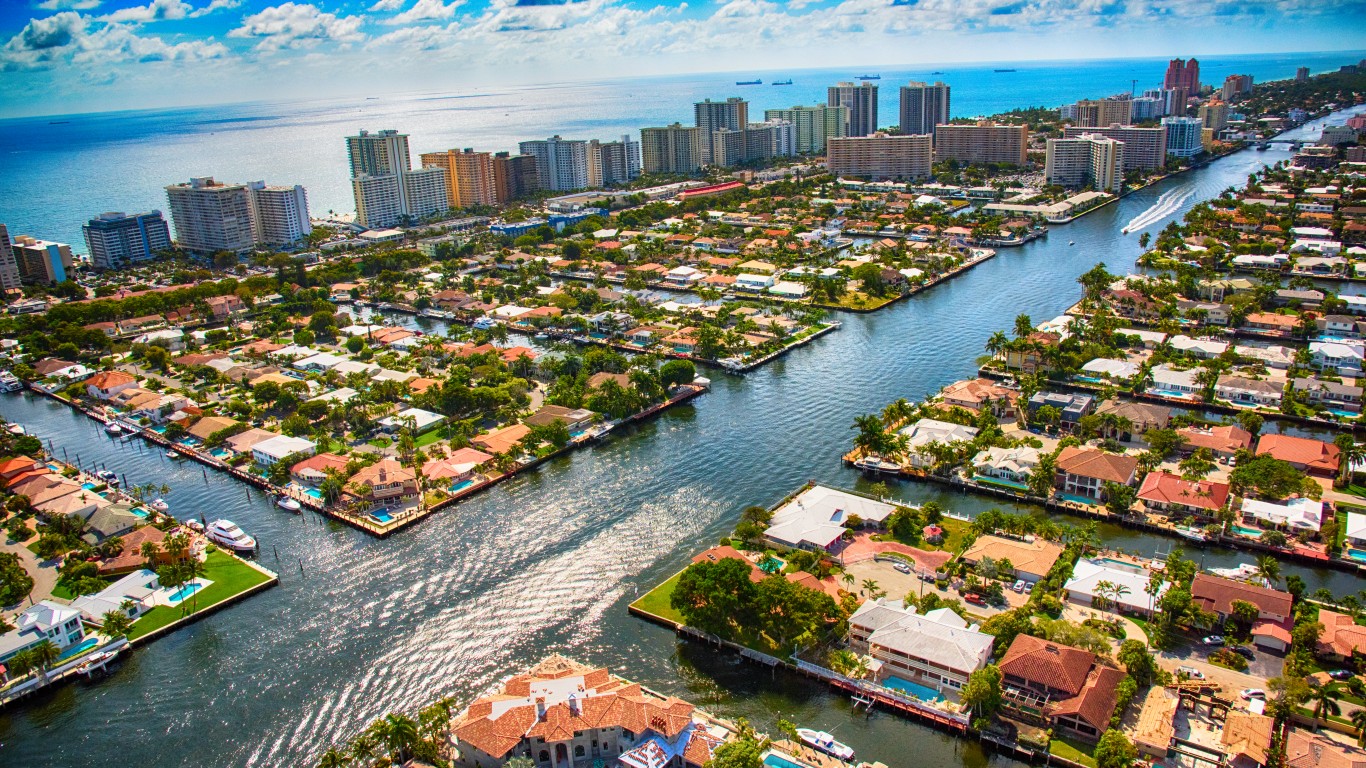
34. Pompano Beach, Florida
> Change in reported property crime rate, 2019-2020: -999.9
> Property crimes reported in 2020: 3,142 — 179th highest of 1,037 cities
> Property crimes reported in 2019: 4,277 — 128th highest of 1,037 cities
> Property crimes per 100K people in 2020: 2,767.2 — 290th highest of 1,037 cities
> Property crimes per 100K people in 2019: 3,767.1 — 143rd highest of 1,037 cities
> Population: 110,062
[recirclink id=1039645]
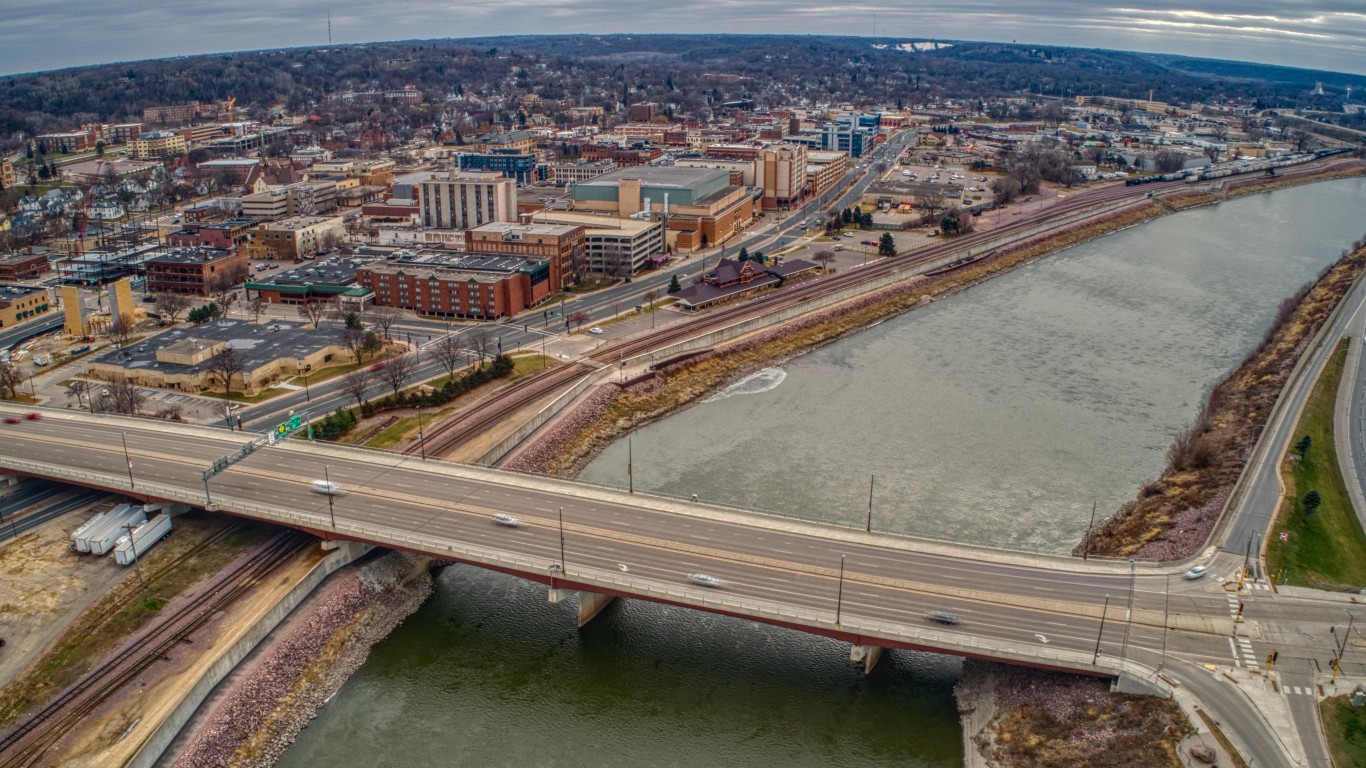
33. Mankato, Minnesota
> Change in reported property crime rate, 2019-2020: -1,016.6
> Property crimes reported in 2020: 1,033 — 459th lowest of 1,037 cities
> Property crimes reported in 2019: 1,462 — 454th highest of 1,037 cities
> Property crimes per 100K people in 2020: 2,387.0 — 393rd highest of 1,037 cities
> Property crimes per 100K people in 2019: 3,403.6 — 200th highest of 1,037 cities
> Population: 42,093
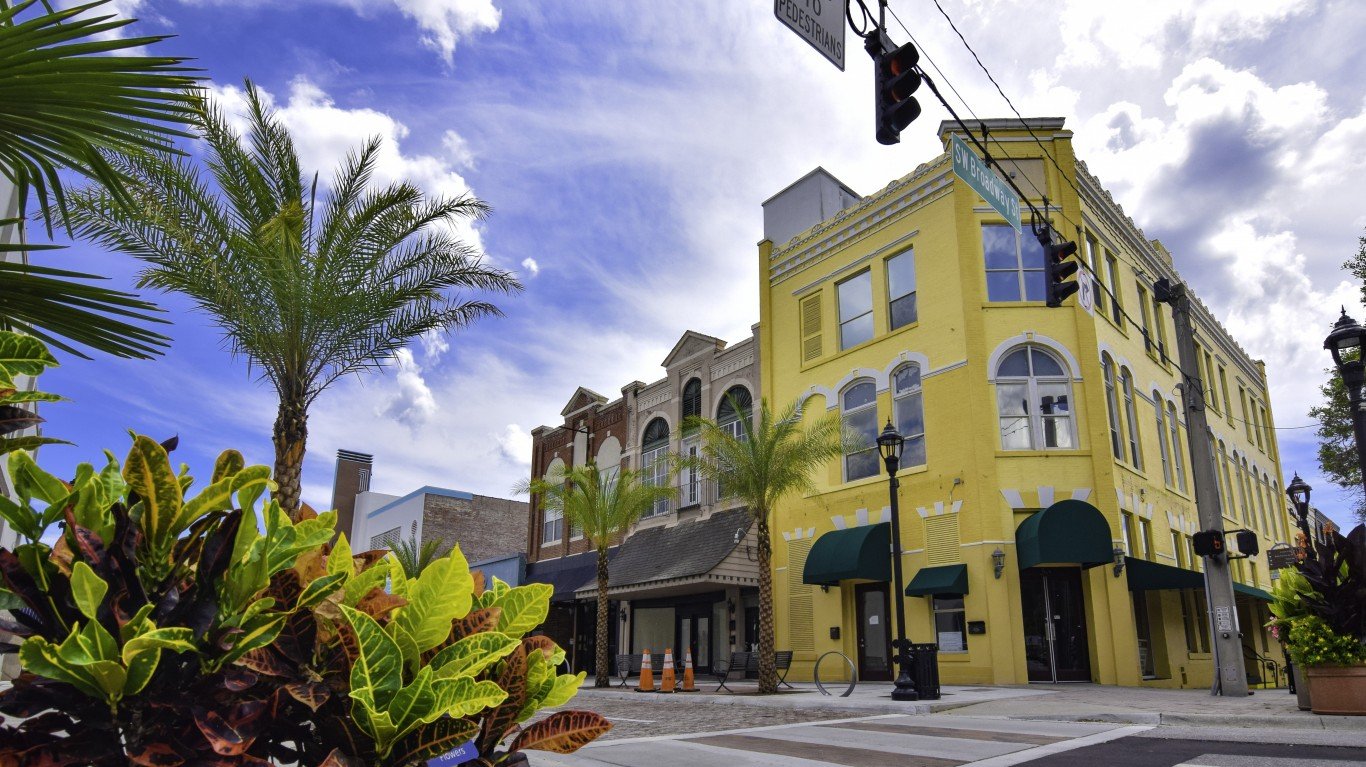
32. Ocala, Florida
> Change in reported property crime rate, 2019-2020: -1,022.2
> Property crimes reported in 2020: 1,936 — 313th highest of 1,037 cities
> Property crimes reported in 2019: 2,548 — 242nd highest of 1,037 cities (tied)
> Property crimes per 100K people in 2020: 3,159.5 — 205th highest of 1,037 cities
> Property crimes per 100K people in 2019: 4,181.7 — 99th highest of 1,037 cities
> Population: 59,267
[in-text-ad-2]

31. Orlando, Florida
> Change in reported property crime rate, 2019-2020: -1,023.3
> Property crimes reported in 2020: 11,158 — 44th highest of 1,037 cities
> Property crimes reported in 2019: 14,100 — 36th highest of 1,037 cities
> Property crimes per 100K people in 2020: 3,803.5 — 103rd highest of 1,037 cities
> Property crimes per 100K people in 2019: 4,826.8 — 52nd highest of 1,037 cities
> Population: 280,832

30. Tallahassee, Florida
> Change in reported property crime rate, 2019-2020: -1,027.0
> Property crimes reported in 2020: 5,786 — 82nd highest of 1,037 cities
> Property crimes reported in 2019: 7,763 — 69th highest of 1,037 cities
> Property crimes per 100K people in 2020: 2,951.9 — 246th highest of 1,037 cities
> Property crimes per 100K people in 2019: 3,978.9 — 117th highest of 1,037 cities
> Population: 191,279
[in-text-ad]

29. Jackson, Michigan
> Change in reported property crime rate, 2019-2020: -1,039.0
> Property crimes reported in 2020: 1,001 — 447th lowest of 1,037 cities
> Property crimes reported in 2019: 1,344 — 492nd highest of 1,037 cities
> Property crimes per 100K people in 2020: 3,096.0 — 217th highest of 1,037 cities
> Property crimes per 100K people in 2019: 4,135.0 — 103rd highest of 1,037 cities
> Population: 32,673
[recirclink id=1055273]
28. Boynton Beach, Florida
> Change in reported property crime rate, 2019-2020: -1,053.9
> Property crimes reported in 2020: 1,794 — 333rd highest of 1,037 cities
> Property crimes reported in 2019: 2,618 — 235th highest of 1,037 cities
> Property crimes per 100K people in 2020: 2,244.9 — 445th highest of 1,037 cities
> Property crimes per 100K people in 2019: 3,298.9 — 222nd highest of 1,037 cities
> Population: 76,832

27. Santa Cruz, California
> Change in reported property crime rate, 2019-2020: -1,054.9
> Property crimes reported in 2020: 2,237 — 268th highest of 1,037 cities
> Property crimes reported in 2019: 2,932 — 214th highest of 1,037 cities
> Property crimes per 100K people in 2020: 3,437.7 — 151st highest of 1,037 cities
> Property crimes per 100K people in 2019: 4,492.6 — 69th highest of 1,037 cities
> Population: 64,522
[in-text-ad-2]
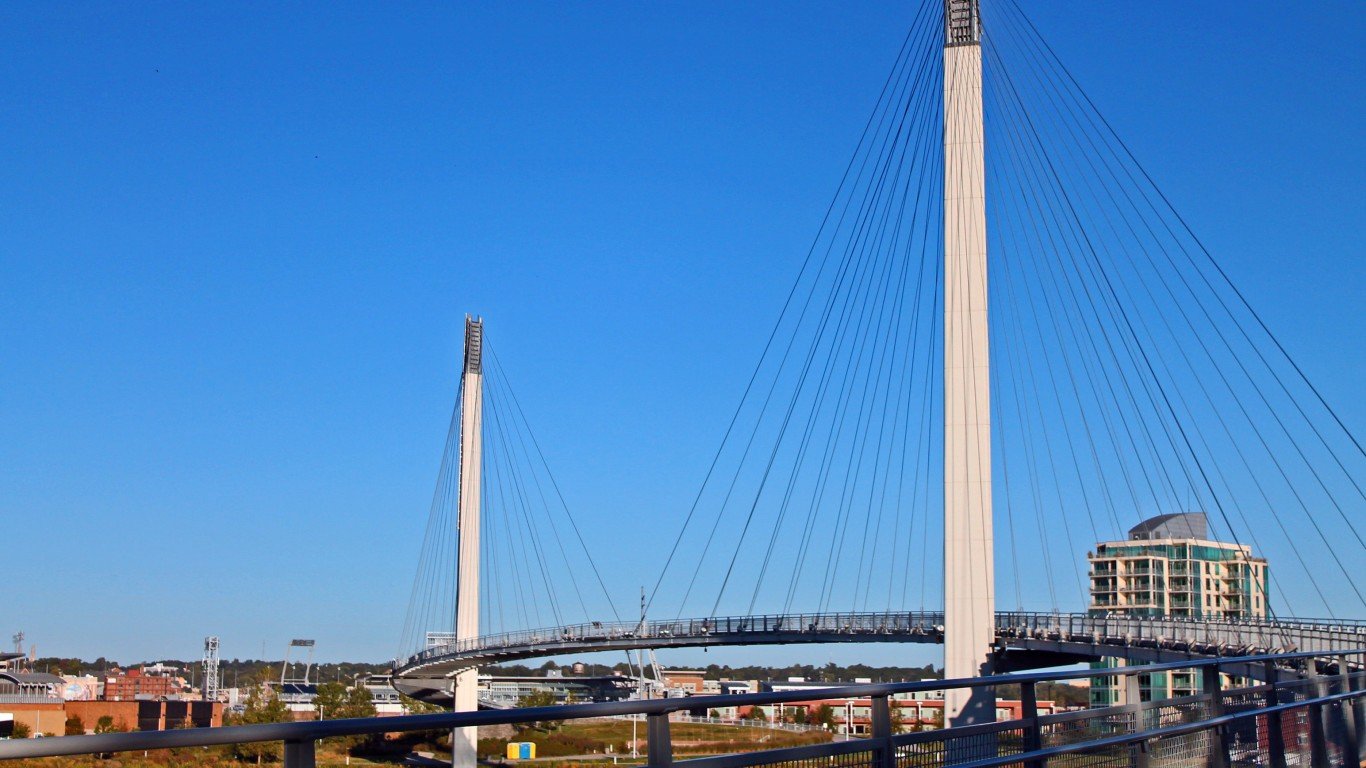
26. Council Bluffs, Iowa
> Change in reported property crime rate, 2019-2020: -1,056.3
> Property crimes reported in 2020: 2,976 — 194th highest of 1,037 cities
> Property crimes reported in 2019: 3,649 — 167th highest of 1,037 cities
> Property crimes per 100K people in 2020: 4,788.9 — 40th highest of 1,037 cities
> Property crimes per 100K people in 2019: 5,845.2 — 19th highest of 1,037 cities
> Population: 62,355
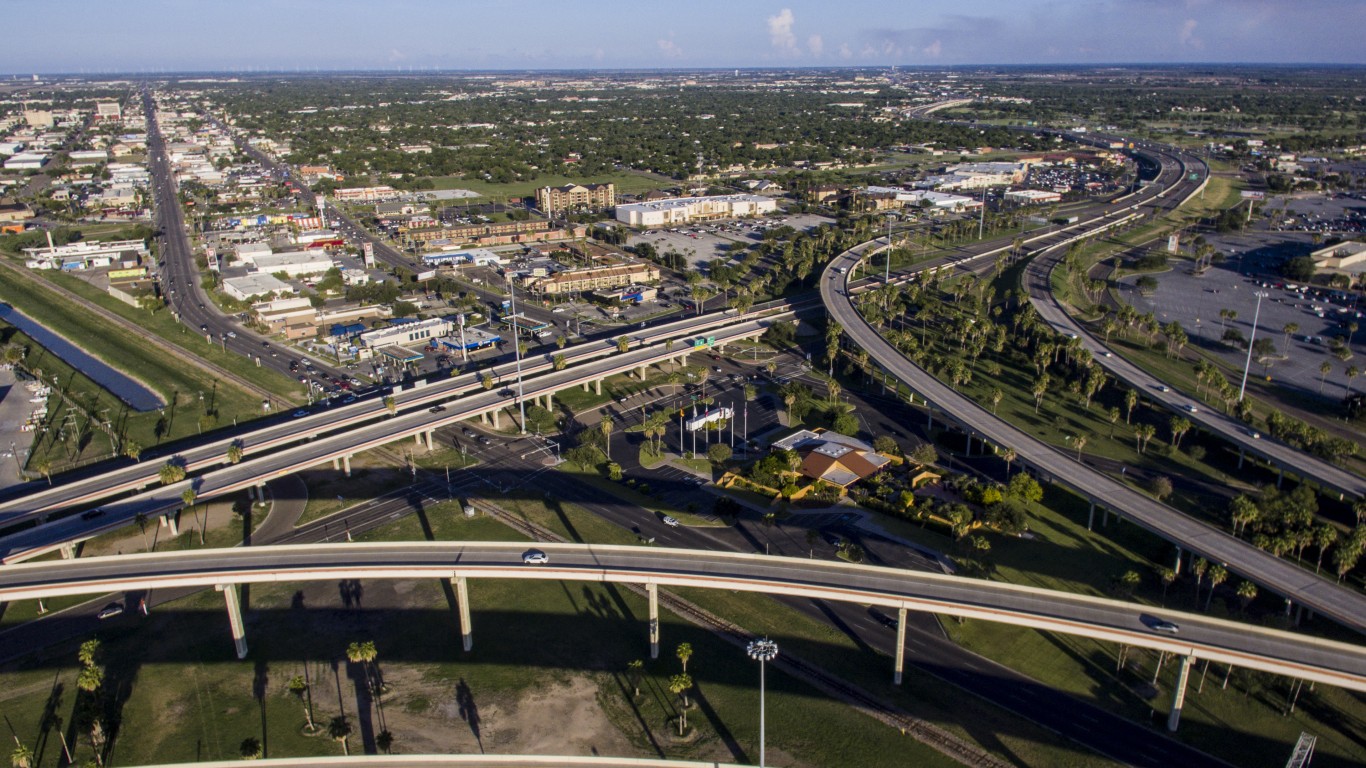
25. Harlingen, Texas
> Change in reported property crime rate, 2019-2020: -1,065.2
> Property crimes reported in 2020: 2,437 — 243rd highest of 1,037 cities
> Property crimes reported in 2019: 3,152 — 197th highest of 1,037 cities
> Property crimes per 100K people in 2020: 3,748.4 — 109th highest of 1,037 cities
> Property crimes per 100K people in 2019: 4,813.6 — 54th highest of 1,037 cities
> Population: 65,129
[in-text-ad]

24. Cutler Bay, Florida
> Change in reported property crime rate, 2019-2020: -1,075.9
> Property crimes reported in 2020: 814 — 356th lowest of 1,037 cities
> Property crimes reported in 2019: 1,328 — 501st highest of 1,037 cities (tied)
> Property crimes per 100K people in 2020: 1,845.9 — 452nd lowest of 1,037 cities
> Property crimes per 100K people in 2019: 2,921.8 — 307th highest of 1,037 cities
> Population: 44,222
[recirclink id=1015043]

23. Detroit, Michigan
> Change in reported property crime rate, 2019-2020: -1,092.3
> Property crimes reported in 2020: 21,178 — 22nd highest of 1,037 cities
> Property crimes reported in 2019: 28,550 — 16th highest of 1,037 cities
> Property crimes per 100K people in 2020: 3,210.7 — 189th highest of 1,037 cities
> Property crimes per 100K people in 2019: 4,302.9 — 85th highest of 1,037 cities
> Population: 674,841

22. Juneau, Alaska
> Change in reported property crime rate, 2019-2020: -1,098.4
> Property crimes reported in 2020: 946 — 424th lowest of 1,037 cities
> Property crimes reported in 2019: 1,292 — 513th highest of 1,037 cities
> Property crimes per 100K people in 2020: 2,963.2 — 245th highest of 1,037 cities
> Property crimes per 100K people in 2019: 4,061.6 — 107th highest of 1,037 cities
> Population: 32,227
[in-text-ad-2]

21. Warren, Ohio
> Change in reported property crime rate, 2019-2020: -1,098.5
> Property crimes reported in 2020: 1,073 — 473rd lowest of 1,037 cities
> Property crimes reported in 2019: 1,478 — 445th highest of 1,037 cities
> Property crimes per 100K people in 2020: 2,789.8 — 284th highest of 1,037 cities
> Property crimes per 100K people in 2019: 3,888.2 — 125th highest of 1,037 cities
> Population: 39,307

20. Eureka, California
> Change in reported property crime rate, 2019-2020: -1,099.7
> Property crimes reported in 2020: 1,041 — 464th lowest of 1,037 cities
> Property crimes reported in 2019: 1,350 — 489th highest of 1,037 cities
> Property crimes per 100K people in 2020: 3,905.3 — 95th highest of 1,037 cities
> Property crimes per 100K people in 2019: 5,005.0 — 48th highest of 1,037 cities
> Population: 26,966
[in-text-ad]

19. San Francisco, California
> Change in reported property crime rate, 2019-2020: -1,111.2
> Property crimes reported in 2020: 38,737 — 6th highest of 1,037 cities
> Property crimes reported in 2019: 48,780 — 5th highest of 1,037 cities
> Property crimes per 100K people in 2020: 4,394.4 — 61st highest of 1,037 cities
> Property crimes per 100K people in 2019: 5,505.6 — 27th highest of 1,037 cities
> Population: 874,961
[recirclink id=1030620]

18. Santa Clara, California
> Change in reported property crime rate, 2019-2020: -1,118.4
> Property crimes reported in 2020: 3,301 — 164th highest of 1,037 cities
> Property crimes reported in 2019: 4,748 — 107th highest of 1,037 cities
> Property crimes per 100K people in 2020: 2,501.2 — 359th highest of 1,037 cities
> Property crimes per 100K people in 2019: 3,619.6 — 165th highest of 1,037 cities
> Population: 127,721

17. Oakland, California
> Change in reported property crime rate, 2019-2020: -1,254.9
> Property crimes reported in 2020: 22,622 — 21st highest of 1,037 cities
> Property crimes reported in 2019: 27,868 — 17th highest of 1,037 cities
> Property crimes per 100K people in 2020: 5,165.7 — 23rd highest of 1,037 cities
> Property crimes per 100K people in 2019: 6,420.7 — 10th highest of 1,037 cities
> Population: 425,097
[in-text-ad-2]

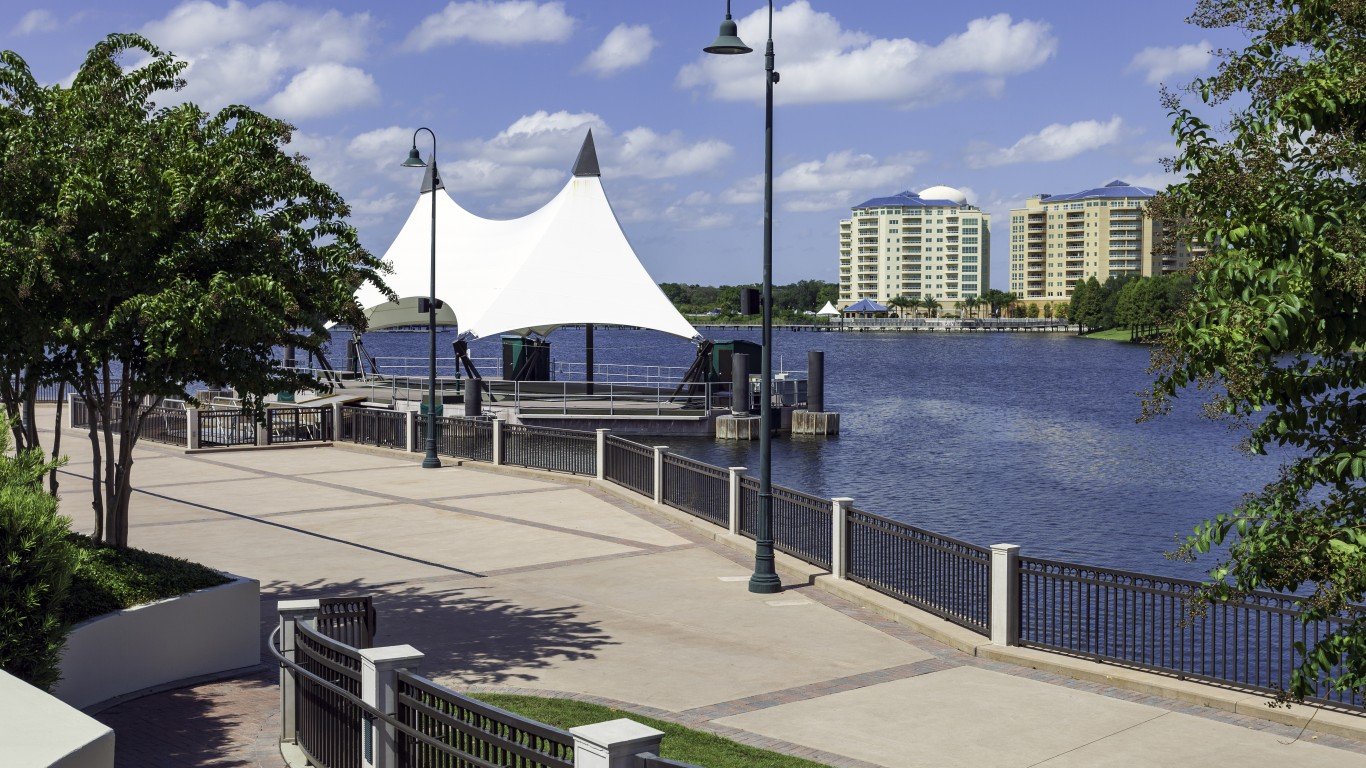
16. Sanford, Florida
> Change in reported property crime rate, 2019-2020: -1,256.6
> Property crimes reported in 2020: 1,396 — 433rd highest of 1,037 cities
> Property crimes reported in 2019: 2,127 — 301st highest of 1,037 cities (tied)
> Property crimes per 100K people in 2020: 2,239.3 — 449th highest of 1,037 cities
> Property crimes per 100K people in 2019: 3,495.8 — 184th highest of 1,037 cities
> Population: 59,700

15. Little Rock, Arkansas
> Change in reported property crime rate, 2019-2020: -1,264.9
> Property crimes reported in 2020: 9,602 — 53rd highest of 1,037 cities
> Property crimes reported in 2019: 12,145 — 41st highest of 1,037 cities
> Property crimes per 100K people in 2020: 4,857.1 — 34th highest of 1,037 cities
> Property crimes per 100K people in 2019: 6,122.0 — 14th highest of 1,037 cities
> Population: 197,958
[in-text-ad]

14. Miami Gardens, Florida
> Change in reported property crime rate, 2019-2020: -1,272.5
> Property crimes reported in 2020: 2,775 — 212th highest of 1,037 cities
> Property crimes reported in 2019: 4,311 — 124th highest of 1,037 cities
> Property crimes per 100K people in 2020: 2,516.2 — 355th highest of 1,037 cities
> Property crimes per 100K people in 2019: 3,788.7 — 138th highest of 1,037 cities
> Population: 111,363
[recirclink id=1033410]

13. Portsmouth, Virginia
> Change in reported property crime rate, 2019-2020: -1,321.1
> Property crimes reported in 2020: 4,277 — 118th highest of 1,037 cities
> Property crimes reported in 2019: 5,509 — 91st highest of 1,037 cities
> Property crimes per 100K people in 2020: 4,540.1 — 52nd highest of 1,037 cities
> Property crimes per 100K people in 2019: 5,861.2 — 18th highest of 1,037 cities
> Population: 95,097

12. Hot Springs, Arkansas
> Change in reported property crime rate, 2019-2020: -1,324.1
> Property crimes reported in 2020: 2,276 — 265th highest of 1,037 cities
> Property crimes reported in 2019: 2,674 — 233rd highest of 1,037 cities
> Property crimes per 100K people in 2020: 5,852.0 — 13th highest of 1,037 cities
> Property crimes per 100K people in 2019: 7,176.0 — 6th highest of 1,037 cities
> Population: 38,559
[in-text-ad-2]

11. Dover, Delaware
> Change in reported property crime rate, 2019-2020: -1,331.3
> Property crimes reported in 2020: 1,549 — 394th highest of 1,037 cities
> Property crimes reported in 2019: 2,057 — 317th highest of 1,037 cities
> Property crimes per 100K people in 2020: 4,030.9 — 88th highest of 1,037 cities
> Property crimes per 100K people in 2019: 5,362.2 — 28th highest of 1,037 cities
> Population: 37,523

10. San Bernardino, California
> Change in reported property crime rate, 2019-2020: -1,389.9
> Property crimes reported in 2020: 6,059 — 78th highest of 1,037 cities
> Property crimes reported in 2019: 9,081 — 58th highest of 1,037 cities
> Property crimes per 100K people in 2020: 2,800.4 — 280th highest of 1,037 cities
> Property crimes per 100K people in 2019: 4,190.3 — 98th highest of 1,037 cities
> Population: 216,089
[in-text-ad]

9. El Cerrito, California
> Change in reported property crime rate, 2019-2020: -1,408.6
> Property crimes reported in 2020: 931 — 417th lowest of 1,037 cities
> Property crimes reported in 2019: 1,300 — 507th highest of 1,037 cities (tied)
> Property crimes per 100K people in 2020: 3,619.0 — 125th highest of 1,037 cities
> Property crimes per 100K people in 2019: 5,027.7 — 47th highest of 1,037 cities
> Population: 25,398
[recirclink id=1039645]
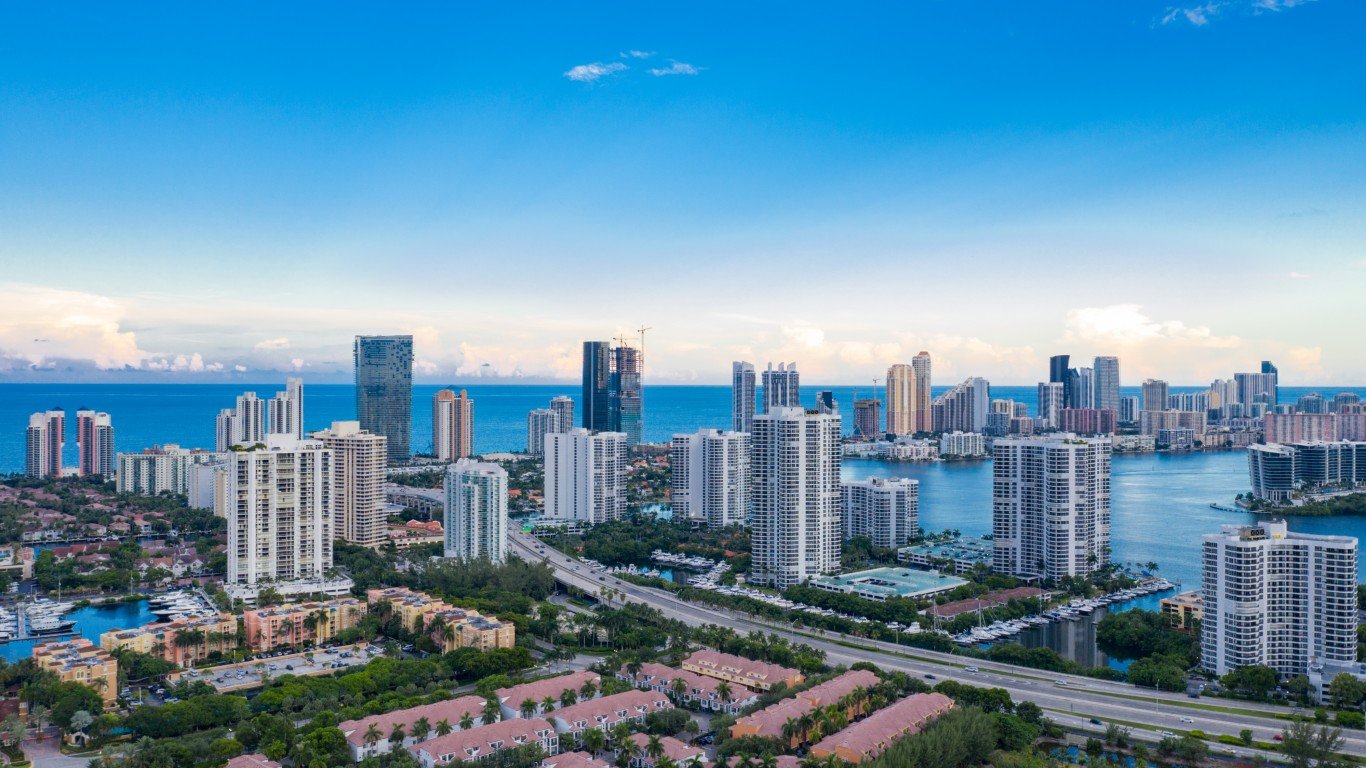
8. Aventura, Florida
> Change in reported property crime rate, 2019-2020: -1,424.5
> Property crimes reported in 2020: 1,232 — 487th highest of 1,037 cities
> Property crimes reported in 2019: 1,815 — 371st highest of 1,037 cities
> Property crimes per 100K people in 2020: 3,319.5 — 170th highest of 1,037 cities
> Property crimes per 100K people in 2019: 4,744.0 — 57th highest of 1,037 cities
> Population: 37,303

7. Federal Way, Washington
> Change in reported property crime rate, 2019-2020: -1,629.2
> Property crimes reported in 2020: 2,542 — 230th highest of 1,037 cities
> Property crimes reported in 2019: 4,164 — 137th highest of 1,037 cities
> Property crimes per 100K people in 2020: 2,618.7 — 326th highest of 1,037 cities
> Property crimes per 100K people in 2019: 4,247.9 — 92nd highest of 1,037 cities
> Population: 96,526
[in-text-ad-2]
6. Paramus, New Jersey
> Change in reported property crime rate, 2019-2020: -1,738.0
> Property crimes reported in 2020: 455 — 155th lowest of 1,037 cities
> Property crimes reported in 2019: 919 — 371st lowest of 1,037 cities
> Property crimes per 100K people in 2020: 1,735.2 — 410th lowest of 1,037 cities
> Property crimes per 100K people in 2019: 3,473.2 — 191st highest of 1,037 cities
> Population: 26,503

5. Alexandria, Louisiana
> Change in reported property crime rate, 2019-2020: -1,751.1
> Property crimes reported in 2020: 3,317 — 162nd highest of 1,037 cities
> Property crimes reported in 2019: 4,180 — 136th highest of 1,037 cities
> Property crimes per 100K people in 2020: 7,213.1 — 4th highest of 1,037 cities
> Property crimes per 100K people in 2019: 8,964.2 — 2nd highest of 1,037 cities
> Population: 47,012
[in-text-ad]

4. West Hollywood, California
> Change in reported property crime rate, 2019-2020: -1,824.2
> Property crimes reported in 2020: 1,205 — 499th highest of 1,037 cities (tied)
> Property crimes reported in 2019: 1,898 — 348th highest of 1,037 cities
> Property crimes per 100K people in 2020: 3,281.7 — 179th highest of 1,037 cities
> Property crimes per 100K people in 2019: 5,105.9 — 43rd highest of 1,037 cities
> Population: 36,450
[recirclink id=1055273]

3. Miami Beach, Florida
> Change in reported property crime rate, 2019-2020: -1,829.1
> Property crimes reported in 2020: 5,109 — 95th highest of 1,037 cities
> Property crimes reported in 2019: 6,977 — 76th highest of 1,037 cities
> Property crimes per 100K people in 2020: 5,739.4 — 16th highest of 1,037 cities
> Property crimes per 100K people in 2019: 7,568.5 — 3rd highest of 1,037 cities
> Population: 90,108

2. Atlantic City, New Jersey
> Change in reported property crime rate, 2019-2020: -1,925.5
> Property crimes reported in 2020: 1,013 — 453rd lowest of 1,037 cities
> Property crimes reported in 2019: 1,738 — 384th highest of 1,037 cities (tied)
> Property crimes per 100K people in 2020: 2,697.7 — 311th highest of 1,037 cities
> Property crimes per 100K people in 2019: 4,623.2 — 62nd highest of 1,037 cities
> Population: 37,999
[in-text-ad-2]

1. Myrtle Beach, South Carolina
> Change in reported property crime rate, 2019-2020: -2,517.4
> Property crimes reported in 2020: 3,108 — 181st highest of 1,037 cities
> Property crimes reported in 2019: 3,916 — 149th highest of 1,037 cities
> Property crimes per 100K people in 2020: 8,716.1 — 2nd highest of 1,037 cities
> Property crimes per 100K people in 2019: 11,233.5 — the highest of 1,037 cities
> Population: 32,700
Methodology
To determine the cities where property crime is falling fastest, 24/7 Wall St. reviewed the change in property crimes per 100,000 people from the FBI’s 2019 and 2020 Uniform Crime Reports. Property crime includes larceny-theft, burglary, and motor vehicle theft. Crime rates were calculated using population figures provided by the FBI in the 2020 and 2019 UCR.
Limited data was available in the 2020 UCR for areas in Alabama, Maryland, Pennsylvania, and Illinois, though cities in these states were not excluded from analysis. Because some state and local agencies changed reporting practices between 2019 and 2020, the figures are not comparable, and these areas were excluded.
To concentrate on urban areas, we excluded places with fewer than 25,000 people based on five-year estimates from the U.S. Census Bureau’s 2019 American Community Survey.
Contact [email protected] for any questions or corrections.