Burglary – defined as the unlawful entry of a structure, such as a home or business, to commit a theft or felony – is the most serious nonviolent offense tracked by the FBI. There were just over 1 million burglaries reported in the United States in 2020, a 7% decline from the previous year.
Most burglaries in the U.S. are committed in residential properties, and more often during the day than at night. These crimes are typically committed for monetary gain and result in billions of dollars in stolen property each year. Not only do victims of burglaries typically suffer material loss, but they can also be impacted psychologically. Many burglary victims have reported heightened anxiety, difficulty sleeping, feelings of vulnerability, and even post-traumatic stress disorder in some cases.
While the burglary rates have been declining in most of the country, some U.S. cities are bucking the national trend, reporting a year-over-year surge in break-ins. Here is a look at the American cities with the most break-ins.
Using data from the FBI’s 2020 Uniform Crime Report, 24/7 Wall St. identified the 50 cities where the burglary rate is rising fastest. Cities – defined as places with at least 25,000 people – are ranked by the year-over-year change in the number of burglaries reported for every 100,000 people.
Among the cities on this list, burglary rates have climbed anywhere from 125 incidents for every 100,000 people to 408 per 100,000. Nationwide, the burglary rate fell by 26 incidents per 100,000 people. Most of the cities on this list are in the West, including 12 in Washington state alone.
In nearly every city on this list, the burglary rate exceeds the national rate of 314 per 100,000 people. Burglary – along with vehicle theft and larceny – is one component of the overall property crime category. In most cities on this list, the property crime rate also climbed in the last year. Here is a look at the states where property crime is soaring.
Click here to see the cities where the burglary rate is soaring
Click here to read our detailed methodology
50. Aberdeen, South Dakota
> Change in reported burglary rate, 2019-2020: +124.7
> Burglaries reported in 2020: 151 — 555th lowest of 1,114 cities (tied)
> Burglaries per 100K people in 2020: 529.9 — 163rd highest of 1,114 cities
> 1-yr. change in all property crime per 100K people: +158.6 — 174th highest of 1,037 cities
> Property crimes per 100K people in 2020: 2,337.3 — 407th highest of 1,038 cities
> Population: 28,225
[in-text-ad]

49. Fremont, California
> Change in reported burglary rate, 2019-2020: +126.6
> Burglaries reported in 2020: 864 — 90th highest of 1,114 cities
> Burglaries per 100K people in 2020: 353.7 — 385th highest of 1,114 cities
> 1-yr. change in all property crime per 100K people: +465.0 — 44th highest of 1,037 cities
> Property crimes per 100K people in 2020: 2,342.6 — 403rd highest of 1,038 cities
> Population: 235,740
[recirclink id=1059954]

48. Salt Lake City, Utah
> Change in reported burglary rate, 2019-2020: +126.9
> Burglaries reported in 2020: 1,545 — 49th highest of 1,114 cities
> Burglaries per 100K people in 2020: 764.1 — 57th highest of 1,114 cities
> 1-yr. change in all property crime per 100K people: +1,694.7 — 2nd highest of 1,037 cities
> Property crimes per 100K people in 2020: 7,352.1 — 3rd highest of 1,038 cities
> Population: 197,756

47. Syracuse, New York
> Change in reported burglary rate, 2019-2020: +130.0
> Burglaries reported in 2020: 1,032 — 79th highest of 1,114 cities
> Burglaries per 100K people in 2020: 726.7 — 72nd highest of 1,114 cities
> 1-yr. change in all property crime per 100K people: -311.0 — 309th lowest of 1,037 cities
> Property crimes per 100K people in 2020: 2,823.0 — 276th highest of 1,038 cities
> Population: 142,874
[in-text-ad-2]

46. Arvada, Colorado
> Change in reported burglary rate, 2019-2020: +135.2
> Burglaries reported in 2020: 484 — 165th highest of 1,114 cities
> Burglaries per 100K people in 2020: 393.6 — 312th highest of 1,114 cities
> 1-yr. change in all property crime per 100K people: +186.2 — 147th highest of 1,037 cities
> Property crimes per 100K people in 2020: 3,163.9 — 202nd highest of 1,038 cities
> Population: 118,746

45. Longview, Washington
> Change in reported burglary rate, 2019-2020: +138.6
> Burglaries reported in 2020: 214 — 416th highest of 1,114 cities (tied)
> Burglaries per 100K people in 2020: 554.0 — 144th highest of 1,114 cities
> 1-yr. change in all property crime per 100K people: +217.5 — 128th highest of 1,037 cities
> Property crimes per 100K people in 2020: 3,096.1 — 216th highest of 1,038 cities
> Population: 37,520
[in-text-ad]
44. Bettendorf, Iowa
> Change in reported burglary rate, 2019-2020: +141.0
> Burglaries reported in 2020: 114 — 439th lowest of 1,114 cities (tied)
> Burglaries per 100K people in 2020: 308.7 — 471st highest of 1,114 cities
> 1-yr. change in all property crime per 100K people: +264.3 — 103rd highest of 1,037 cities
> Property crimes per 100K people in 2020: 1,546.3 — 325th lowest of 1,038 cities
> Population: 35,919
[recirclink id=1066891]

43. Fullerton, California
> Change in reported burglary rate, 2019-2020: +141.5
> Burglaries reported in 2020: 512 — 158th highest of 1,114 cities
> Burglaries per 100K people in 2020: 368.3 — 363rd highest of 1,114 cities
> 1-yr. change in all property crime per 100K people: +148.6 — 181st highest of 1,037 cities
> Property crimes per 100K people in 2020: 2,400.5 — 389th highest of 1,038 cities
> Population: 139,611

42. Racine, Wisconsin
> Change in reported burglary rate, 2019-2020: +144.8
> Burglaries reported in 2020: 321 — 273rd highest of 1,114 cities (tied)
> Burglaries per 100K people in 2020: 419.2 — 287th highest of 1,114 cities
> 1-yr. change in all property crime per 100K people: +522.3 — 33rd highest of 1,037 cities
> Property crimes per 100K people in 2020: 1,803.5 — 439th lowest of 1,038 cities
> Population: 77,081
[in-text-ad-2]
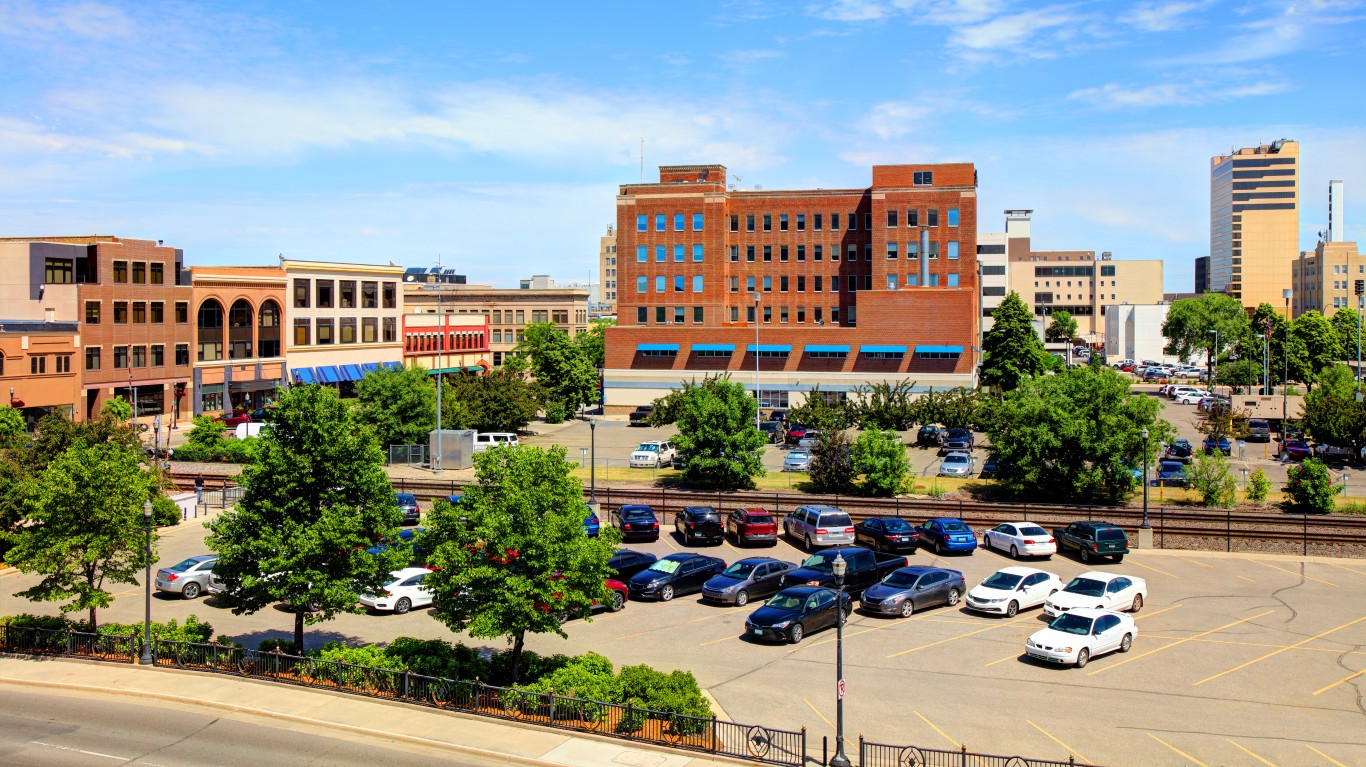
41. Fargo, North Dakota
> Change in reported burglary rate, 2019-2020: +149.1
> Burglaries reported in 2020: 1,016 — 80th highest of 1,114 cities
> Burglaries per 100K people in 2020: 800.5 — 44th highest of 1,114 cities
> 1-yr. change in all property crime per 100K people: +347.0 — 74th highest of 1,037 cities
> Property crimes per 100K people in 2020: 3,468.9 — 145th highest of 1,038 cities
> Population: 121,889

40. Edmonds, Washington
> Change in reported burglary rate, 2019-2020: +150.7
> Burglaries reported in 2020: 202 — 439th highest of 1,114 cities (tied)
> Burglaries per 100K people in 2020: 470.5 — 222nd highest of 1,114 cities
> 1-yr. change in all property crime per 100K people: +690.8 — 23rd highest of 1,037 cities
> Property crimes per 100K people in 2020: 2,797.3 — 282nd highest of 1,038 cities
> Population: 42,040
[in-text-ad]

39. Lake Oswego, Oregon
> Change in reported burglary rate, 2019-2020: +150.9
> Burglaries reported in 2020: 116 — 450th lowest of 1,114 cities (tied)
> Burglaries per 100K people in 2020: 288.8 — 515th highest of 1,114 cities
> 1-yr. change in all property crime per 100K people: +434.6 — 48th highest of 1,037 cities
> Property crimes per 100K people in 2020: 1,640.5 — 364th lowest of 1,038 cities
> Population: 39,127
[recirclink id=1023032]

38. Los Gatos, California
> Change in reported burglary rate, 2019-2020: +155.2
> Burglaries reported in 2020: 103 — 400th lowest of 1,114 cities (tied)
> Burglaries per 100K people in 2020: 340.3 — 407th highest of 1,114 cities
> 1-yr. change in all property crime per 100K people: -19.5 — 365th highest of 1,037 cities
> Property crimes per 100K people in 2020: 1,341.2 — 235th lowest of 1,038 cities
> Population: 30,729

37. Bismarck, North Dakota
> Change in reported burglary rate, 2019-2020: +156.2
> Burglaries reported in 2020: 343 — 252nd highest of 1,114 cities (tied)
> Burglaries per 100K people in 2020: 457.4 — 238th highest of 1,114 cities
> 1-yr. change in all property crime per 100K people: +511.9 — 34th highest of 1,037 cities
> Property crimes per 100K people in 2020: 3,294.8 — 177th highest of 1,038 cities
> Population: 72,777
[in-text-ad-2]
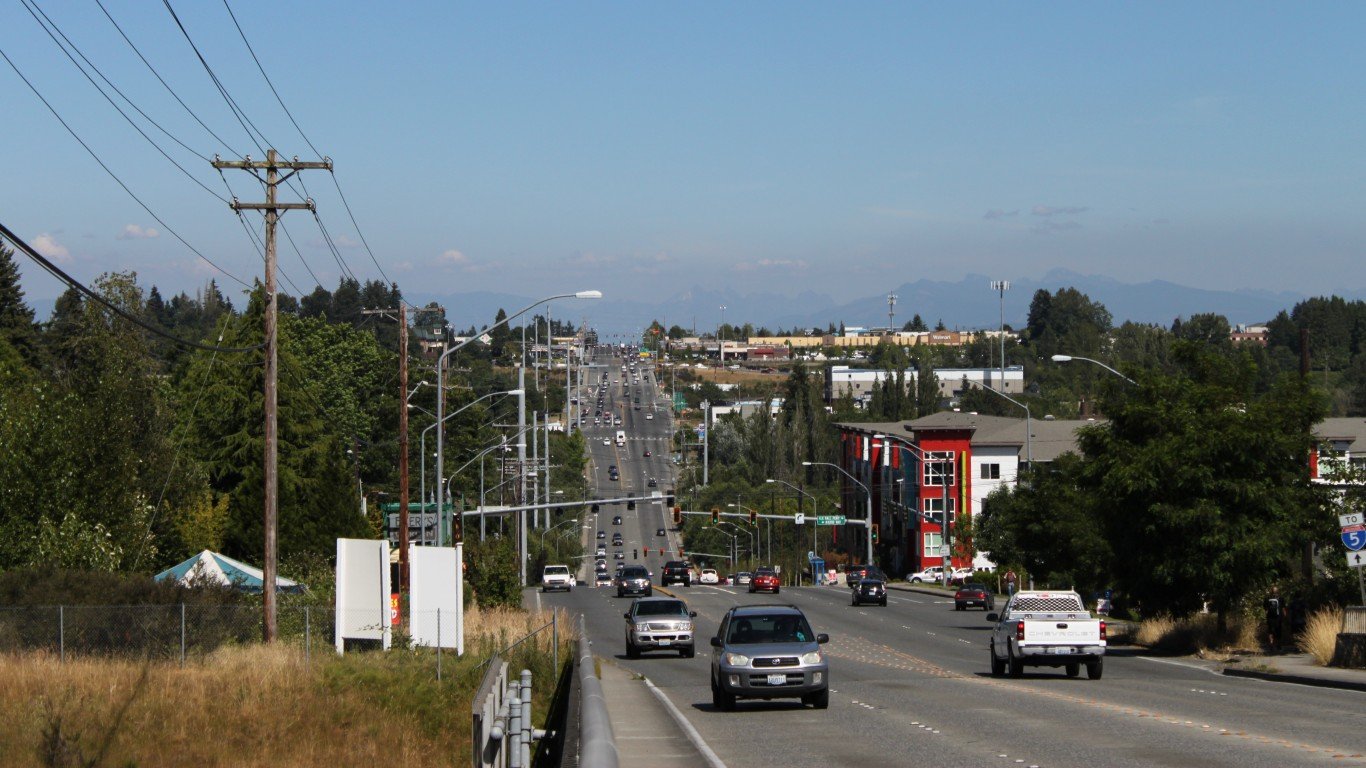
36. Lynnwood, Washington
> Change in reported burglary rate, 2019-2020: +158.2
> Burglaries reported in 2020: 210 — 424th highest of 1,114 cities (tied)
> Burglaries per 100K people in 2020: 531.4 — 161st highest of 1,114 cities
> 1-yr. change in all property crime per 100K people: -632.6 — 102nd lowest of 1,037 cities
> Property crimes per 100K people in 2020: 4,142.5 — 78th highest of 1,038 cities
> Population: 38,143
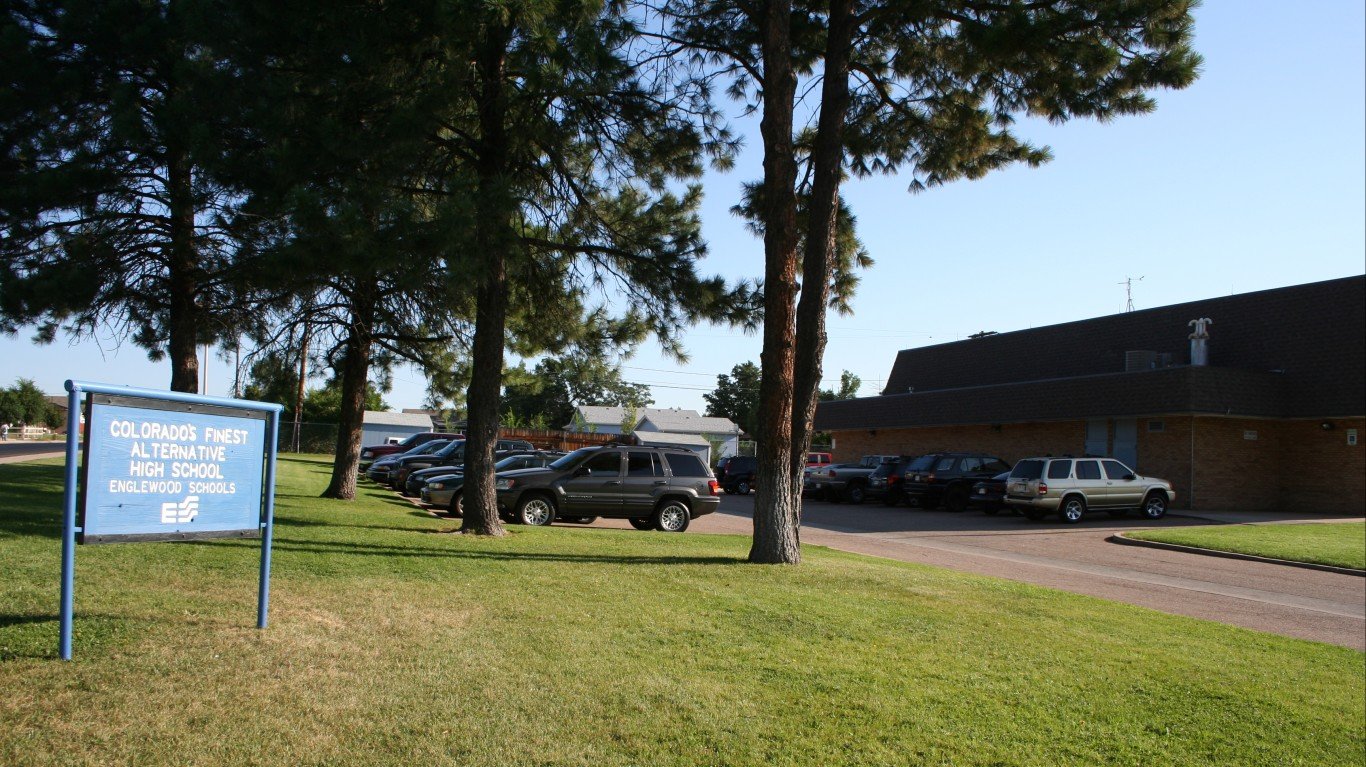
35. Englewood, Colorado
> Change in reported burglary rate, 2019-2020: +159.1
> Burglaries reported in 2020: 165 — 515th highest of 1,114 cities (tied)
> Burglaries per 100K people in 2020: 465.3 — 229th highest of 1,114 cities
> 1-yr. change in all property crime per 100K people: +442.8 — 47th highest of 1,037 cities
> Property crimes per 100K people in 2020: 5,667.7 — 17th highest of 1,038 cities
> Population: 34,259
[in-text-ad]

34. Kennewick, Washington
> Change in reported burglary rate, 2019-2020: +159.6
> Burglaries reported in 2020: 521 — 152nd highest of 1,114 cities
> Burglaries per 100K people in 2020: 609.2 — 118th highest of 1,114 cities
> 1-yr. change in all property crime per 100K people: +357.8 — 68th highest of 1,037 cities
> Property crimes per 100K people in 2020: 3,316.0 — 171st highest of 1,038 cities
> Population: 81,479
[recirclink id=1030620]
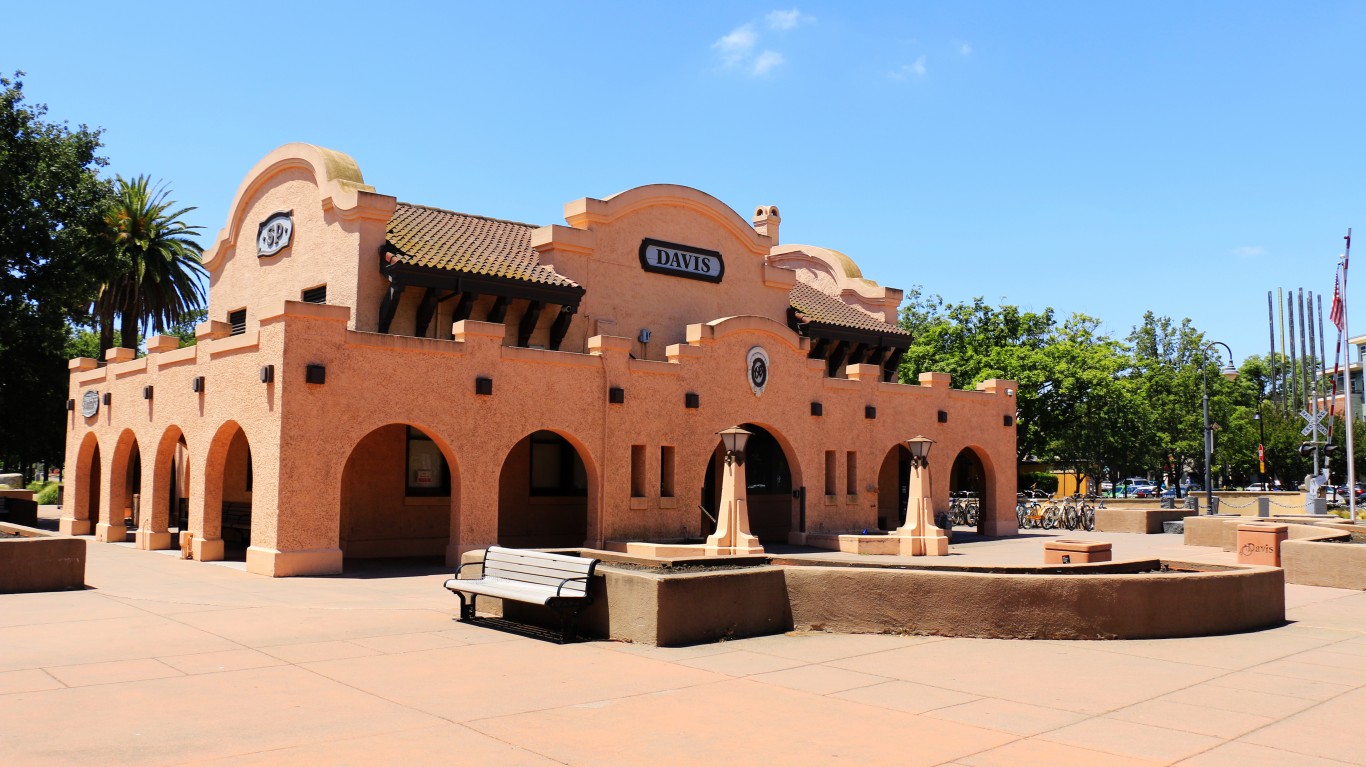
33. Davis, California
> Change in reported burglary rate, 2019-2020: +159.9
> Burglaries reported in 2020: 386 — 225th highest of 1,114 cities
> Burglaries per 100K people in 2020: 552.6 — 146th highest of 1,114 cities
> 1-yr. change in all property crime per 100K people: +371.2 — 63rd highest of 1,037 cities
> Property crimes per 100K people in 2020: 3,510.2 — 142nd highest of 1,038 cities
> Population: 68,543
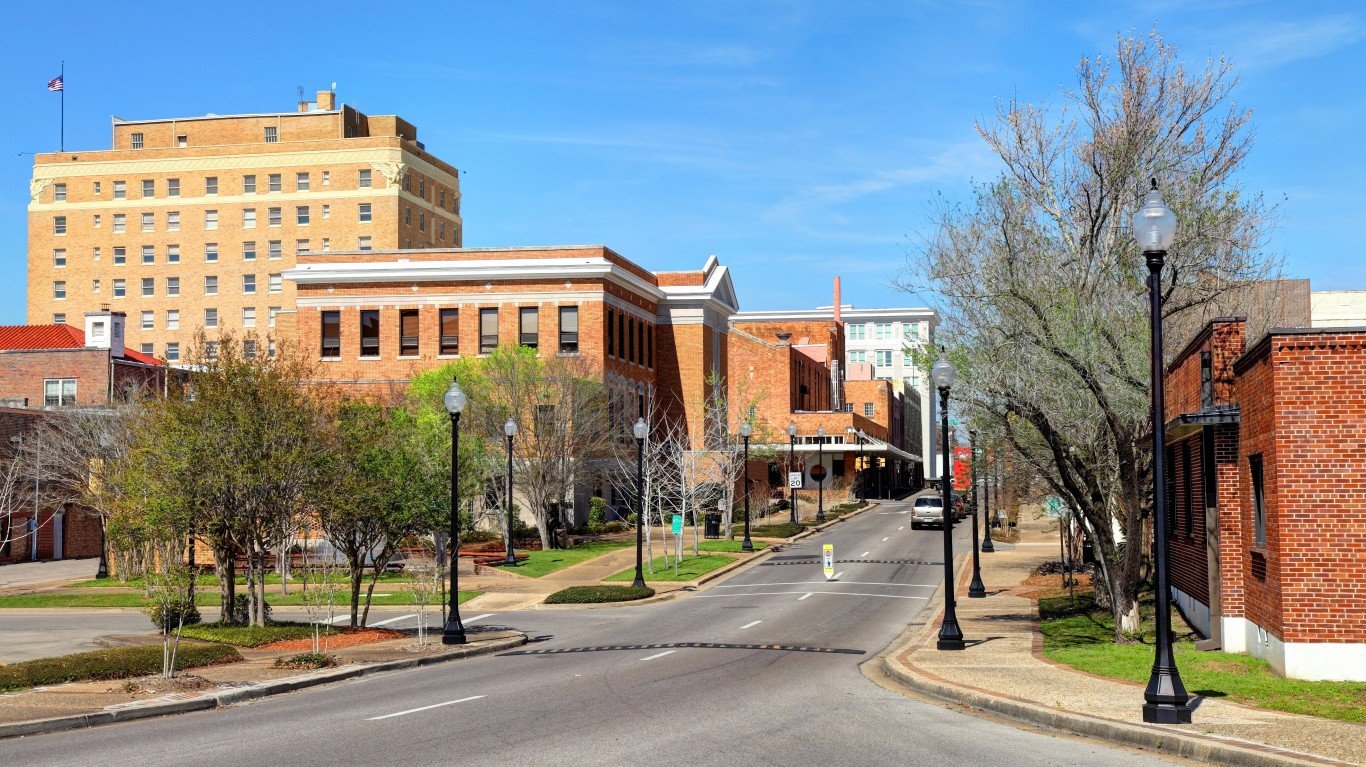
32. Hattiesburg, Mississippi
> Change in reported burglary rate, 2019-2020: +160.4
> Burglaries reported in 2020: 342 — 255th highest of 1,114 cities
> Burglaries per 100K people in 2020: 745.6 — 64th highest of 1,114 cities
> 1-yr. change in all property crime per 100K people: +779.5 — 18th highest of 1,037 cities
> Property crimes per 100K people in 2020: 5,271.4 — 21st highest of 1,038 cities
> Population: 46,098
[in-text-ad-2]
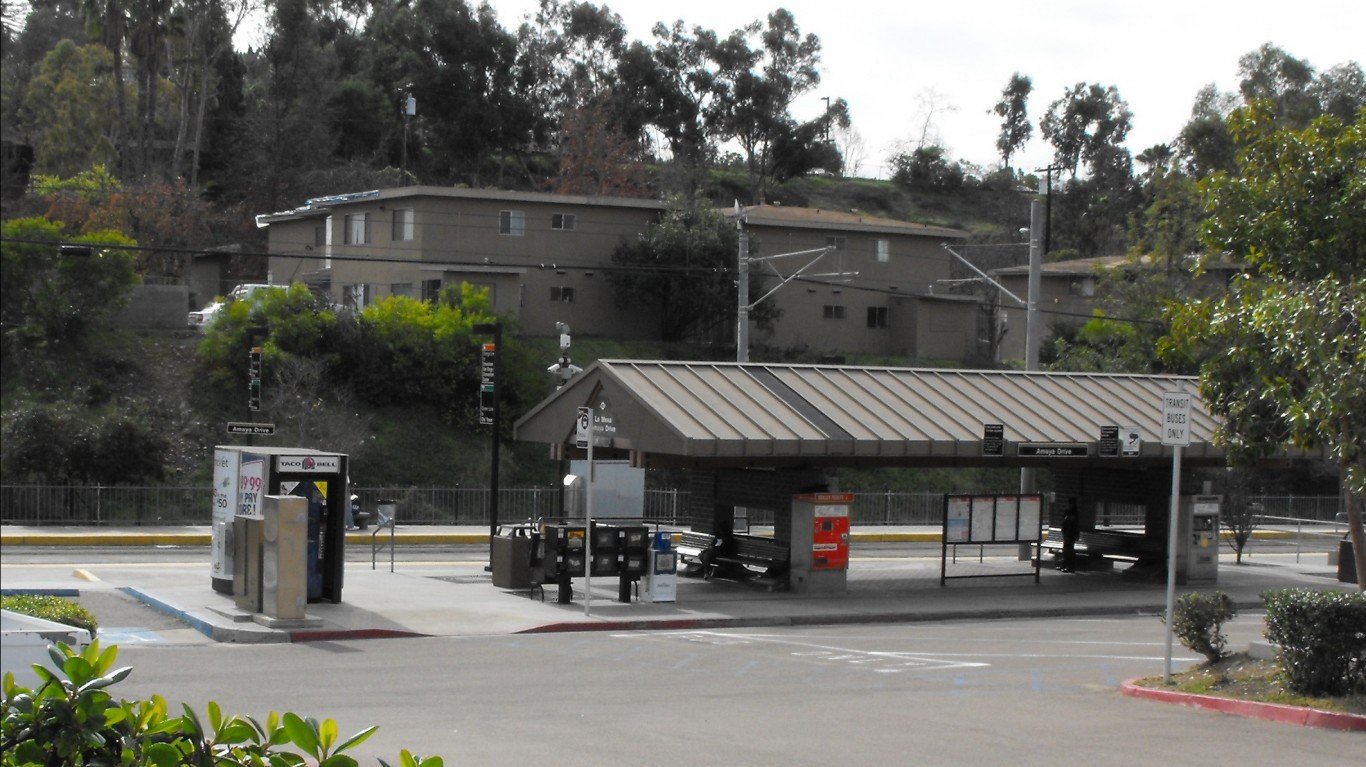
31. La Mesa, California
> Change in reported burglary rate, 2019-2020: +161.2
> Burglaries reported in 2020: 233 — 385th highest of 1,114 cities (tied)
> Burglaries per 100K people in 2020: 391.7 — 316th highest of 1,114 cities
> 1-yr. change in all property crime per 100K people: +71.1 — 255th highest of 1,037 cities
> Property crimes per 100K people in 2020: 1,741.5 — 415th lowest of 1,038 cities
> Population: 59,556

30. Denver, Colorado
> Change in reported burglary rate, 2019-2020: +163.8
> Burglaries reported in 2020: 5,223 — 12th highest of 1,114 cities
> Burglaries per 100K people in 2020: 708.0 — 76th highest of 1,114 cities
> 1-yr. change in all property crime per 100K people: +905.2 — 7th highest of 1,037 cities
> Property crimes per 100K people in 2020: 4,648.7 — 45th highest of 1,038 cities
> Population: 705,576
[in-text-ad]
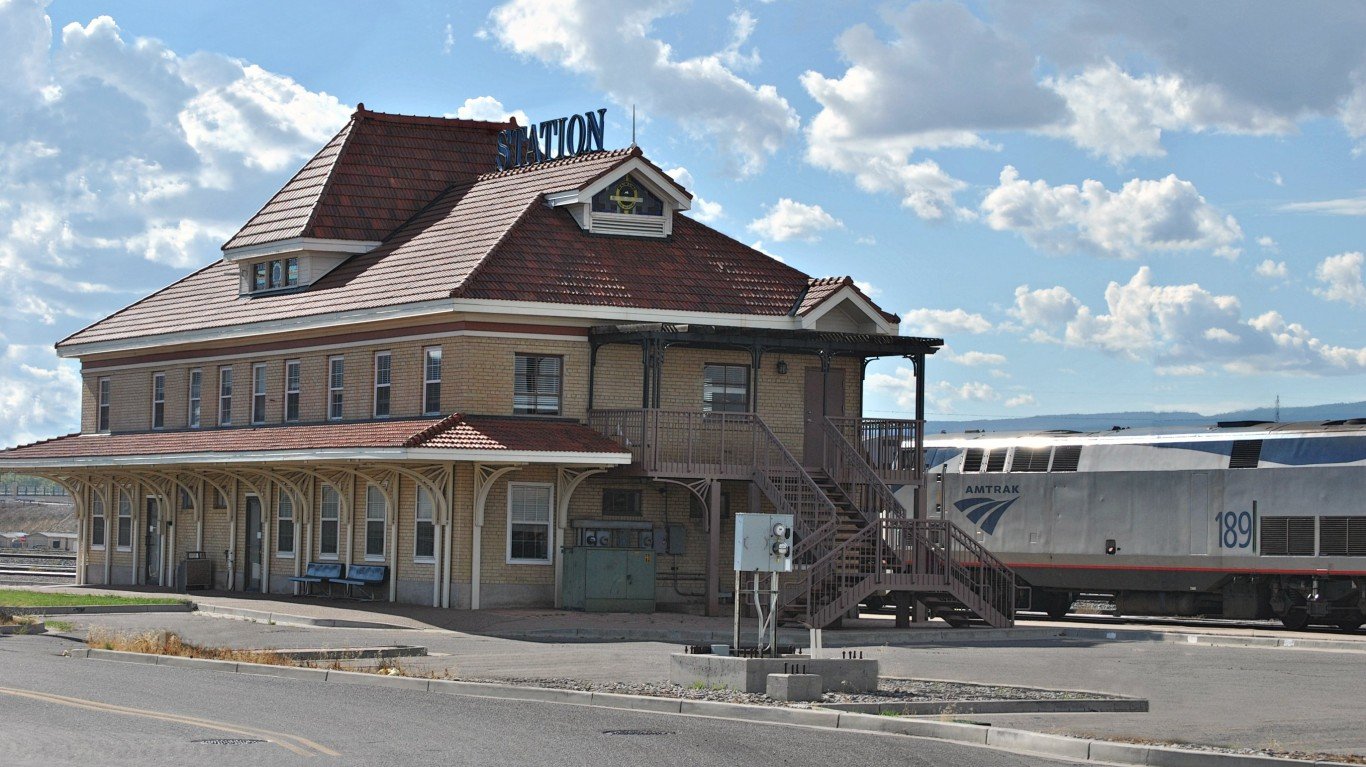
29. Grand Junction, Colorado
> Change in reported burglary rate, 2019-2020: +165.4
> Burglaries reported in 2020: 385 — 226th highest of 1,114 cities
> Burglaries per 100K people in 2020: 600.2 — 121st highest of 1,114 cities
> 1-yr. change in all property crime per 100K people: +772.1 — 19th highest of 1,037 cities
> Property crimes per 100K people in 2020: 4,623.6 — 48th highest of 1,038 cities
> Population: 62,062
[recirclink id=1020198]
28. Davenport, Iowa
> Change in reported burglary rate, 2019-2020: +168.2
> Burglaries reported in 2020: 912 — 86th highest of 1,114 cities
> Burglaries per 100K people in 2020: 895.8 — 23rd highest of 1,114 cities
> 1-yr. change in all property crime per 100K people: +98.6 — 231st highest of 1,037 cities
> Property crimes per 100K people in 2020: 3,925.1 — 94th highest of 1,038 cities
> Population: 102,169

27. Yakima, Washington
> Change in reported burglary rate, 2019-2020: +172.0
> Burglaries reported in 2020: 599 — 139th highest of 1,114 cities
> Burglaries per 100K people in 2020: 638.2 — 108th highest of 1,114 cities
> 1-yr. change in all property crime per 100K people: +538.9 — 32nd highest of 1,037 cities
> Property crimes per 100K people in 2020: 3,430.6 — 153rd highest of 1,038 cities
> Population: 93,413
[in-text-ad-2]

26. West Fargo, North Dakota
> Change in reported burglary rate, 2019-2020: +178.5
> Burglaries reported in 2020: 184 — 477th highest of 1,114 cities (tied)
> Burglaries per 100K people in 2020: 477.2 — 216th highest of 1,114 cities
> 1-yr. change in all property crime per 100K people: +363.1 — 65th highest of 1,037 cities
> Property crimes per 100K people in 2020: 1,893.1 — 474th lowest of 1,038 cities
> Population: 35,397

25. Columbia, Tennessee
> Change in reported burglary rate, 2019-2020: +182.5
> Burglaries reported in 2020: 202 — 439th highest of 1,114 cities (tied)
> Burglaries per 100K people in 2020: 492.5 — 196th highest of 1,114 cities
> 1-yr. change in all property crime per 100K people: +138.0 — 189th highest of 1,037 cities
> Property crimes per 100K people in 2020: 3,142.9 — 208th highest of 1,038 cities
> Population: 38,380
[in-text-ad]

24. West Hollywood, California
> Change in reported burglary rate, 2019-2020: +186.9
> Burglaries reported in 2020: 281 — 309th highest of 1,114 cities (tied)
> Burglaries per 100K people in 2020: 765.3 — 56th highest of 1,114 cities
> 1-yr. change in all property crime per 100K people: -1,824.2 — 4th lowest of 1,037 cities
> Property crimes per 100K people in 2020: 3,281.7 — 179th highest of 1,038 cities
> Population: 36,450
[recirclink id=1059954]
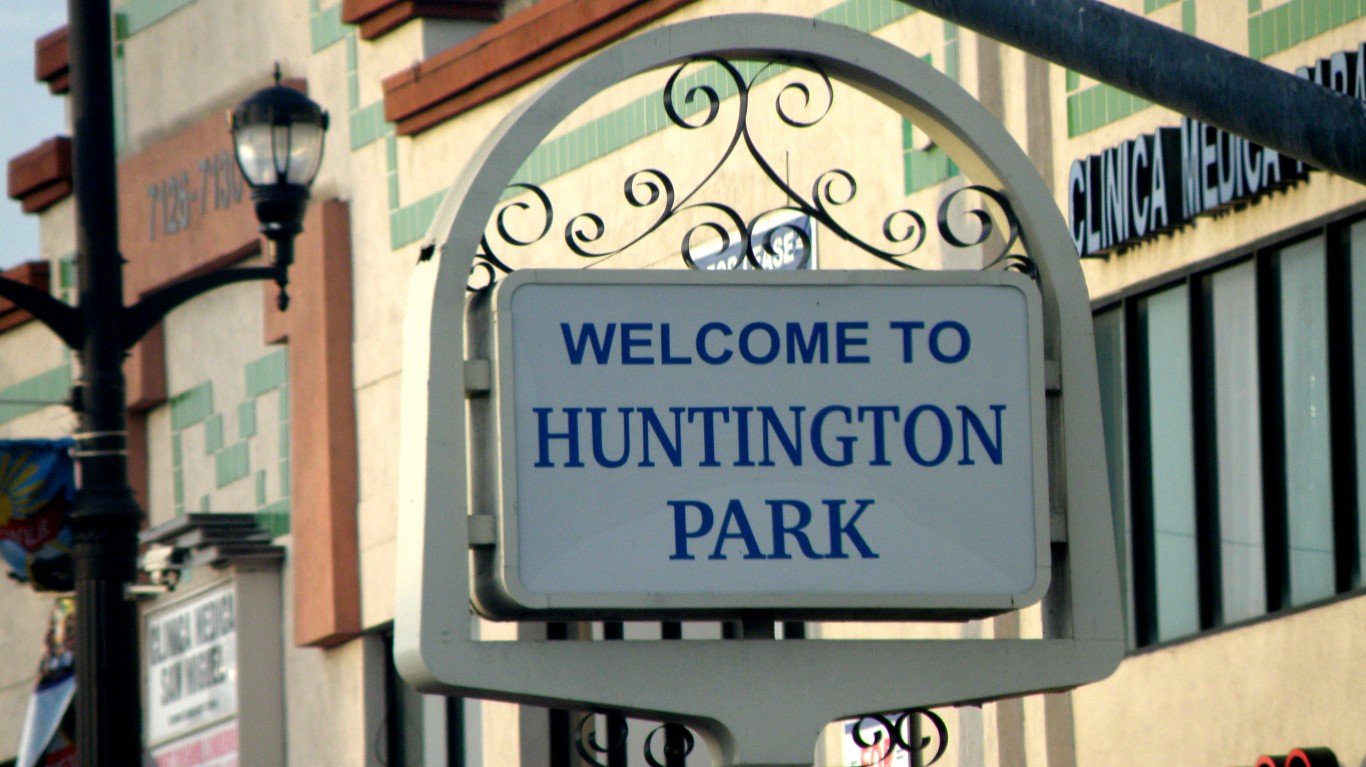
23. Huntington Park, California
> Change in reported burglary rate, 2019-2020: +191.0
> Burglaries reported in 2020: 321 — 273rd highest of 1,114 cities (tied)
> Burglaries per 100K people in 2020: 558.8 — 138th highest of 1,114 cities
> 1-yr. change in all property crime per 100K people: +252.9 — 108th highest of 1,037 cities
> Property crimes per 100K people in 2020: 2,994.3 — 237th highest of 1,038 cities
> Population: 58,353

22. Spokane Valley, Washington
> Change in reported burglary rate, 2019-2020: +196.7
> Burglaries reported in 2020: 691 — 107th highest of 1,114 cities
> Burglaries per 100K people in 2020: 675.0 — 87th highest of 1,114 cities
> 1-yr. change in all property crime per 100K people: -152.5 — 508th lowest of 1,037 cities
> Property crimes per 100K people in 2020: 4,269.0 — 64th highest of 1,038 cities
> Population: 97,562
[in-text-ad-2]

21. Rapid City, South Dakota
> Change in reported burglary rate, 2019-2020: +197.8
> Burglaries reported in 2020: 657 — 116th highest of 1,114 cities
> Burglaries per 100K people in 2020: 837.0 — 37th highest of 1,114 cities
> 1-yr. change in all property crime per 100K people: +782.1 — 16th highest of 1,037 cities
> Property crimes per 100K people in 2020: 3,996.6 — 92nd highest of 1,038 cities
> Population: 75,258

20. Pleasant Hill, California
> Change in reported burglary rate, 2019-2020: +200.7
> Burglaries reported in 2020: 182 — 481st highest of 1,114 cities (tied)
> Burglaries per 100K people in 2020: 519.5 — 168th highest of 1,114 cities
> 1-yr. change in all property crime per 100K people: -359.9 — 270th lowest of 1,037 cities
> Property crimes per 100K people in 2020: 3,865.0 — 98th highest of 1,038 cities
> Population: 34,840
[in-text-ad]

19. Lansing, Michigan
> Change in reported burglary rate, 2019-2020: +203.1
> Burglaries reported in 2020: 1,002 — 81st highest of 1,114 cities
> Burglaries per 100K people in 2020: 844.5 — 35th highest of 1,114 cities
> 1-yr. change in all property crime per 100K people: +184.2 — 149th highest of 1,037 cities
> Property crimes per 100K people in 2020: 3,004.6 — 235th highest of 1,038 cities
> Population: 117,159
[recirclink id=1066891]

18. Danville, Illinois
> Change in reported burglary rate, 2019-2020: +208.0
> Burglaries reported in 2020: 399 — 218th highest of 1,114 cities
> Burglaries per 100K people in 2020: 1,320.8 — 6th highest of 1,114 cities
> 1-yr. change in all property crime per 100K people: N/A
> Property crimes per 100K people in 2020: N/A
> Population: 31,246
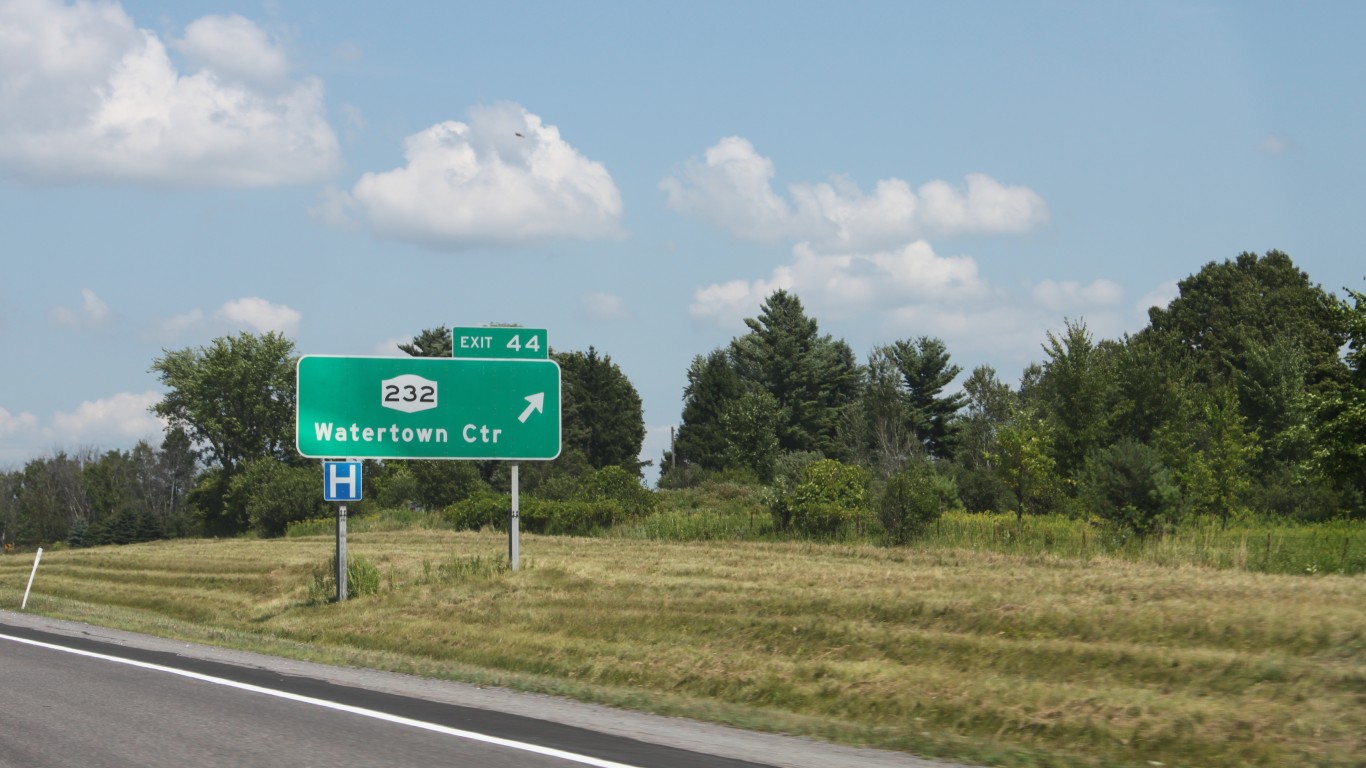
17. Watertown, New York
> Change in reported burglary rate, 2019-2020: +211.4
> Burglaries reported in 2020: 158 — 536th highest of 1,114 cities (tied)
> Burglaries per 100K people in 2020: 641.7 — 107th highest of 1,114 cities
> 1-yr. change in all property crime per 100K people: +393.5 — 58th highest of 1,037 cities
> Property crimes per 100K people in 2020: 3,927.1 — 93rd highest of 1,038 cities
> Population: 25,622
[in-text-ad-2]

16. Kent, Washington
> Change in reported burglary rate, 2019-2020: +211.7
> Burglaries reported in 2020: 1,054 — 77th highest of 1,114 cities
> Burglaries per 100K people in 2020: 787.3 — 46th highest of 1,114 cities
> 1-yr. change in all property crime per 100K people: +58.8 — 268th highest of 1,037 cities
> Property crimes per 100K people in 2020: 4,028.1 — 89th highest of 1,038 cities
> Population: 131,118
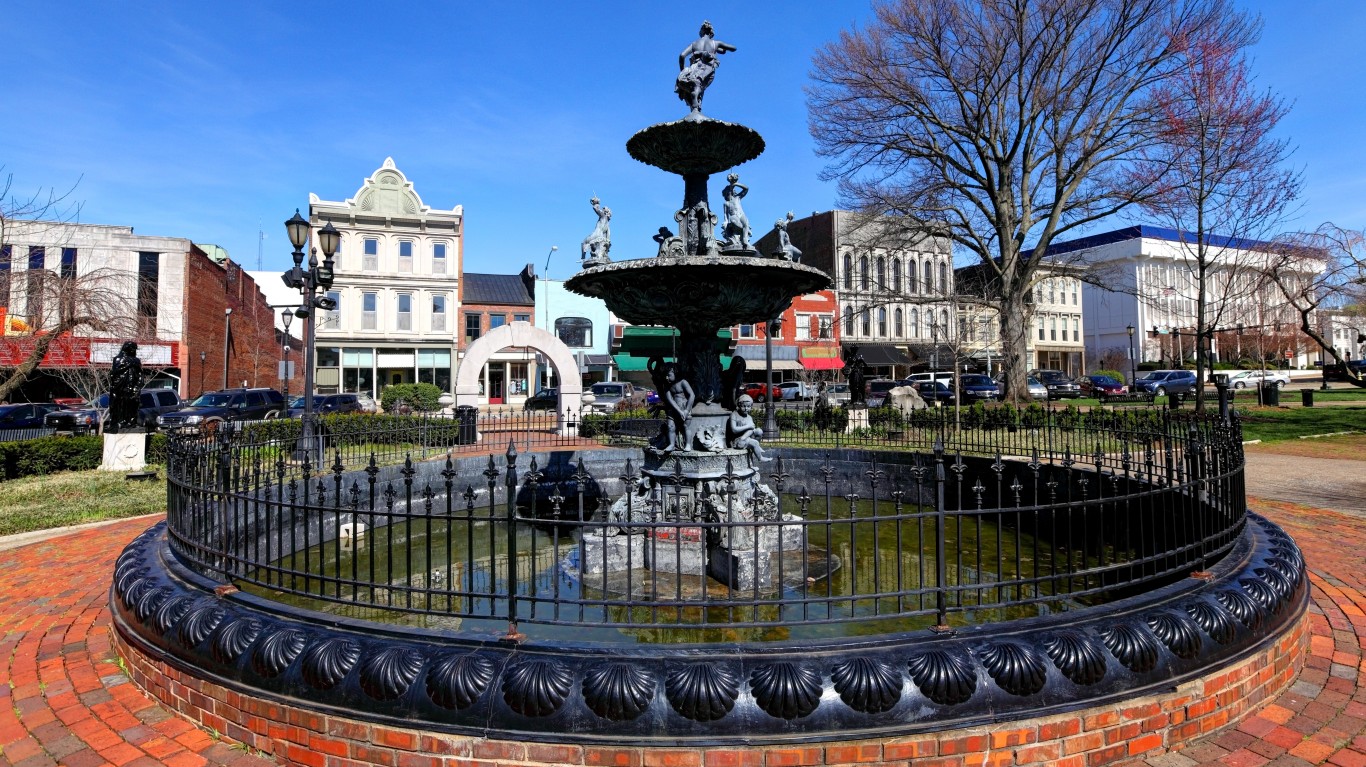
15. Bowling Green, Kentucky
> Change in reported burglary rate, 2019-2020: +224.9
> Burglaries reported in 2020: 560 — 145th highest of 1,114 cities
> Burglaries per 100K people in 2020: 779.3 — 49th highest of 1,114 cities
> 1-yr. change in all property crime per 100K people: -221.6 — 412th lowest of 1,037 cities
> Property crimes per 100K people in 2020: 4,446.1 — 60th highest of 1,038 cities
> Population: 67,600
[in-text-ad]

14. Burien, Washington
> Change in reported burglary rate, 2019-2020: +226.1
> Burglaries reported in 2020: 455 — 184th highest of 1,114 cities
> Burglaries per 100K people in 2020: 877.0 — 28th highest of 1,114 cities
> 1-yr. change in all property crime per 100K people: +878.9 — 8th highest of 1,037 cities
> Property crimes per 100K people in 2020: 4,207.9 — 72nd highest of 1,038 cities
> Population: 51,477
[recirclink id=1023032]

13. Puyallup, Washington
> Change in reported burglary rate, 2019-2020: +234.8
> Burglaries reported in 2020: 388 — 223rd highest of 1,114 cities (tied)
> Burglaries per 100K people in 2020: 902.9 — 20th highest of 1,114 cities
> 1-yr. change in all property crime per 100K people: +784.4 — 15th highest of 1,037 cities
> Property crimes per 100K people in 2020: 5,929.2 — 12th highest of 1,038 cities
> Population: 40,991

12. Boulder, Colorado
> Change in reported burglary rate, 2019-2020: +240.3
> Burglaries reported in 2020: 654 — 119th highest of 1,114 cities (tied)
> Burglaries per 100K people in 2020: 613.5 — 116th highest of 1,114 cities
> 1-yr. change in all property crime per 100K people: +744.0 — 20th highest of 1,037 cities
> Property crimes per 100K people in 2020: 3,770.2 — 106th highest of 1,038 cities
> Population: 106,392
[in-text-ad-2]

11. Decatur, Illinois
> Change in reported burglary rate, 2019-2020: +259.8
> Burglaries reported in 2020: 621 — 132nd highest of 1,114 cities
> Burglaries per 100K people in 2020: 884.9 — 26th highest of 1,114 cities
> 1-yr. change in all property crime per 100K people: N/A
> Property crimes per 100K people in 2020: N/A
> Population: 72,359

10. Ithaca, New York
> Change in reported burglary rate, 2019-2020: +276.0
> Burglaries reported in 2020: 141 — 526th lowest of 1,114 cities (tied)
> Burglaries per 100K people in 2020: 455.9 — 241st highest of 1,114 cities
> 1-yr. change in all property crime per 100K people: +1,042.0 — 6th highest of 1,037 cities
> Property crimes per 100K people in 2020: 3,741.1 — 110th highest of 1,038 cities
> Population: 30,569
[in-text-ad]

9. Bellingham, Washington
> Change in reported burglary rate, 2019-2020: +300.1
> Burglaries reported in 2020: 610 — 136th highest of 1,114 cities (tied)
> Burglaries per 100K people in 2020: 651.5 — 100th highest of 1,114 cities
> 1-yr. change in all property crime per 100K people: +1,673.2 — 3rd highest of 1,037 cities
> Property crimes per 100K people in 2020: 4,599.0 — 49th highest of 1,038 cities
> Population: 88,764
[recirclink id=1030620]

8. University Place, Washington
> Change in reported burglary rate, 2019-2020: +309.4
> Burglaries reported in 2020: 210 — 424th highest of 1,114 cities (tied)
> Burglaries per 100K people in 2020: 611.5 — 117th highest of 1,114 cities
> 1-yr. change in all property crime per 100K people: +1,045.4 — 4th highest of 1,037 cities
> Property crimes per 100K people in 2020: 2,632.6 — 321st highest of 1,038 cities
> Population: 33,326

7. San Francisco, California
> Change in reported burglary rate, 2019-2020: +321.2
> Burglaries reported in 2020: 7,452 — 7th highest of 1,114 cities
> Burglaries per 100K people in 2020: 845.4 — 34th highest of 1,114 cities
> 1-yr. change in all property crime per 100K people: -1,111.2 — 19th lowest of 1,037 cities
> Property crimes per 100K people in 2020: 4,394.4 — 61st highest of 1,038 cities
> Population: 874,961
[in-text-ad-2]

6. Mason City, Iowa
> Change in reported burglary rate, 2019-2020: +327.1
> Burglaries reported in 2020: 203 — 438th highest of 1,114 cities
> Burglaries per 100K people in 2020: 757.2 — 60th highest of 1,114 cities
> 1-yr. change in all property crime per 100K people: +260.4 — 106th highest of 1,037 cities
> Property crimes per 100K people in 2020: 3,185.3 — 194th highest of 1,038 cities
> Population: 27,200
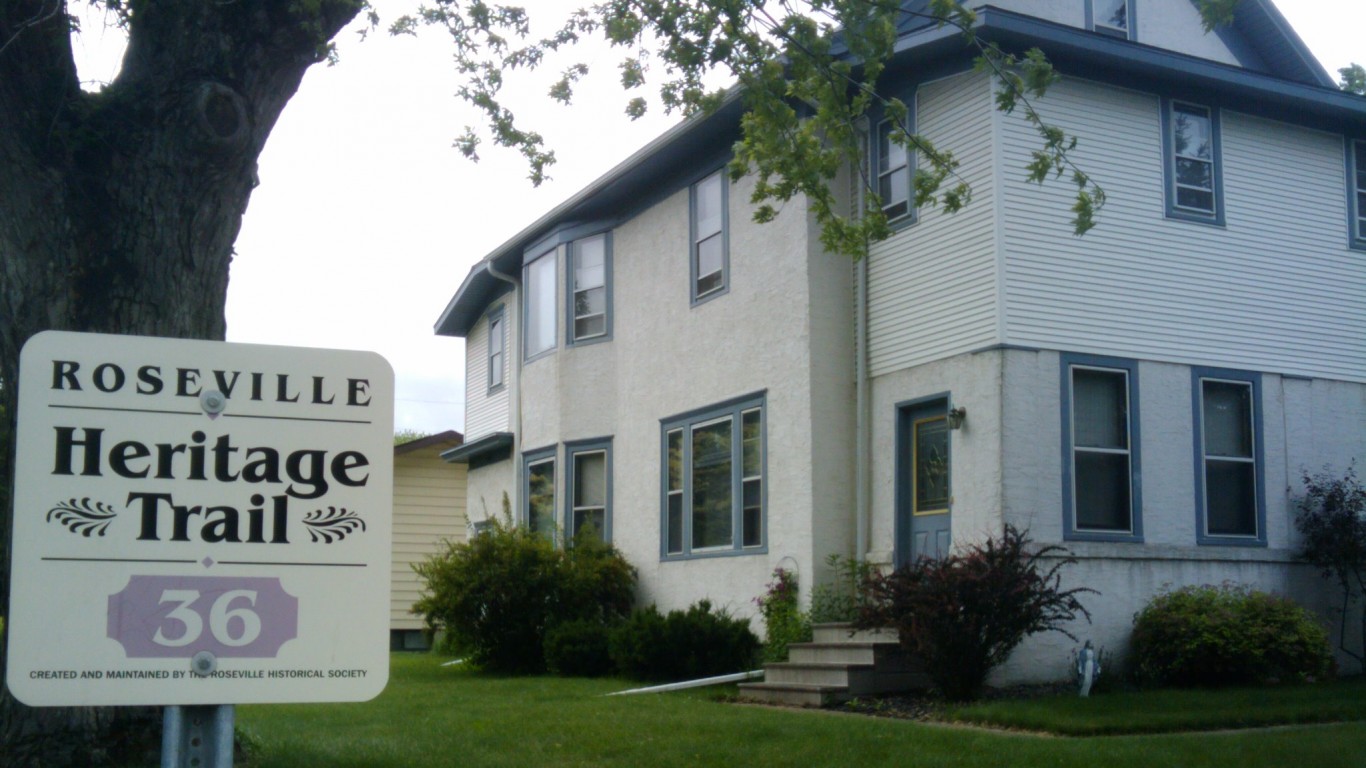
5. Roseville, Minnesota
> Change in reported burglary rate, 2019-2020: +330.8
> Burglaries reported in 2020: 283 — 307th highest of 1,114 cities (tied)
> Burglaries per 100K people in 2020: 771.6 — 54th highest of 1,114 cities
> 1-yr. change in all property crime per 100K people: +573.7 — 29th highest of 1,037 cities
> Property crimes per 100K people in 2020: 6,462.2 — 6th highest of 1,038 cities
> Population: 36,026
[in-text-ad]
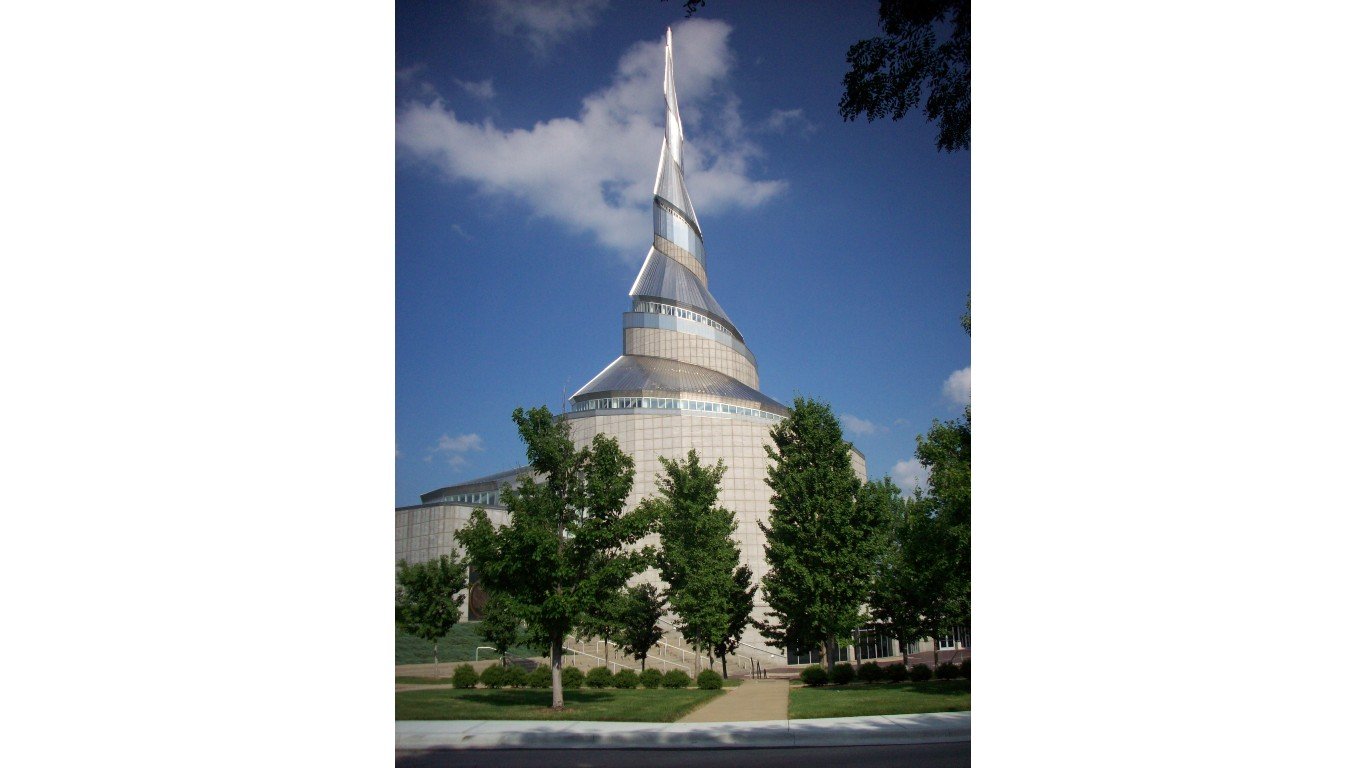
4. Grandview, Missouri
> Change in reported burglary rate, 2019-2020: +351.7
> Burglaries reported in 2020: 200 — 445th highest of 1,114 cities (tied)
> Burglaries per 100K people in 2020: 803.3 — 43rd highest of 1,114 cities
> 1-yr. change in all property crime per 100K people: +296.4 — 91st highest of 1,037 cities
> Property crimes per 100K people in 2020: 4,169.0 — 75th highest of 1,038 cities
> Population: 25,069
[recirclink id=1020198]

3. Santa Monica, California
> Change in reported burglary rate, 2019-2020: +399.3
> Burglaries reported in 2020: 931 — 84th highest of 1,114 cities
> Burglaries per 100K people in 2020: 1,029.0 — 11th highest of 1,114 cities
> 1-yr. change in all property crime per 100K people: -68.9 — 429th highest of 1,037 cities
> Property crimes per 100K people in 2020: 4,257.6 — 67th highest of 1,038 cities
> Population: 91,577

2. Seattle, Washington
> Change in reported burglary rate, 2019-2020: +407.4
> Burglaries reported in 2020: 10,427 — 4th highest of 1,114 cities
> Burglaries per 100K people in 2020: 1,351.5 — 5th highest of 1,114 cities
> 1-yr. change in all property crime per 100K people: +377.0 — 60th highest of 1,037 cities
> Property crimes per 100K people in 2020: 4,872.6 — 32nd highest of 1,038 cities
> Population: 724,305
[in-text-ad-2]

1. Culver City, California
> Change in reported burglary rate, 2019-2020: +408.4
> Burglaries reported in 2020: 332 — 263rd highest of 1,114 cities (tied)
> Burglaries per 100K people in 2020: 846.6 — 32nd highest of 1,114 cities
> 1-yr. change in all property crime per 100K people: -116.2 — 488th highest of 1,037 cities
> Property crimes per 100K people in 2020: 4,079.8 — 82nd highest of 1,038 cities
> Population: 39,169
Methodology
To determine the cities where the burglary rate is rising fastest, 24/7 Wall St. reviewed the change in burglaries per 100,000 people from the FBI’s 2019 and 2020 Uniform Crime Reports. Crime rates were calculated using population figures provided by the FBI in the 2020 and 2019 UCR.
Limited data was available in the 2020 UCR for areas in Alabama, Maryland, Pennsylvania, and Illinois, though cities in these states were not excluded from analysis. Because some state and local agencies changed reporting practices between 2019 and 2020, the figures are not comparable, and the areas were excluded.
To concentrate on urban areas, we excluded places with fewer than 25,000 people based on five-year estimates from the U.S. Census Bureau’s 2019 American Community Survey.
Contact [email protected] for any questions or corrections.