Of all the most serious crimes tracked by the FBI – known as Part I offenses – larceny is by far the most common. There were 4.6 million cases of larceny-theft reported in the United States in 2020, accounting for nearly 60% of all Part I offenses, which also include murder, assault, robbery, rаpe, vehicle theft, and burglary.
Larceny is a classification of crime that includes all nonviolent theft, with the exception of motor-vehicle theft. Common examples of larceny include purse snatching, pick pocketing, shoplifting, and bicycle theft. According to the FBI, larceny-thefts result in billions of dollars in losses annually.
Reported incidents of larceny have been declining for years in the United States. Between 2019 and 2020 alone, the number of reported larceny cases fell by 11%, or, adjusting for population, 171 incidents for every 100,000 people. However, some U.S. cities are reporting rising larceny rates, breaking with the broader trend.
Using data from the FBI’s 2020 Uniform Crime Report, 24/7 Wall St. determined the 50 cities where the larceny-theft rate is rising fastest. Cities – defined as places with populations above 25,000 – are ranked by the change in the number of larcenies reported for every 100,000 people between 2019 and 2020. Among the cities on this list, the larceny rate climbed anywhere from 298 to 1,582 incidents per 100,000 people.
Larceny – along with motor vehicle theft and burglary – is one component of the property crime category. Partially due to a rising larceny rate, the overall property crime rate also increased in every city on this list with available data. Here is a look at the U.S. towns where property crime is soaring.
Half of the cities on this list are in the West, including eight in Washington alone. In the majority of cities on this list, the larceny-theft rate is higher than the national rate of 1,398 per 100,000 people. Here is a look at the city with the most larceny thefts in every state.
Click here to see cities where the larceny theft rate is soaring
Click here to read our detailed methodology

50. Slidell, Louisiana
> Change in reported larceny-theft rate, 2019-2020: +297.8
> Larceny-thefts reported in 2020: 754 – 459th lowest of 1,046 cities (tied)
> Larceny-thefts per 100K people in 2020: 2,725.1 – 121st highest of 1,046 cities
> 1-yr. change in all property crime: +324.6 – 80th highest of 1,037 cities
> Property crimes per 100K people in 2020: 3,173.2 – 203rd highest of 1,042 cities
> Population: 27,822
[in-text-ad]

49. Eugene, Oregon
> Change in reported larceny-theft rate, 2019-2020: +308.0
> Larceny-thefts reported in 2020: 5,187 – 68th highest of 1,046 cities
> Larceny-thefts per 100K people in 2020: 2,972.3 – 85th highest of 1,046 cities
> 1-yr. change in all property crime: +428.9 – 50th highest of 1,037 cities
> Property crimes per 100K people in 2020: 3,999.7 – 93rd highest of 1,042 cities
> Population: 168,302
[recirclink id=1059954]
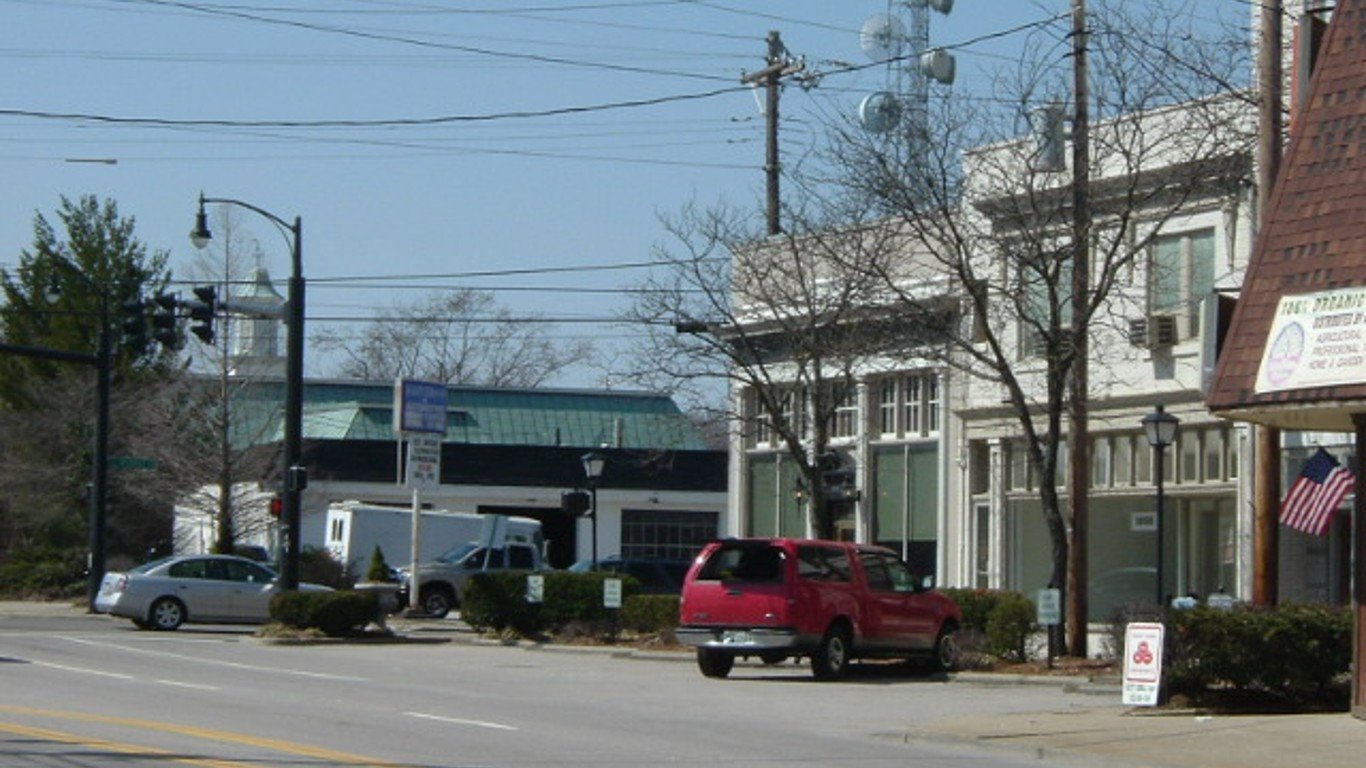
48. Jeffersontown, Kentucky
> Change in reported larceny-theft rate, 2019-2020: +312.8
> Larceny-thefts reported in 2020: 496 – 276th lowest of 1,046 cities
> Larceny-thefts per 100K people in 2020: 1,790.6 – 389th highest of 1,046 cities
> 1-yr. change in all property crime: +421.3 – 53rd highest of 1,037 cities
> Property crimes per 100K people in 2020: 2,548.7 – 350th highest of 1,042 cities
> Population: 28,035

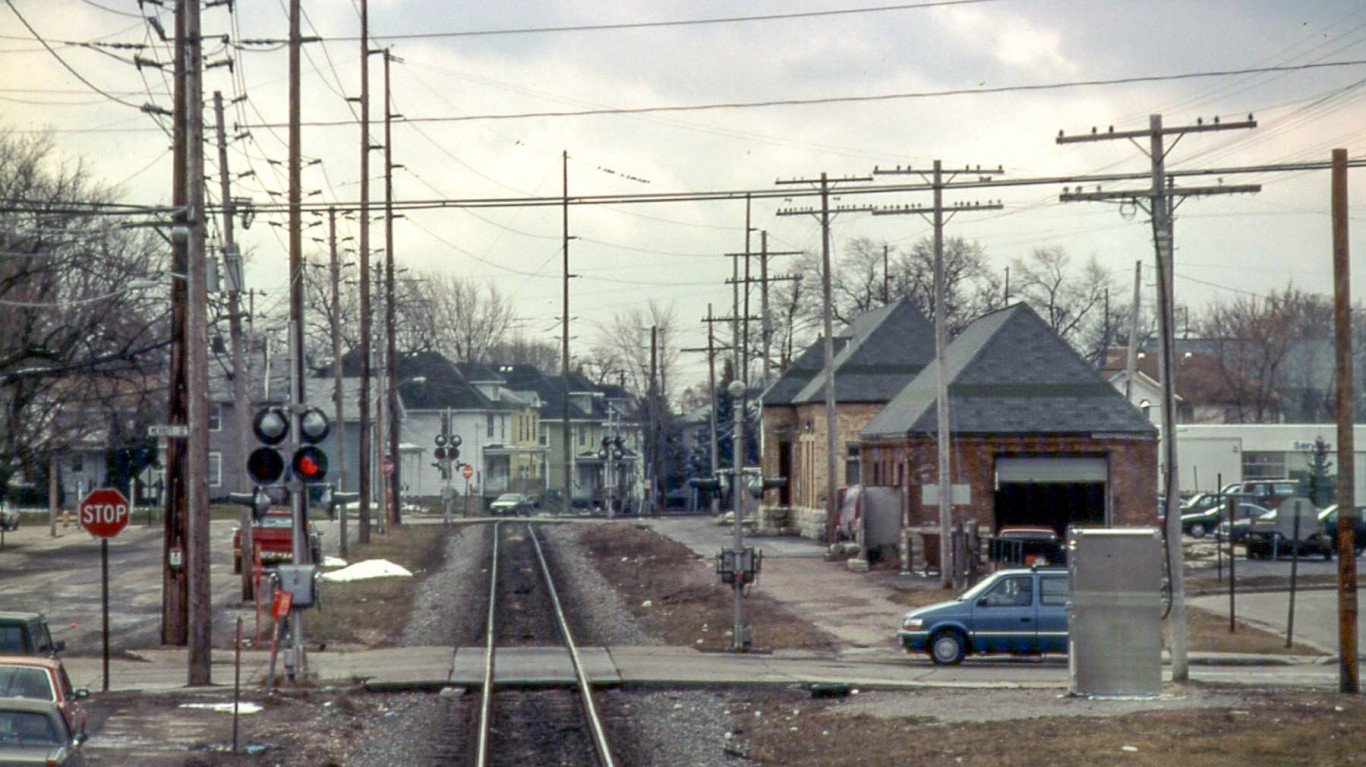
47. Racine, Wisconsin
> Change in reported larceny-theft rate, 2019-2020: +313.6
> Larceny-thefts reported in 2020: 916 – 493rd highest of 1,046 cities (tied)
> Larceny-thefts per 100K people in 2020: 1,196.2 – 369th lowest of 1,046 cities
> 1-yr. change in all property crime: +522.3 – 33rd highest of 1,037 cities
> Property crimes per 100K people in 2020: 1,803.5 – 439th lowest of 1,042 cities
> Population: 77,081
[in-text-ad-2]

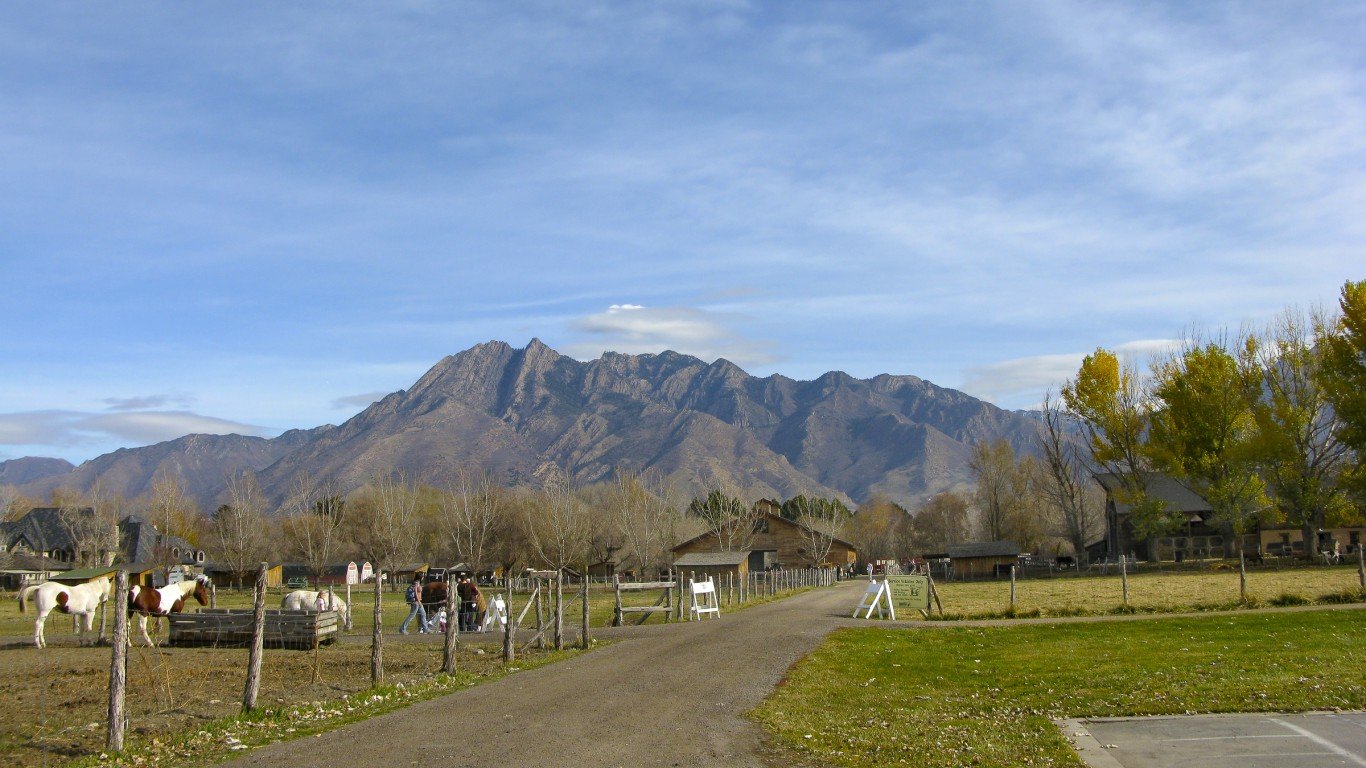
46. Spanish Fork, Utah
> Change in reported larceny-theft rate, 2019-2020: +327.2
> Larceny-thefts reported in 2020: 421 – 210th lowest of 1,046 cities
> Larceny-thefts per 100K people in 2020: 1,011.9 – 262nd lowest of 1,046 cities
> 1-yr. change in all property crime: +309.6 – 83rd highest of 1,037 cities
> Property crimes per 100K people in 2020: 1,127.3 – 175th lowest of 1,042 cities
> Population: 39,371
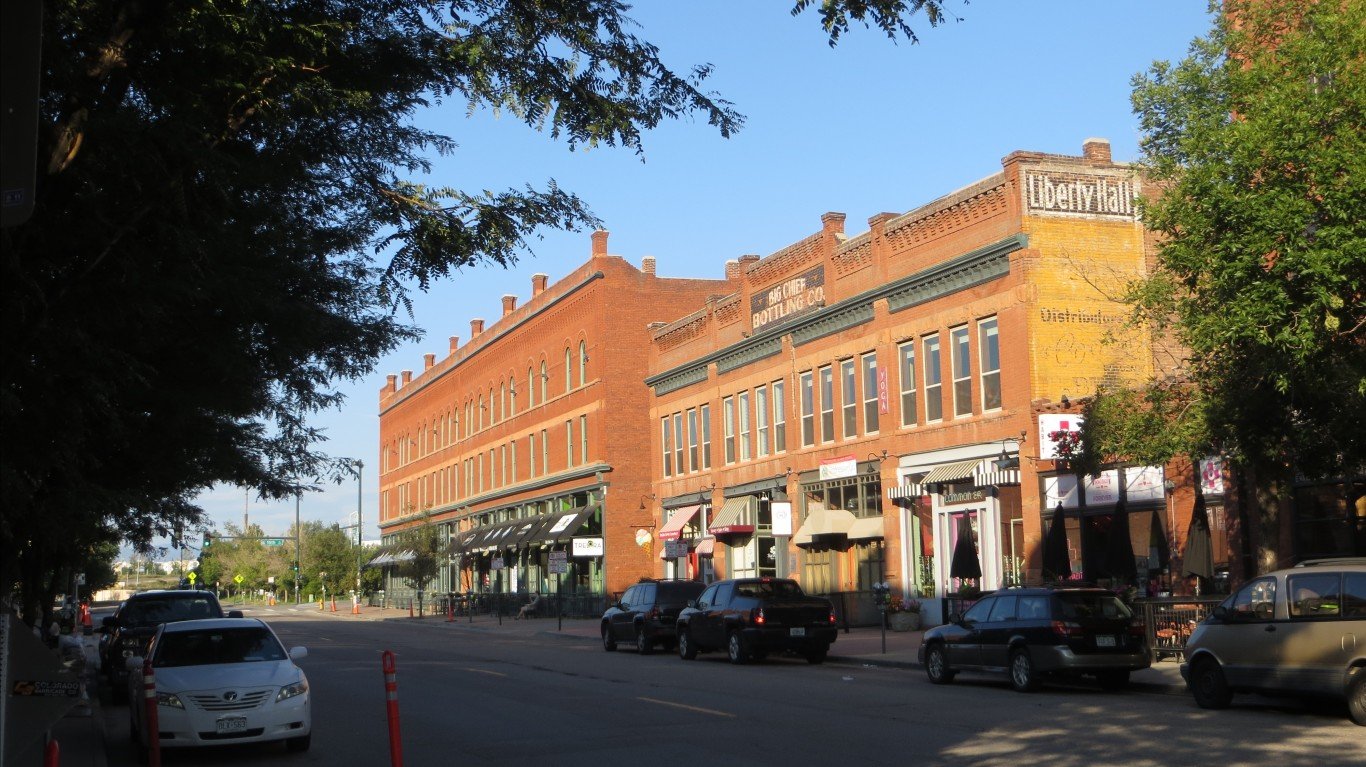
45. Denver, Colorado
> Change in reported larceny-theft rate, 2019-2020: +327.8
> Larceny-thefts reported in 2020: 20,662 – 14th highest of 1,046 cities
> Larceny-thefts per 100K people in 2020: 2,800.8 – 106th highest of 1,046 cities
> 1-yr. change in all property crime: +905.2 – 7th highest of 1,037 cities
> Property crimes per 100K people in 2020: 4,648.7 – 47th highest of 1,042 cities
> Population: 705,576
[in-text-ad]
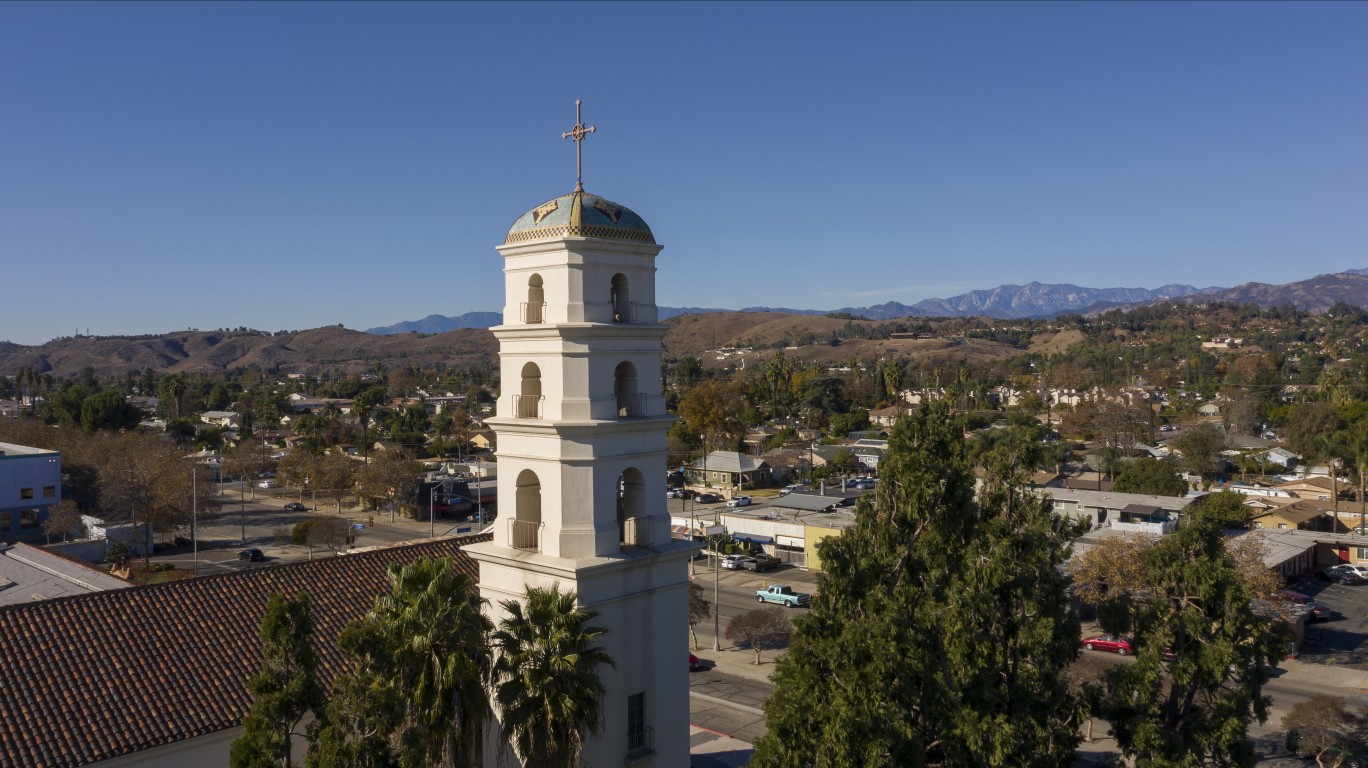
44. Pomona, California
> Change in reported larceny-theft rate, 2019-2020: +328.4
> Larceny-thefts reported in 2020: 3,015 – 117th highest of 1,046 cities
> Larceny-thefts per 100K people in 2020: 1,983.8 – 309th highest of 1,046 cities
> 1-yr. change in all property crime: +376.9 – 61st highest of 1,037 cities
> Property crimes per 100K people in 2020: 3,131.3 – 213th highest of 1,042 cities
> Population: 152,209
[recirclink id=1017922]
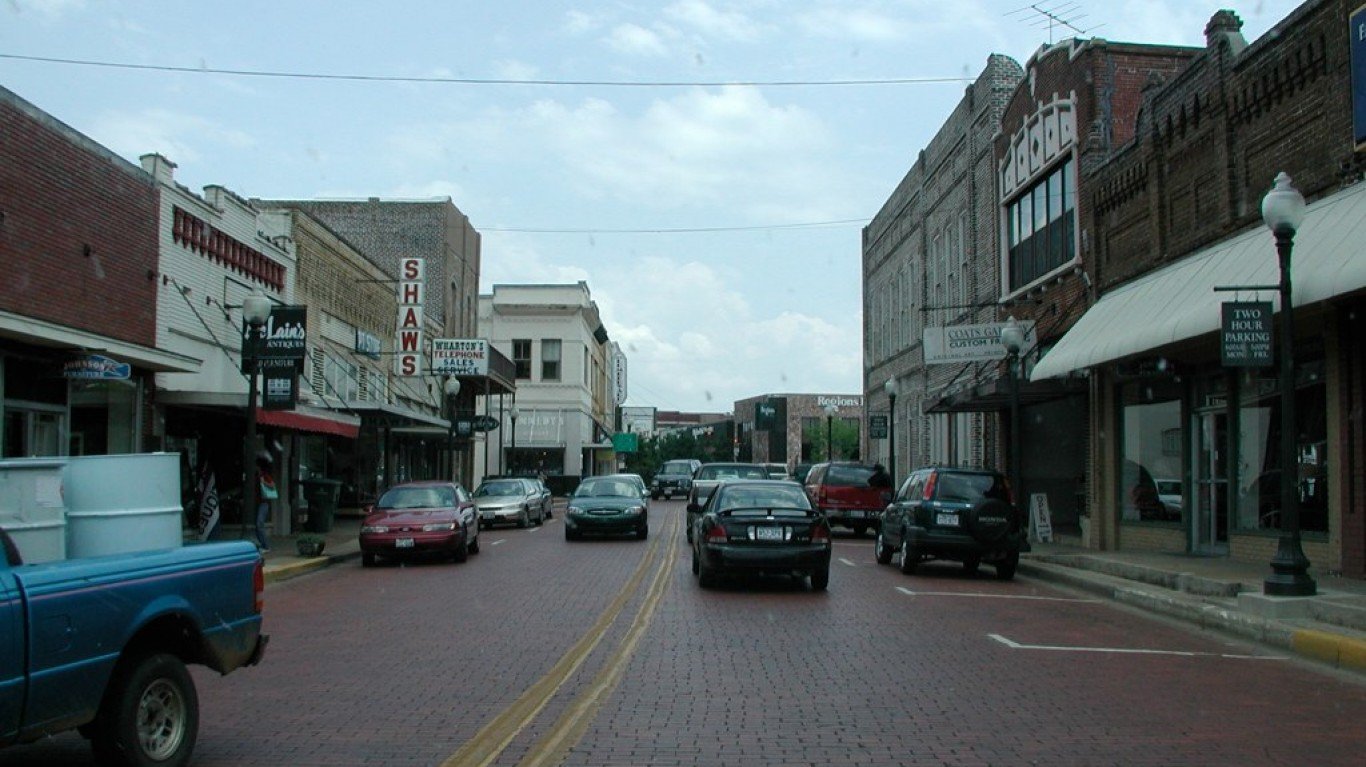
43. Nacogdoches, Texas
> Change in reported larceny-theft rate, 2019-2020: +338.4
> Larceny-thefts reported in 2020: 744 – 449th lowest of 1,046 cities
> Larceny-thefts per 100K people in 2020: 2,263.3 – 218th highest of 1,046 cities
> 1-yr. change in all property crime: +298.2 – 90th highest of 1,037 cities
> Property crimes per 100K people in 2020: 2,868.6 – 268th highest of 1,042 cities
> Population: 33,200

42. Chattanooga, Tennessee
> Change in reported larceny-theft rate, 2019-2020: +348.0
> Larceny-thefts reported in 2020: 8,435 – 39th highest of 1,046 cities
> Larceny-thefts per 100K people in 2020: 4,579.0 – 10th highest of 1,046 cities
> 1-yr. change in all property crime: +798.9 – 12th highest of 1,037 cities
> Property crimes per 100K people in 2020: 6,356.3 – 8th highest of 1,042 cities
> Population: 179,690
[in-text-ad-2]
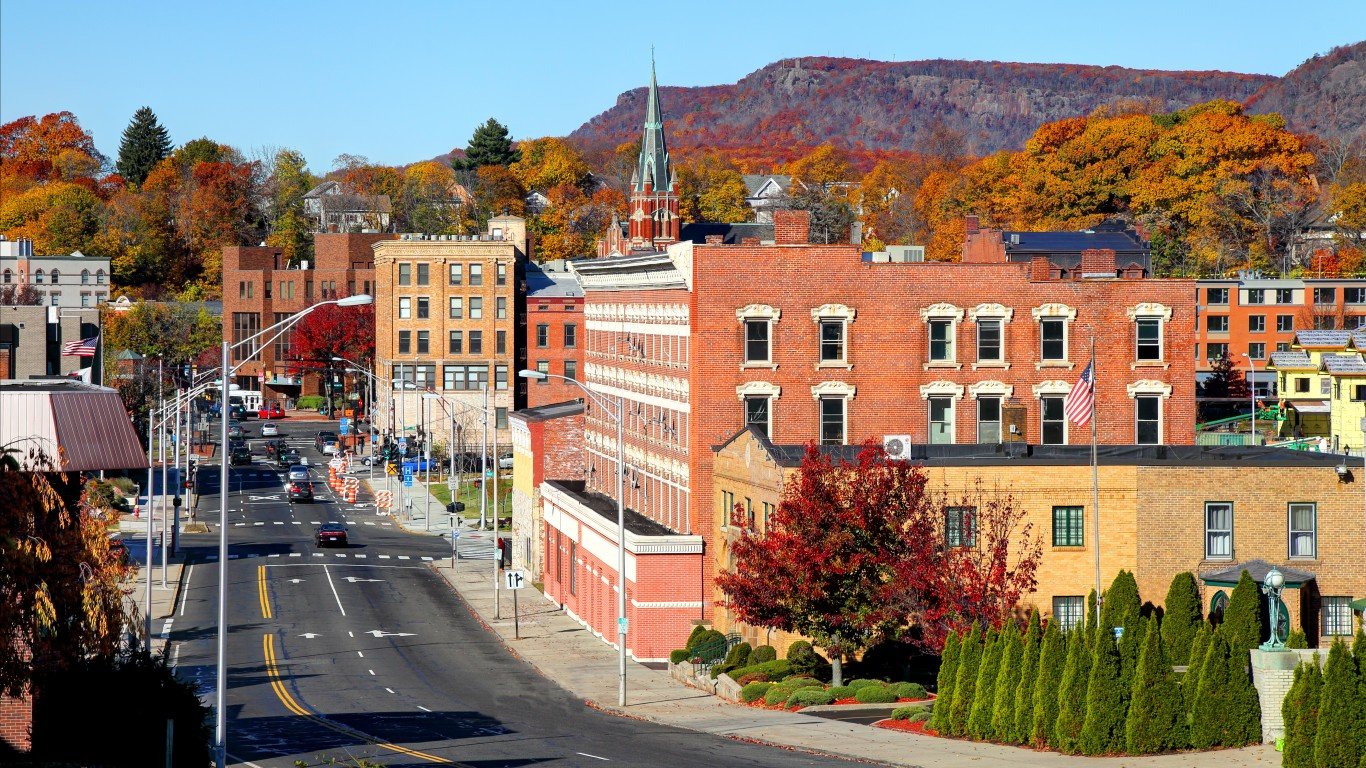
41. Meriden, Connecticut
> Change in reported larceny-theft rate, 2019-2020: +354.0
> Larceny-thefts reported in 2020: 927 – 484th highest of 1,046 cities (tied)
> Larceny-thefts per 100K people in 2020: 1,564.9 – 478th highest of 1,046 cities
> 1-yr. change in all property crime: +399.1 – 57th highest of 1,037 cities
> Property crimes per 100K people in 2020: 2,116.9 – 496th highest of 1,042 cities
> Population: 59,676
40. Oshkosh, Wisconsin
> Change in reported larceny-theft rate, 2019-2020: +355.7
> Larceny-thefts reported in 2020: 1,036 – 428th highest of 1,046 cities
> Larceny-thefts per 100K people in 2020: 1,544.4 – 495th highest of 1,046 cities
> 1-yr. change in all property crime: +249.7 – 111th highest of 1,037 cities
> Property crimes per 100K people in 2020: 1,847.0 – 455th lowest of 1,042 cities
> Population: 66,773
[in-text-ad]

39. Draper, Utah
> Change in reported larceny-theft rate, 2019-2020: +360.6
> Larceny-thefts reported in 2020: 903 – 503rd highest of 1,046 cities (tied)
> Larceny-thefts per 100K people in 2020: 1,830.7 – 367th highest of 1,046 cities
> 1-yr. change in all property crime: +462.3 – 45th highest of 1,037 cities
> Property crimes per 100K people in 2020: 2,307.1 – 424th highest of 1,042 cities
> Population: 48,000
[recirclink id=1039645]
![]()
38. Clearfield, Utah
> Change in reported larceny-theft rate, 2019-2020: +370.0
> Larceny-thefts reported in 2020: 413 – 204th lowest of 1,046 cities
> Larceny-thefts per 100K people in 2020: 1,276.3 – 420th lowest of 1,046 cities
> 1-yr. change in all property crime: +477.1 – 40th highest of 1,037 cities
> Property crimes per 100K people in 2020: 1,622.5 – 355th lowest of 1,042 cities
> Population: 31,364

37. Leawood, Kansas
> Change in reported larceny-theft rate, 2019-2020: +373.7
> Larceny-thefts reported in 2020: 447 – 230th lowest of 1,046 cities (tied)
> Larceny-thefts per 100K people in 2020: 1,275.2 – 419th lowest of 1,046 cities
> 1-yr. change in all property crime: +484.9 – 37th highest of 1,037 cities
> Property crimes per 100K people in 2020: 1,628.9 – 359th lowest of 1,042 cities
> Population: 34,670
[in-text-ad-2]

36. Boulder, Colorado
> Change in reported larceny-theft rate, 2019-2020: +387.0
> Larceny-thefts reported in 2020: 2,994 – 121st highest of 1,046 cities (tied)
> Larceny-thefts per 100K people in 2020: 2,808.7 – 103rd highest of 1,046 cities
> 1-yr. change in all property crime: +744.0 – 20th highest of 1,037 cities
> Property crimes per 100K people in 2020: 3,770.2 – 108th highest of 1,042 cities
> Population: 106,392
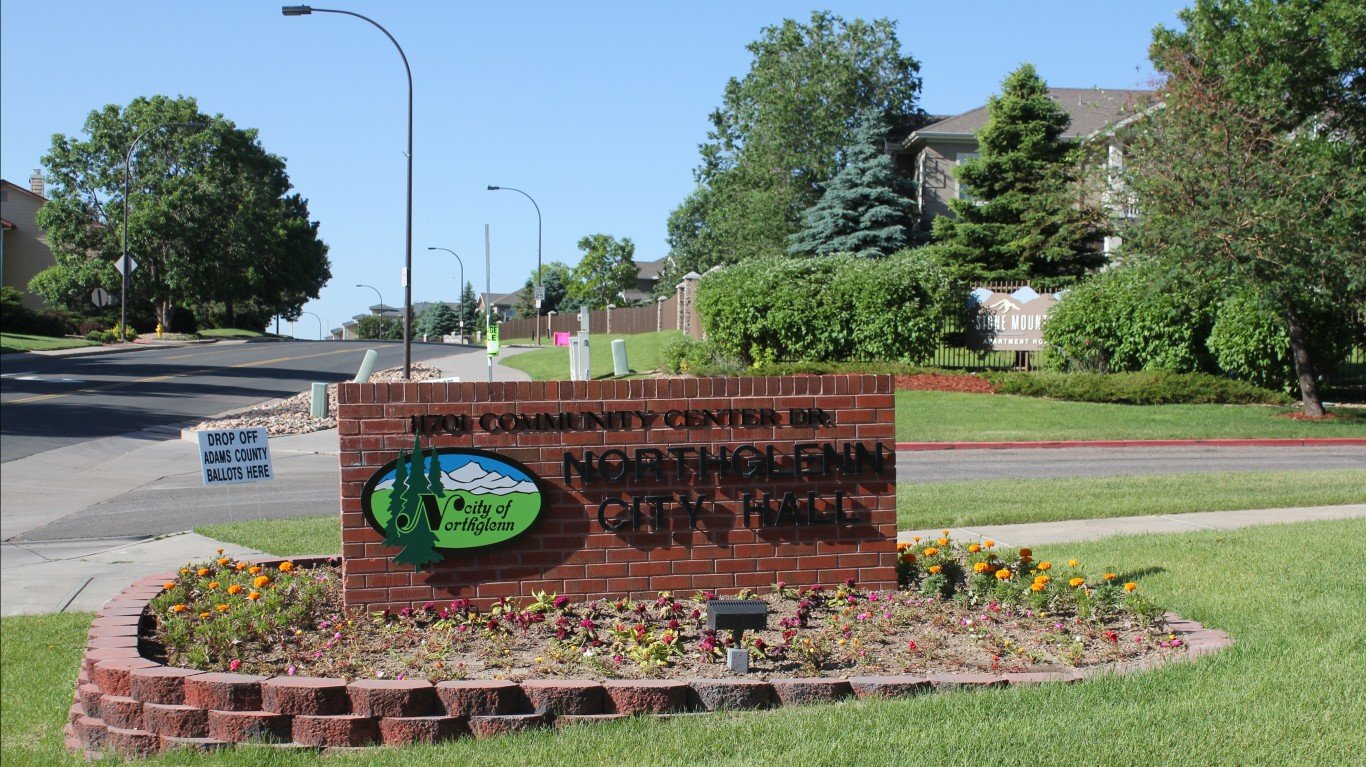
35. Northglenn, Colorado
> Change in reported larceny-theft rate, 2019-2020: +387.4
> Larceny-thefts reported in 2020: 1,014 – 442nd highest of 1,046 cities (tied)
> Larceny-thefts per 100K people in 2020: 2,589.3 – 138th highest of 1,046 cities
> 1-yr. change in all property crime: +577.3 – 28th highest of 1,037 cities
> Property crimes per 100K people in 2020: 3,695.0 – 116th highest of 1,042 cities
> Population: 38,973
[in-text-ad]

34. Sandy, Utah
> Change in reported larceny-theft rate, 2019-2020: +394.8
> Larceny-thefts reported in 2020: 2,211 – 189th highest of 1,046 cities
> Larceny-thefts per 100K people in 2020: 2,277.2 – 215th highest of 1,046 cities
> 1-yr. change in all property crime: +646.9 – 26th highest of 1,037 cities
> Property crimes per 100K people in 2020: 3,068.3 – 225th highest of 1,042 cities
> Population: 96,127
[recirclink id=1066891]
33. Grand Junction, Colorado
> Change in reported larceny-theft rate, 2019-2020: +401.6
> Larceny-thefts reported in 2020: 2,298 – 180th highest of 1,046 cities
> Larceny-thefts per 100K people in 2020: 3,582.3 – 37th highest of 1,046 cities
> 1-yr. change in all property crime: +772.1 – 19th highest of 1,037 cities
> Property crimes per 100K people in 2020: 4,623.6 – 50th highest of 1,042 cities
> Population: 62,062
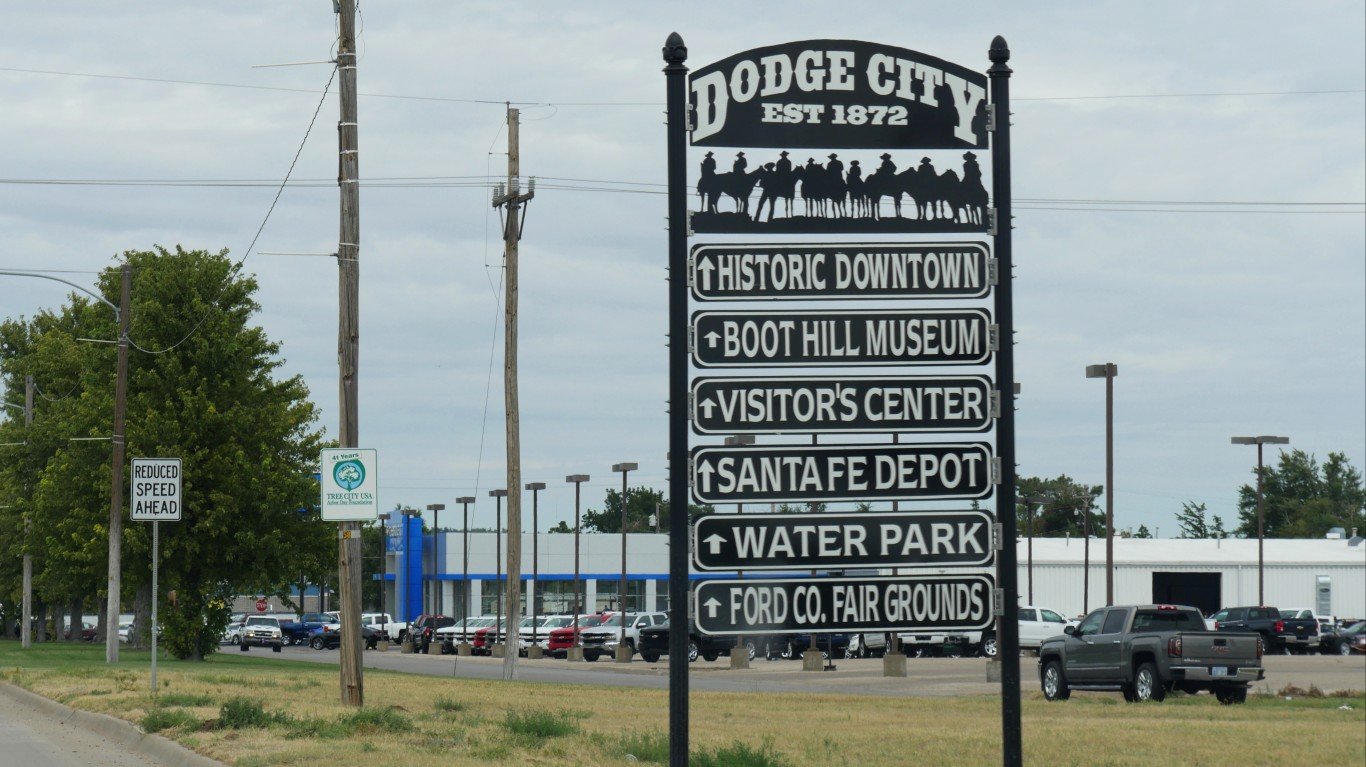
32. Dodge City, Kansas
> Change in reported larceny-theft rate, 2019-2020: +403.8
> Larceny-thefts reported in 2020: 579 – 337th lowest of 1,046 cities (tied)
> Larceny-thefts per 100K people in 2020: 2,139.2 – 257th highest of 1,046 cities
> 1-yr. change in all property crime: +271.8 – 99th highest of 1,037 cities
> Property crimes per 100K people in 2020: 2,516.1 – 359th highest of 1,042 cities
> Population: 27,555
[in-text-ad-2]

31. Billings, Montana
> Change in reported larceny-theft rate, 2019-2020: +408.7
> Larceny-thefts reported in 2020: 3,715 – 93rd highest of 1,046 cities
> Larceny-thefts per 100K people in 2020: 3,372.5 – 46th highest of 1,046 cities
> 1-yr. change in all property crime: +682.4 – 25th highest of 1,037 cities
> Property crimes per 100K people in 2020: 4,765.0 – 43rd highest of 1,042 cities
> Population: 109,595
30. Rapid City, South Dakota
> Change in reported larceny-theft rate, 2019-2020: +409.8
> Larceny-thefts reported in 2020: 2,014 – 207th highest of 1,046 cities
> Larceny-thefts per 100K people in 2020: 2,565.9 – 143rd highest of 1,046 cities
> 1-yr. change in all property crime: +782.1 – 16th highest of 1,037 cities
> Property crimes per 100K people in 2020: 3,996.6 – 94th highest of 1,042 cities
> Population: 75,258
[in-text-ad]
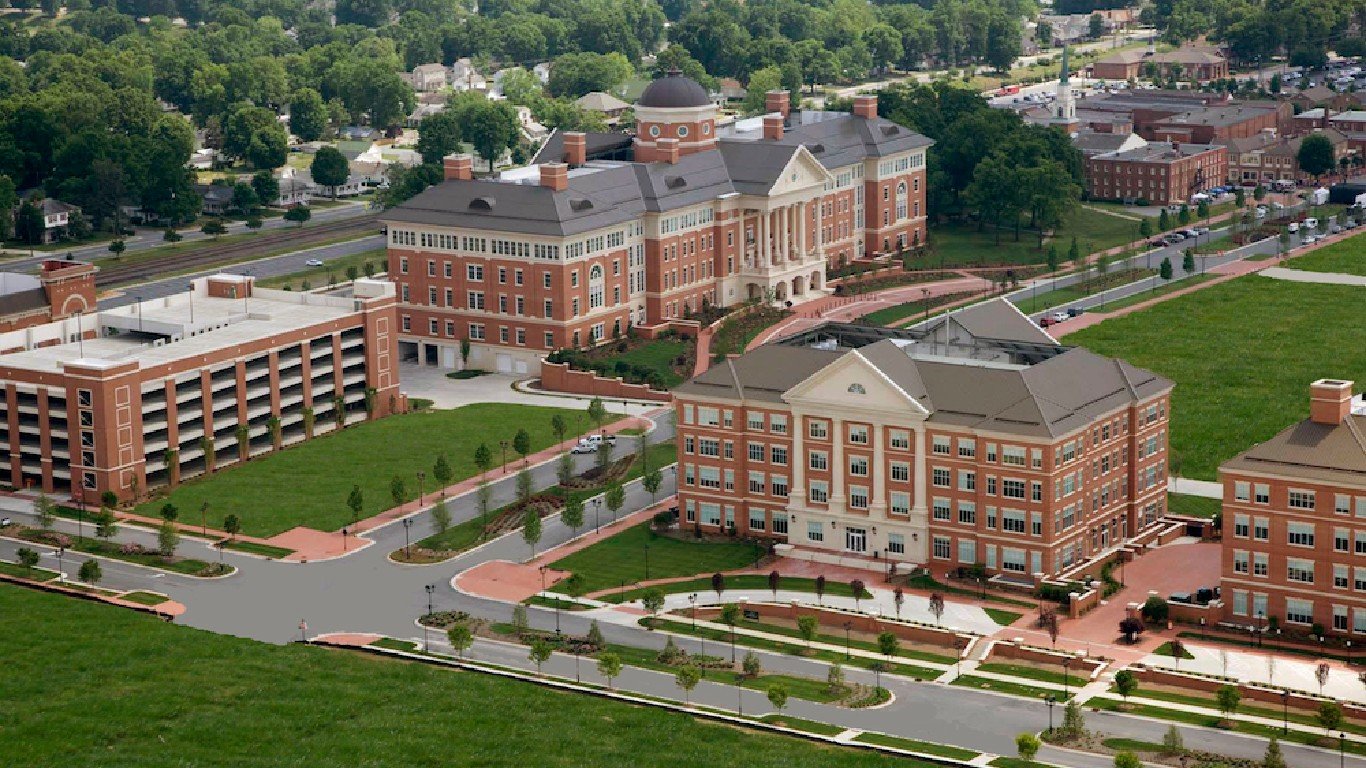
29. Kannapolis, North Carolina
> Change in reported larceny-theft rate, 2019-2020: +410.7
> Larceny-thefts reported in 2020: 1,104 – 398th highest of 1,046 cities
> Larceny-thefts per 100K people in 2020: 2,129.8 – 260th highest of 1,046 cities
> 1-yr. change in all property crime: +541.5 – 31st highest of 1,037 cities
> Property crimes per 100K people in 2020: 2,816.5 – 280th highest of 1,042 cities
> Population: 48,630
[recirclink id=1025193]
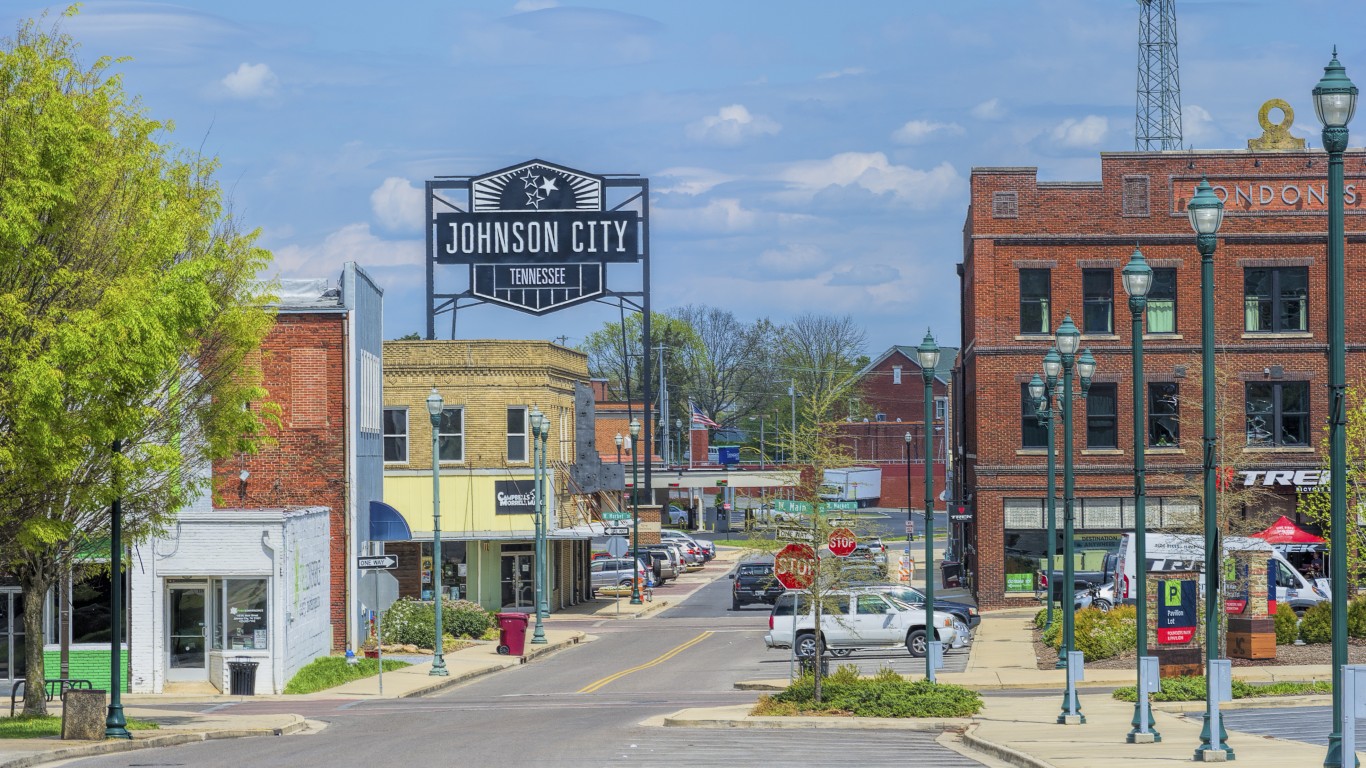
28. Johnson City, Tennessee
> Change in reported larceny-theft rate, 2019-2020: +415.0
> Larceny-thefts reported in 2020: 2,186 – 190th highest of 1,046 cities
> Larceny-thefts per 100K people in 2020: 3,248.5 – 55th highest of 1,046 cities
> 1-yr. change in all property crime: +480.9 – 38th highest of 1,037 cities
> Property crimes per 100K people in 2020: 4,037.6 – 89th highest of 1,042 cities
> Population: 66,515
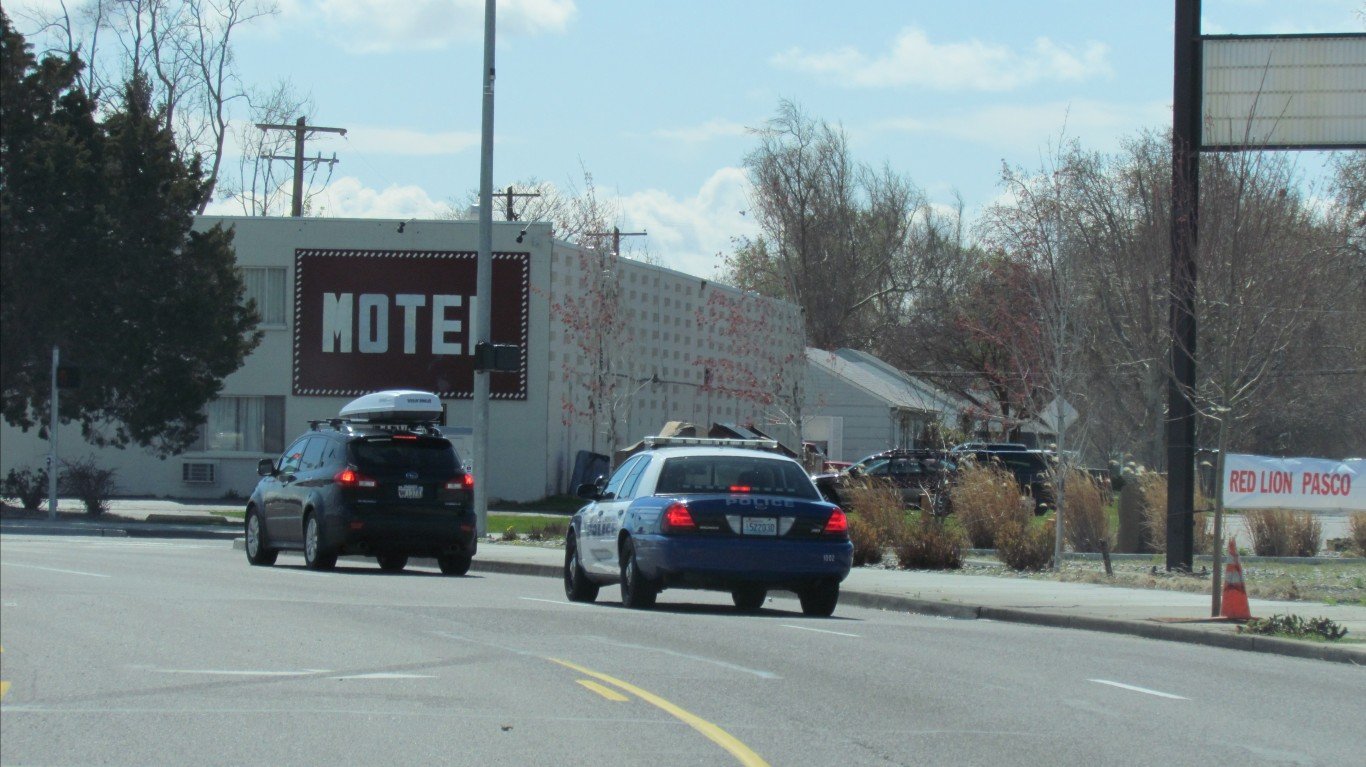
27. Richland, Washington
> Change in reported larceny-theft rate, 2019-2020: +426.3
> Larceny-thefts reported in 2020: 1,216 – 360th highest of 1,046 cities
> Larceny-thefts per 100K people in 2020: 2,048.2 – 287th highest of 1,046 cities
> 1-yr. change in all property crime: +566.7 – 30th highest of 1,037 cities
> Property crimes per 100K people in 2020: 2,615.8 – 330th highest of 1,042 cities
> Population: 56,399
[in-text-ad-2]

26. Richmond, Kentucky
> Change in reported larceny-theft rate, 2019-2020: +428.2
> Larceny-thefts reported in 2020: 770 – 472nd lowest of 1,046 cities (tied)
> Larceny-thefts per 100K people in 2020: 2,098.6 – 270th highest of 1,046 cities
> 1-yr. change in all property crime: +383.9 – 59th highest of 1,037 cities
> Property crimes per 100K people in 2020: 2,589.2 – 341st highest of 1,042 cities
> Population: 35,133

25. Puyallup, Washington
> Change in reported larceny-theft rate, 2019-2020: +435.0
> Larceny-thefts reported in 2020: 1,857 – 234th highest of 1,046 cities
> Larceny-thefts per 100K people in 2020: 4,321.2 – 14th highest of 1,046 cities
> 1-yr. change in all property crime: +784.4 – 15th highest of 1,037 cities
> Property crimes per 100K people in 2020: 5,929.2 – 12th highest of 1,042 cities
> Population: 40,991
[in-text-ad]
24. Florence, Kentucky
> Change in reported larceny-theft rate, 2019-2020: +445.9
> Larceny-thefts reported in 2020: 1,371 – 317th highest of 1,046 cities
> Larceny-thefts per 100K people in 2020: 4,105.2 – 19th highest of 1,046 cities
> 1-yr. change in all property crime: +366.4 – 64th highest of 1,037 cities
> Property crimes per 100K people in 2020: 4,674.1 – 46th highest of 1,042 cities
> Population: 32,369
[recirclink id=1059954]

23. Yukon, Oklahoma
> Change in reported larceny-theft rate, 2019-2020: +452.6
> Larceny-thefts reported in 2020: 492 – 269th lowest of 1,046 cities
> Larceny-thefts per 100K people in 2020: 1,712.2 – 421st highest of 1,046 cities
> 1-yr. change in all property crime: +474.8 – 42nd highest of 1,037 cities
> Property crimes per 100K people in 2020: 2,028.9 – 516th lowest of 1,042 cities
> Population: 26,943

22. Pacifica, California
> Change in reported larceny-theft rate, 2019-2020: +454.4
> Larceny-thefts reported in 2020: 581 – 340th lowest of 1,046 cities (tied)
> Larceny-thefts per 100K people in 2020: 1,502.2 – 519th highest of 1,046 cities
> 1-yr. change in all property crime: +479.8 – 39th highest of 1,037 cities
> Property crimes per 100K people in 2020: 1,848.6 – 457th lowest of 1,042 cities
> Population: 38,984
[in-text-ad-2]

21. Morgantown, West Virginia
> Change in reported larceny-theft rate, 2019-2020: +455.5
> Larceny-thefts reported in 2020: 517 – 293rd lowest of 1,046 cities (tied)
> Larceny-thefts per 100K people in 2020: 1,679.9 – 435th highest of 1,046 cities
> 1-yr. change in all property crime: +503.4 – 35th highest of 1,037 cities
> Property crimes per 100K people in 2020: 2,066.6 – 515th highest of 1,042 cities
> Population: 30,712

20. Edmonds, Washington
> Change in reported larceny-theft rate, 2019-2020: +462.7
> Larceny-thefts reported in 2020: 918 – 492nd highest of 1,046 cities
> Larceny-thefts per 100K people in 2020: 2,138.2 – 258th highest of 1,046 cities
> 1-yr. change in all property crime: +690.8 – 23rd highest of 1,037 cities
> Property crimes per 100K people in 2020: 2,797.3 – 285th highest of 1,042 cities
> Population: 42,040
[in-text-ad]
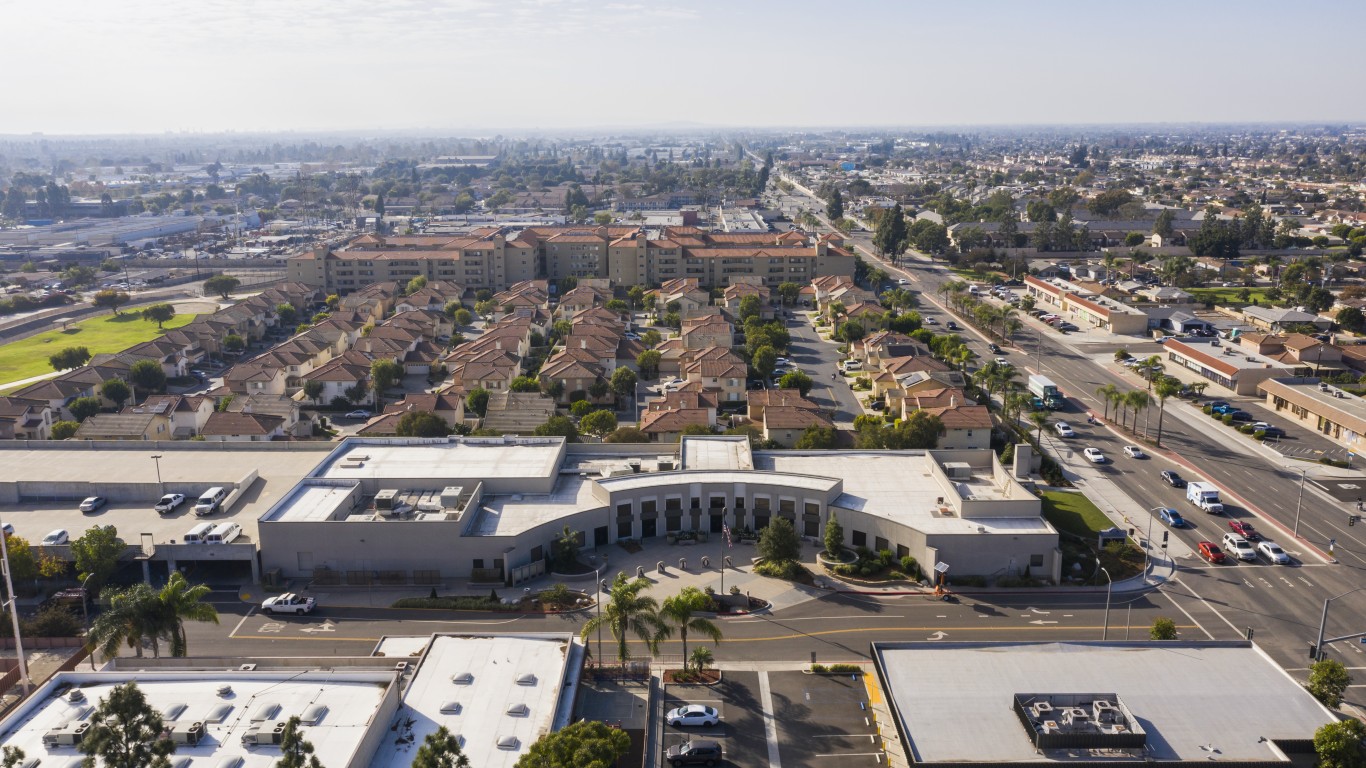
19. Stanton, California
> Change in reported larceny-theft rate, 2019-2020: +463.7
> Larceny-thefts reported in 2020: 520 – 297th lowest of 1,046 cities (tied)
> Larceny-thefts per 100K people in 2020: 1,362.5 – 459th lowest of 1,046 cities
> 1-yr. change in all property crime: +732.4 – 21st highest of 1,037 cities
> Property crimes per 100K people in 2020: 2,106.6 – 502nd highest of 1,042 cities
> Population: 38,377
[recirclink id=1017922]

18. Tucson, Arizona
> Change in reported larceny-theft rate, 2019-2020: +492.3
> Larceny-thefts reported in 2020: 15,956 – 21st highest of 1,046 cities
> Larceny-thefts per 100K people in 2020: 2,898.7 – 88th highest of 1,046 cities
> 1-yr. change in all property crime: +348.8 – 73rd highest of 1,037 cities
> Property crimes per 100K people in 2020: 3,620.9 – 126th highest of 1,042 cities
> Population: 541,482

17. Burien, Washington
> Change in reported larceny-theft rate, 2019-2020: +557.8
> Larceny-thefts reported in 2020: 1,244 – 351st highest of 1,046 cities
> Larceny-thefts per 100K people in 2020: 2,397.9 – 176th highest of 1,046 cities
> 1-yr. change in all property crime: +878.9 – 8th highest of 1,037 cities
> Property crimes per 100K people in 2020: 4,207.9 – 74th highest of 1,042 cities
> Population: 51,477
[in-text-ad-2]

16. Fayetteville, Arkansas
> Change in reported larceny-theft rate, 2019-2020: +560.5
> Larceny-thefts reported in 2020: 3,673 – 95th highest of 1,046 cities
> Larceny-thefts per 100K people in 2020: 4,115.3 – 18th highest of 1,046 cities
> 1-yr. change in all property crime: +684.9 – 24th highest of 1,037 cities
> Property crimes per 100K people in 2020: 5,166.3 – 22nd highest of 1,042 cities
> Population: 85,166

15. Shoreline, Washington
> Change in reported larceny-theft rate, 2019-2020: +561.5
> Larceny-thefts reported in 2020: 1,063 – 415th highest of 1,046 cities
> Larceny-thefts per 100K people in 2020: 1,849.6 – 361st highest of 1,046 cities
> 1-yr. change in all property crime: +706.5 – 22nd highest of 1,037 cities
> Property crimes per 100K people in 2020: 2,636.1 – 322nd highest of 1,042 cities
> Population: 56,267
[in-text-ad]

14. Fridley, Minnesota
> Change in reported larceny-theft rate, 2019-2020: +592.7
> Larceny-thefts reported in 2020: 1,024 – 437th highest of 1,046 cities
> Larceny-thefts per 100K people in 2020: 3,671.3 – 32nd highest of 1,046 cities
> 1-yr. change in all property crime: +863.2 – 9th highest of 1,037 cities
> Property crimes per 100K people in 2020: 4,589.1 – 52nd highest of 1,042 cities
> Population: 27,668
[recirclink id=1039645]
13. Murray, Utah
> Change in reported larceny-theft rate, 2019-2020: +603.3
> Larceny-thefts reported in 2020: 2,339 – 172nd highest of 1,046 cities (tied)
> Larceny-thefts per 100K people in 2020: 4,757.1 – 8th highest of 1,046 cities
> 1-yr. change in all property crime: +830.9 – 10th highest of 1,037 cities
> Property crimes per 100K people in 2020: 6,652.6 – 5th highest of 1,042 cities
> Population: 49,105
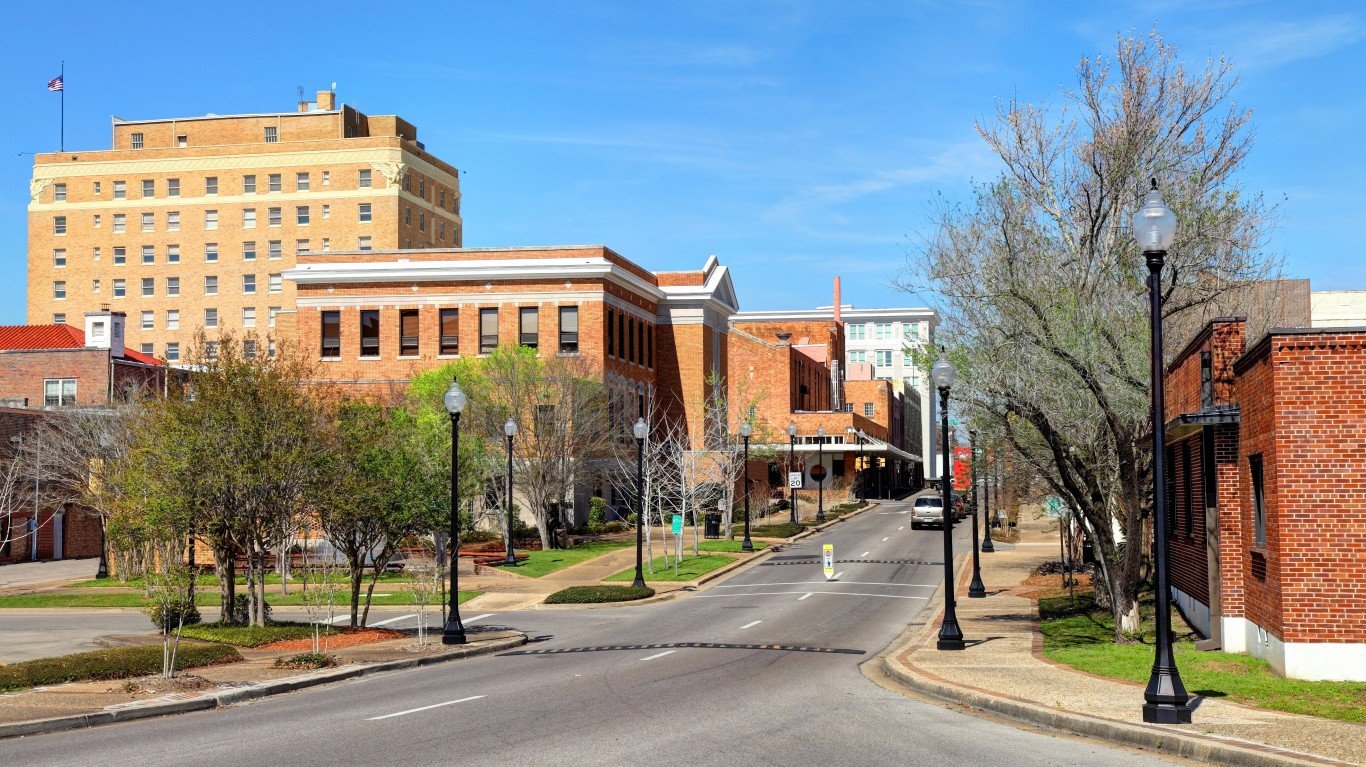
12. Hattiesburg, Mississippi
> Change in reported larceny-theft rate, 2019-2020: +622.5
> Larceny-thefts reported in 2020: 1,904 – 228th highest of 1,046 cities
> Larceny-thefts per 100K people in 2020: 4,150.9 – 17th highest of 1,046 cities
> 1-yr. change in all property crime: +779.5 – 18th highest of 1,037 cities
> Property crimes per 100K people in 2020: 5,271.4 – 21st highest of 1,042 cities
> Population: 46,098
[in-text-ad-2]

11. University Place, Washington
> Change in reported larceny-theft rate, 2019-2020: +646.6
> Larceny-thefts reported in 2020: 622 – 369th lowest of 1,046 cities
> Larceny-thefts per 100K people in 2020: 1,811.4 – 378th highest of 1,046 cities
> 1-yr. change in all property crime: +1,045.4 – 4th highest of 1,037 cities
> Property crimes per 100K people in 2020: 2,632.6 – 324th highest of 1,042 cities
> Population: 33,326
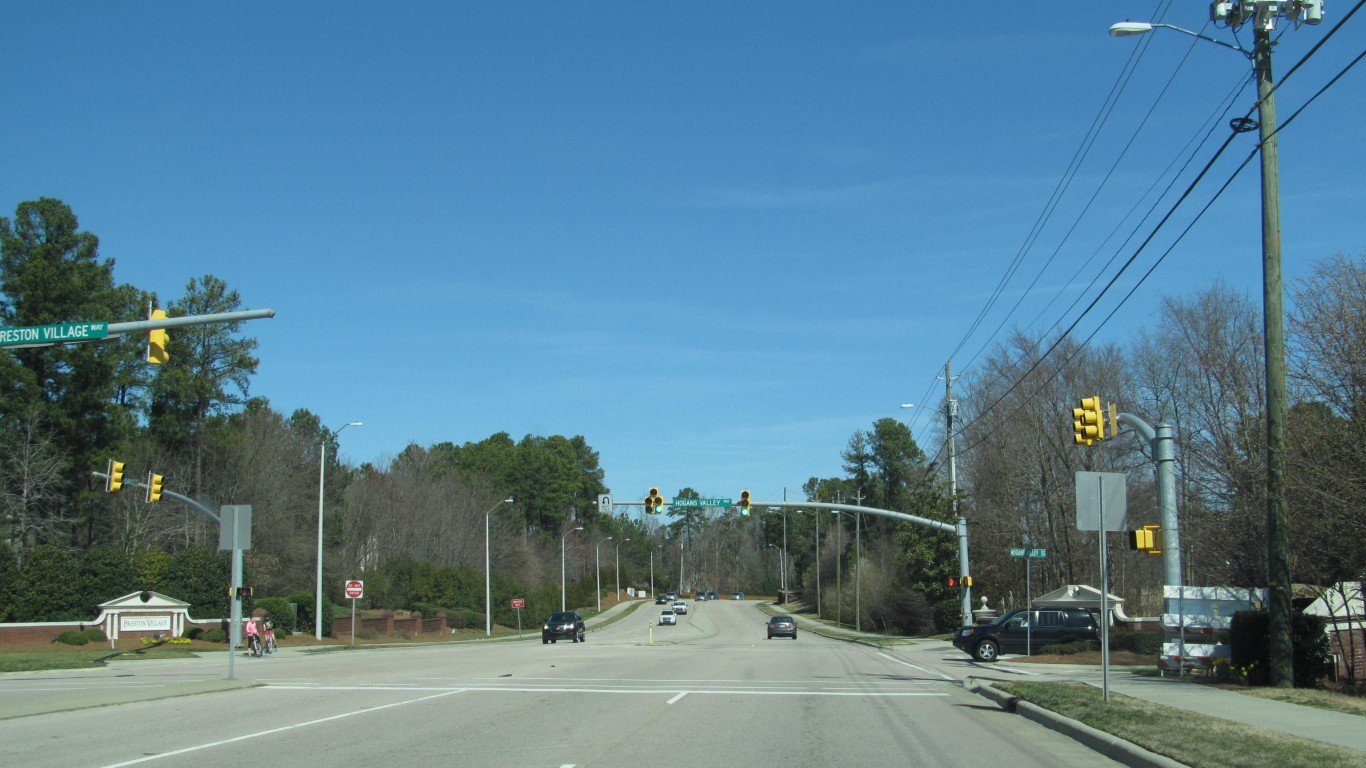
10. Morrisville, North Carolina
> Change in reported larceny-theft rate, 2019-2020: +659.1
> Larceny-thefts reported in 2020: 540 – 309th lowest of 1,046 cities
> Larceny-thefts per 100K people in 2020: 1,784.3 – 391st highest of 1,046 cities
> 1-yr. change in all property crime: +795.3 – 13th highest of 1,037 cities
> Property crimes per 100K people in 2020: 2,111.4 – 499th highest of 1,042 cities
> Population: 26,280
[in-text-ad]

9. Russellville, Arkansas
> Change in reported larceny-theft rate, 2019-2020: +688.4
> Larceny-thefts reported in 2020: 926 – 488th highest of 1,046 cities
> Larceny-thefts per 100K people in 2020: 3,164.1 – 64th highest of 1,046 cities
> 1-yr. change in all property crime: +825.1 – 11th highest of 1,037 cities
> Property crimes per 100K people in 2020: 3,871.4 – 99th highest of 1,042 cities
> Population: 29,193
[recirclink id=1066891]
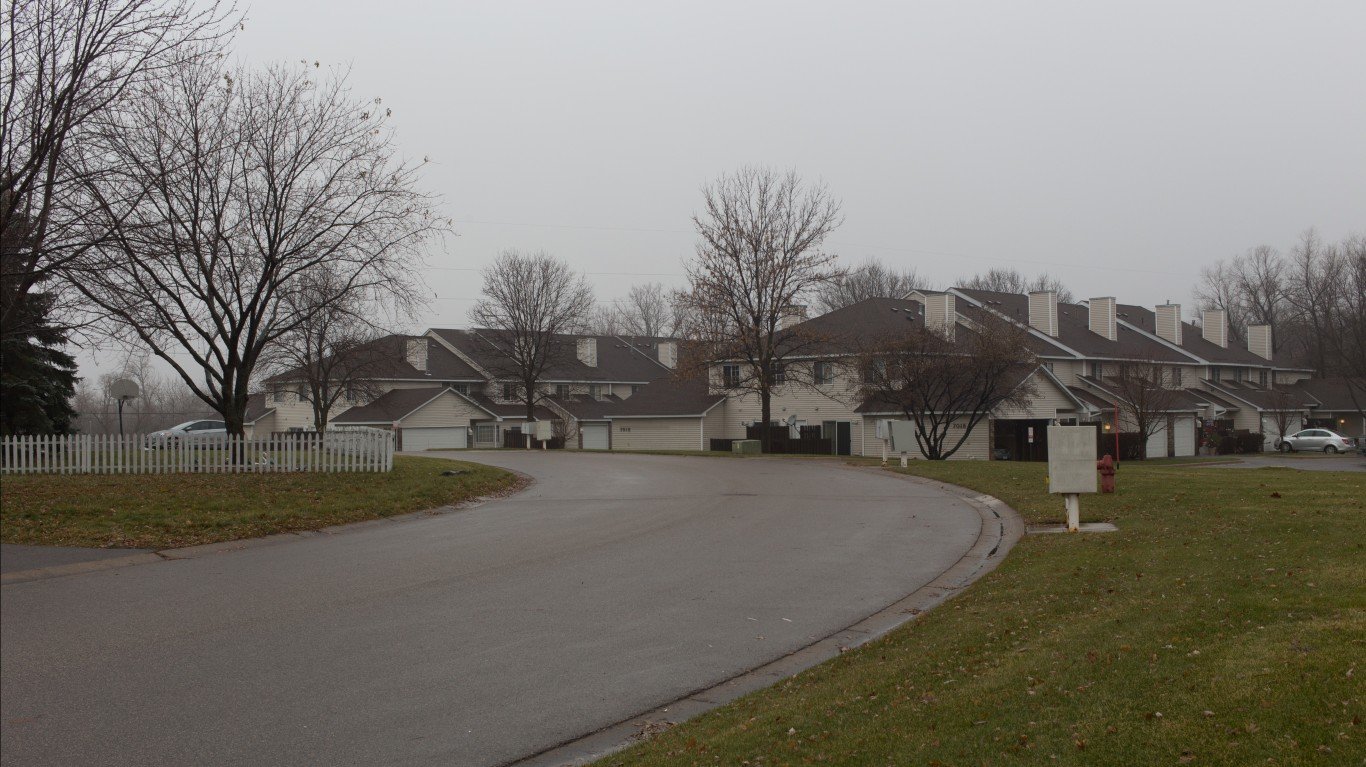
8. Oakdale, Minnesota
> Change in reported larceny-theft rate, 2019-2020: +726.1
> Larceny-thefts reported in 2020: 787 – 481st lowest of 1,046 cities
> Larceny-thefts per 100K people in 2020: 2,811.7 – 100th highest of 1,046 cities
> 1-yr. change in all property crime: +785.1 – 14th highest of 1,037 cities
> Property crimes per 100K people in 2020: 3,344.1 – 169th highest of 1,042 cities
> Population: 27,963

7. SeaTac, Washington
> Change in reported larceny-theft rate, 2019-2020: +748.9
> Larceny-thefts reported in 2020: 838 – 508th lowest of 1,046 cities
> Larceny-thefts per 100K people in 2020: 2,861.8 – 96th highest of 1,046 cities
> 1-yr. change in all property crime: +1,042.7 – 5th highest of 1,037 cities
> Property crimes per 100K people in 2020: 4,760.6 – 44th highest of 1,042 cities
> Population: 29,019
[in-text-ad-2]

6. Ithaca, New York
> Change in reported larceny-theft rate, 2019-2020: +765.7
> Larceny-thefts reported in 2020: 1,000 – 448th highest of 1,046 cities (tied)
> Larceny-thefts per 100K people in 2020: 3,233.4 – 58th highest of 1,046 cities
> 1-yr. change in all property crime: +1,042.0 – 6th highest of 1,037 cities
> Property crimes per 100K people in 2020: 3,741.1 – 112th highest of 1,042 cities
> Population: 30,569

5. La Crosse, Wisconsin
> Change in reported larceny-theft rate, 2019-2020: +797.7
> Larceny-thefts reported in 2020: 1,958 – 217th highest of 1,046 cities
> Larceny-thefts per 100K people in 2020: 3,823.4 – 26th highest of 1,046 cities
> 1-yr. change in all property crime: +780.4 – 17th highest of 1,037 cities
> Property crimes per 100K people in 2020: 4,366.2 – 64th highest of 1,042 cities
> Population: 51,666
[in-text-ad]
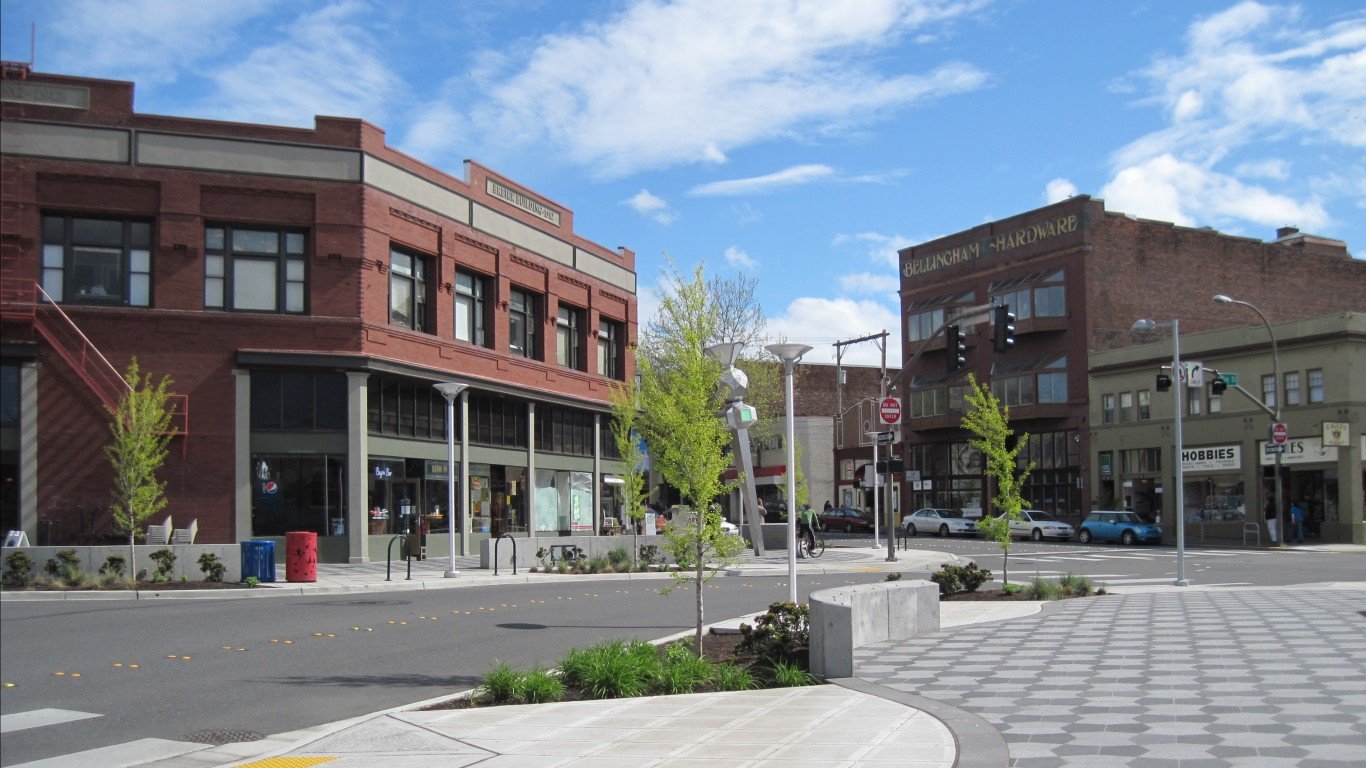
4. Bellingham, Washington
> Change in reported larceny-theft rate, 2019-2020: +1,096.7
> Larceny-thefts reported in 2020: 3,320 – 105th highest of 1,046 cities
> Larceny-thefts per 100K people in 2020: 3,545.9 – 40th highest of 1,046 cities
> 1-yr. change in all property crime: +1,673.2 – 3rd highest of 1,037 cities
> Property crimes per 100K people in 2020: 4,599.0 – 51st highest of 1,042 cities
> Population: 88,764
[recirclink id=1025193]

3. Salt Lake City, Utah
> Change in reported larceny-theft rate, 2019-2020: +1,106.2
> Larceny-thefts reported in 2020: 11,128 – 31st highest of 1,046 cities
> Larceny-thefts per 100K people in 2020: 5,503.8 – 3rd highest of 1,046 cities
> 1-yr. change in all property crime: +1,694.7 – 2nd highest of 1,037 cities
> Property crimes per 100K people in 2020: 7,352.1 – 3rd highest of 1,042 cities
> Population: 197,756
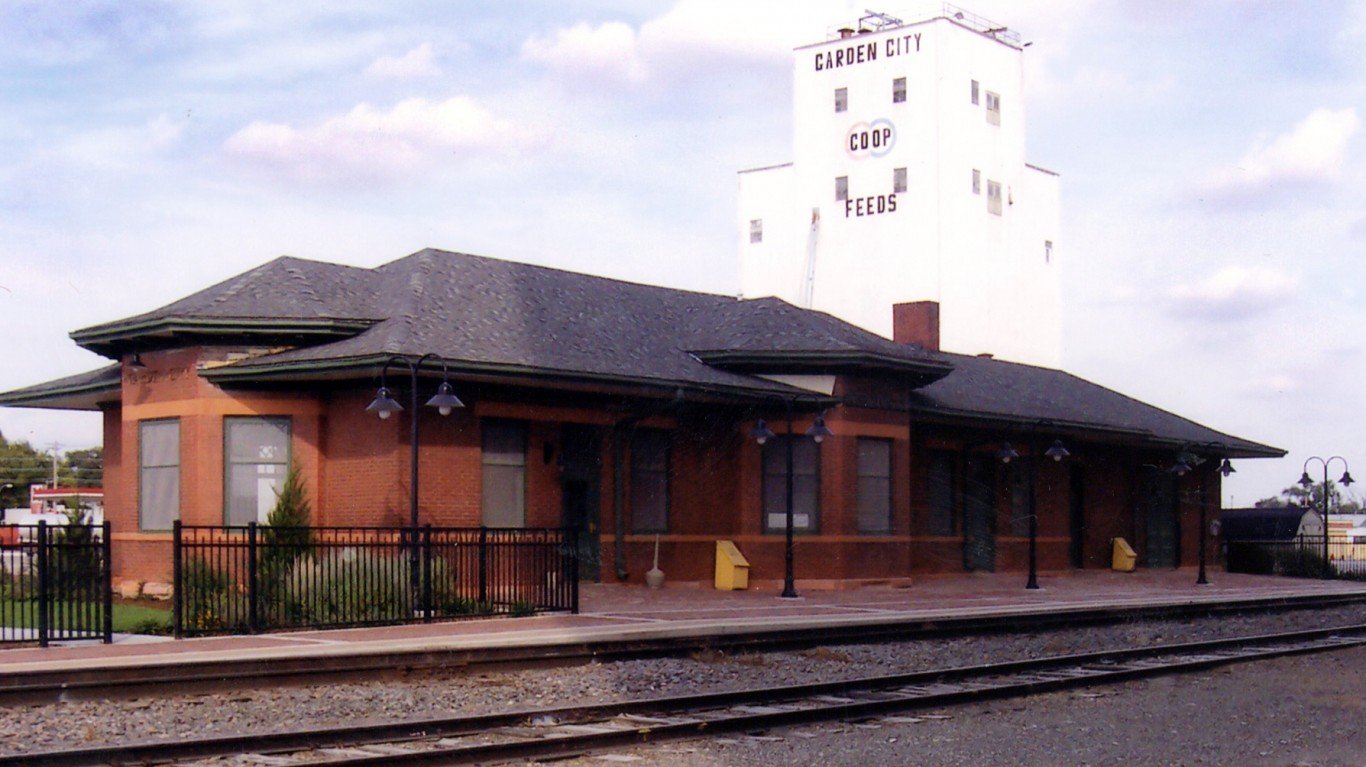
2. Garden City, Kansas
> Change in reported larceny-theft rate, 2019-2020: +1,109.8
> Larceny-thefts reported in 2020: 741 – 446th lowest of 1,046 cities (tied)
> Larceny-thefts per 100K people in 2020: 2,811.1 – 101st highest of 1,046 cities
> 1-yr. change in all property crime: N/A
> Property crimes per 100K people in 2020: 3,429.4 – 156th highest of 1,042 cities
> Population: 26,647
[in-text-ad-2]
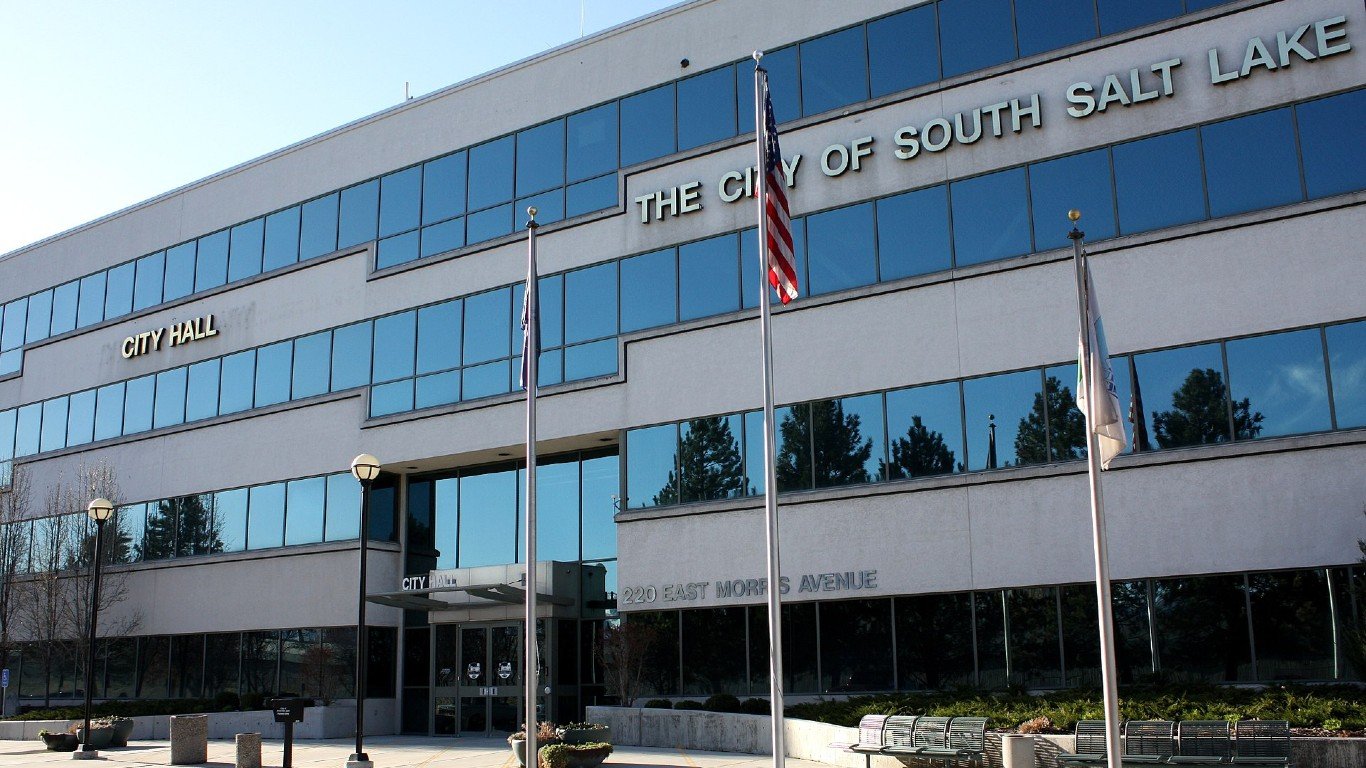
1. South Salt Lake, Utah
> Change in reported larceny-theft rate, 2019-2020: +1,581.7
> Larceny-thefts reported in 2020: 1,679 – 264th highest of 1,046 cities
> Larceny-thefts per 100K people in 2020: 6,503.7 – 2nd highest of 1,046 cities
> 1-yr. change in all property crime: +1,918.2 – the highest of 1,037 cities
> Property crimes per 100K people in 2020: 9,203.6 – the highest of 1,042 cities
> Population: 25,017
Contact [email protected] for any questions or corrections.