When the COVID-19 pandemic reared its ugly head in 2020, it upended just about every aspect of the everyday life we had become accustomed to. Schools and businesses shut down, social distancing became de rigueur, and many people began working remotely. With this upheaval, some people began rethinking their living situation and decided to relocate.
To identify America’s fastest growing metro areas during the pandemic, 24/7 Wall St. reviewed population change data from the U.S. Census Bureau. We ranked all U.S. metro areas on the percent change in residents from July 1, 2020 to July 1, 2021. The fastest growing metros added anywhere from 1.5% to 5.1% during the pandemic.
The components of population change are net migration – the number of people who moved to a given metro area less the number of people who move out – and natural population change, which is the number of births less the number of deaths. (Due to margins of error in census estimates, the raw population change number is close to, but not precisely equal to, the sum of net migration and natural population change.)
People decide to move for a host of reasons. Some are simply looking to upgrade to a nicer house or apartment. Some start a new job. Some grow their family. Some move in order to send their kids to better schools or to escape to a more hospitable climate. (See the state where the population has grown the most since the pandemic.)
From March to November 2020, at the height of the pandemic, about 5% of Americans moved either permanently or temporarily, according to a study by the Pew Research Center. A full third of those people moved for financial reasons, 17% moved to be near family or a partner, and 14% moved to a place with a lower coronavirus risk.
During the first year of the pandemic, it might have seemed as if lots of people moved, but in reality, overall moves plummeted to the lowest levels since 1947, with only 8.2% of residents moving, down from 9.0% the year before, according to Census Bureau data. The percentage of people who move has actually been consistently declining since the 1960s, when about one-fifth of Americans changed residences annually. (These are the years the most Americans moved since 2000.)
The trend during the pandemic continued the longer-term of Americans moving to Sun Belt states, mostly from the Northeast to the South and the West. This was no different among the fastest growing metros, with 15 of the metro areas on the list located in Florida, six in Georgia, five in Idaho, and three each in Arizona, Texas, Alabama, and North Carolina.
Click here to see metro areas with the biggest pandemic population increase

50. Auburn-Opelika, AL
> Net population change, 2020-2021: +1.5% (+2,617 people)
> Net change from migration: +2,277 people
> Natural population change: +330
> Total population, 2021: 177,218
[in-text-ad]

49. Barnstable Town, MA
> Net population change, 2020-2021: +1.5% (+3,442 people)
> Net change from migration: +5,448 people
> Natural population change: -1,941
> Total population, 2021: 232,411
[recirclink id=1048297]

48. Warner Robins, GA
> Net population change, 2020-2021: +1.5% (+2,969 people)
> Net change from migration: +2,617 people
> Natural population change: +357
> Total population, 2021: 195,246

47. Phoenix-Mesa-Chandler, AZ
> Net population change, 2020-2021: +1.6% (+78,220 people)
> Net change from migration: +70,097 people
> Natural population change: +8,142
> Total population, 2021: 4,946,145
[in-text-ad-2]

46. Winchester, VA-WV
> Net population change, 2020-2021: +1.6% (+2,314 people)
> Net change from migration: +2,476 people
> Natural population change: -147
> Total population, 2021: 145,155

45. Sioux Falls, SD
> Net population change, 2020-2021: +1.6% (+4,500 people)
> Net change from migration: +3,174 people
> Natural population change: +1,310
> Total population, 2021: 281,958
[in-text-ad]

44. Jacksonville, FL
> Net population change, 2020-2021: +1.6% (+26,278 people)
> Net change from migration: +25,857 people
> Natural population change: +621
> Total population, 2021: 1,637,666
[recirclink id=1077169]

43. Hinesville, GA
> Net population change, 2020-2021: +1.7% (+1,356 people)
> Net change from migration: +237 people
> Natural population change: +1,126
> Total population, 2021: 82,863

42. Merced, CA
> Net population change, 2020-2021: +1.7% (+4,735 people)
> Net change from migration: +3,220 people
> Natural population change: +1,513
> Total population, 2021: 286,461
[in-text-ad-2]

41. Lake Havasu City-Kingman, AZ
> Net population change, 2020-2021: +1.7% (+3,622 people)
> Net change from migration: +6,045 people
> Natural population change: -2,350
> Total population, 2021: 217,692

40. Huntsville, AL
> Net population change, 2020-2021: +1.8% (+8,710 people)
> Net change from migration: +8,832 people
> Natural population change: -70
> Total population, 2021: 502,728
[in-text-ad]

39. Madera, CA
> Net population change, 2020-2021: +1.8% (+2,790 people)
> Net change from migration: +2,033 people
> Natural population change: +767
> Total population, 2021: 159,410
[recirclink id=1063627]
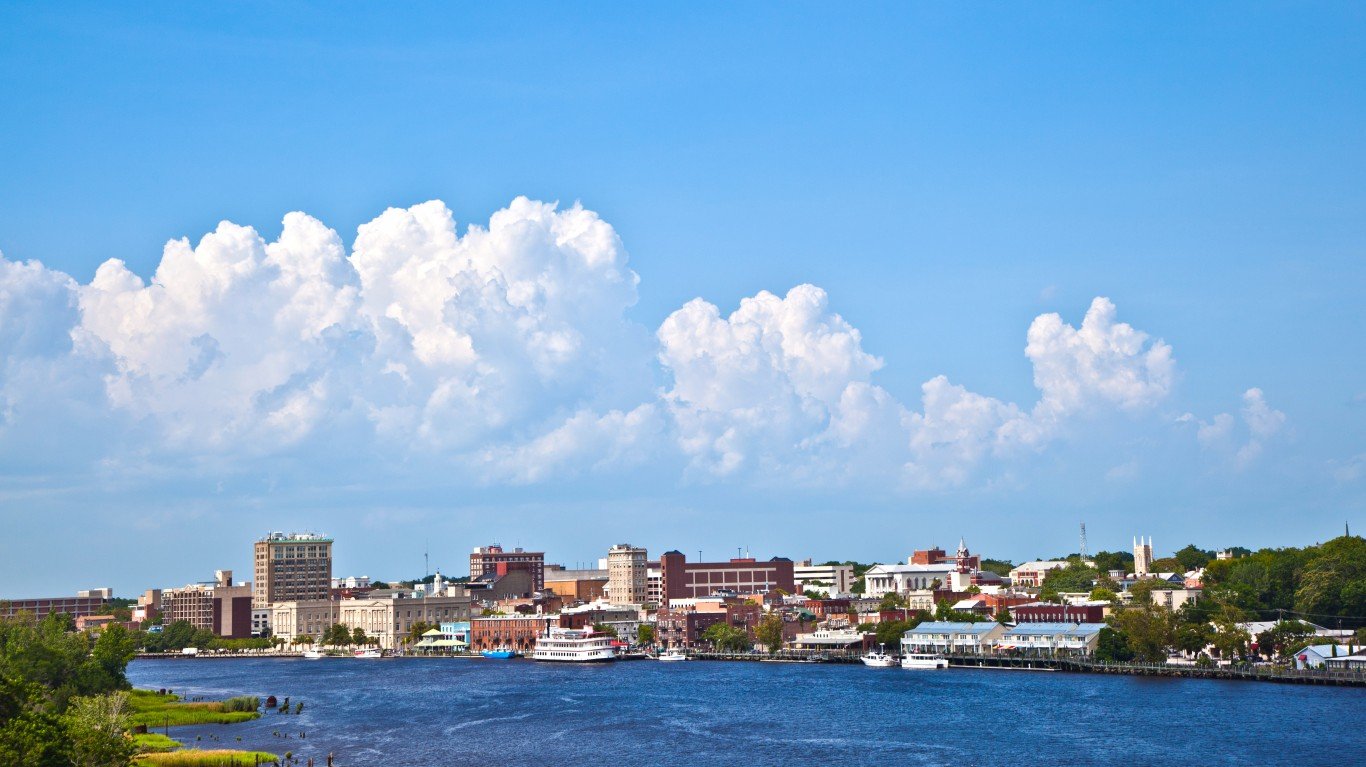
38. Wilmington, NC
> Net population change, 2020-2021: +1.8% (+5,210 people)
> Net change from migration: +5,873 people
> Natural population change: -621
> Total population, 2021: 291,833

37. Gainesville, GA
> Net population change, 2020-2021: +1.9% (+3,780 people)
> Net change from migration: +3,304 people
> Natural population change: +481
> Total population, 2021: 207,369
[in-text-ad-2]

36. Rapid City, SD
> Net population change, 2020-2021: +1.9% (+2,651 people)
> Net change from migration: +2,469 people
> Natural population change: +196
> Total population, 2021: 141,979
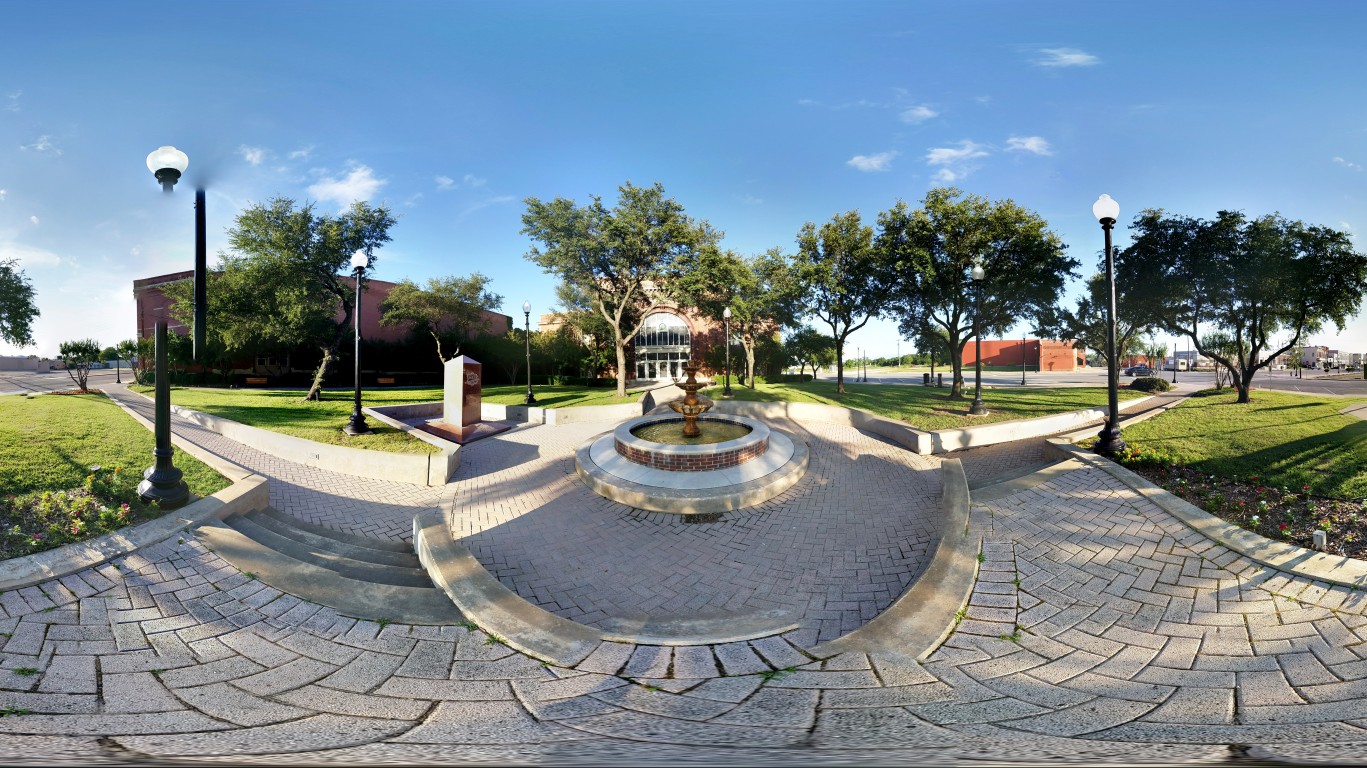
35. Killeen-Temple, TX
> Net population change, 2020-2021: +2.0% (+9,317 people)
> Net change from migration: +6,112 people
> Natural population change: +3,182
> Total population, 2021: 486,101
[in-text-ad]
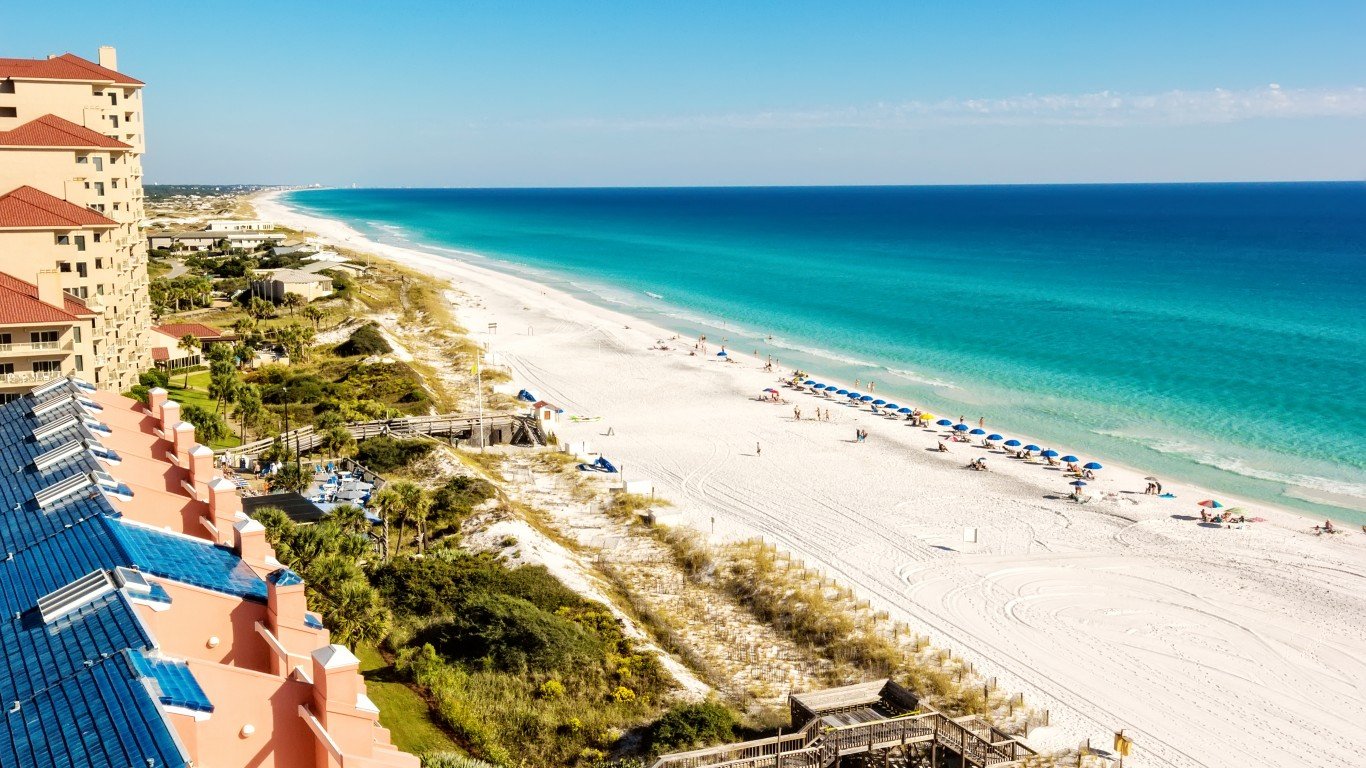
34. Crestview-Fort Walton Beach-Destin, FL
> Net population change, 2020-2021: +2.0% (+5,660 people)
> Net change from migration: +5,441 people
> Natural population change: +260
> Total population, 2021: 293,324
[recirclink id=1063362]

33. Spartanburg, SC
> Net population change, 2020-2021: +2.0% (+6,500 people)
> Net change from migration: +6,632 people
> Natural population change: -79
> Total population, 2021: 335,864

32. Raleigh-Cary, NC
> Net population change, 2020-2021: +2.0% (+28,186 people)
> Net change from migration: +23,279 people
> Natural population change: +4,943
> Total population, 2021: 1,448,411
[in-text-ad-2]

31. Fayetteville-Springdale-Rogers, AR
> Net population change, 2020-2021: +2.0% (+11,143 people)
> Net change from migration: +9,123 people
> Natural population change: +2,038
> Total population, 2021: 560,709

30. Sebring-Avon Park, FL
> Net population change, 2020-2021: +2.0% (+2,074 people)
> Net change from migration: +3,213 people
> Natural population change: -1,096
> Total population, 2021: 103,296
[in-text-ad]

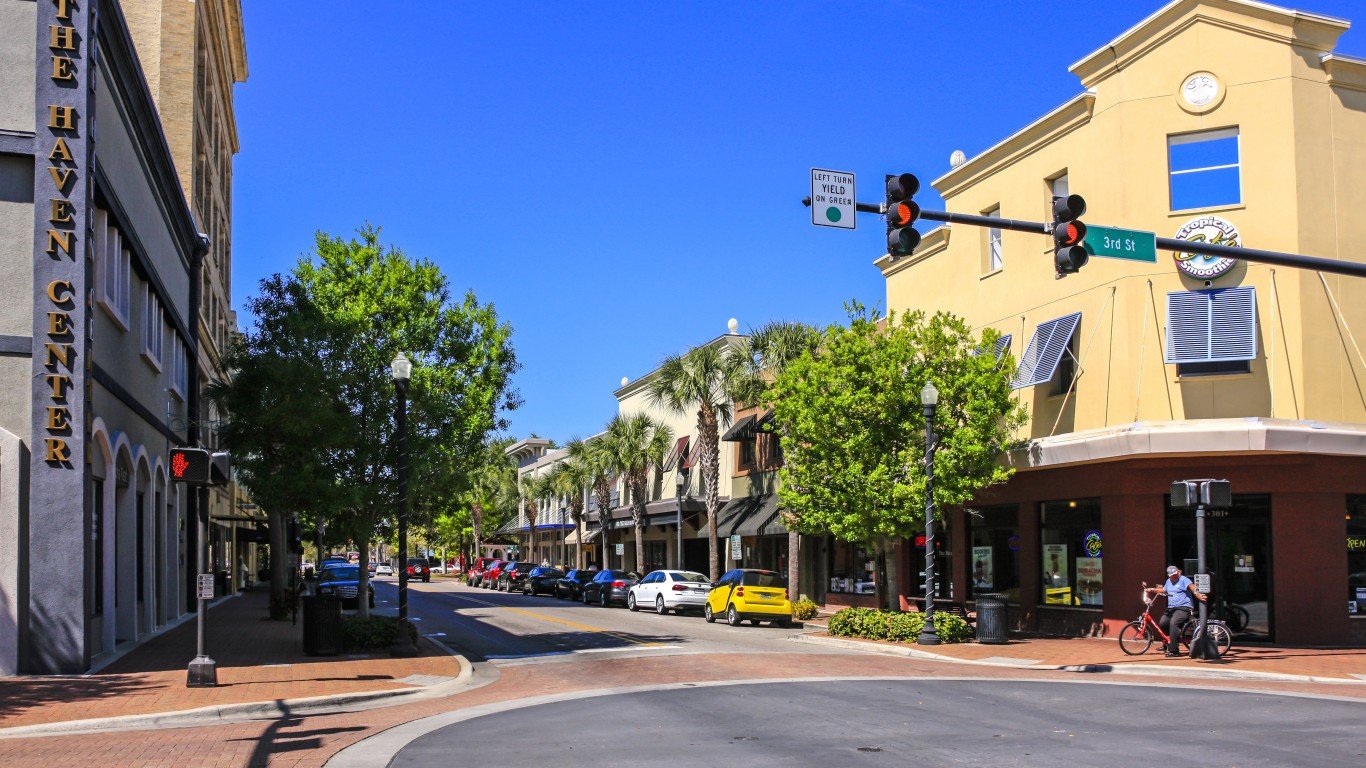
29. Sebastian-Vero Beach, FL
> Net population change, 2020-2021: +2.1% (+3,317 people)
> Net change from migration: +4,695 people
> Natural population change: -1,326
> Total population, 2021: 163,662
[recirclink id=1048587]

28. Clarksville, TN-KY
> Net population change, 2020-2021: +2.1% (+6,697 people)
> Net change from migration: +4,596 people
> Natural population change: +2,150
> Total population, 2021: 328,304

27. Twin Falls, ID
> Net population change, 2020-2021: +2.1% (+2,404 people)
> Net change from migration: +2,146 people
> Natural population change: +268
> Total population, 2021: 116,905
[in-text-ad-2]
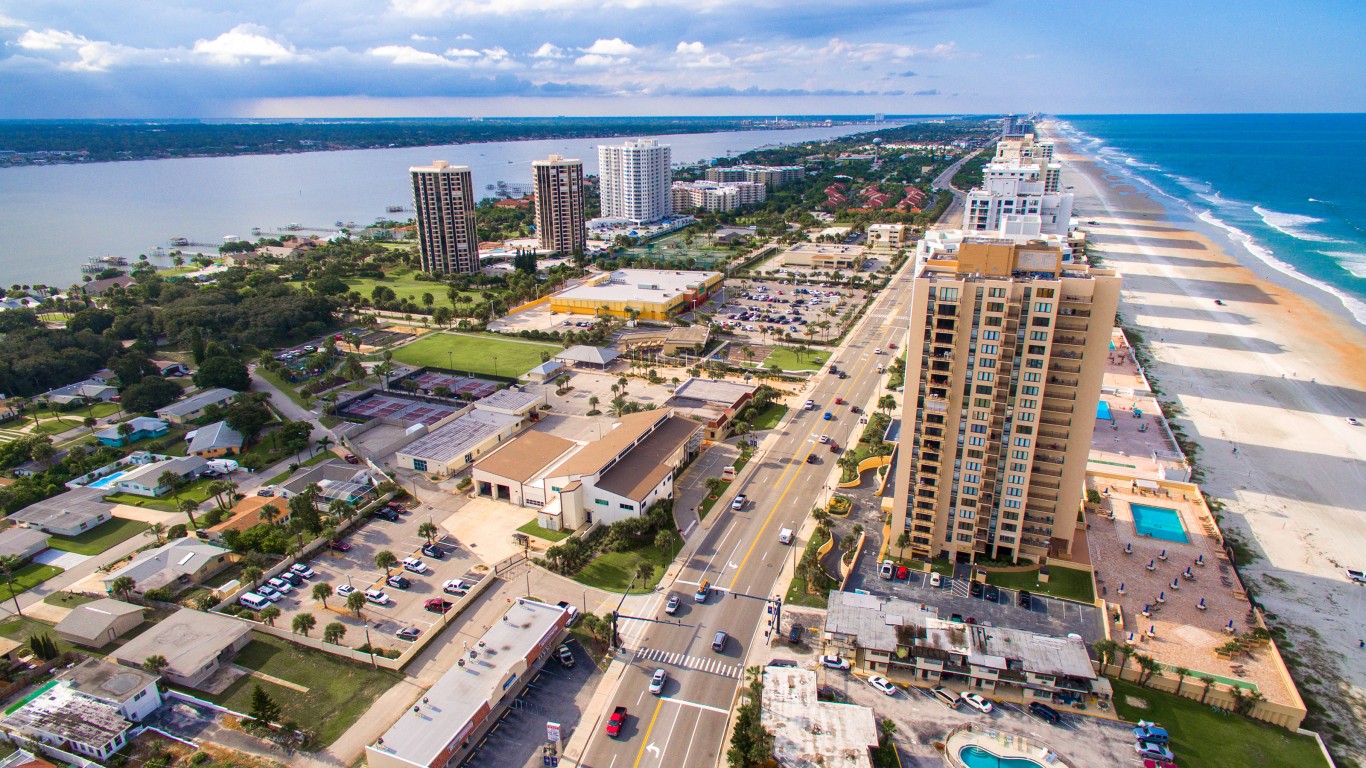
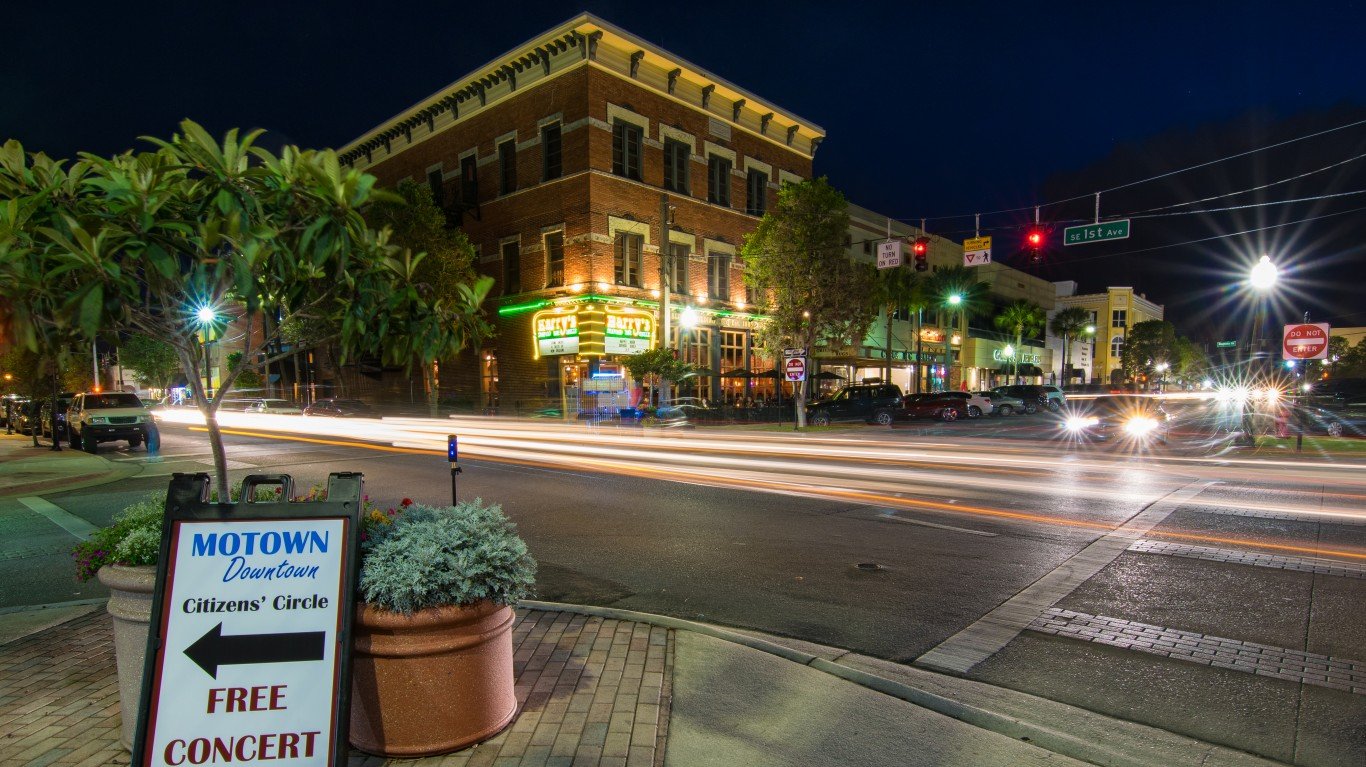
26. Deltona-Daytona Beach-Ormond Beach, FL
> Net population change, 2020-2021: +2.2% (+14,475 people)
> Net change from migration: +19,414 people
> Natural population change: -4,701
> Total population, 2021: 685,344

25. Prescott Valley-Prescott, AZ
> Net population change, 2020-2021: +2.2% (+5,186 people)
> Net change from migration: +7,268 people
> Natural population change: -1,989
> Total population, 2021: 242,253
[in-text-ad]
24. Ocala, FL
> Net population change, 2020-2021: +2.3% (+8,545 people)
> Net change from migration: +11,440 people
> Natural population change: -2,750
> Total population, 2021: 385,915
[recirclink id=1048297]

23. Austin-Round Rock-Georgetown, TX
> Net population change, 2020-2021: +2.3% (+53,301 people)
> Net change from migration: +42,541 people
> Natural population change: +11,145
> Total population, 2021: 2,352,426

22. Salisbury, MD-DE
> Net population change, 2020-2021: +2.3% (+9,826 people)
> Net change from migration: +11,748 people
> Natural population change: -1,803
> Total population, 2021: 429,223
[in-text-ad-2]

21. Naples-Marco Island, FL
> Net population change, 2020-2021: +2.4% (+8,901 people)
> Net change from migration: +10,724 people
> Natural population change: -1,725
> Total population, 2021: 385,980

20. Homosassa Springs, FL
> Net population change, 2020-2021: +2.4% (+3,680 people)
> Net change from migration: +5,977 people
> Natural population change: -2,204
> Total population, 2021: 158,083
[in-text-ad]
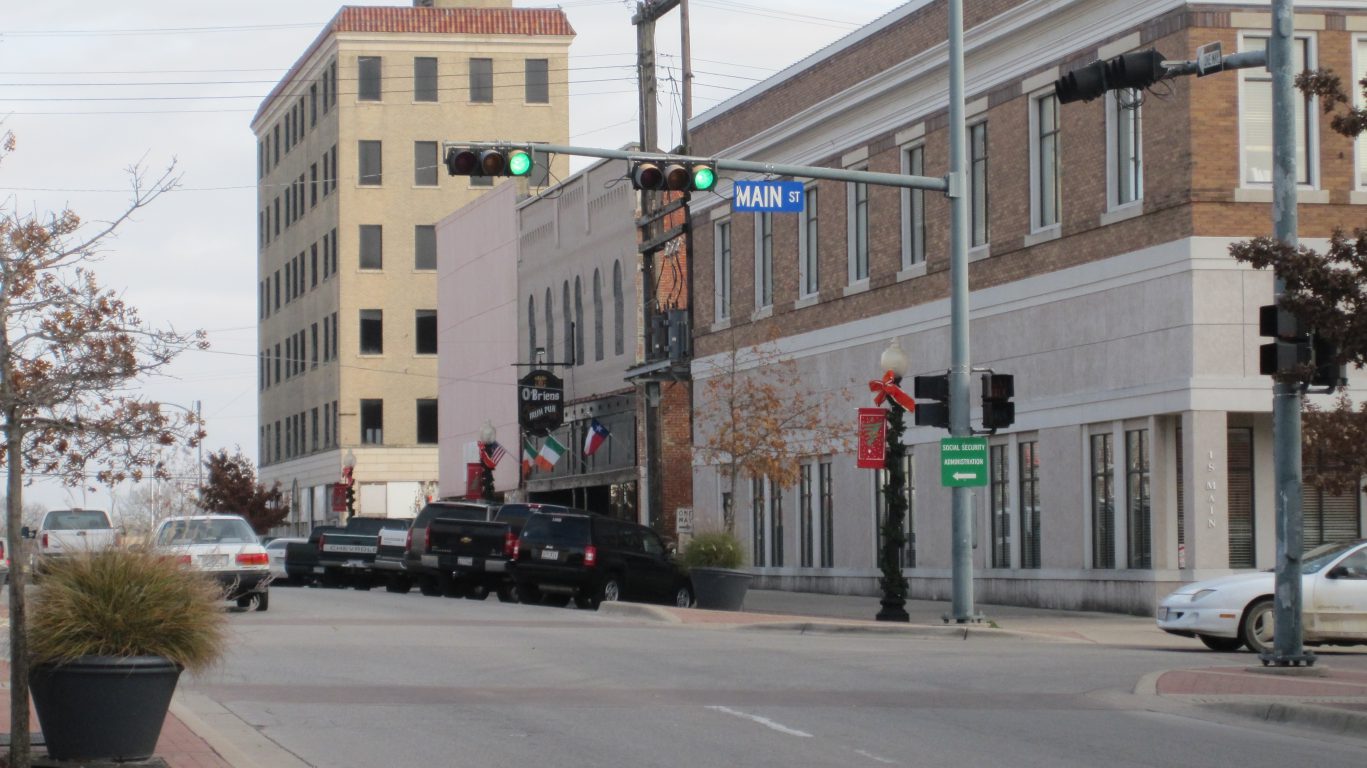
19. Sherman-Denison, TX
> Net population change, 2020-2021: +2.4% (+3,322 people)
> Net change from migration: +3,669 people
> Natural population change: -306
> Total population, 2021: 139,336
[recirclink id=1077169]

18. Hilton Head Island-Bluffton, SC
> Net population change, 2020-2021: +2.4% (+5,308 people)
> Net change from migration: +5,757 people
> Natural population change: -394
> Total population, 2021: 222,072

17. Greeley, CO
> Net population change, 2020-2021: +2.6% (+8,678 people)
> Net change from migration: +6,730 people
> Natural population change: +1,993
> Total population, 2021: 340,036
[in-text-ad-2]

16. Daphne-Fairhope-Foley, AL
> Net population change, 2020-2021: +2.6% (+6,154 people)
> Net change from migration: +6,843 people
> Natural population change: -607
> Total population, 2021: 239,294
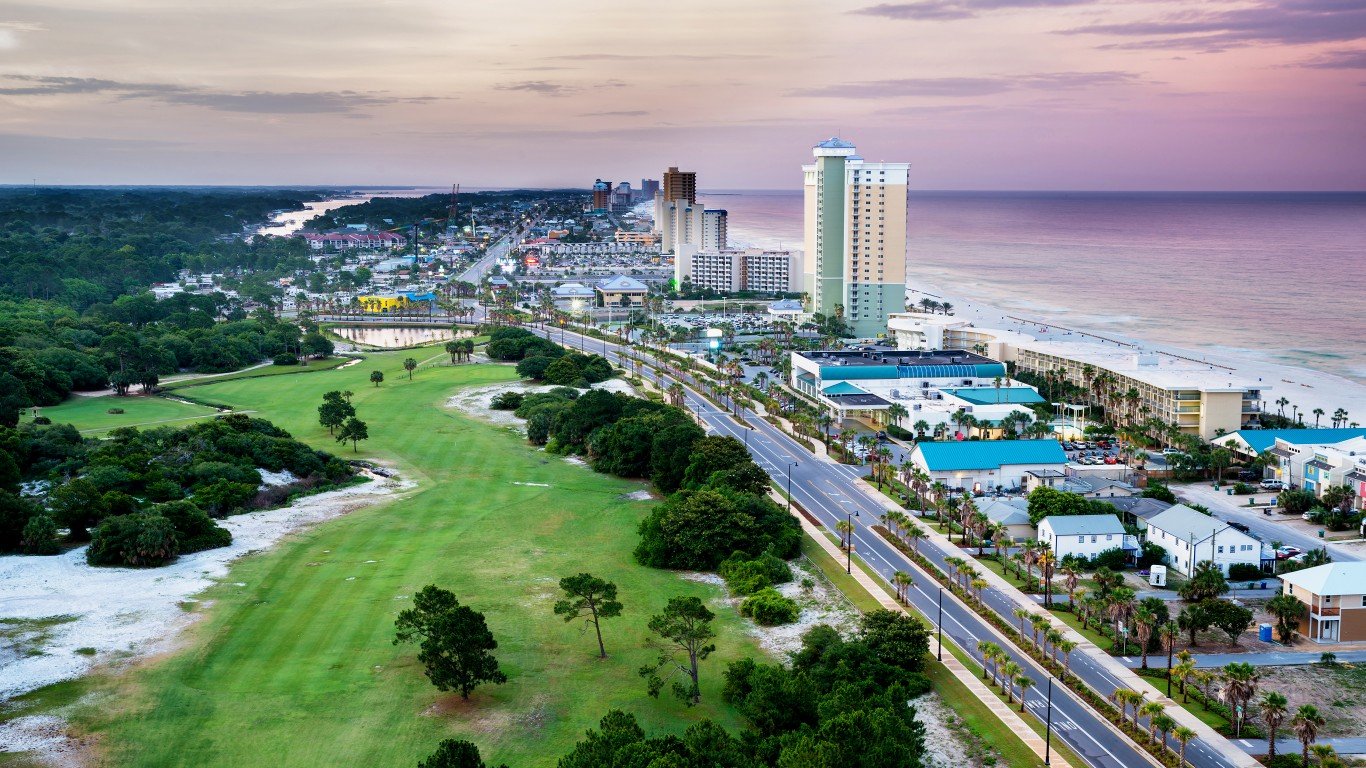
15. Panama City, FL
> Net population change, 2020-2021: +2.7% (+4,707 people)
> Net change from migration: +5,105 people
> Natural population change: -330
> Total population, 2021: 179,168
[in-text-ad]

14. North Port-Sarasota-Bradenton, FL
> Net population change, 2020-2021: +2.7% (+22,653 people)
> Net change from migration: +29,691 people
> Natural population change: -6,643
> Total population, 2021: 859,760
[recirclink id=1063627]

13. Bend, OR
> Net population change, 2020-2021: +2.7% (+5,446 people)
> Net change from migration: +5,638 people
> Natural population change: -124
> Total population, 2021: 204,801
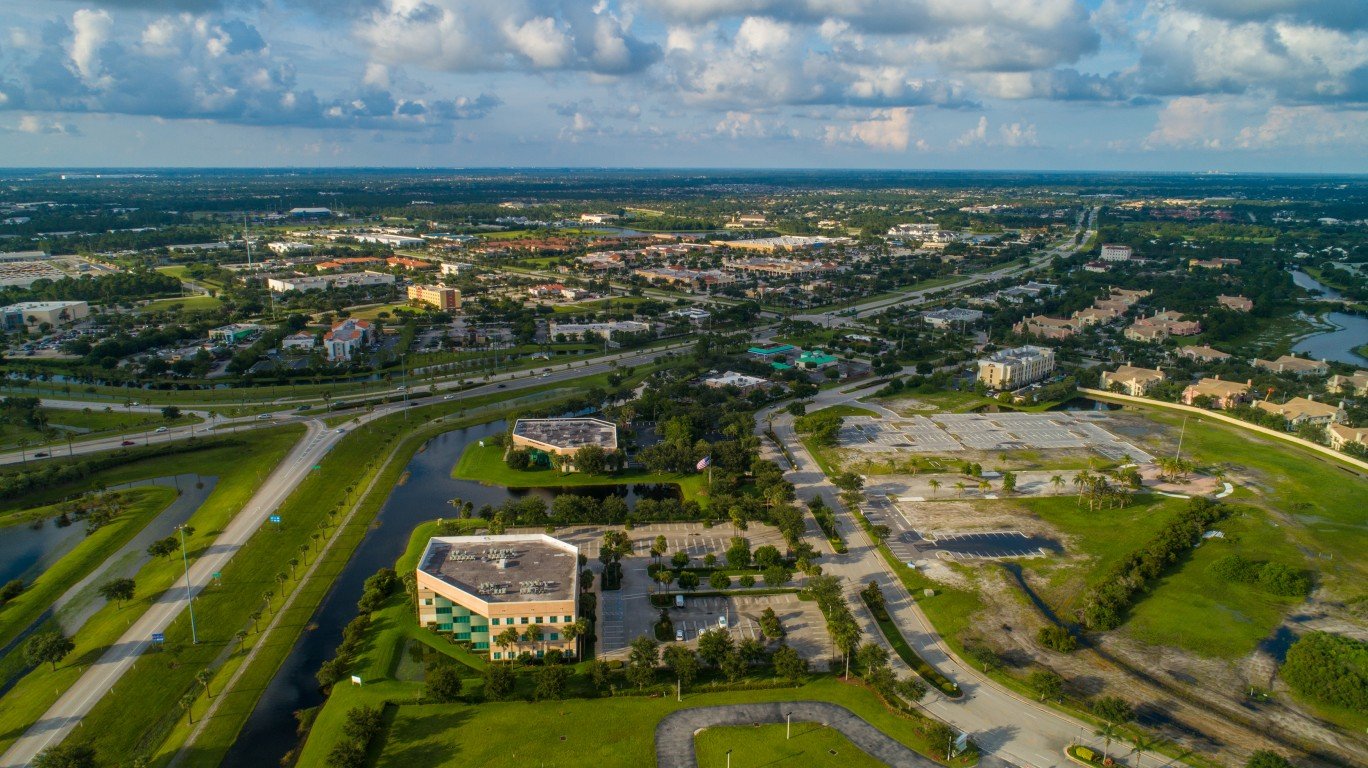
12. Port St. Lucie, FL
> Net population change, 2020-2021: +2.8% (+13,717 people)
> Net change from migration: +16,645 people
> Natural population change: -2,698
> Total population, 2021: 503,521
[in-text-ad-2]

11. Idaho Falls, ID
> Net population change, 2020-2021: +2.9% (+4,528 people)
> Net change from migration: +3,644 people
> Natural population change: +921
> Total population, 2021: 162,786

10. Logan, UT-ID
> Net population change, 2020-2021: +2.9% (+4,287 people)
> Net change from migration: +2,846 people
> Natural population change: +1,458
> Total population, 2021: 152,083
[in-text-ad]

9. Cape Coral-Fort Myers, FL
> Net population change, 2020-2021: +3.0% (+23,297 people)
> Net change from migration: +26,813 people
> Natural population change: -3,184
> Total population, 2021: 787,976
[recirclink id=1063362]

8. Provo-Orem, UT
> Net population change, 2020-2021: +3.3% (+22,174 people)
> Net change from migration: +13,912 people
> Natural population change: +8,332
> Total population, 2021: 697,141
7. Lakeland-Winter Haven, FL
> Net population change, 2020-2021: +3.3% (+24,287 people)
> Net change from migration: +25,517 people
> Natural population change: -876
> Total population, 2021: 753,520
[in-text-ad-2]

6. Boise City, ID
> Net population change, 2020-2021: +3.3% (+25,687 people)
> Net change from migration: +24,261 people
> Natural population change: +1,697
> Total population, 2021: 795,268
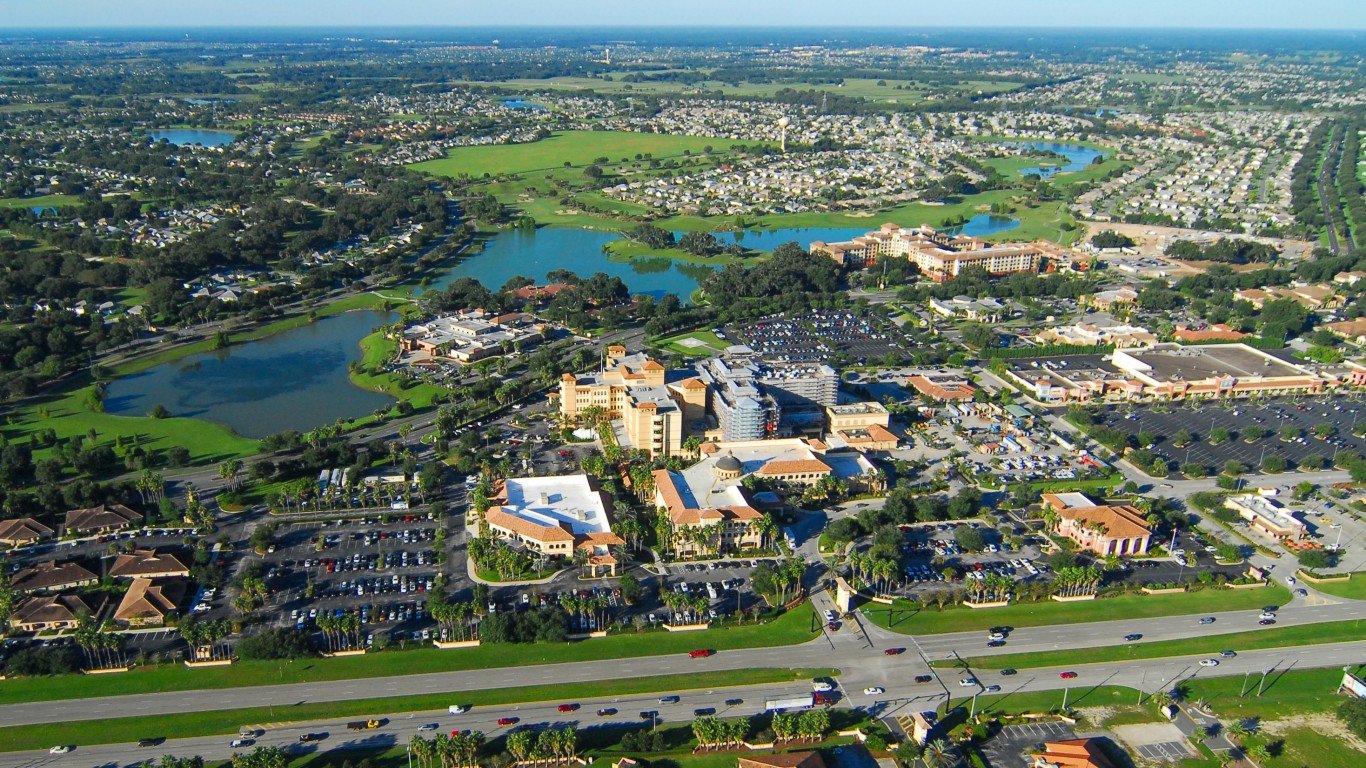
5. The Villages, FL
> Net population change, 2020-2021: +3.6% (+4,741 people)
> Net change from migration: +7,105 people
> Natural population change: -2,253
> Total population, 2021: 135,638
[in-text-ad]

4. Punta Gorda, FL
> Net population change, 2020-2021: +3.7% (+6,883 people)
> Net change from migration: +9,526 people
> Natural population change: -2,498
> Total population, 2021: 194,843
[recirclink id=1048587]

3. Myrtle Beach-Conway-North Myrtle Beach, SC-NC
> Net population change, 2020-2021: +3.7% (+18,212 people)
> Net change from migration: +21,921 people
> Natural population change: -3,421
> Total population, 2021: 509,794

2. Coeur d’Alene, ID
> Net population change, 2020-2021: +4.1% (+7,143 people)
> Net change from migration: +7,283 people
> Natural population change: -33
> Total population, 2021: 179,789
[in-text-ad-2]

1. St. George, UT
> Net population change, 2020-2021: +5.1% (+9,302 people)
> Net change from migration: +9,204 people
> Natural population change: +237
> Total population, 2021: 191,226
Contact [email protected] for any questions or corrections.