
At least 27 million Americans have relocated each year since the government began record keeping in 1948. The reasons any one person or family may decide to move are often personal. These include being closer to relatives, starting a new relationship, or needing a larger home.
However, many parts of the country offer advantages with more universal appeal, and some of these places have seen a population boom in the last year.
Using metro area level data from the U.S. Census Bureau’s Population Estimates Program, 24/7 Wall St. identified the cities bringing in the most people. Metro areas were ranked based on the percentage change in population due to net migration from July 1, 2021 to June 30, 2022. Data was aggregated from the county level to the metropolitan level using metropolitan statistical area definitions for July 2023 from the Census Bureau.
The number of people who moved to each of the 50 metro areas on this list between July 2021 and June 2022 is larger than the number who moved out by anywhere from about 1,400 to over 128,000. In some cases, this amounted to a population increase of well over 4%, not factoring in population change from births or deaths. While domestic migration accounted for the bulk of new residents in the cities on this list, all but one have also had a net gain in international migrants as well. (Here is a look at the best U.S. cities for immigrants, according to data.)
Some portion of Americans who move each year do so to be in a better climate, and many of the metro areas on this list have warm temperatures year-round. Of the 50 cities on this list, 39 are located in the South, including 18 in Florida alone. Meanwhile, only three cities on this list are in the Midwest and none are in the Northeast.
Financial incentives may also be a pull factor in many of these places. Including the 18 metro areas in Florida, the four in Texas, and the three in Tennessee, over half of the cities on this list are in states that do not levy a personal income tax. (This is where Americans are paying the most in state and local taxes.)
Click here to see the cities gaining the most people.
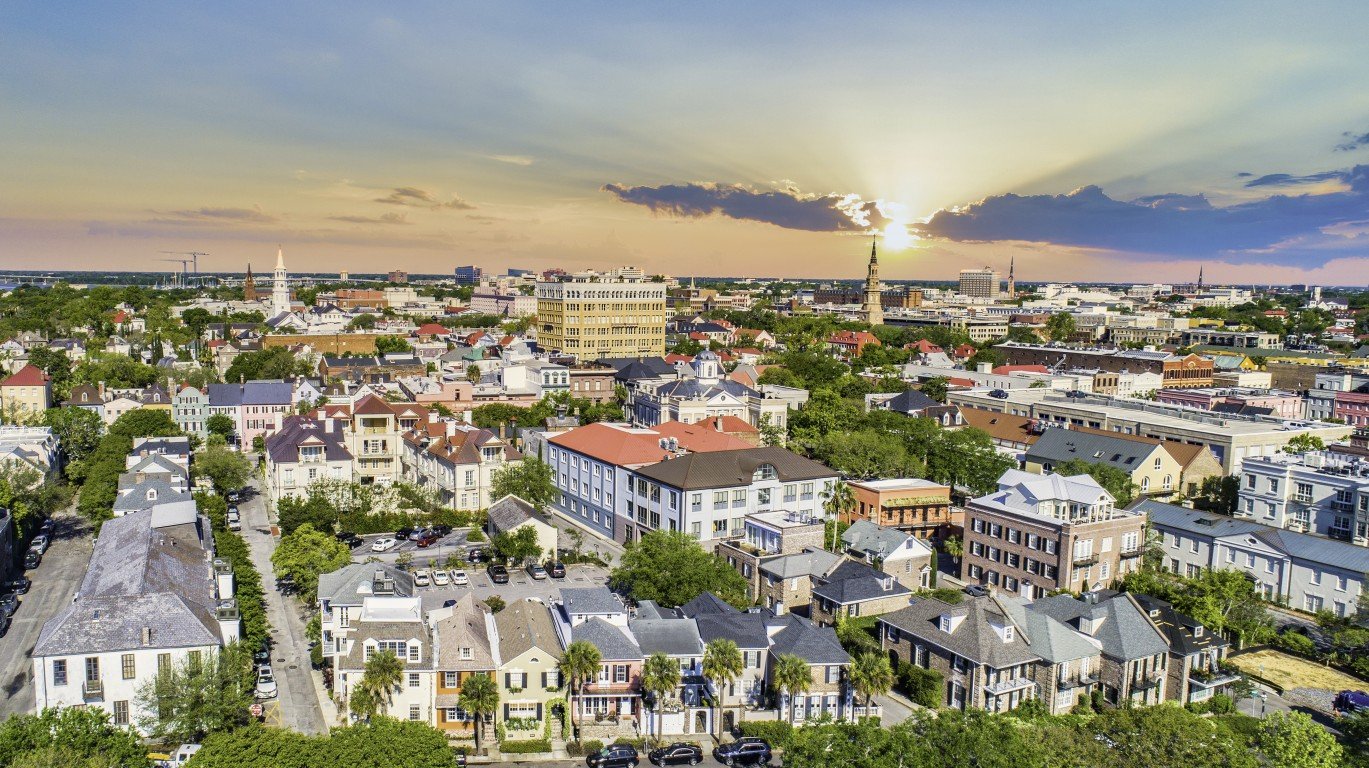
50. Charleston-North Charleston, SC
> Population change due to net migration, 2021 to 2022: +1.6% (+13,324)
> Net domestic migration, 2021 to 2022: +11,048
> Net international migration, 2021 to 2022: +2,276
> Total population, 2022: 830,529
[in-text-ad]

49. Dallas-Fort Worth-Arlington, TX
> Population change due to net migration, 2021 to 2022: +1.6% (+128,239)
> Net domestic migration, 2021 to 2022: +89,734
> Net international migration, 2021 to 2022: +38,505
> Total population, 2022: 7,943,685
[recirclink id=1190575]

48. Billings, MT
> Population change due to net migration, 2021 to 2022: +1.7% (+3,128)
> Net domestic migration, 2021 to 2022: +2,828
> Net international migration, 2021 to 2022: +300
> Total population, 2022: 190,208

47. Bellingham, WA
> Population change due to net migration, 2021 to 2022: +1.7% (+3,865)
> Net domestic migration, 2021 to 2022: +3,342
> Net international migration, 2021 to 2022: +523
> Total population, 2022: 230,677
[in-text-ad-2]

46. Hinesville, GA
> Population change due to net migration, 2021 to 2022: +1.7% (+1,438)
> Net domestic migration, 2021 to 2022: +1,324
> Net international migration, 2021 to 2022: +114
> Total population, 2022: 86,378

45. Raleigh-Cary, NC
> Population change due to net migration, 2021 to 2022: +1.8% (+25,616)
> Net domestic migration, 2021 to 2022: +19,985
> Net international migration, 2021 to 2022: +5,631
> Total population, 2022: 1,484,338
[in-text-ad]

44. Coeur d’Alene, ID
> Population change due to net migration, 2021 to 2022: +1.9% (+3,338)
> Net domestic migration, 2021 to 2022: +3,390
> Net international migration, 2021 to 2022: -52
> Total population, 2022: 183,578
[recirclink id=1163587]

43. Sioux Falls, SD-MN
> Population change due to net migration, 2021 to 2022: +1.9% (+5,448)
> Net domestic migration, 2021 to 2022: +4,137
> Net international migration, 2021 to 2022: +1,311
> Total population, 2022: 299,129

42. Savannah, GA
> Population change due to net migration, 2021 to 2022: +1.9% (+7,740)
> Net domestic migration, 2021 to 2022: +7,009
> Net international migration, 2021 to 2022: +731
> Total population, 2022: 418,373
[in-text-ad-2]
41. Crestview-Fort Walton Beach-Destin, FL
> Population change due to net migration, 2021 to 2022: +1.9% (+5,590)
> Net domestic migration, 2021 to 2022: +5,078
> Net international migration, 2021 to 2022: +512
> Total population, 2022: 299,786

40. Fayetteville-Springdale-Rogers, AR
> Population change due to net migration, 2021 to 2022: +1.9% (+10,763)
> Net domestic migration, 2021 to 2022: +9,249
> Net international migration, 2021 to 2022: +1,514
> Total population, 2022: 576,403
[in-text-ad]

39. Knoxville, TN
> Population change due to net migration, 2021 to 2022: +1.9% (+17,646)
> Net domestic migration, 2021 to 2022: +16,856
> Net international migration, 2021 to 2022: +790
> Total population, 2022: 932,245
[recirclink id=1233849]

38. Huntsville, AL
> Population change due to net migration, 2021 to 2022: +1.9% (+9,712)
> Net domestic migration, 2021 to 2022: +9,089
> Net international migration, 2021 to 2022: +623
> Total population, 2022: 514,465

37. Tyler, TX
> Population change due to net migration, 2021 to 2022: +1.9% (+4,595)
> Net domestic migration, 2021 to 2022: +4,359
> Net international migration, 2021 to 2022: +236
> Total population, 2022: 241,922
[in-text-ad-2]

36. Greenville-Anderson-Greer, SC
> Population change due to net migration, 2021 to 2022: +1.9% (+18,327)
> Net domestic migration, 2021 to 2022: +15,462
> Net international migration, 2021 to 2022: +2,865
> Total population, 2022: 958,958

35. Rapid City, SD
> Population change due to net migration, 2021 to 2022: +2.0% (+2,985)
> Net domestic migration, 2021 to 2022: +2,733
> Net international migration, 2021 to 2022: +252
> Total population, 2022: 154,165
[in-text-ad]

34. Austin-Round Rock-San Marcos, TX
> Population change due to net migration, 2021 to 2022: +2.0% (+47,442)
> Net domestic migration, 2021 to 2022: +37,624
> Net international migration, 2021 to 2022: +9,818
> Total population, 2022: 2,421,115
[recirclink id=1252184]
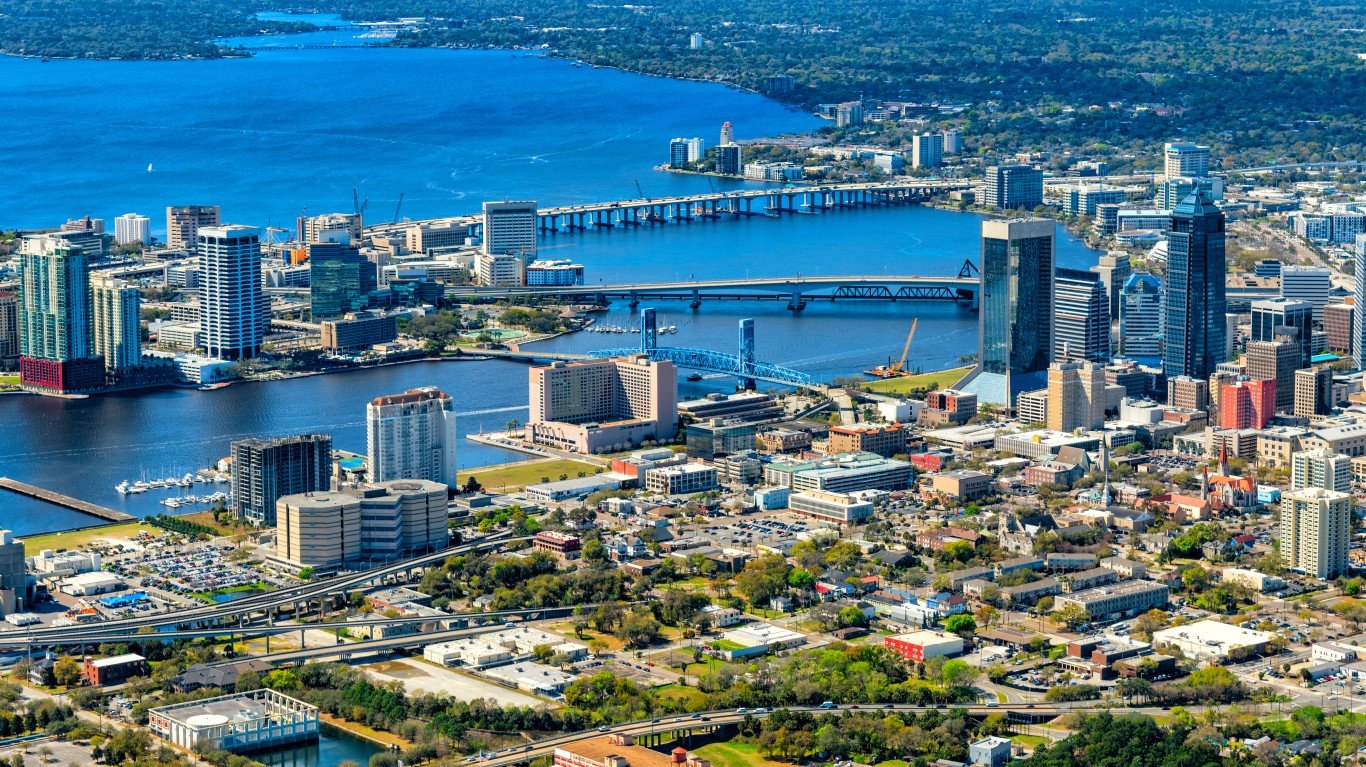
33. Jacksonville, FL
> Population change due to net migration, 2021 to 2022: +2.0% (+33,074)
> Net domestic migration, 2021 to 2022: +28,755
> Net international migration, 2021 to 2022: +4,319
> Total population, 2022: 1,675,668

32. Johnson City, TN
> Population change due to net migration, 2021 to 2022: +2.1% (+4,274)
> Net domestic migration, 2021 to 2022: +4,118
> Net international migration, 2021 to 2022: +156
> Total population, 2022: 210,256
[in-text-ad-2]

31. Tampa-St. Petersburg-Clearwater, FL
> Population change due to net migration, 2021 to 2022: +2.1% (+67,504)
> Net domestic migration, 2021 to 2022: +54,752
> Net international migration, 2021 to 2022: +12,752
> Total population, 2022: 3,290,730

30. Morristown, TN
> Population change due to net migration, 2021 to 2022: +2.2% (+2,586)
> Net domestic migration, 2021 to 2022: +2,501
> Net international migration, 2021 to 2022: +85
> Total population, 2022: 121,895
[in-text-ad]

29. Orlando-Kissimmee-Sanford, FL
> Population change due to net migration, 2021 to 2022: +2.2% (+59,198)
> Net domestic migration, 2021 to 2022: +37,362
> Net international migration, 2021 to 2022: +21,836
> Total population, 2022: 2,764,182
[recirclink id=1193704]

28. Gainesville, GA
> Population change due to net migration, 2021 to 2022: +2.2% (+4,570)
> Net domestic migration, 2021 to 2022: +4,232
> Net international migration, 2021 to 2022: +338
> Total population, 2022: 212,692

27. Helena, MT
> Population change due to net migration, 2021 to 2022: +2.3% (+2,162)
> Net domestic migration, 2021 to 2022: +2,089
> Net international migration, 2021 to 2022: +73
> Total population, 2022: 94,451
[in-text-ad-2]

26. Greeley, CO
> Population change due to net migration, 2021 to 2022: +2.4% (+8,027)
> Net domestic migration, 2021 to 2022: +7,536
> Net international migration, 2021 to 2022: +491
> Total population, 2022: 350,176

25. Prescott Valley-Prescott, AZ
> Population change due to net migration, 2021 to 2022: +2.5% (+5,990)
> Net domestic migration, 2021 to 2022: +5,784
> Net international migration, 2021 to 2022: +206
> Total population, 2022: 246,191
[in-text-ad]

24. Pinehurst-Southern Pines, NC
> Population change due to net migration, 2021 to 2022: +2.6% (+2,650)
> Net domestic migration, 2021 to 2022: +2,560
> Net international migration, 2021 to 2022: +90
> Total population, 2022: 105,531
[recirclink id=1190575]

23. Sherman-Denison, TX
> Population change due to net migration, 2021 to 2022: +2.6% (+3,624)
> Net domestic migration, 2021 to 2022: +3,525
> Net international migration, 2021 to 2022: +99
> Total population, 2022: 143,131

22. Hilton Head Island-Bluffton-Port Royal, SC
> Population change due to net migration, 2021 to 2022: +2.6% (+5,794)
> Net domestic migration, 2021 to 2022: +5,191
> Net international migration, 2021 to 2022: +603
> Total population, 2022: 228,410
[in-text-ad-2]

21. Lansing-East Lansing, MI
> Population change due to net migration, 2021 to 2022: +2.6% (+12,034)
> Net domestic migration, 2021 to 2022: +10,769
> Net international migration, 2021 to 2022: +1,265
> Total population, 2022: 472,848

20. Palm Bay-Melbourne-Titusville, FL
> Population change due to net migration, 2021 to 2022: +2.7% (+16,460)
> Net domestic migration, 2021 to 2022: +15,445
> Net international migration, 2021 to 2022: +1,015
> Total population, 2022: 630,693
[in-text-ad]

19. Lake Havasu City-Kingman, AZ
> Population change due to net migration, 2021 to 2022: +2.8% (+6,137)
> Net domestic migration, 2021 to 2022: +6,038
> Net international migration, 2021 to 2022: +99
> Total population, 2022: 220,816
[recirclink id=1163587]

18. Spartanburg, SC
> Population change due to net migration, 2021 to 2022: +2.9% (+10,468)
> Net domestic migration, 2021 to 2022: +9,916
> Net international migration, 2021 to 2022: +552
> Total population, 2022: 372,583

17. Sebastian-Vero Beach-West Vero Corridor, FL
> Population change due to net migration, 2021 to 2022: +2.9% (+4,778)
> Net domestic migration, 2021 to 2022: +4,471
> Net international migration, 2021 to 2022: +307
> Total population, 2022: 167,352
[in-text-ad-2]

16. St. George, UT
> Population change due to net migration, 2021 to 2022: +2.9% (+5,641)
> Net domestic migration, 2021 to 2022: +5,581
> Net international migration, 2021 to 2022: +60
> Total population, 2022: 197,680

15. Naples-Marco Island, FL
> Population change due to net migration, 2021 to 2022: +3.0% (+11,543)
> Net domestic migration, 2021 to 2022: +9,104
> Net international migration, 2021 to 2022: +2,439
> Total population, 2022: 397,994
[in-text-ad]

14. Daphne-Fairhope-Foley, AL
> Population change due to net migration, 2021 to 2022: +3.0% (+7,297)
> Net domestic migration, 2021 to 2022: +6,982
> Net international migration, 2021 to 2022: +315
> Total population, 2022: 246,435
[recirclink id=1233849]

13. Panama City-Panama City Beach, FL
> Population change due to net migration, 2021 to 2022: +3.2% (+6,451)
> Net domestic migration, 2021 to 2022: +5,918
> Net international migration, 2021 to 2022: +533
> Total population, 2022: 210,548
12. Sebring, FL
> Population change due to net migration, 2021 to 2022: +3.4% (+3,463)
> Net domestic migration, 2021 to 2022: +3,290
> Net international migration, 2021 to 2022: +173
> Total population, 2022: 105,618
[in-text-ad-2]
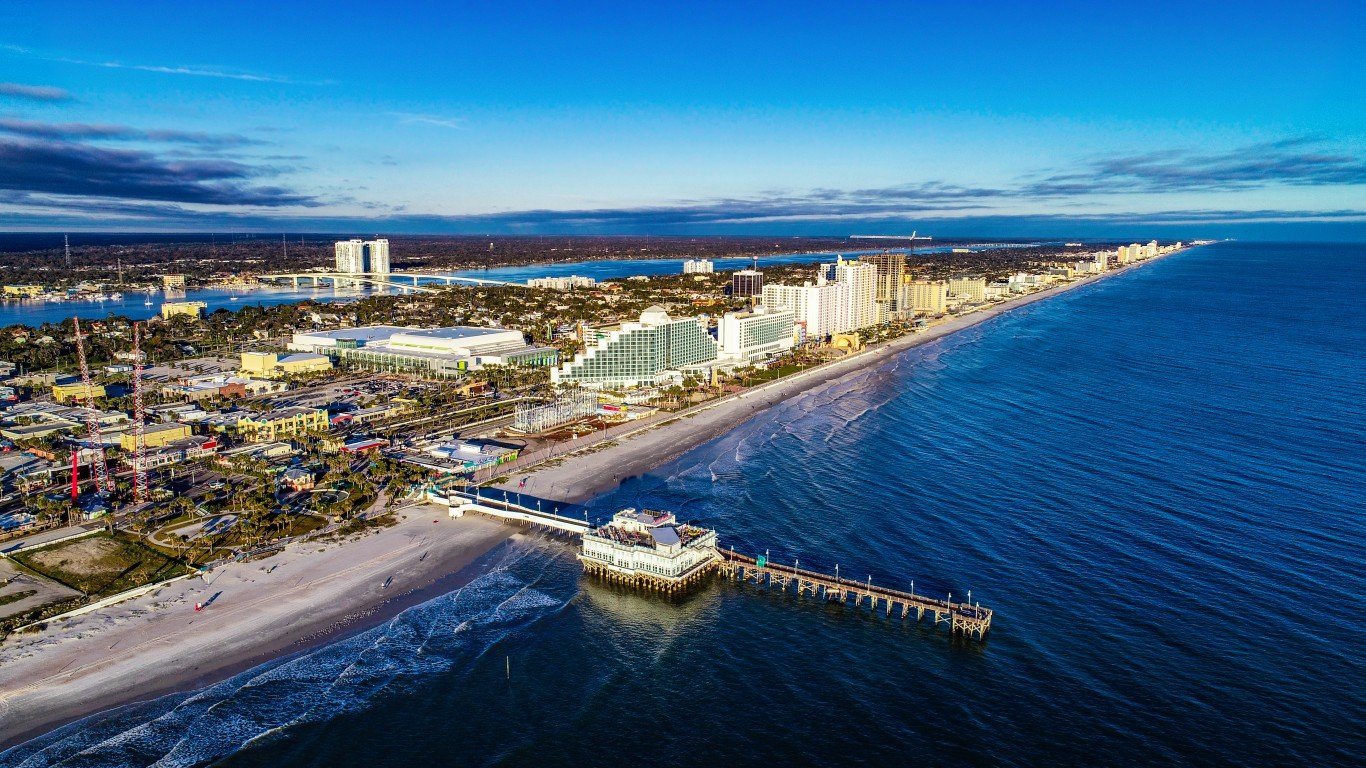
11. Deltona-Daytona Beach-Ormond Beach, FL
> Population change due to net migration, 2021 to 2022: +3.4% (+23,195)
> Net domestic migration, 2021 to 2022: +21,977
> Net international migration, 2021 to 2022: +1,218
> Total population, 2022: 705,897
10. Port St. Lucie, FL
> Population change due to net migration, 2021 to 2022: +3.5% (+17,784)
> Net domestic migration, 2021 to 2022: +16,855
> Net international migration, 2021 to 2022: +929
> Total population, 2022: 520,710
[in-text-ad]

9. Ocala, FL
> Population change due to net migration, 2021 to 2022: +3.6% (+14,028)
> Net domestic migration, 2021 to 2022: +13,496
> Net international migration, 2021 to 2022: +532
> Total population, 2022: 396,415
[recirclink id=1252184]

8. Wilmington, NC
> Population change due to net migration, 2021 to 2022: +3.7% (+16,235)
> Net domestic migration, 2021 to 2022: +15,836
> Net international migration, 2021 to 2022: +399
> Total population, 2022: 453,722

7. North Port-Bradenton-Sarasota, FL
> Population change due to net migration, 2021 to 2022: +3.9% (+33,897)
> Net domestic migration, 2021 to 2022: +31,893
> Net international migration, 2021 to 2022: +2,004
> Total population, 2022: 891,411
[in-text-ad-2]

6. Cape Coral-Fort Myers, FL
> Population change due to net migration, 2021 to 2022: +4.1% (+32,422)
> Net domestic migration, 2021 to 2022: +29,094
> Net international migration, 2021 to 2022: +3,328
> Total population, 2022: 822,453

5. Homosassa Springs, FL
> Population change due to net migration, 2021 to 2022: +4.1% (+6,551)
> Net domestic migration, 2021 to 2022: +6,498
> Net international migration, 2021 to 2022: +53
> Total population, 2022: 162,529
[in-text-ad]

4. Lakeland-Winter Haven, FL
> Population change due to net migration, 2021 to 2022: +4.2% (+31,955)
> Net domestic migration, 2021 to 2022: +29,624
> Net international migration, 2021 to 2022: +2,331
> Total population, 2022: 787,404
[recirclink id=1193704]

3. Punta Gorda, FL
> Population change due to net migration, 2021 to 2022: +4.9% (+9,523)
> Net domestic migration, 2021 to 2022: +9,232
> Net international migration, 2021 to 2022: +291
> Total population, 2022: 202,661

2. Myrtle Beach-Conway-North Myrtle Beach, SC
> Population change due to net migration, 2021 to 2022: +4.9% (+18,097)
> Net domestic migration, 2021 to 2022: +17,422
> Net international migration, 2021 to 2022: +675
> Total population, 2022: 383,101
[in-text-ad-2]

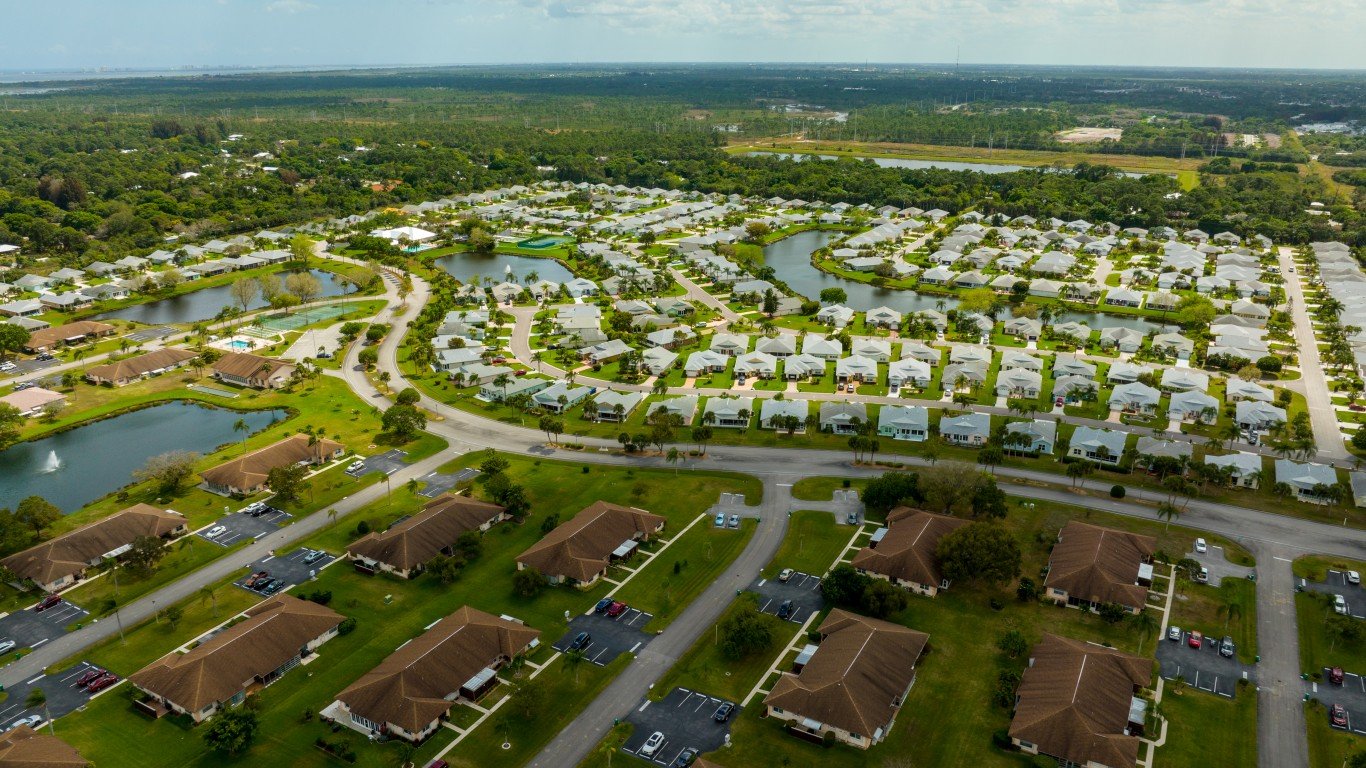
1. Wildwood-The Villages, FL
> Population change due to net migration, 2021 to 2022: +8.7% (+11,683)
> Net domestic migration, 2021 to 2022: +11,577
> Net international migration, 2021 to 2022: +106
> Total population, 2022: 144,970
Contact [email protected] for any questions or corrections.