When it comes to the size of certain subgroups — Hispanics, gun owners, or even vegans — Americans in a recent survey wildly overestimate their numbers in the United States.
To identify what Americans guess wrong the most about America, 24/7 Tempo reviewed the 34 largest differences between guessed and actual proportions of various subgroups among the U.S. adult population from the report, “From millionaires to Muslims, small subgroups of the population seem much larger to many Americans,” released by national survey company YouGov.
Smaller ethnic subgroups tended to have greater discrepancy between the percentage that Americans guessed and the actual number. For example, Americans guessed that 41% of the U.S. population is Black, when the actual number is 12%, a 29-percentage point differential. The same was true with other groups, with a 23 percentage point difference between guessed and actual proportion for Asians and 22 points differential for Hispanics. (These are the worst cities for black Americans.)
Americans also overestimate the number of people in smaller religious groups, such as Muslim Americans (estimate: 27%, actual: 1%) and Jewish Americans (estimate: 30%, actual: 2%).
According to YouGov, misperceptions of the size of minority groups have been attributed to such reasons as fear of out-groups (groups that people don’t identify with), lack of personal exposure to certain groups, or portrayals of the group in the media.
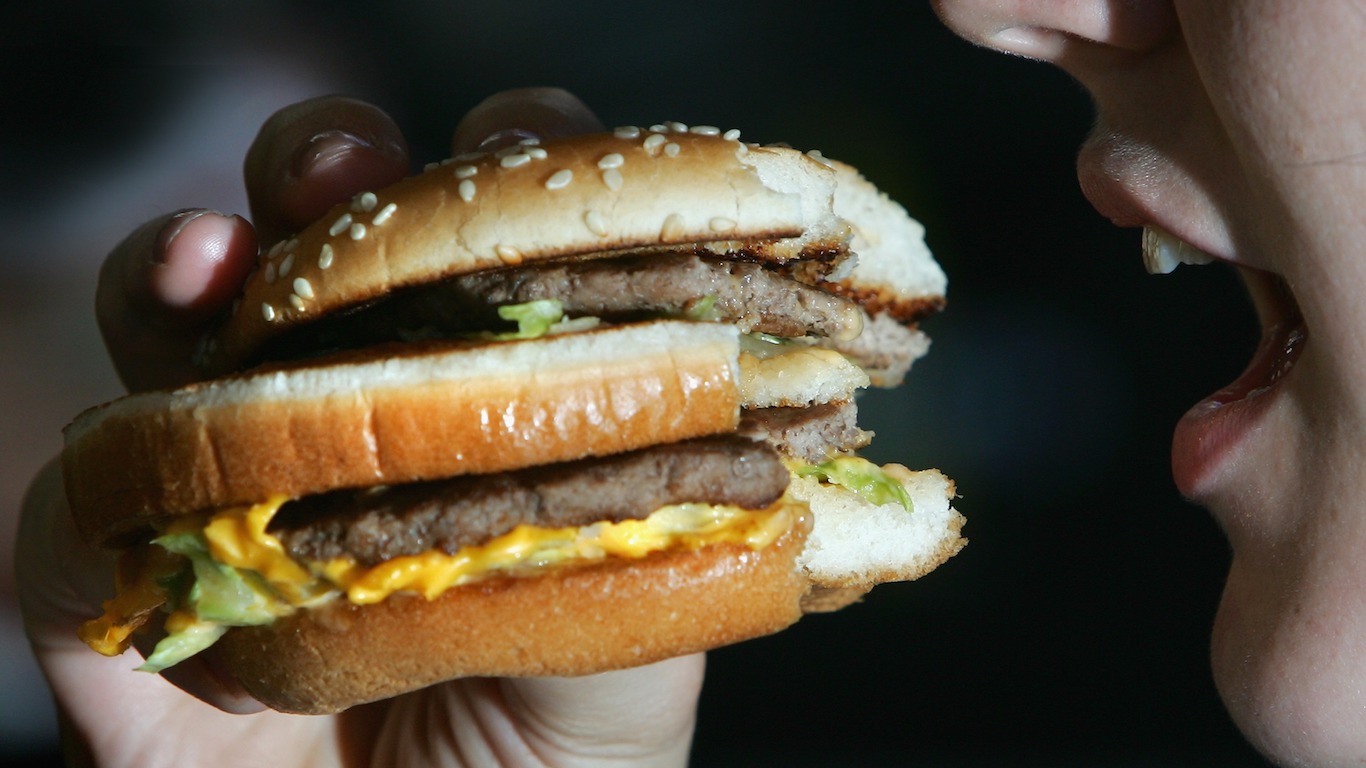
The disconnect applies to subgroups ranging from gun owners, the number of left-handed people, and even vegans or vegetarians, all with overestimated differentials of 22 percentage points or more.
On the flip side, Americans have underestimated the numbers of certain groups, and they might be pleasantly surprised at the true findings. For example, they guessed that 50% of Americans have household income over $50,000, when in fact over 62% of households do. The actual percentage of people who read a book in the last year was 77%, and Americans guessed 50%. Americans guessed that 65% of adults have at least a high school diploma, when 89% actually do. (These are 56 most amazing things about America today.)
Click here to see what Americans guess wrong the most about America
Click here to read our detailed methodology

34. Have a household income over $50,000
> Difference: -12.0%
> Guessed proportion: 50.0%
> Actual proportion: 62.0%
[in-text-ad]

33. Are Christian
> Difference: -12.0%
> Guessed proportion: 58.0%
> Actual proportion: 70.0%
[recirclink id=1055224]

32. Have at least a college degree
> Difference: 14.0%
> Guessed proportion: 47.0%
> Actual proportion: 33.0%
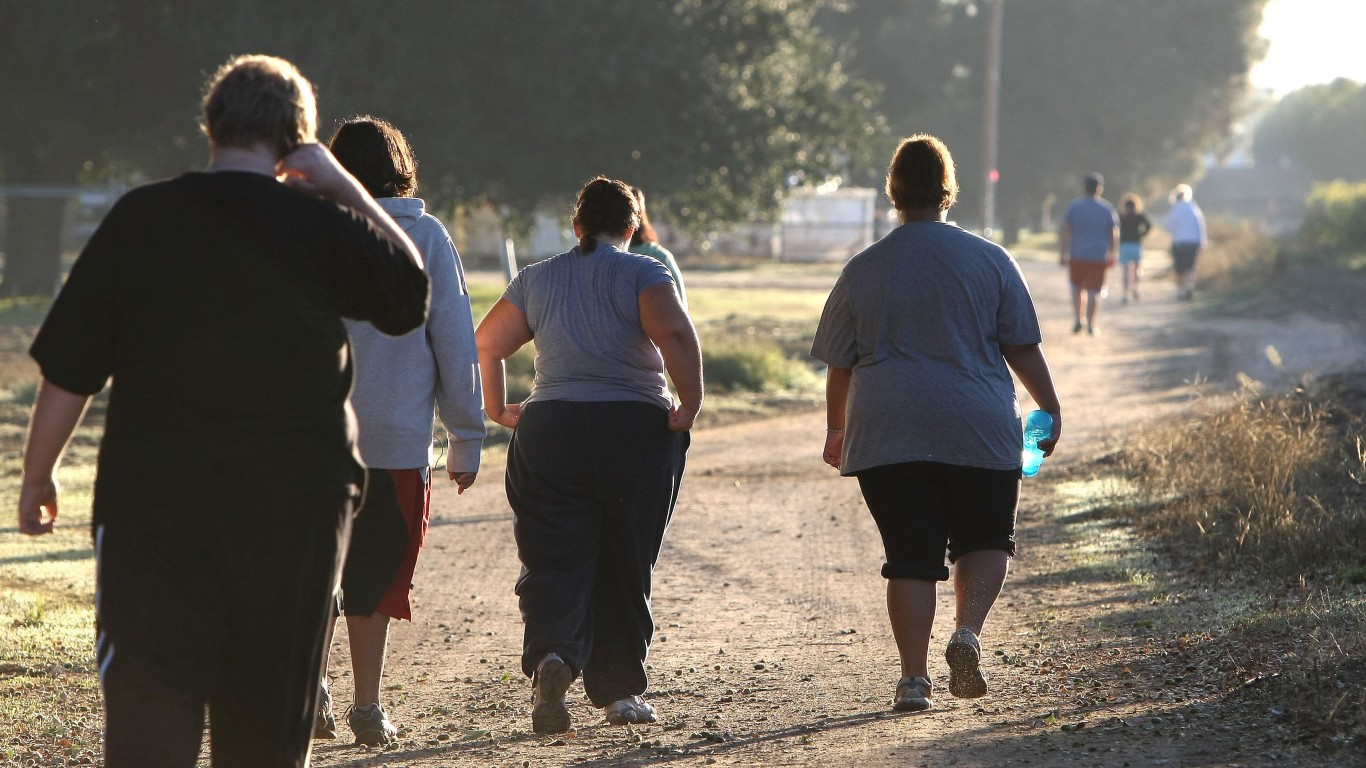
31. Are obese
> Difference: 14.0%
> Guessed proportion: 56.0%
> Actual proportion: 42.0%
[in-text-ad-2]

30. Have a driver’s license
> Difference: -15.0%
> Guessed proportion: 68.0%
> Actual proportion: 83.0%

29. Own a house
> Difference: -16.0%
> Guessed proportion: 49.0%
> Actual proportion: 65.0%
[in-text-ad]

28. Are Catholic
> Difference: 19.0%
> Guessed proportion: 41.0%
> Actual proportion: 22.0%
[recirclink id=1048284]
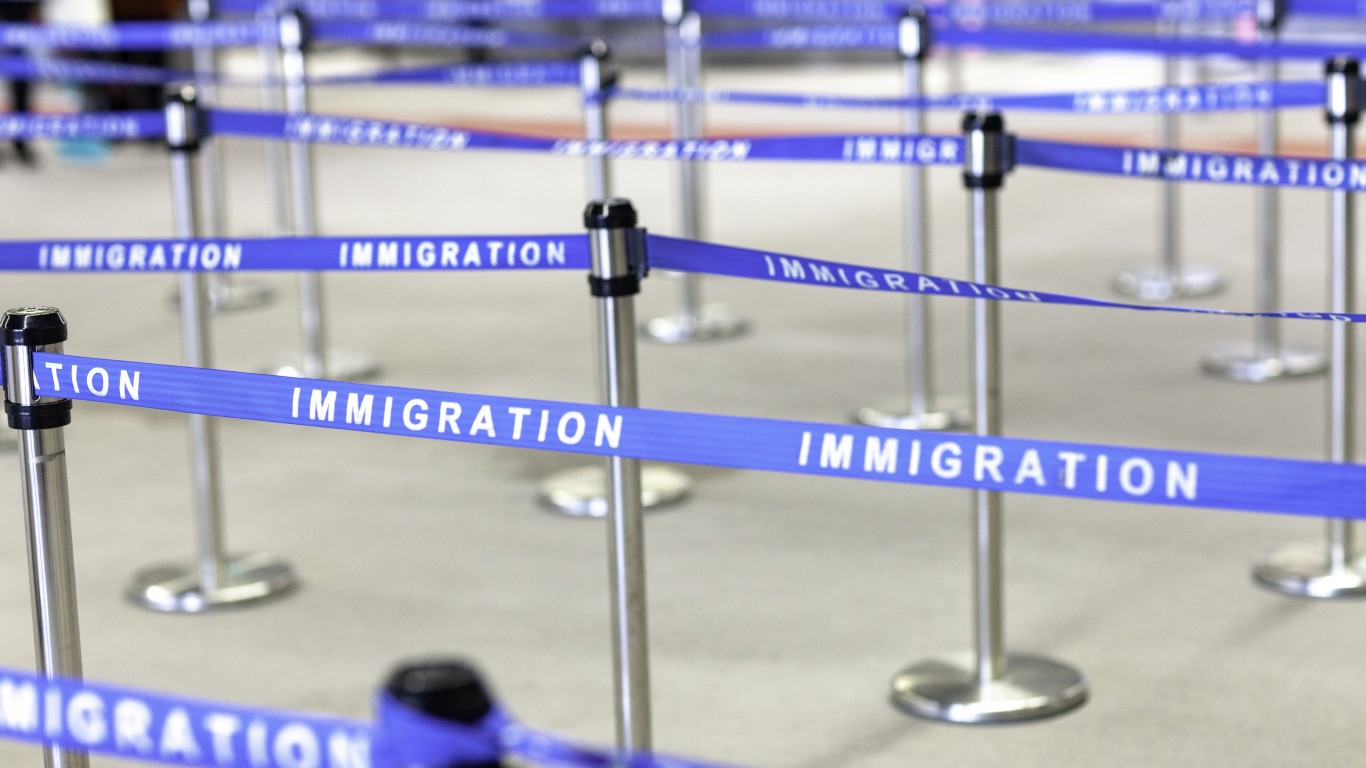
27. Are first-generation immigrants
> Difference: 19.0%
> Guessed proportion: 33.0%
> Actual proportion: 14.0%

26. Have a household income over $25,000
> Difference: -20.0%
> Guessed proportion: 62.0%
> Actual proportion: 82.0%
[in-text-ad-2]
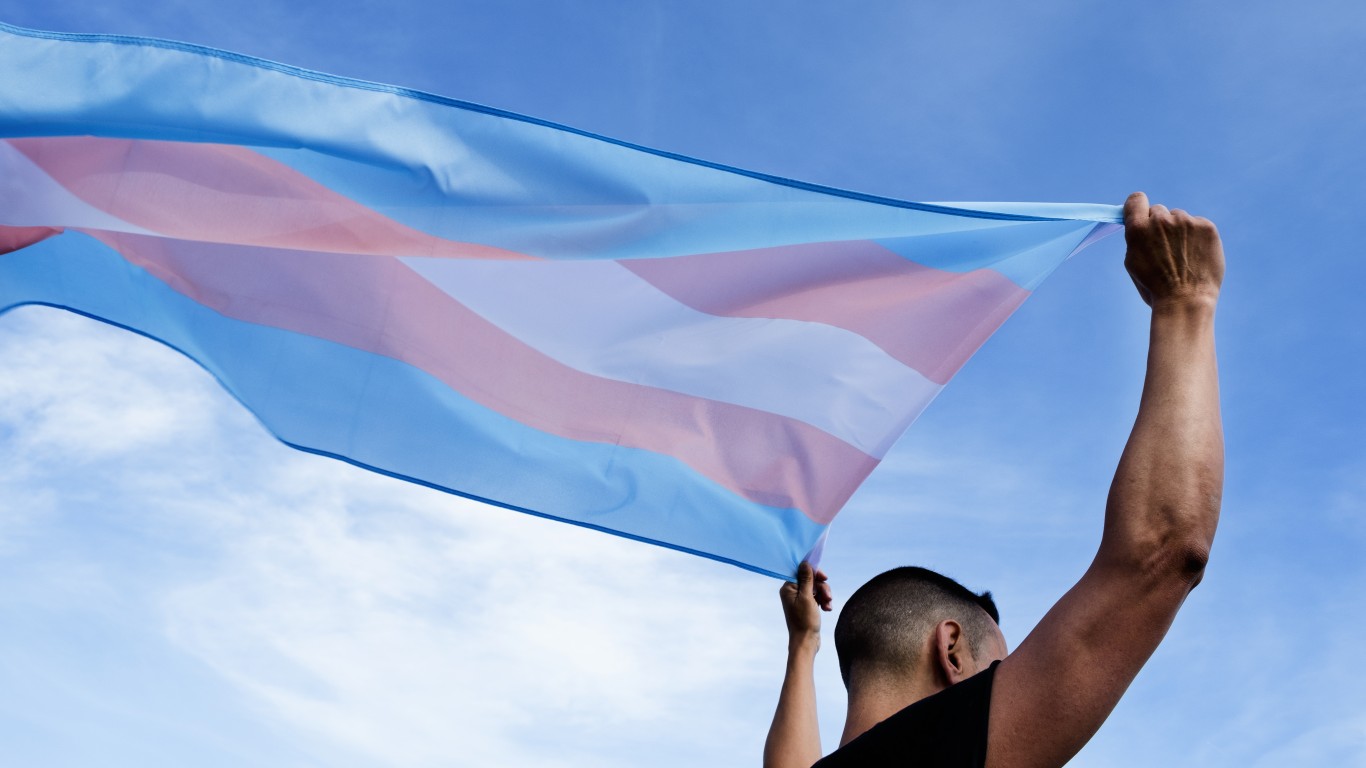
25. Are transgender
> Difference: 20.0%
> Guessed proportion: 21.0%
> Actual proportion: 1.0%
24. Have a household income over $1 million
> Difference: 20.0%
> Guessed proportion: 20.0%
> Actual proportion: 0.0%
[in-text-ad]

23. Live in California
> Difference: 20.0%
> Guessed proportion: 32.0%
> Actual proportion: 12.0%
[recirclink id=1058090]
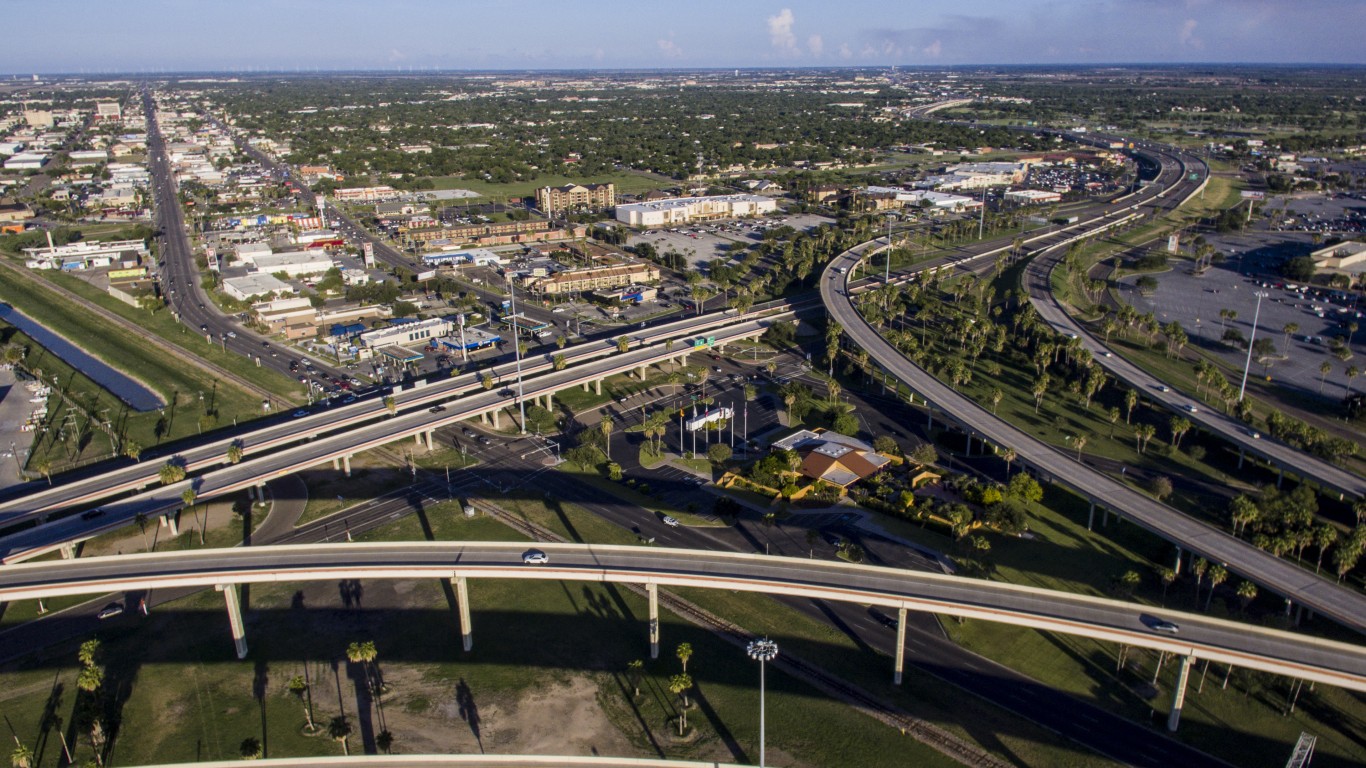
22. Live in Texas
> Difference: 21.0%
> Guessed proportion: 30.0%
> Actual proportion: 9.0%

21. Own a car
> Difference: -22.0%
> Guessed proportion: 66.0%
> Actual proportion: 88.0%
[in-text-ad-2]

20. Are Hispanic
> Difference: 22.0%
> Guessed proportion: 39.0%
> Actual proportion: 17.0%

19. Own a gun
> Difference: 22.0%
> Guessed proportion: 54.0%
> Actual proportion: 32.0%
[in-text-ad]

18. Are Asian
> Difference: 23.0%
> Guessed proportion: 29.0%
> Actual proportion: 6.0%
[recirclink id=1065390]

17. Are left-handed
> Difference: 23.0%
> Guessed proportion: 34.0%
> Actual proportion: 11.0%

16. Have at least a high school degree
> Difference: -24.0%
> Guessed proportion: 65.0%
> Actual proportion: 89.0%
[in-text-ad-2]

15. Are bisexual
> Difference: 25.0%
> Guessed proportion: 29.0%
> Actual proportion: 4.0%

14. Have a household income over $500,000
> Difference: 25.0%
> Guessed proportion: 26.0%
> Actual proportion: 1.0%
[in-text-ad]

13. Are vegan or vegetarian
> Difference: 25.0%
> Guessed proportion: 30.0%
> Actual proportion: 5.0%
[recirclink id=1054410]

12. Have an advanced degree
> Difference: 25.0%
> Guessed proportion: 37.0%
> Actual proportion: 12.0%

11. Are Native American
> Difference: 26.0%
> Guessed proportion: 27.0%
> Actual proportion: 1.0%
[in-text-ad-2]

10. Are Muslim
> Difference: 26.0%
> Guessed proportion: 27.0%
> Actual proportion: 1.0%

9. Live in New York City
> Difference: 27.0%
> Guessed proportion: 30.0%
> Actual proportion: 3.0%
[in-text-ad]
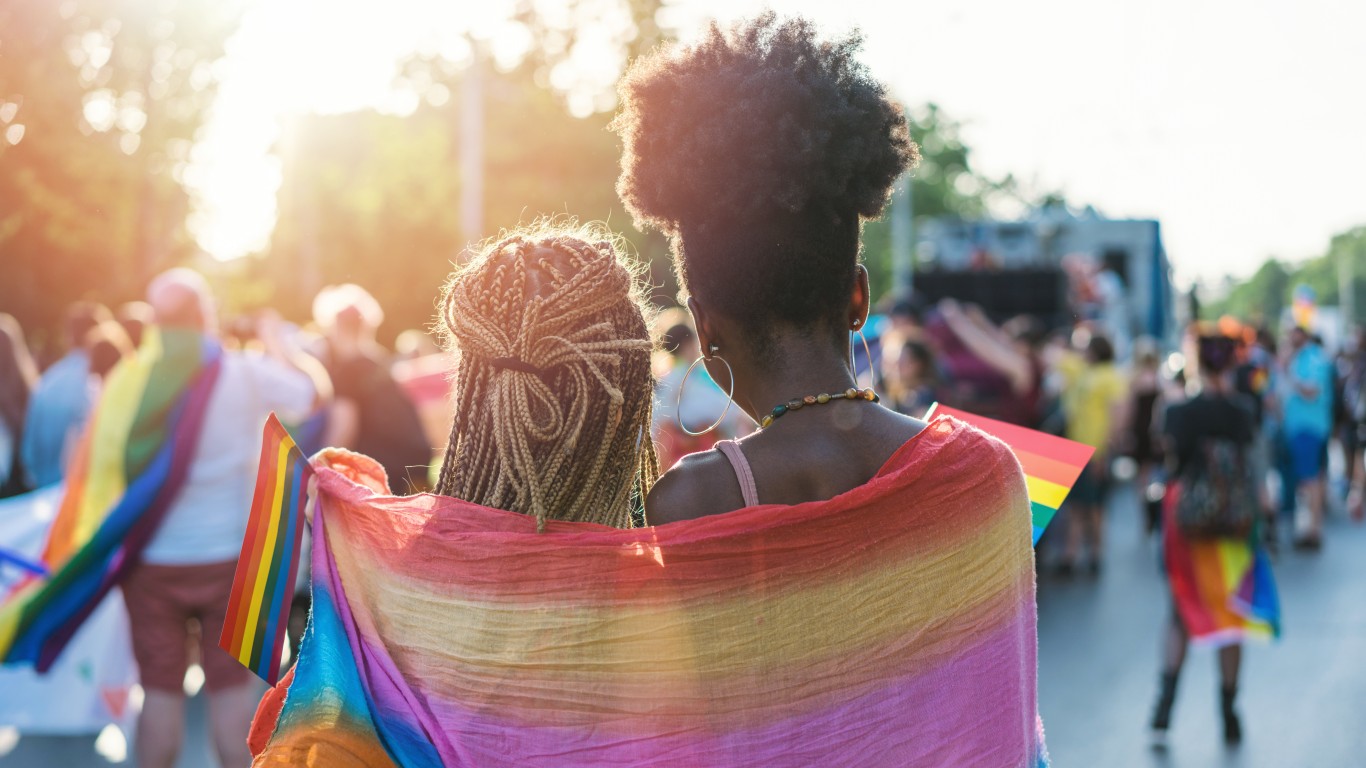
8. Are gay or lesbian
> Difference: 27.0%
> Guessed proportion: 30.0%
> Actual proportion: 3.0%
[recirclink id=1055224]

7. Have read a book in the past year
> Difference: -27.0%
> Guessed proportion: 50.0%
> Actual proportion: 77.0%
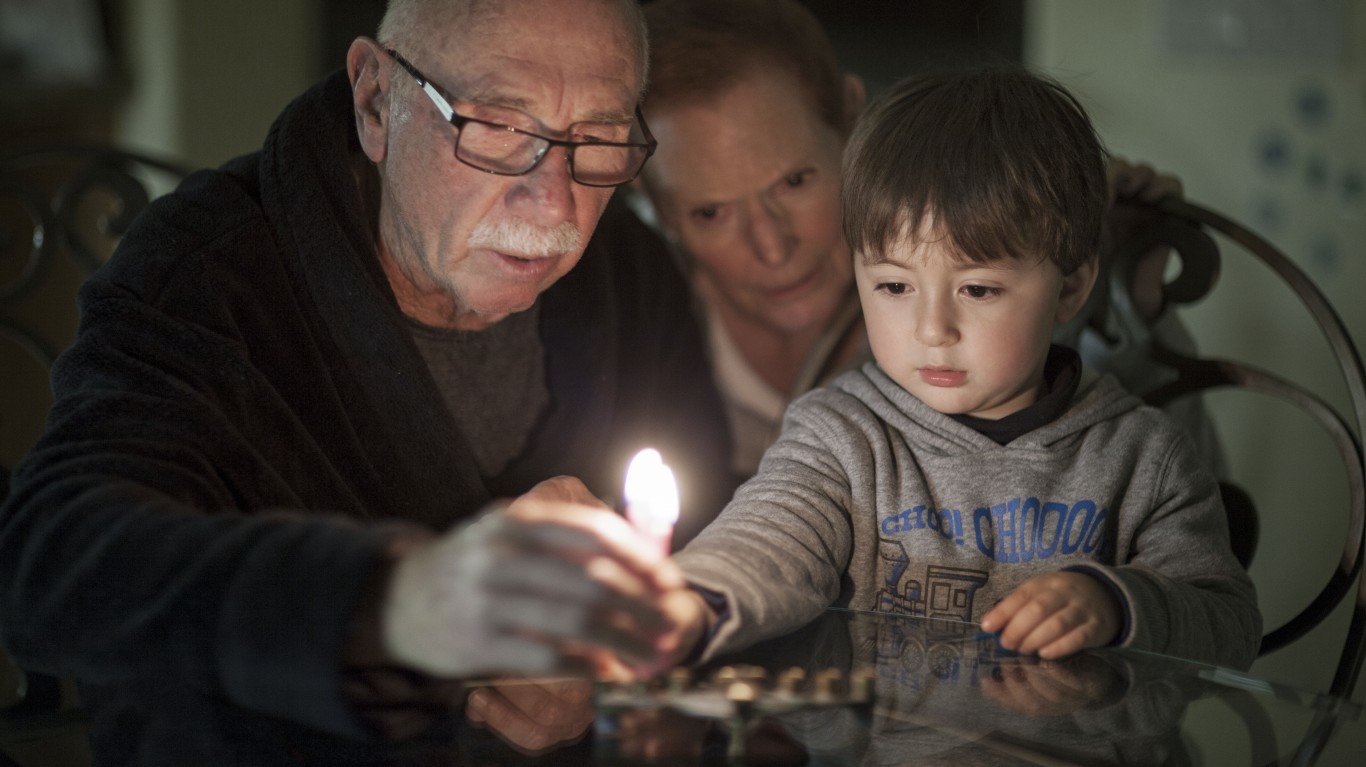
6. Are Jewish
> Difference: 28.0%
> Guessed proportion: 30.0%
> Actual proportion: 2.0%
[in-text-ad-2]

5. Are Black
> Difference: 29.0%
> Guessed proportion: 41.0%
> Actual proportion: 12.0%

4. Have flown on a plane
> Difference: -29.0%
> Guessed proportion: 59.0%
> Actual proportion: 88.0%
[in-text-ad]

3. Are atheists
> Difference: 30.0%
> Guessed proportion: 33.0%
> Actual proportion: 3.0%
[recirclink id=1048284]

2. Are members of a union
> Difference: 32.0%
> Guessed proportion: 36.0%
> Actual proportion: 4.0%

1. Are a military veteran
> Difference: 34.0%
> Guessed proportion: 40.0%
> Actual proportion: 6.0%
Methodology
To identify what Americans guess wrong the most about America, 24/7 Tempo reviewed the 34 largest differences between guessed and actual proportions of various subgroups among the US adult population from the report, “From millionaires to Muslims, small subgroups of the population seem much larger to many Americans,” released by national survey company YouGov.
We used the absolute difference between guessed and actual proportions of subgroups of the population to rank the questions on this list. Guessed proportions are median weighted responses (ranging from 0% to 100%, rounded to the nearest whole percentage) to the question “If you had to guess, what percentage of American adults…”
YouGov took the real proportions from a variety of sources, including the U.S. Census Bureau, the Bureau of Labor Statistics, YouGov’s internal poll results, and the results of other well-established polling firms. Most estimates were collected within the past three years; the oldest is from 2009. Because the real estimates presented cover a range of time periods, they may differ from actual population sizes at the time YouGov’s survey was conducted.
The report includes findings from two U.S. News surveys conducted by YouGov on two nationally representative samples of 1,000 U.S. adult citizens interviewed online from Jan. 14-20, 2022. Respondents were selected from YouGov’s opt-in panel to be representative of all U.S. citizens.
Contact [email protected] for any questions or corrections.