White Americans not only make up the majority of the population — 59% excluding non-Hispanic whites — but they also dominate wealth ownership compared to Black and Hispanic Americans.
The Federal Reserve found in 2019 that white families have the highest level of median and mean family wealth at $188,200 and $983,400, respectively, compared to $36,100 and $165,500 for Hispanic households and an even lower $24,100 and $142,500 for Black families.
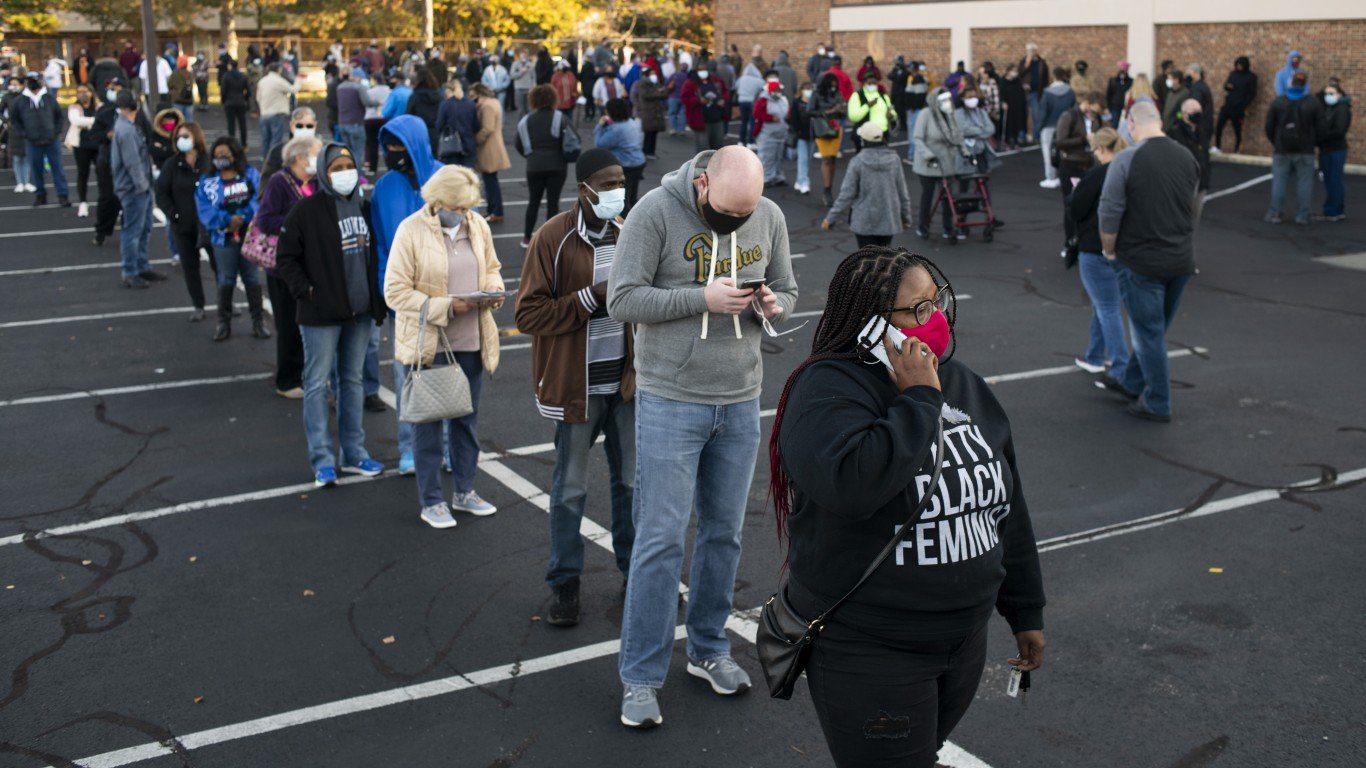
This enormous disparity has much to do with property ownership, the most steadfast way to preserve and generate wealth for most people. Statistically speaking, it is much harder for many non-whites to get approved for a home mortgage, especially for Black Americans, who are more likely to be denied a home mortgage even in cities with large Black populations such as Memphis, Tennessee; Baltimore; Columbus, Ohio; and Birmingham, Alabama. (These are the worst cities for Black Americans.)
To identify the cities with the most racist mortgage lending practices, 24/7 Wall St. reviewed a July 2023 analysis by online lending market place LendingTree, “Black Homebuyers in 50 Largest US Metros 1.6 Times More Likely to Be Denied for Mortgage Than Overall Population.” Lending Tree reviewed the racial disparities in mortgage denial rates in the 50 largest metropolitan statistical areas, that is, the difference between the denial rate for the overall population and that for Black homebuyers.
Among these cities, the spread between mortgage denial rates for the overall population and Black applicants ranges from 0.26 points in Salt Lake City to more than 9 points in Buffalo, New York.
The share of mortgage denials in Atlanta, where one in three residents is Black, is about 1 in 10. For Black applicants, however, the denial rate is nearly 14%, a disparity of nearly 4 points. (Also see, cities with the most Black-owned businesses.)
Twenty-four of these cities have Black populations above the national average of 13.6%, in some cases well above that average. Nearly 47% of residents in Memphis are Black, but nearly 16% of Black applicants are denied a mortgage compared to the overall average denial of nearly 10%.
Among the 10 most populous cities in America, Chicago, New York, and Phoenix, have a mortgage denial rate for Black borrowers that is above the average 5-point disparity for all 50 cities.
Here are the cities with the most racist mortgage lending practices.
Click here to read our detailed methodology.
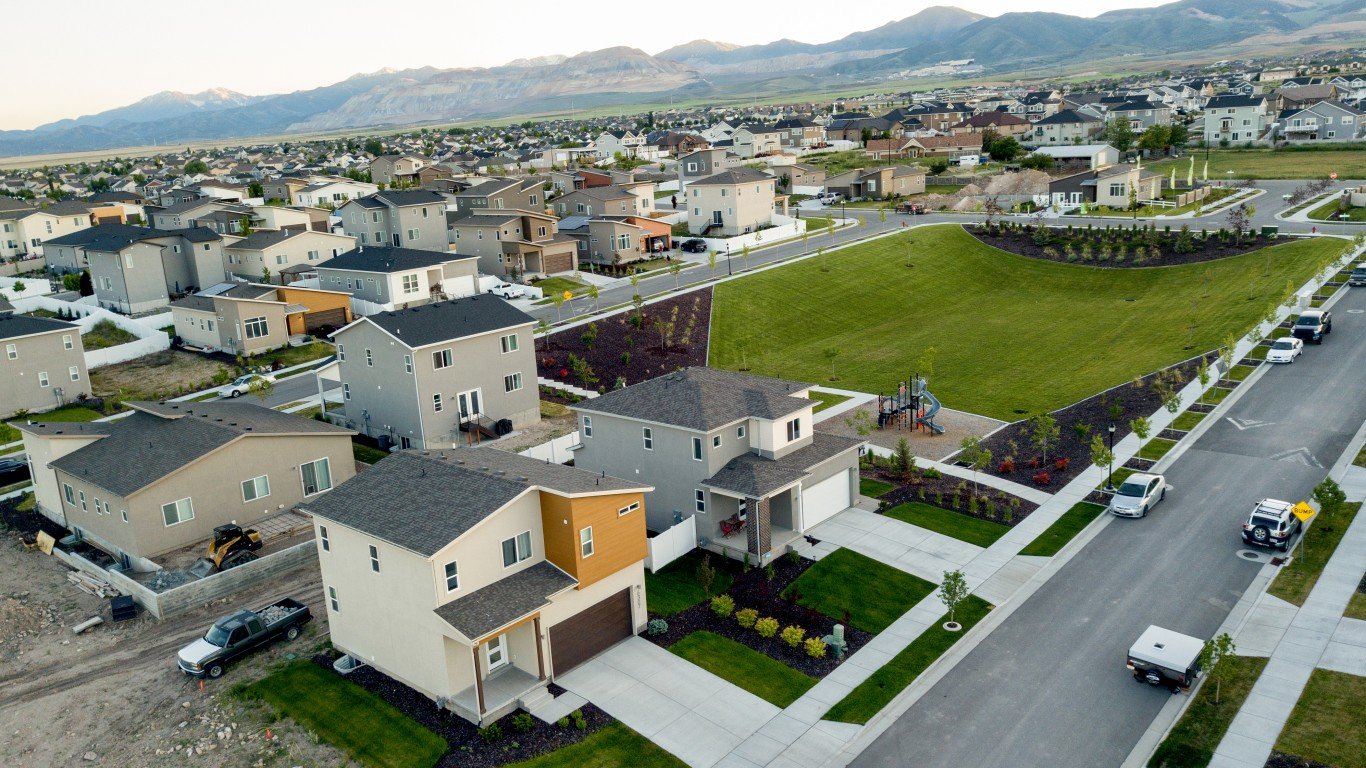
50. Salt Lake City, Utah
> Racial disparity in mortgage denial rates: 0.26 percentage points
> Overall purchase mortgage denial rate 9.0%
> Mortgage denial rate for Black borrowers 9.2%
> White homeownership rate: 71.6% — #200 highest of 386 MSAs
> Black homeownership rate: 22.8% — #341 highest of 386 MSAs
> Black population: 1.7% — #319 highest of 386 MSAs
[in-text-ad]
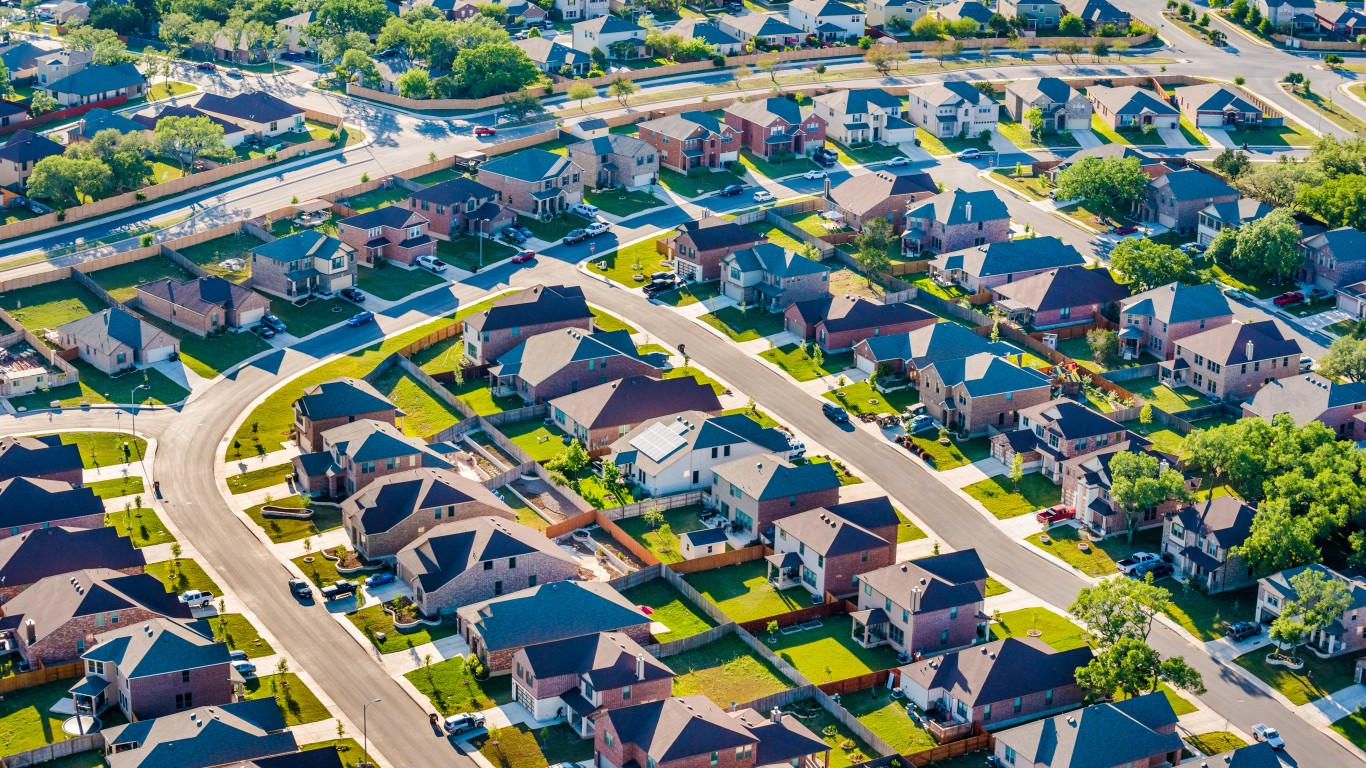
49. San Antonio, Texas
> Racial disparity in mortgage denial rates: 1.83 percentage points
> Overall purchase mortgage denial rate 12.3%
> Mortgage denial rate for Black borrowers 14.1%
> White homeownership rate: 65.9% — #313 highest of 386 MSAs
> Black homeownership rate: 45.7% — #106 highest of 386 MSAs
> Black population: 6.3% — #199 highest of 386 MSAs
[recirclink id=1055224]
48. Houston, Texas
> Racial disparity in mortgage denial rates: 3.25 percentage points
> Overall purchase mortgage denial rate 12.8%
> Mortgage denial rate for Black borrowers 16.1%
> White homeownership rate: 68.1% — #276 highest of 386 MSAs
> Black homeownership rate: 42.5% — #147 highest of 386 MSAs
> Black population: 16.8% — #75 highest of 386 MSAs
47. Riverside, California
> Racial disparity in mortgage denial rates: 3.36 percentage points
> Overall purchase mortgage denial rate 10.6%
> Mortgage denial rate for Black borrowers 14.0%
> White homeownership rate: 68.8% — #258 highest of 386 MSAs
> Black homeownership rate: 44.6% — #120 highest of 386 MSAs
> Black population: 6.8% — #186 highest of 386 MSAs
[in-text-ad-2]
46. San Diego, California
> Racial disparity in mortgage denial rates: 3.66 percentage points
> Overall purchase mortgage denial rate 9.3%
> Mortgage denial rate for Black borrowers 13.0%
> White homeownership rate: 57.3% — #376 highest of 386 MSAs
> Black homeownership rate: 30.0% — #289 highest of 386 MSAs
> Black population: 4.6% — #237 highest of 386 MSAs
45. Baltimore, Maryland
> Racial disparity in mortgage denial rates: 3.72 percentage points
> Overall purchase mortgage denial rate 8.0%
> Mortgage denial rate for Black borrowers 11.8%
> White homeownership rate: 77.1% — #54 highest of 386 MSAs
> Black homeownership rate: 46.8% — #86 highest of 386 MSAs
> Black population: 28.6% — #34 highest of 386 MSAs
[in-text-ad]
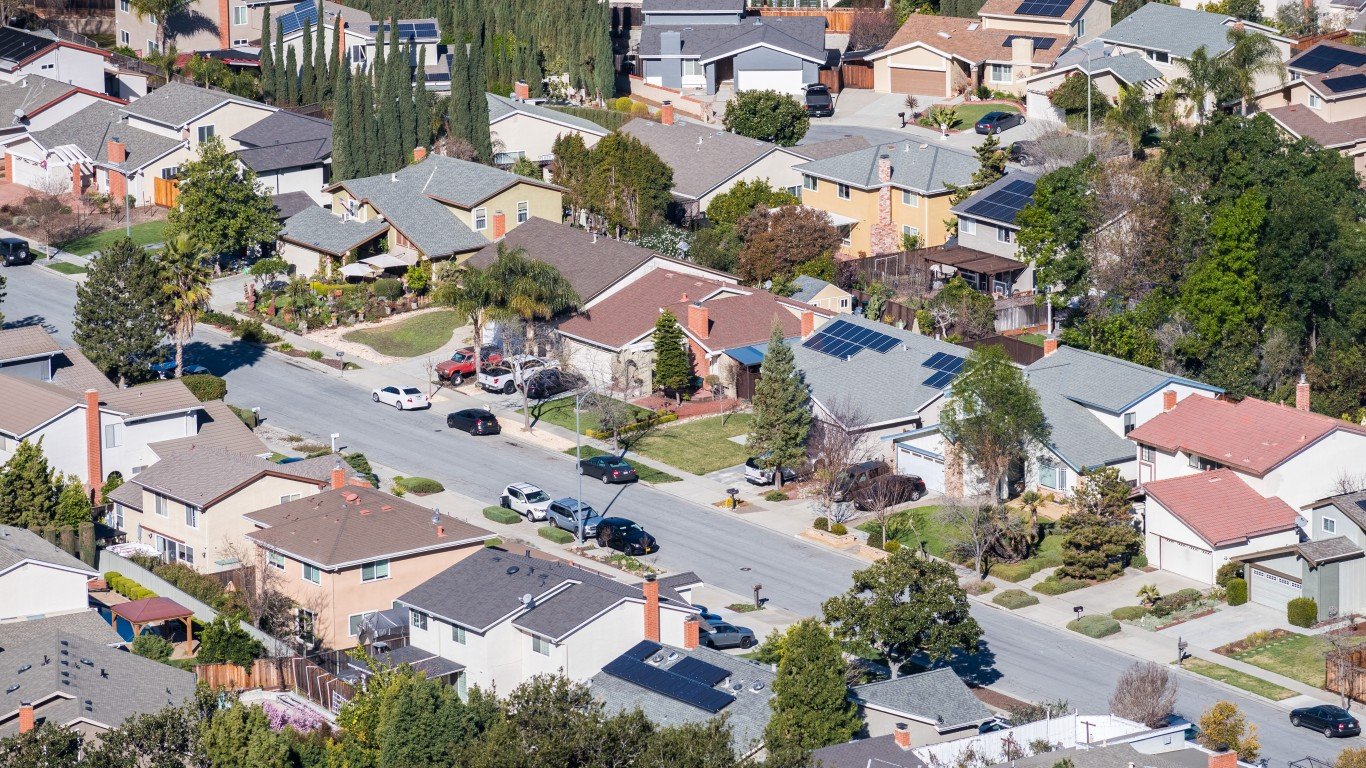
44. San Jose, California
> Racial disparity in mortgage denial rates: 3.77 percentage points
> Overall purchase mortgage denial rate 7.6%
> Mortgage denial rate for Black borrowers 11.4%
> White homeownership rate: 60.1% — #362 highest of 386 MSAs
> Black homeownership rate: 29.8% — #292 highest of 386 MSAs
> Black population: 2.3% — #294 highest of 386 MSAs
[recirclink id=1291862]

43. Louisville/Jefferson County, Kentucky
> Racial disparity in mortgage denial rates: 3.84 percentage points
> Overall purchase mortgage denial rate 9.3%
> Mortgage denial rate for Black borrowers 13.1%
> White homeownership rate: 74.3% — #118 highest of 386 MSAs
> Black homeownership rate: 37.9% — #204 highest of 386 MSAs
> Black population: 14.7% — #93 highest of 386 MSAs
42. Birmingham, Alabama
> Racial disparity in mortgage denial rates: 3.85 percentage points
> Overall purchase mortgage denial rate 12.4%
> Mortgage denial rate for Black borrowers 16.2%
> White homeownership rate: 79.1% — #23 highest of 386 MSAs
> Black homeownership rate: 51.8% — #37 highest of 386 MSAs
> Black population: 30.0% — #28 highest of 386 MSAs
[in-text-ad-2]
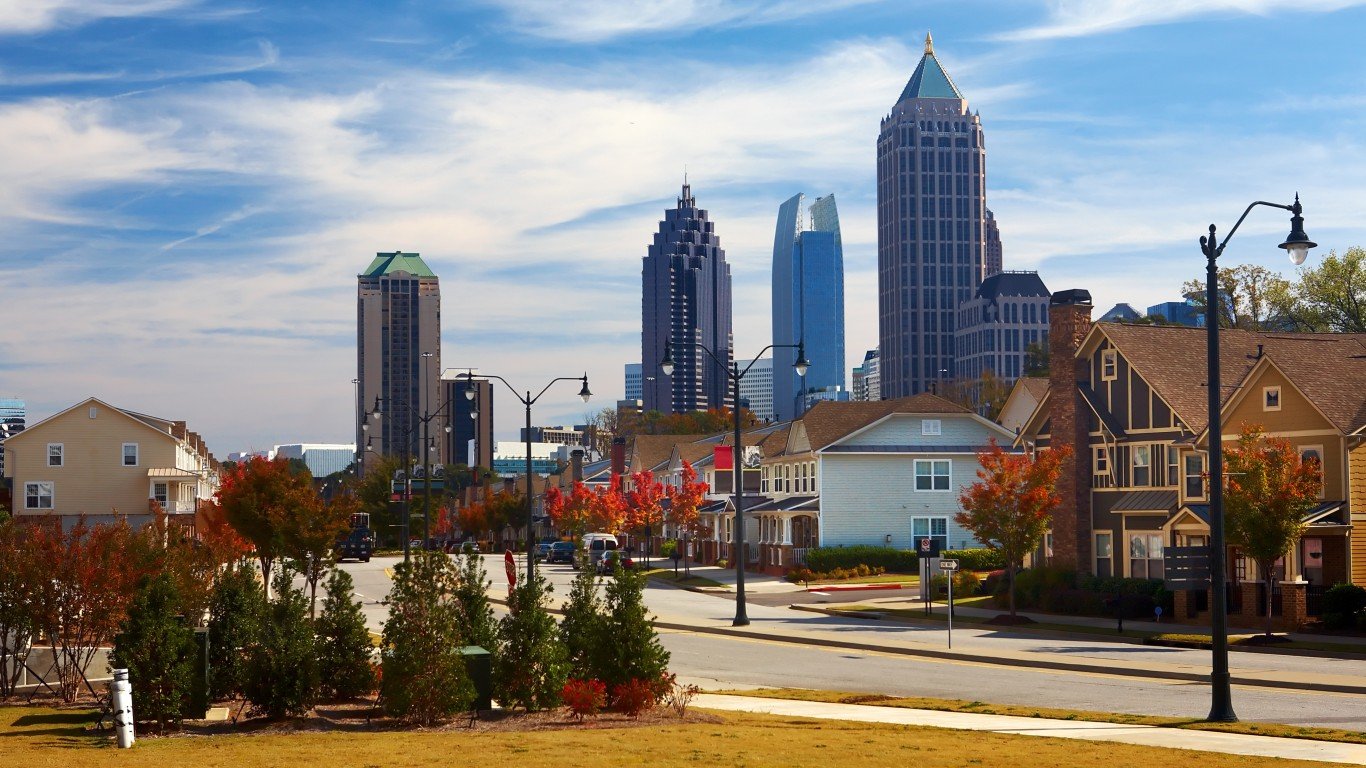
41. Atlanta, Georgia
> Racial disparity in mortgage denial rates: 3.91 percentage points
> Overall purchase mortgage denial rate 9.9%
> Mortgage denial rate for Black borrowers 13.8%
> White homeownership rate: 75.5% — #86 highest of 386 MSAs
> Black homeownership rate: 49.8% — #55 highest of 386 MSAs
> Black population: 33.7% — #21 highest of 386 MSAs
40. Dallas, Texas
> Racial disparity in mortgage denial rates: 3.97 percentage points
> Overall purchase mortgage denial rate 9.7%
> Mortgage denial rate for Black borrowers 13.7%
> White homeownership rate: 66.3% — #305 highest of 386 MSAs
> Black homeownership rate: 38.0% — #202 highest of 386 MSAs
> Black population: 15.7% — #83 highest of 386 MSAs
[in-text-ad]
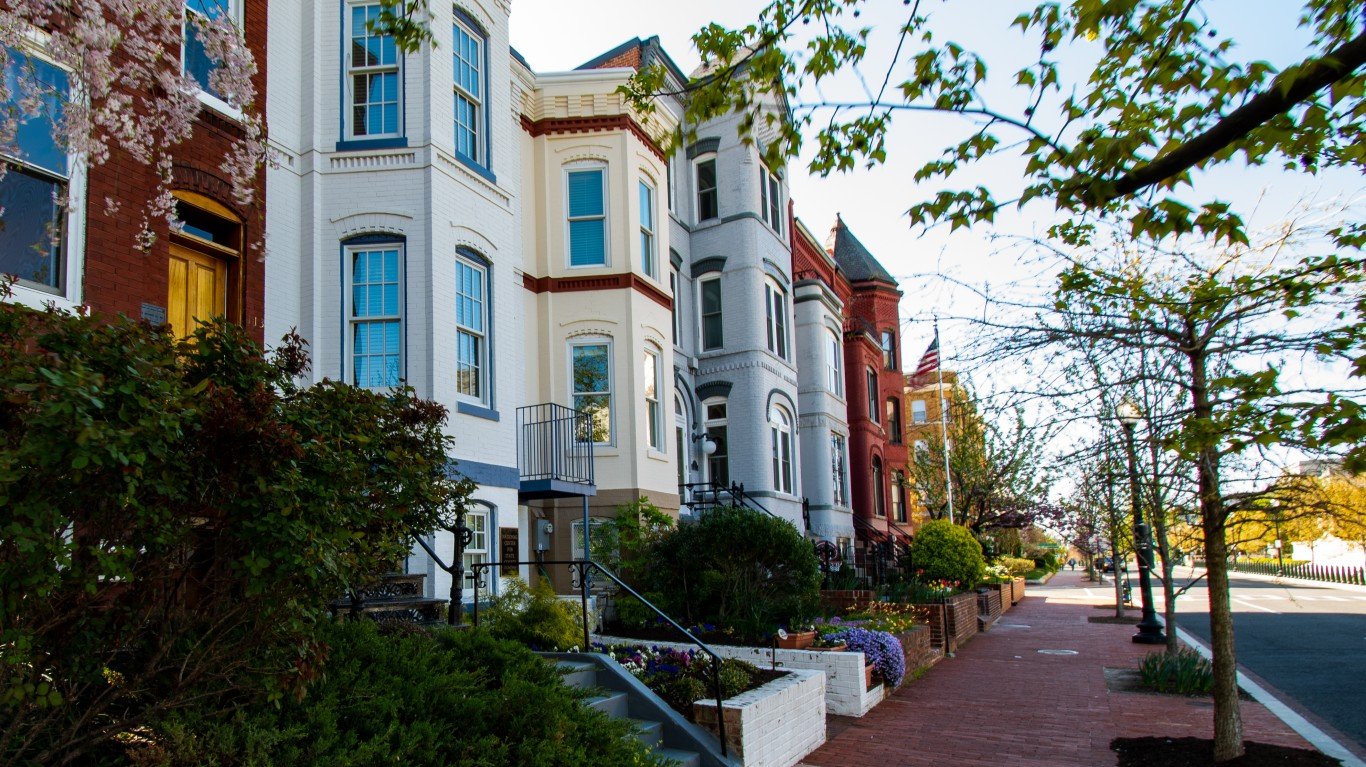
39. Washington, D.C.
> Racial disparity in mortgage denial rates: 4.04 percentage points
> Overall purchase mortgage denial rate 7.3%
> Mortgage denial rate for Black borrowers 11.3%
> White homeownership rate: 70.6% — #225 highest of 386 MSAs
> Black homeownership rate: 51.3% — #39 highest of 386 MSAs
> Black population: 24.7% — #40 highest of 386 MSAs
[recirclink id=1259887]
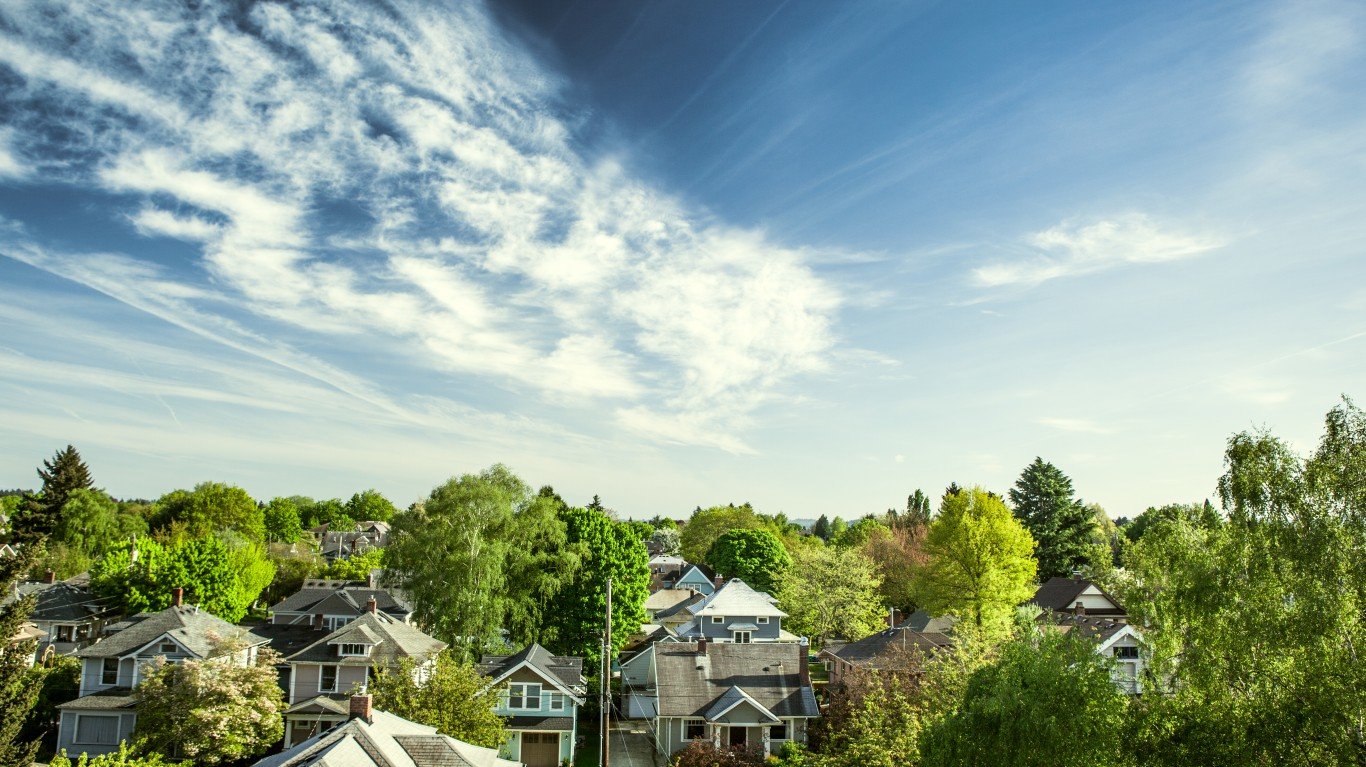
38. Portland,Oregon
> Racial disparity in mortgage denial rates: 4.08 percentage points
> Overall purchase mortgage denial rate 7.3%
> Mortgage denial rate for Black borrowers 11.4%
> White homeownership rate: 73.8% — #129 highest of 386 MSAs
> Black homeownership rate: 25.7% — #327 highest of 386 MSAs
> Black population: 2.1% — #305 highest of 386 MSAs
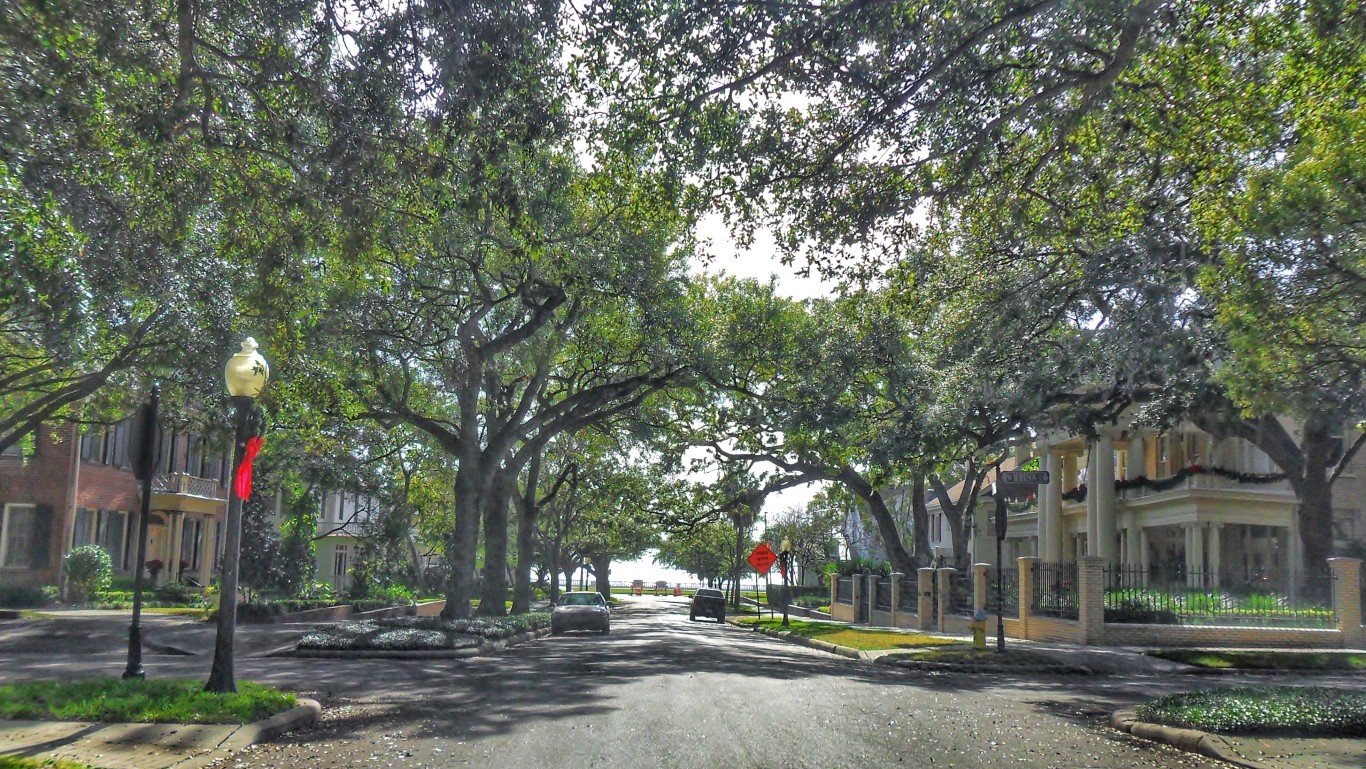
37. Tampa, Florida
> Racial disparity in mortgage denial rates: 4.18 percentage points
> Overall purchase mortgage denial rate 11.8%
> Mortgage denial rate for Black borrowers 16.0%
> White homeownership rate: 70.8% — #221 highest of 386 MSAs
> Black homeownership rate: 42.9% — #144 highest of 386 MSAs
> Black population: 11.4% — #124 highest of 386 MSAs
[in-text-ad-2]
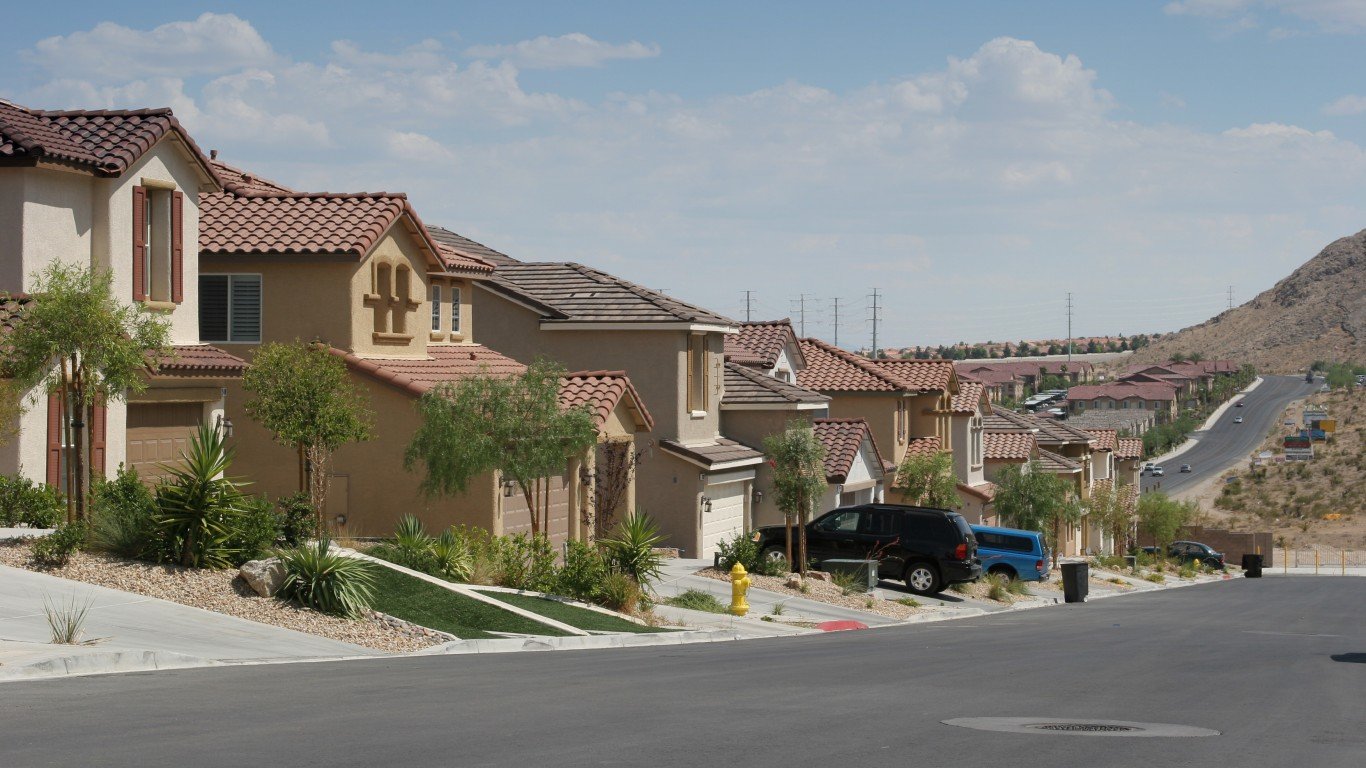
36. Las Vegas, Nevada
> Racial disparity in mortgage denial rates: 4.27 percentage points
> Overall purchase mortgage denial rate 10.3%
> Mortgage denial rate for Black borrowers 14.6%
> White homeownership rate: 61.9% — #352 highest of 386 MSAs
> Black homeownership rate: 30.4% — #288 highest of 386 MSAs
> Black population: 11.5% — #123 highest of 386 MSAs
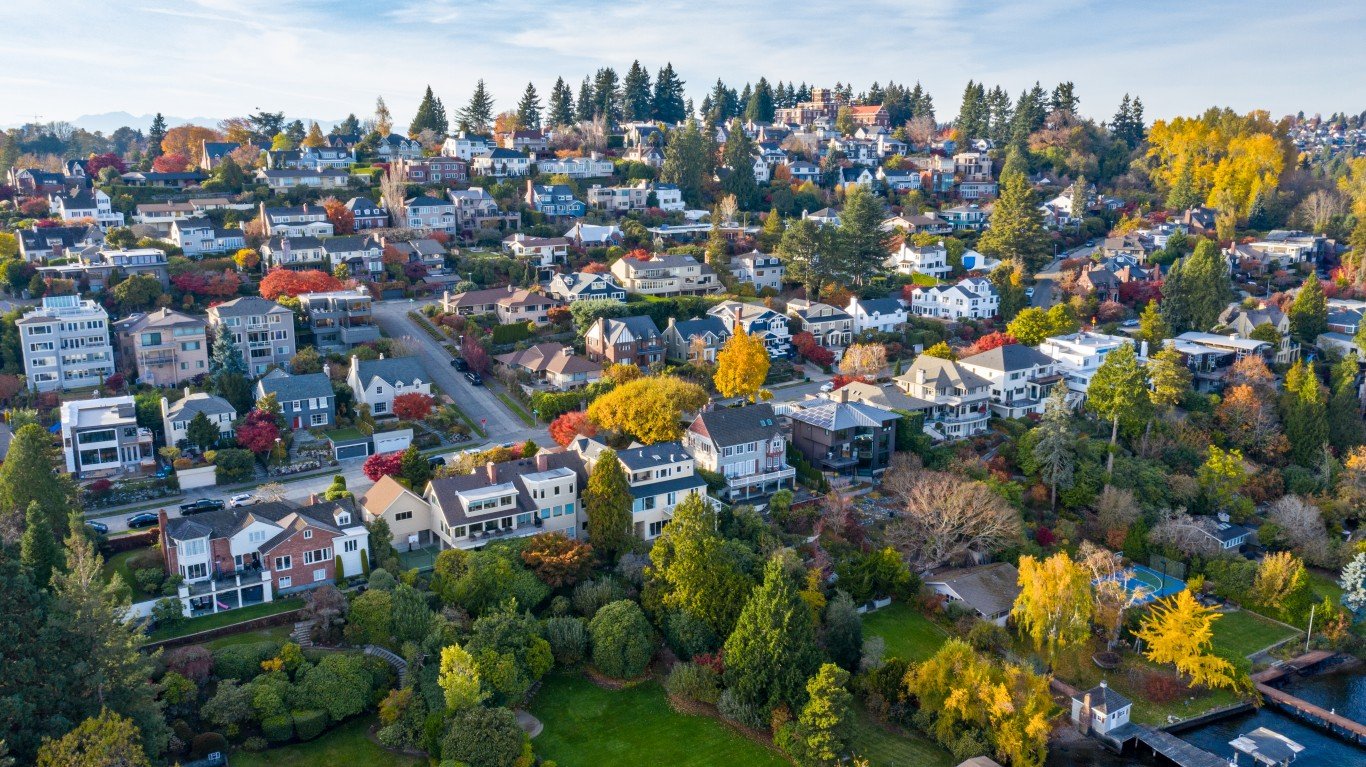
35. Seattle, Washington
> Racial disparity in mortgage denial rates: 4.47 percentage points
> Overall purchase mortgage denial rate 7.0%
> Mortgage denial rate for Black borrowers 11.5%
> White homeownership rate: 65.0% — #325 highest of 386 MSAs
> Black homeownership rate: 32.4% — #268 highest of 386 MSAs
> Black population: 5.8% — #209 highest of 386 MSAs
[in-text-ad]
34. Kansas City, Missouri
> Racial disparity in mortgage denial rates: 4.52 percentage points
> Overall purchase mortgage denial rate 5.9%
> Mortgage denial rate for Black borrowers 10.4%
> White homeownership rate: 70.5% — #226 highest of 386 MSAs
> Black homeownership rate: 37.8% — #205 highest of 386 MSAs
> Black population: 11.9% — #118 highest of 386 MSAs
[recirclink id=1201553]
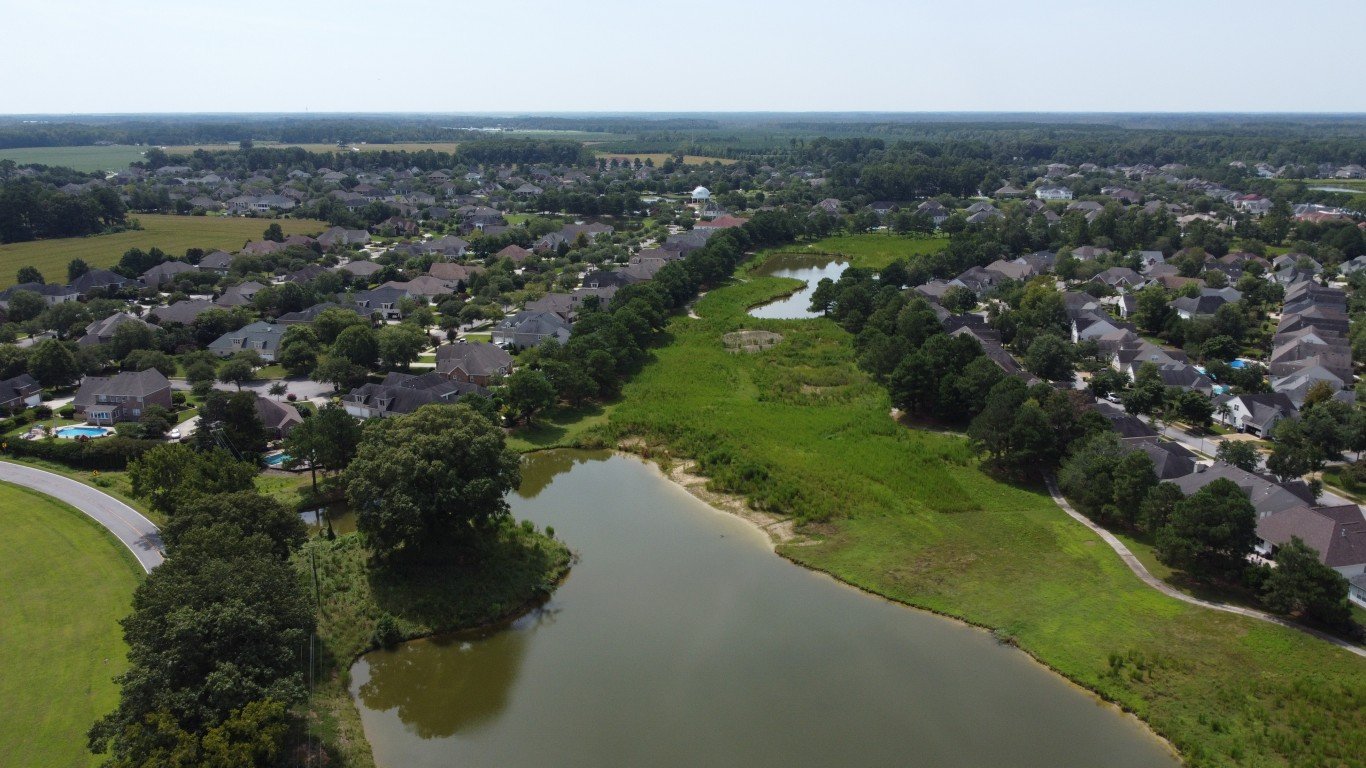
33. Virginia Beach, Virginia
> Racial disparity in mortgage denial rates: 4.61 percentage points
> Overall purchase mortgage denial rate 7.2%
> Mortgage denial rate for Black borrowers 11.8%
> White homeownership rate: 71.9% — #193 highest of 386 MSAs
> Black homeownership rate: 44.1% — #126 highest of 386 MSAs
> Black population: 29.6% — #30 highest of 386 MSAs
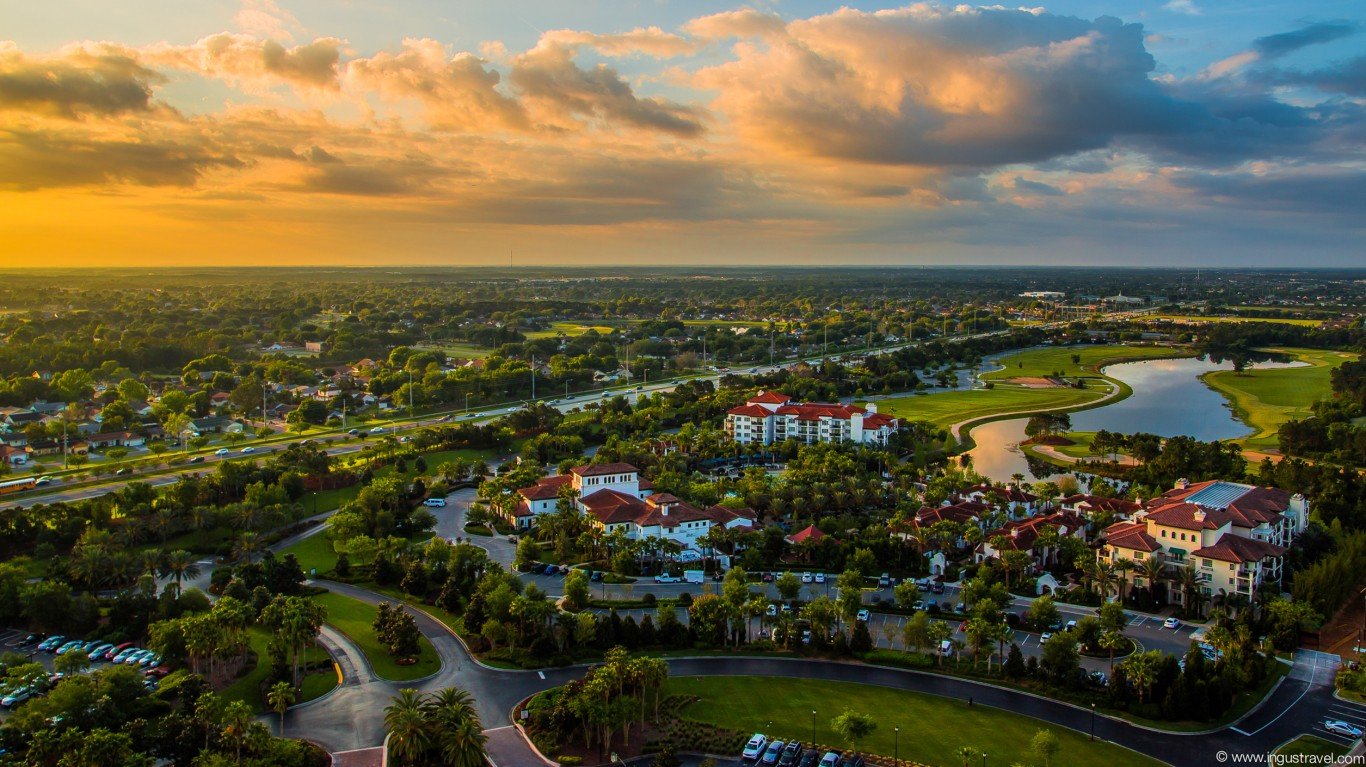
32. Orlando, Florida
> Racial disparity in mortgage denial rates: 4.62 percentage points
> Overall purchase mortgage denial rate 13.4%
> Mortgage denial rate for Black borrowers 18.0%
> White homeownership rate: 67.6% — #283 highest of 386 MSAs
> Black homeownership rate: 47.2% — #79 highest of 386 MSAs
> Black population: 15.2% — #88 highest of 386 MSAs
[in-text-ad-2]
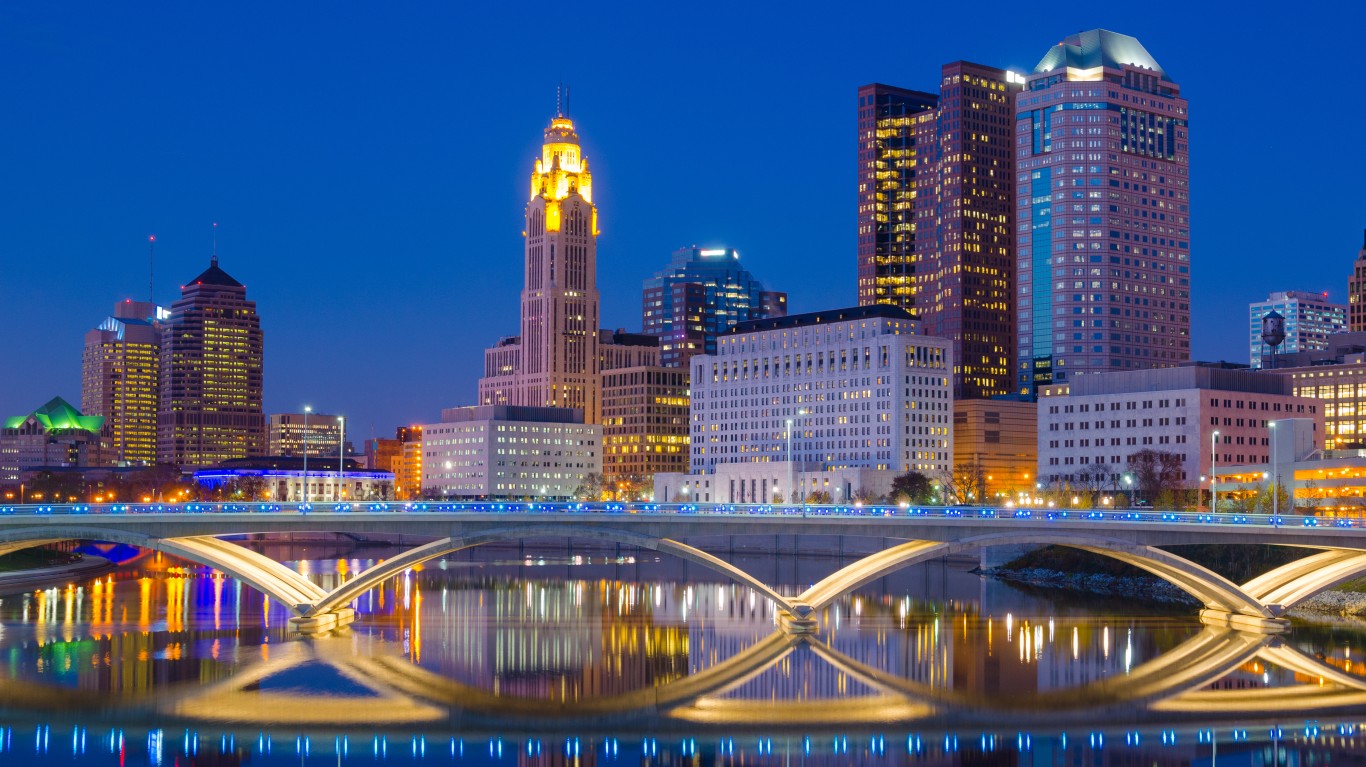
31. Columbus,Ohio
> Racial disparity in mortgage denial rates: 4.74 percentage points
> Overall purchase mortgage denial rate 7.6%
> Mortgage denial rate for Black borrowers 12.3%
> White homeownership rate: 68.8% — #260 highest of 386 MSAs
> Black homeownership rate: 33.9% — #254 highest of 386 MSAs
> Black population: 15.6% — #84 highest of 386 MSAs
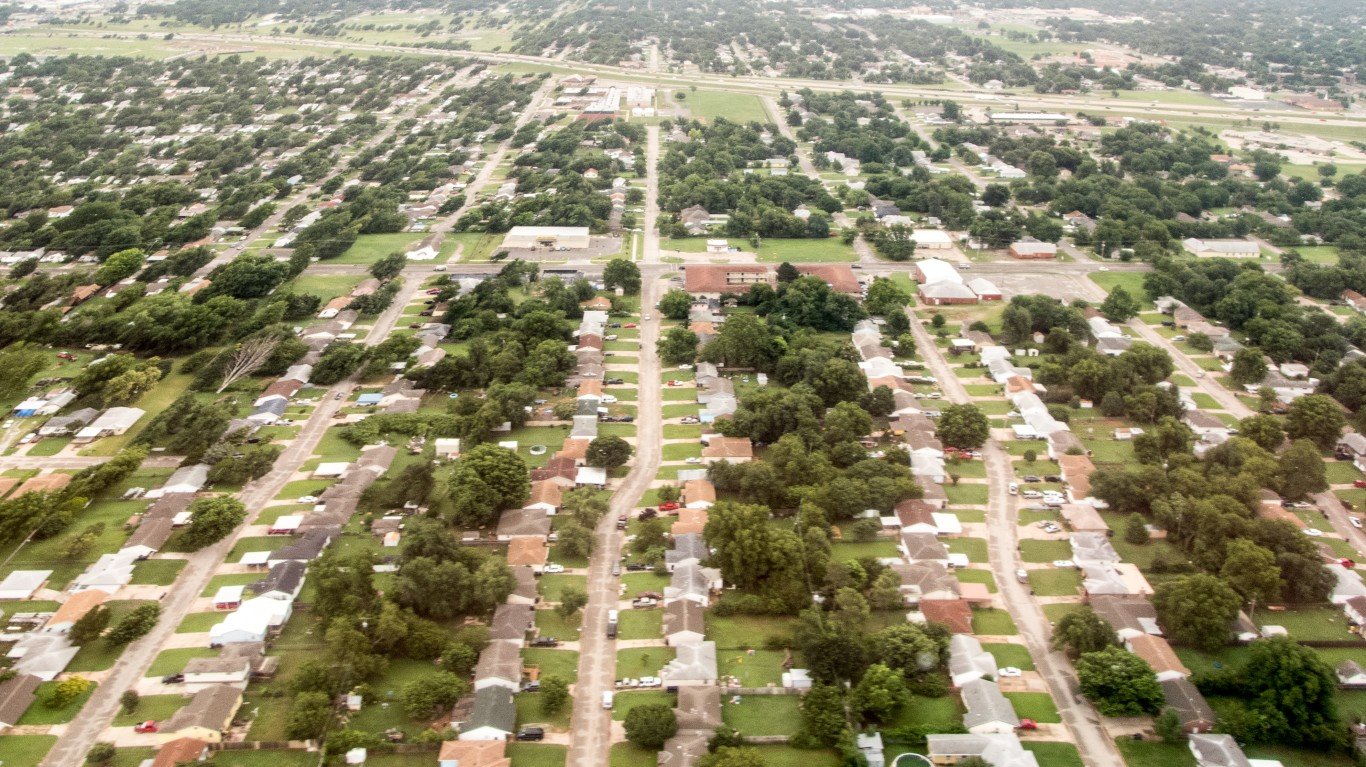
30. Oklahoma City, Oklahoma
> Racial disparity in mortgage denial rates: 4.81 percentage points
> Overall purchase mortgage denial rate 10.1%
> Mortgage denial rate for Black borrowers 14.9%
> White homeownership rate: 69.0% — #255 highest of 386 MSAs
> Black homeownership rate: 39.5% — #183 highest of 386 MSAs
> Black population: 10.0% — #143 highest of 386 MSAs
[in-text-ad]
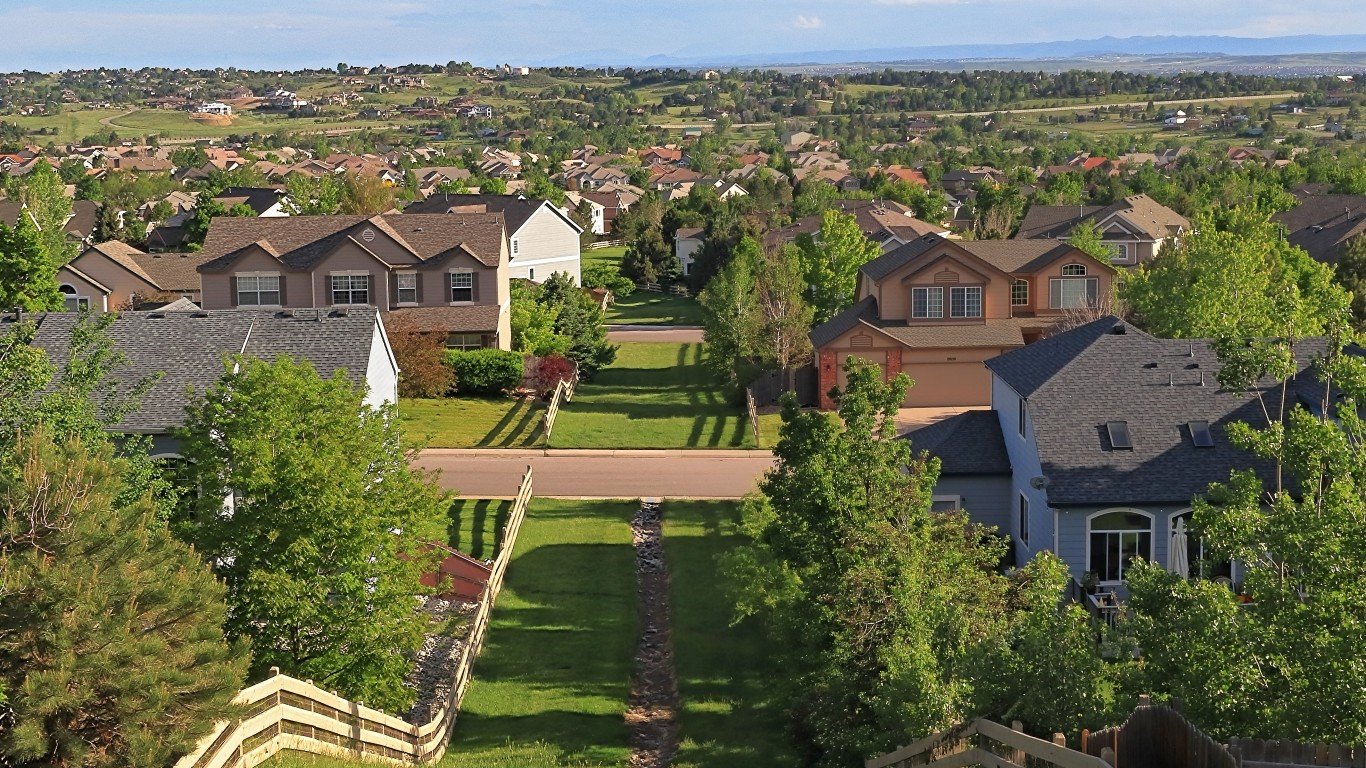
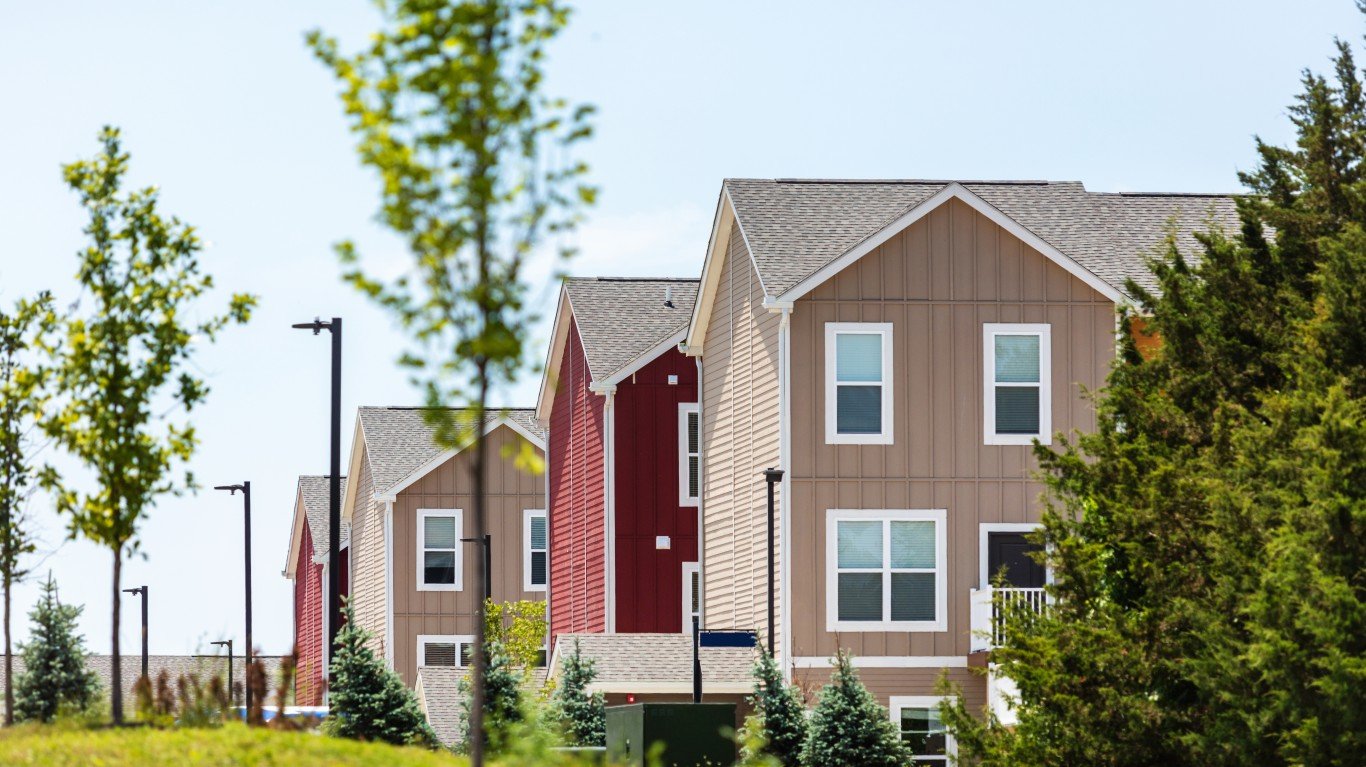
28 (tie). Denver, Colorado
> Racial disparity in mortgage denial rates: 4.83 percentage points
> Overall purchase mortgage denial rate 7.2%
> Mortgage denial rate for Black borrowers 12.0%
> White homeownership rate: 67.8% — #280 highest of 386 MSAs
> Black homeownership rate: 40.5% — #172 highest of 386 MSAs
> Black population: 5.4% — #216 highest of 386 MSAs
[recirclink id=1203686]
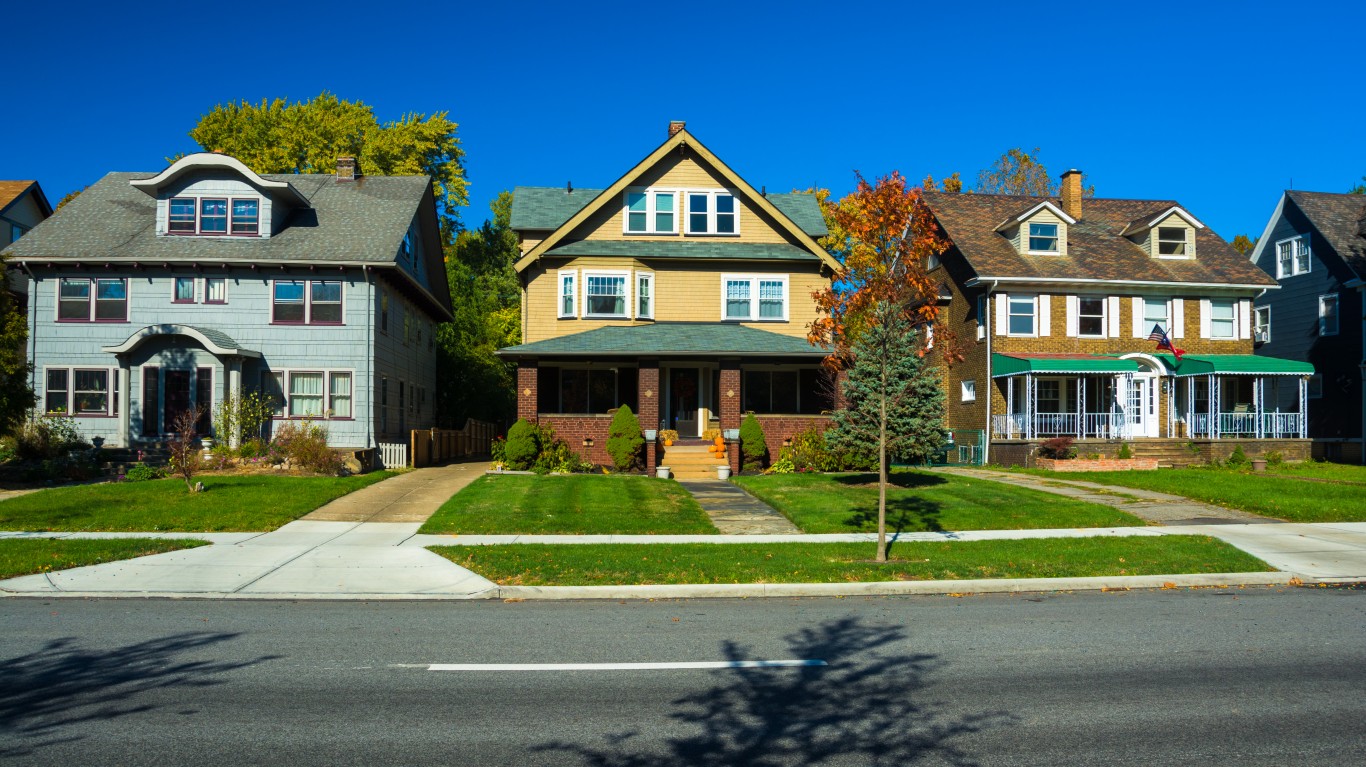
28 (tie). Cleveland, Ohio
> Racial disparity in mortgage denial rates: 4.83 percentage points
> Overall purchase mortgage denial rate 7.2%
> Mortgage denial rate for Black borrowers 12.1%
> White homeownership rate: 74.1% — #123 highest of 386 MSAs
> Black homeownership rate: 36.4% — #224 highest of 386 MSAs
> Black population: 19.2% — #65 highest of 386 MSAs
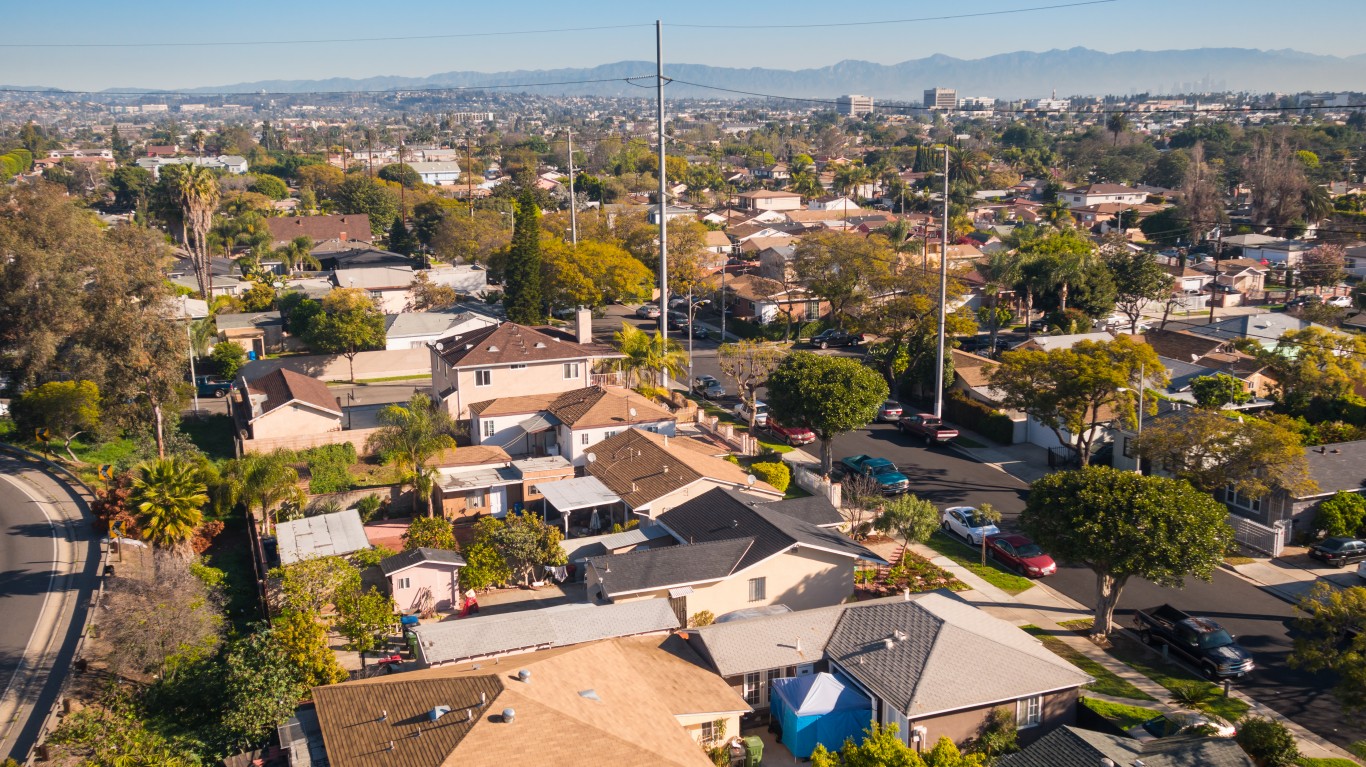
27. Los Angeles, California
> Racial disparity in mortgage denial rates: 4.89 percentage points
> Overall purchase mortgage denial rate 9.9%
> Mortgage denial rate for Black borrowers 14.7%
> White homeownership rate: 53.3% — #383 highest of 386 MSAs
> Black homeownership rate: 33.1% — #263 highest of 386 MSAs
> Black population: 6.2% — #202 highest of 386 MSAs
[in-text-ad-2]
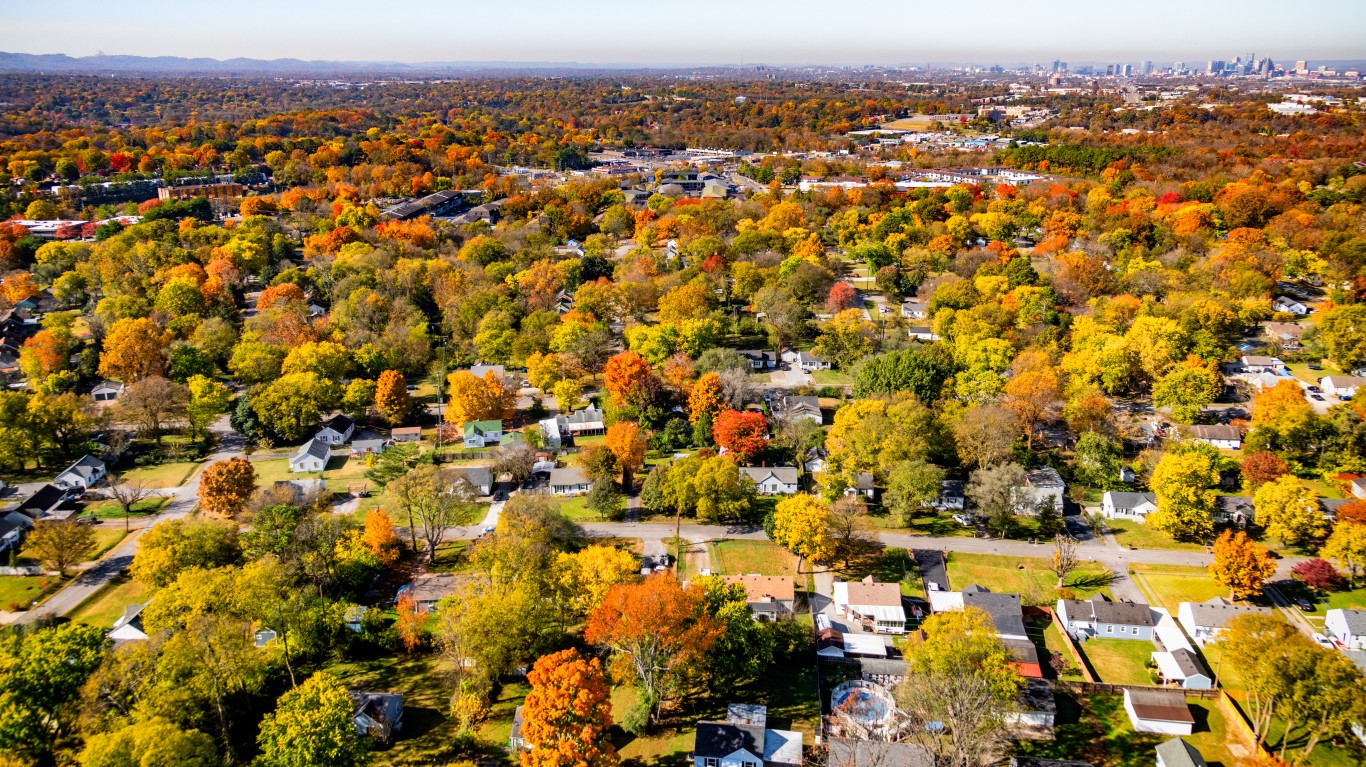
26. Nashville, Tennessee
> Racial disparity in mortgage denial rates: 4.99 percentage points
> Overall purchase mortgage denial rate 8.3%
> Mortgage denial rate for Black borrowers 13.3%
> White homeownership rate: 71.8% — #196 highest of 386 MSAs
> Black homeownership rate: 43.2% — #138 highest of 386 MSAs
> Black population: 14.9% — #91 highest of 386 MSAs
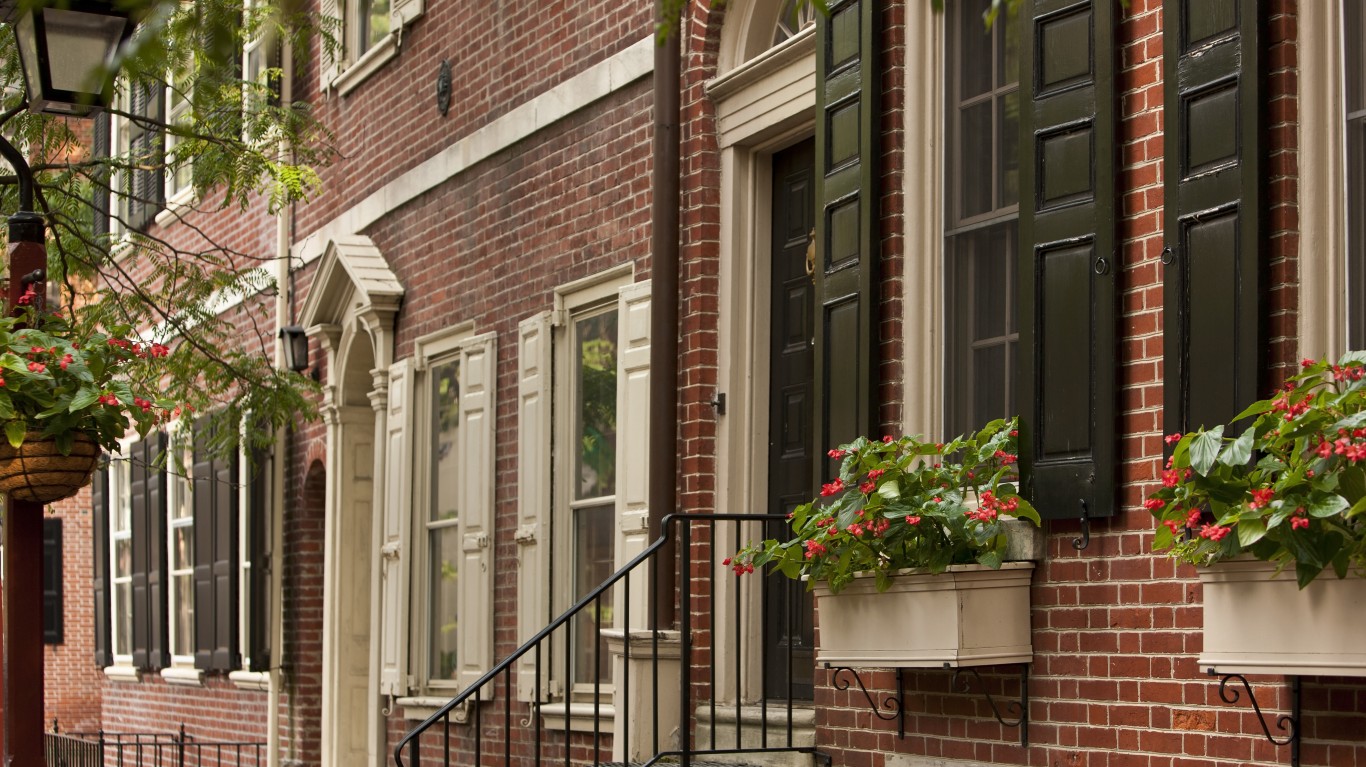
25. Philadelphia, Pennsylvania
> Racial disparity in mortgage denial rates: 5 percentage points
> Overall purchase mortgage denial rate 8.3%
> Mortgage denial rate for Black borrowers 13.3%
> White homeownership rate: 74.5% — #114 highest of 386 MSAs
> Black homeownership rate: 48.5% — #65 highest of 386 MSAs
> Black population: 19.9% — #57 highest of 386 MSAs
[in-text-ad]
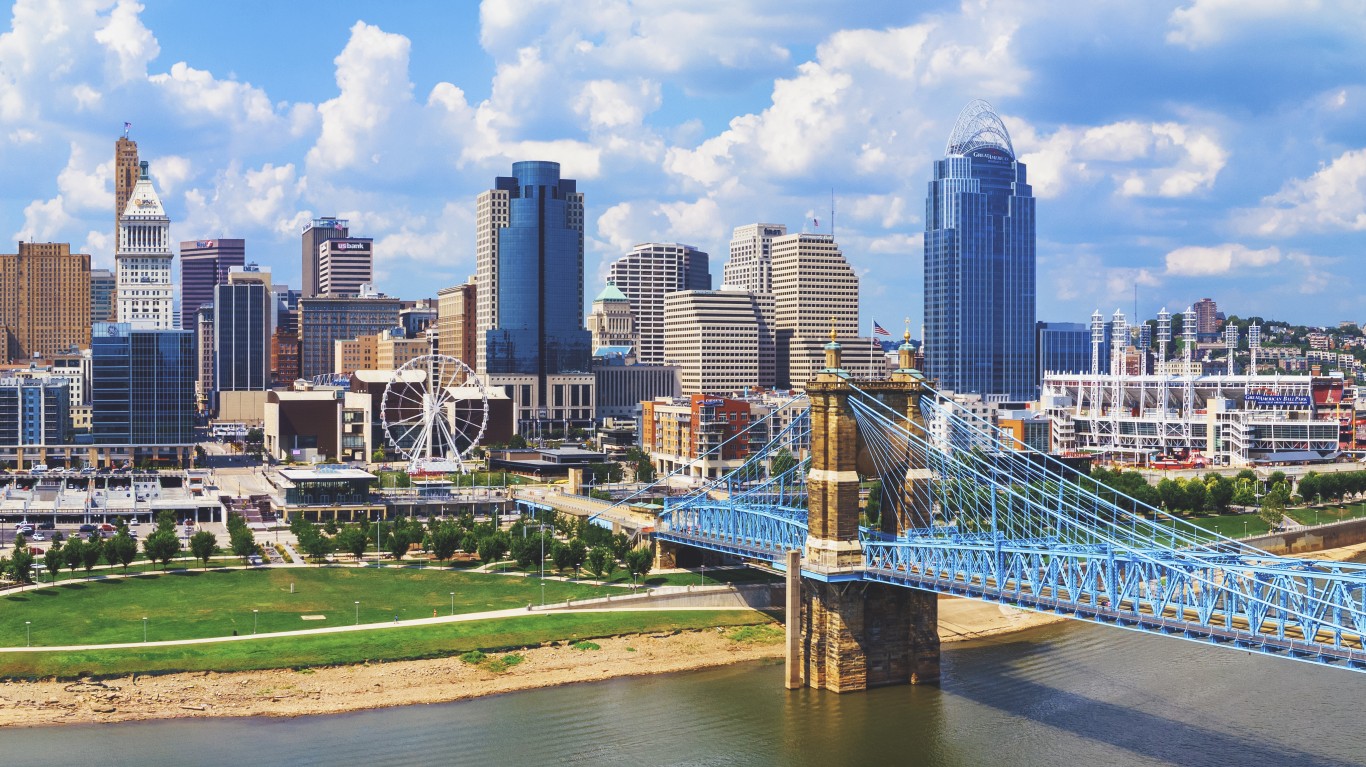
24. Cincinnati, Ohio
> Racial disparity in mortgage denial rates: 5.1 percentage points
> Overall purchase mortgage denial rate 8.0%
> Mortgage denial rate for Black borrowers 13.1%
> White homeownership rate: 73.7% — #130 highest of 386 MSAs
> Black homeownership rate: 34.3% — #249 highest of 386 MSAs
> Black population: 11.8% — #119 highest of 386 MSAs
[recirclink id=1055224]
23. Minneapolis, Minnesota
> Racial disparity in mortgage denial rates: 5.13 percentage points
> Overall purchase mortgage denial rate 5.8%
> Mortgage denial rate for Black borrowers 10.9%
> White homeownership rate: 76.4% — #69 highest of 386 MSAs
> Black homeownership rate: 28.8% — #304 highest of 386 MSAs
> Black population: 8.7% — #153 highest of 386 MSAs
21 (tie). Charlotte, North Carolina
> Racial disparity in mortgage denial rates: 5.4 percentage points
> Overall purchase mortgage denial rate 8.6%
> Mortgage denial rate for Black borrowers 14.0%
> White homeownership rate: 74.4% — #115 highest of 386 MSAs
> Black homeownership rate: 45.8% — #102 highest of 386 MSAs
> Black population: 22.4% — #47 highest of 386 MSAs
[in-text-ad-2]
21 (tie). Jacksonville, Florida
> Racial disparity in mortgage denial rates: 5.4 percentage points
> Overall purchase mortgage denial rate 12.2%
> Mortgage denial rate for Black borrowers 17.6%
> White homeownership rate: 72.0% — #190 highest of 386 MSAs
> Black homeownership rate: 44.9% — #117 highest of 386 MSAs
> Black population: 20.9% — #55 highest of 386 MSAs
20. Phoenix, Arizona
> Racial disparity in mortgage denial rates: 5.54 percentage points
> Overall purchase mortgage denial rate 9.8%
> Mortgage denial rate for Black borrowers 15.4%
> White homeownership rate: 69.1% — #252 highest of 386 MSAs
> Black homeownership rate: 36.0% — #227 highest of 386 MSAs
> Black population: 5.2% — #221 highest of 386 MSAs
[in-text-ad]
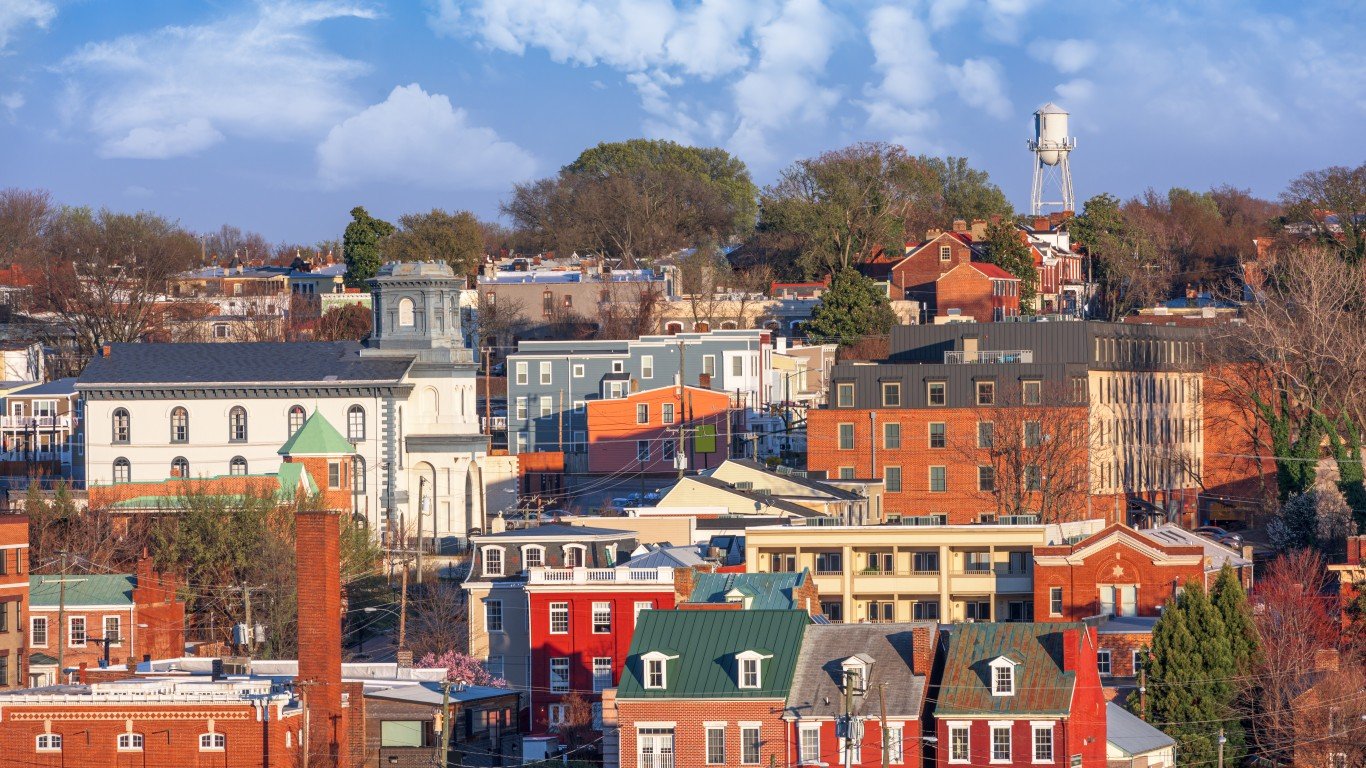
19. Richmond, Virginia
> Racial disparity in mortgage denial rates: 5.72 percentage points
> Overall purchase mortgage denial rate 7.9%
> Mortgage denial rate for Black borrowers 13.6%
> White homeownership rate: 75.3% — #88 highest of 386 MSAs
> Black homeownership rate: 49.9% — #52 highest of 386 MSAs
> Black population: 28.8% — #33 highest of 386 MSAs
[recirclink id=1291862]
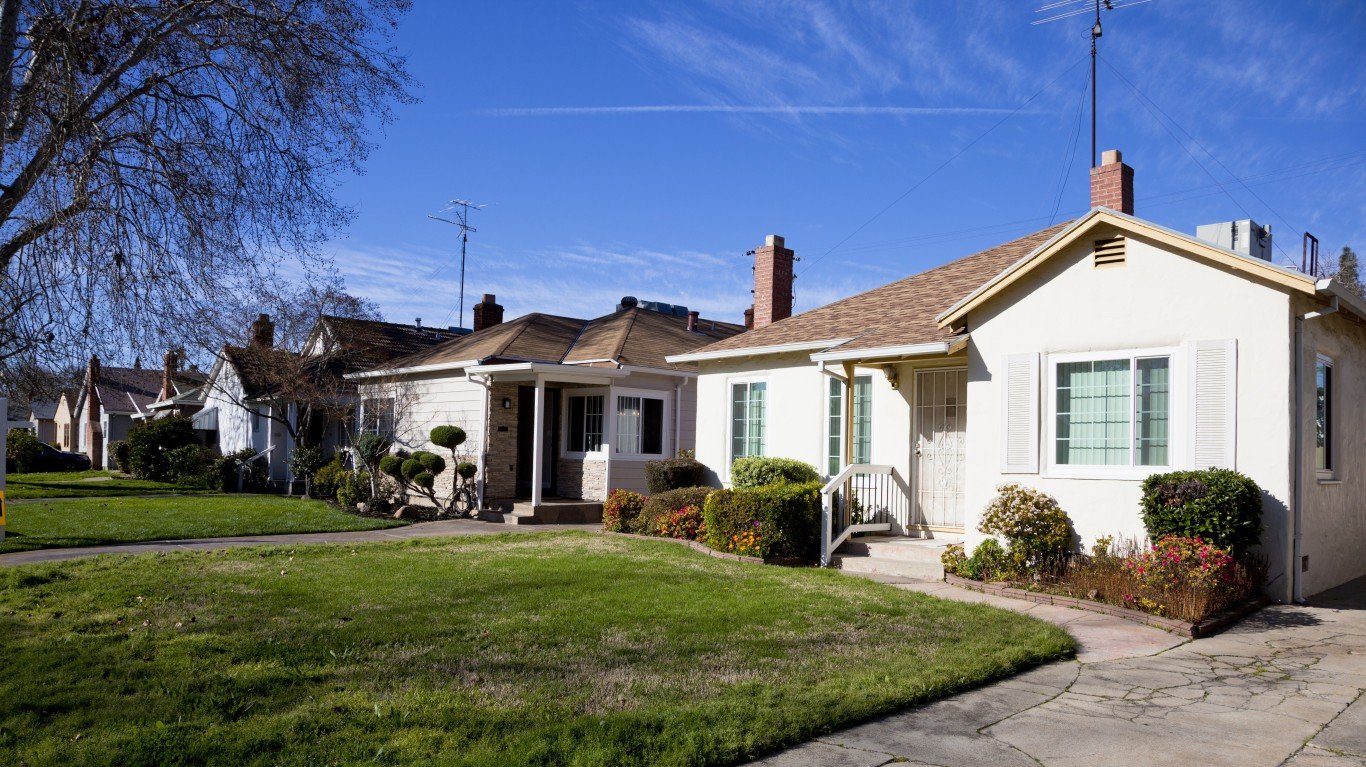
18. Sacramento, California
> Racial disparity in mortgage denial rates: 5.8 percentage points
> Overall purchase mortgage denial rate 7.7%
> Mortgage denial rate for Black borrowers 13.5%
> White homeownership rate: 66.6% — #297 highest of 386 MSAs
> Black homeownership rate: 35.7% — #232 highest of 386 MSAs
> Black population: 6.7% — #191 highest of 386 MSAs
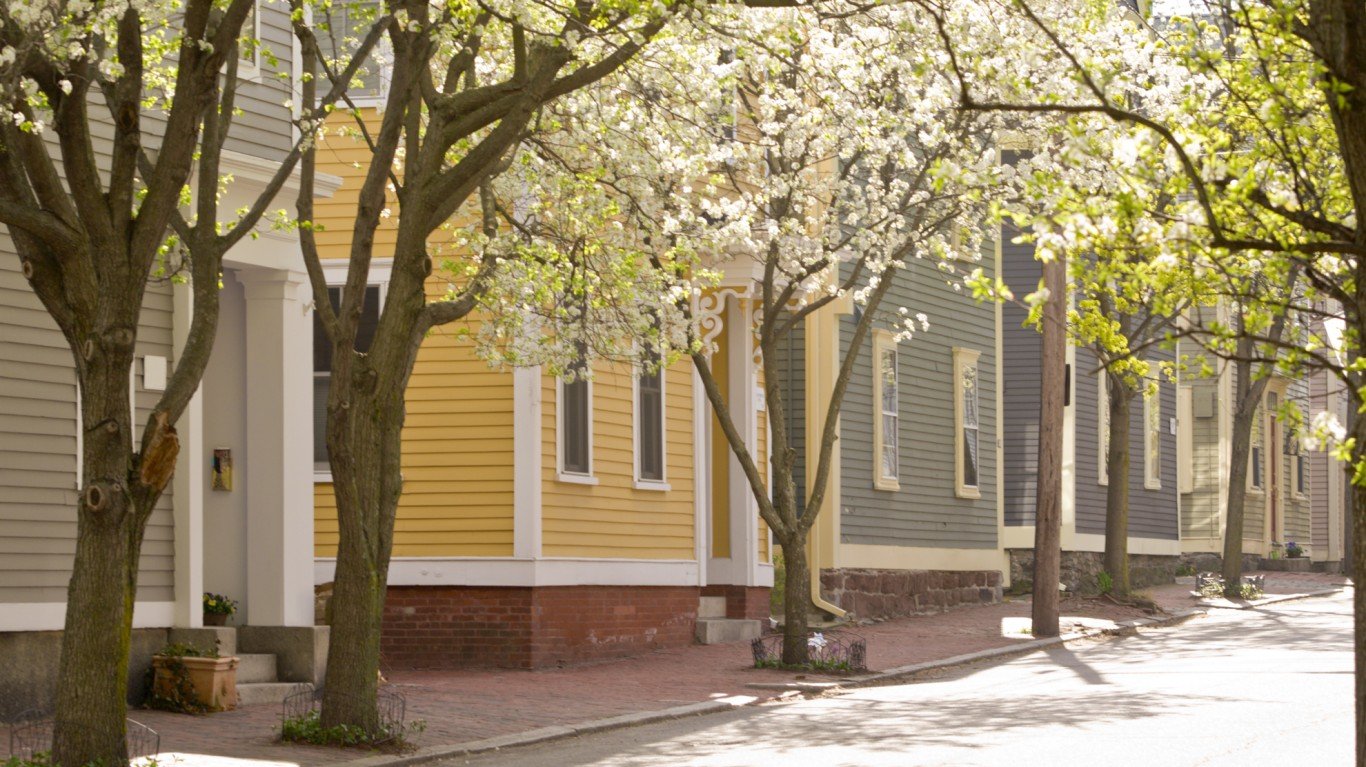
17. Providence, Rhode Island
> Racial disparity in mortgage denial rates: 5.89 percentage points
> Overall purchase mortgage denial rate 8.5%
> Mortgage denial rate for Black borrowers 14.3%
> White homeownership rate: 67.3% — #287 highest of 386 MSAs
> Black homeownership rate: 34.3% — #250 highest of 386 MSAs
> Black population: 4.8% — #228 highest of 386 MSAs
[in-text-ad-2]
16. Memphis, Tennessee
> Racial disparity in mortgage denial rates: 5.99 percentage points
> Overall purchase mortgage denial rate 9.8%
> Mortgage denial rate for Black borrowers 15.8%
> White homeownership rate: 75.9% — #78 highest of 386 MSAs
> Black homeownership rate: 46.0% — #96 highest of 386 MSAs
> Black population: 47.2% — #4 highest of 386 MSAs
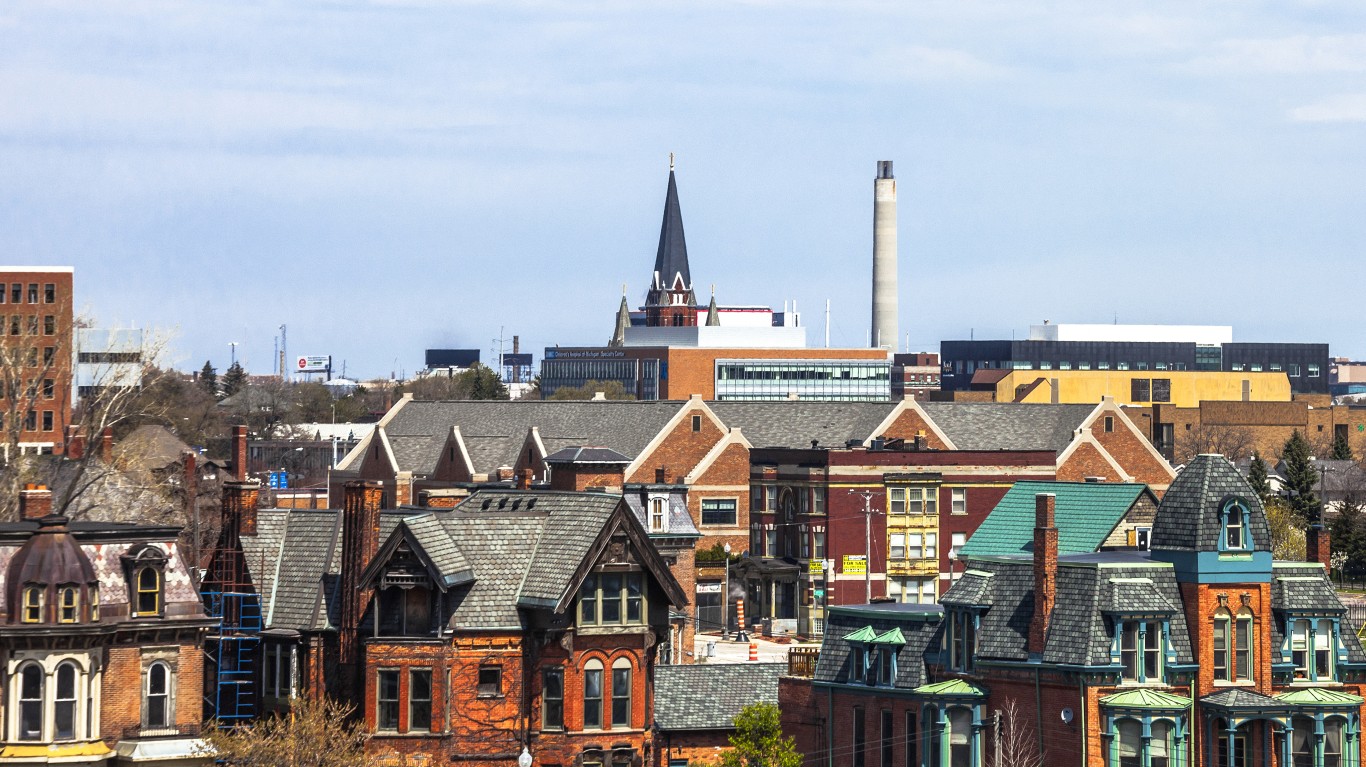
15. Detroit, Michigan
> Racial disparity in mortgage denial rates: 6.09 percentage points
> Overall purchase mortgage denial rate 14.4%
> Mortgage denial rate for Black borrowers 20.5%
> White homeownership rate: 79.1% — #19 highest of 386 MSAs
> Black homeownership rate: 43.6% — #132 highest of 386 MSAs
> Black population: 21.7% — #51 highest of 386 MSAs
[in-text-ad]
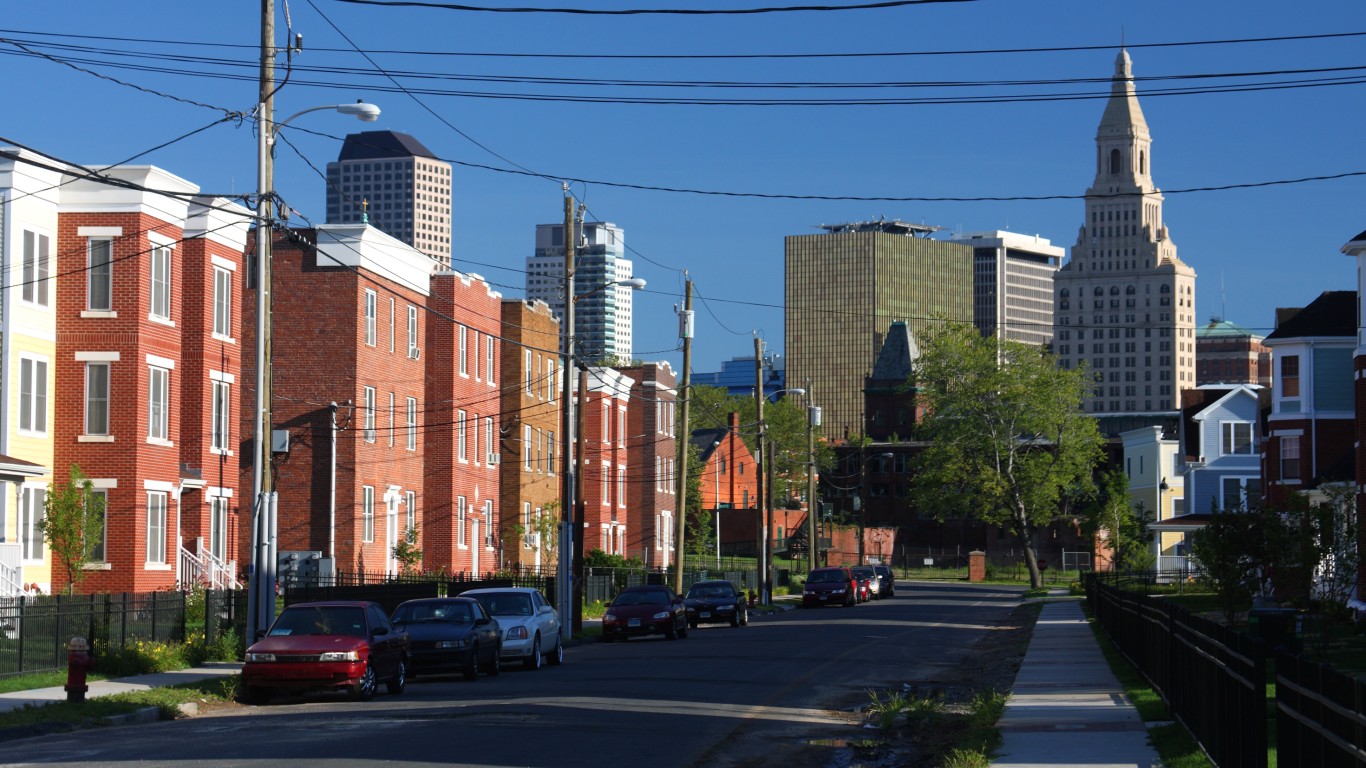
14. Hartford, Connecticut
> Racial disparity in mortgage denial rates: 6.3 percentage points
> Overall purchase mortgage denial rate 7.9%
> Mortgage denial rate for Black borrowers 14.2%
> White homeownership rate: 74.2% — #120 highest of 386 MSAs
> Black homeownership rate: 43.5% — #133 highest of 386 MSAs
> Black population: 10.5% — #135 highest of 386 MSAs
[recirclink id=1259887]
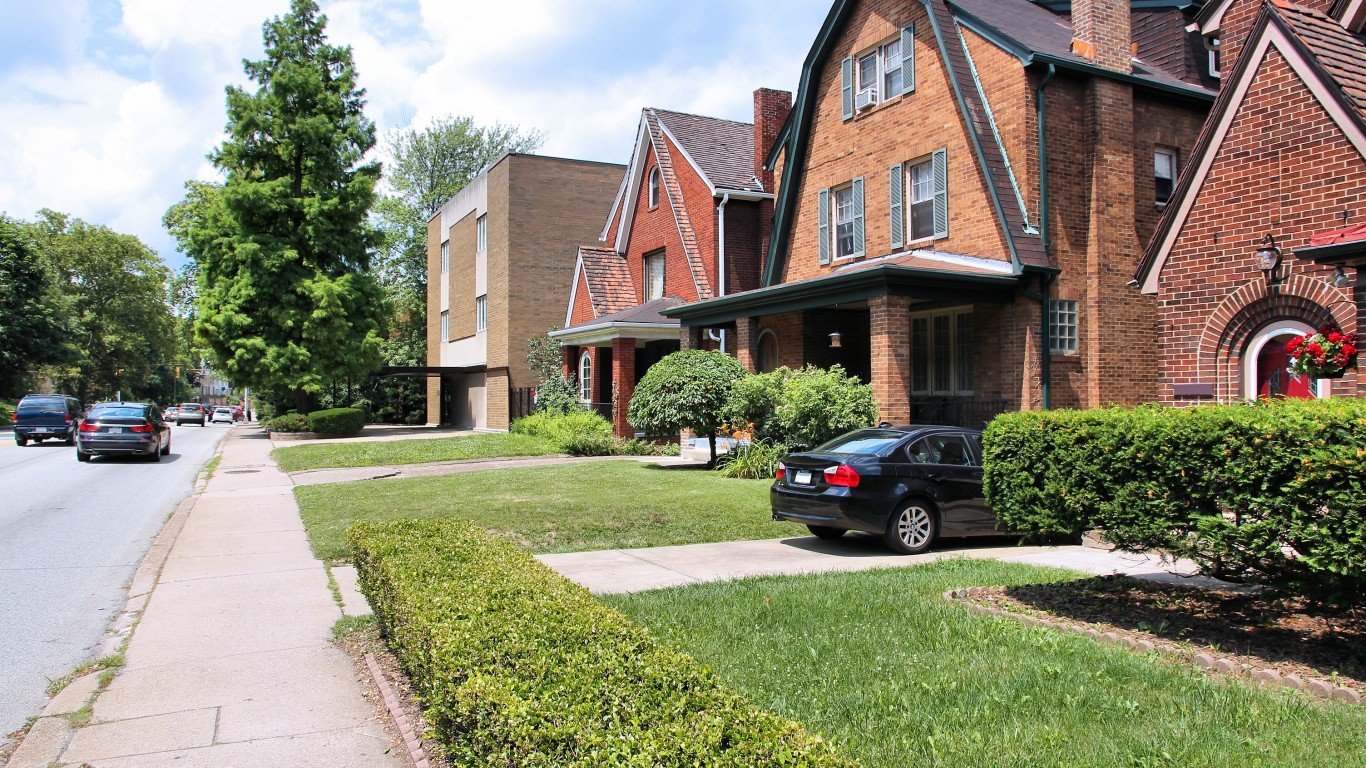
13. Pittsburgh, Pennsylvania
> Racial disparity in mortgage denial rates: 6.32 percentage points
> Overall purchase mortgage denial rate 7.4%
> Mortgage denial rate for Black borrowers 13.7%
> White homeownership rate: 74.7% — #110 highest of 386 MSAs
> Black homeownership rate: 33.6% — #256 highest of 386 MSAs
> Black population: 8.0% — #164 highest of 386 MSAs
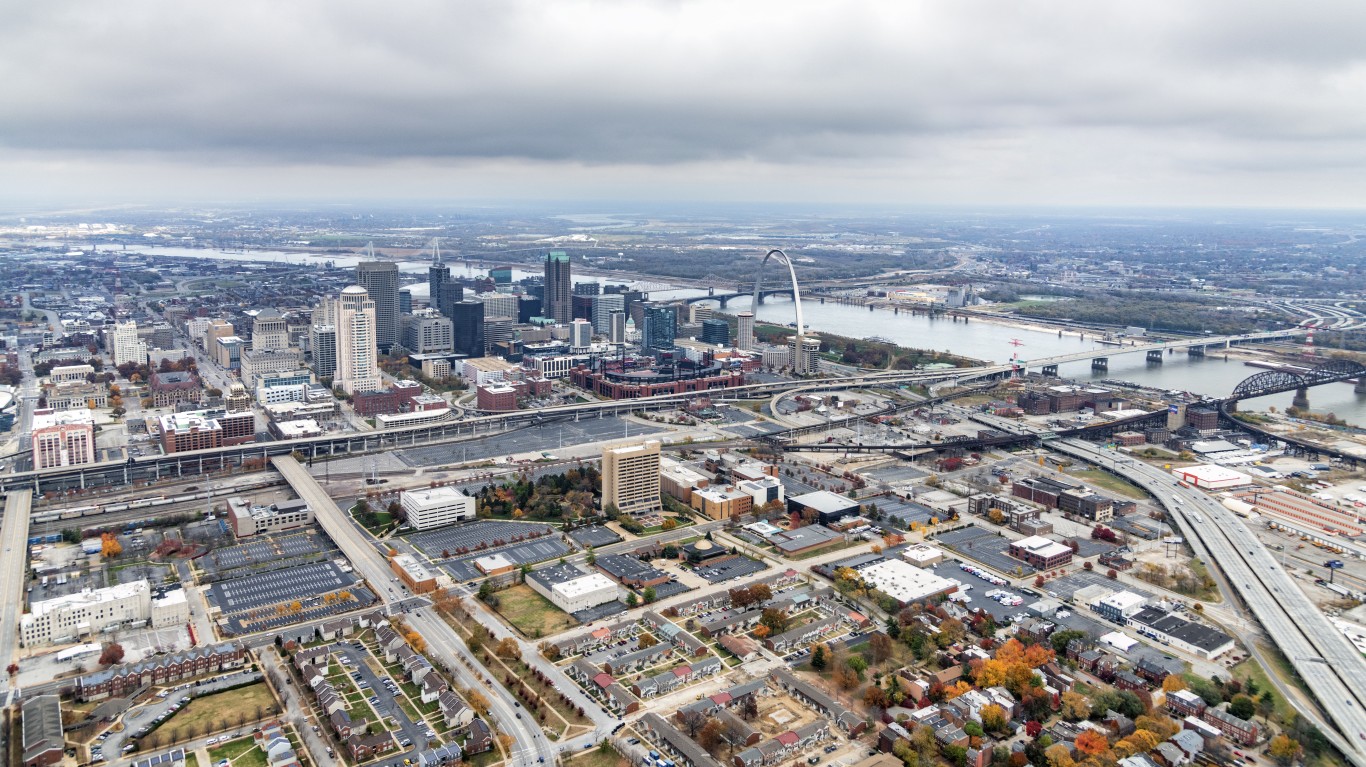
12. St. Louis, Missouri
> Racial disparity in mortgage denial rates: 6.4 percentage points
> Overall purchase mortgage denial rate 7.6%
> Mortgage denial rate for Black borrowers 14.0%
> White homeownership rate: 77.4% — #47 highest of 386 MSAs
> Black homeownership rate: 40.6% — #169 highest of 386 MSAs
> Black population: 17.8% — #70 highest of 386 MSAs
[in-text-ad-2]
11. New York, New York
> Racial disparity in mortgage denial rates: 6.44 percentage points
> Overall purchase mortgage denial rate 10.2%
> Mortgage denial rate for Black borrowers 16.6%
> White homeownership rate: 62.6% — #344 highest of 386 MSAs
> Black homeownership rate: 32.7% — #266 highest of 386 MSAs
> Black population: 15.4% — #86 highest of 386 MSAs
10. Indianapolis, Indiana
> Racial disparity in mortgage denial rates: 6.59 percentage points
> Overall purchase mortgage denial rate 8.2%
> Mortgage denial rate for Black borrowers 14.8%
> White homeownership rate: 72.9% — #154 highest of 386 MSAs
> Black homeownership rate: 36.8% — #217 highest of 386 MSAs
> Black population: 15.1% — #90 highest of 386 MSAs
[in-text-ad]
9. Chicago, Illinois
> Racial disparity in mortgage denial rates: 6.67 percentage points
> Overall purchase mortgage denial rate 8.3%
> Mortgage denial rate for Black borrowers 15.0%
> White homeownership rate: 73.2% — #145 highest of 386 MSAs
> Black homeownership rate: 41.2% — #161 highest of 386 MSAs
> Black population: 16.1% — #81 highest of 386 MSAs
[recirclink id=1201553]
8. Miami, Florida
> Racial disparity in mortgage denial rates: 6.77 percentage points
> Overall purchase mortgage denial rate 15.2%
> Mortgage denial rate for Black borrowers 22.0%
> White homeownership rate: 65.3% — #318 highest of 386 MSAs
> Black homeownership rate: 47.2% — #78 highest of 386 MSAs
> Black population: 19.8% — #58 highest of 386 MSAs
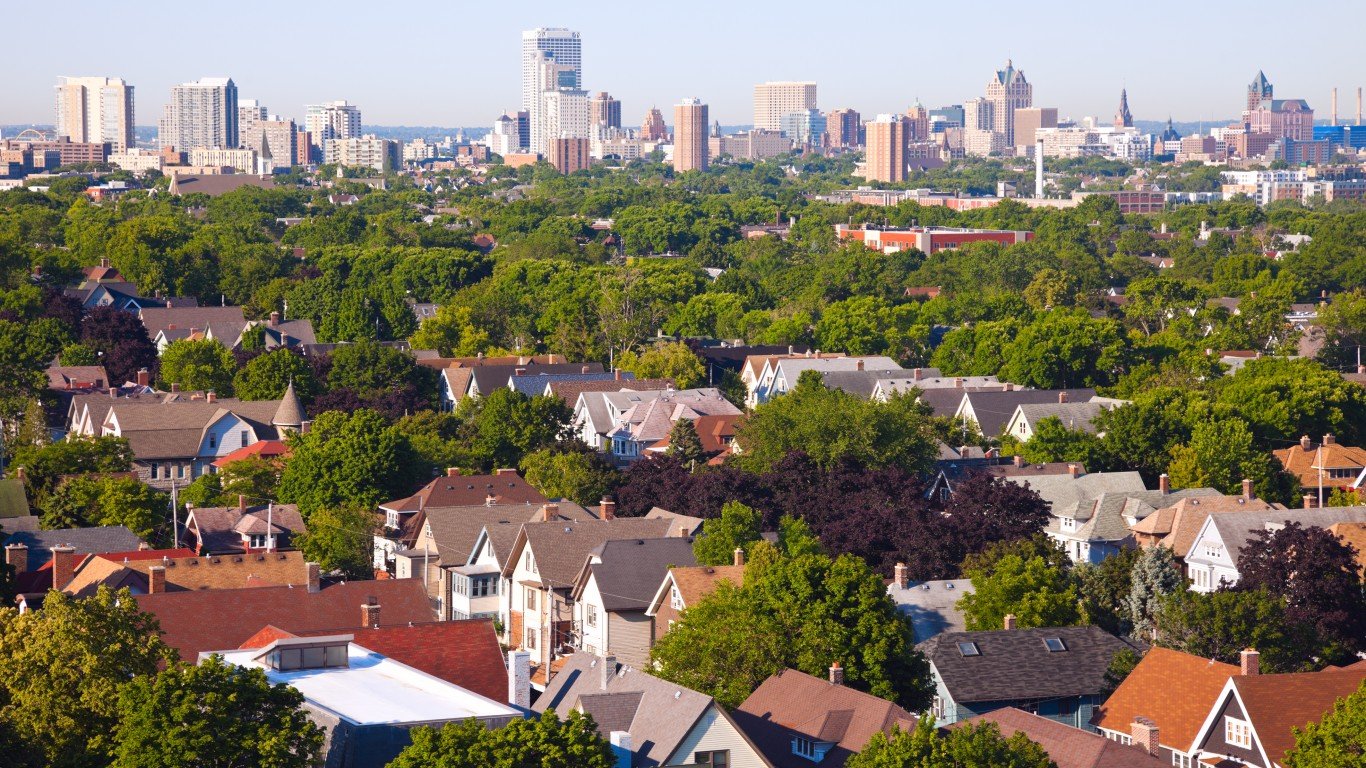
7. Milwaukee, Wisconsin
> Racial disparity in mortgage denial rates: 7.73 percentage points
> Overall purchase mortgage denial rate 7.4%
> Mortgage denial rate for Black borrowers 15.1%
> White homeownership rate: 68.9% — #257 highest of 386 MSAs
> Black homeownership rate: 27.1% — #318 highest of 386 MSAs
> Black population: 16.2% — #79 highest of 386 MSAs
[in-text-ad-2]
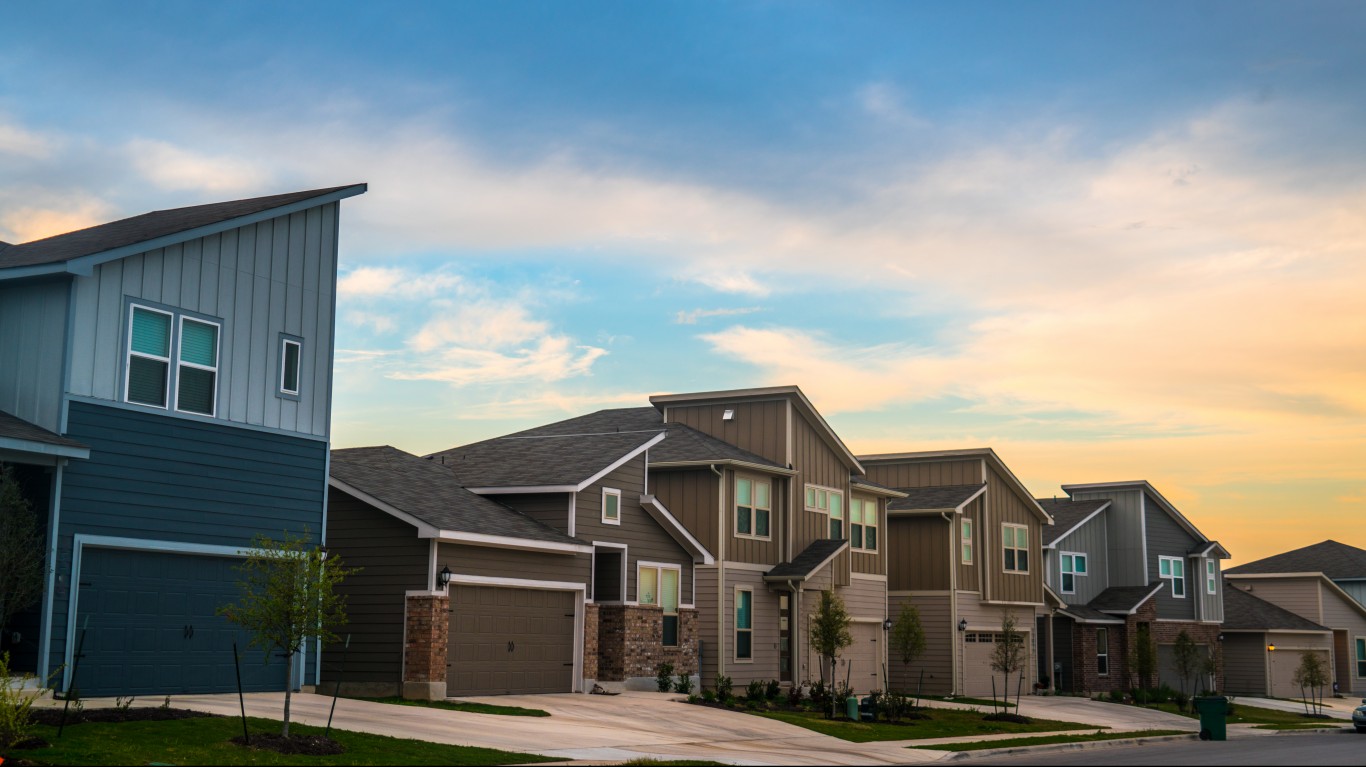
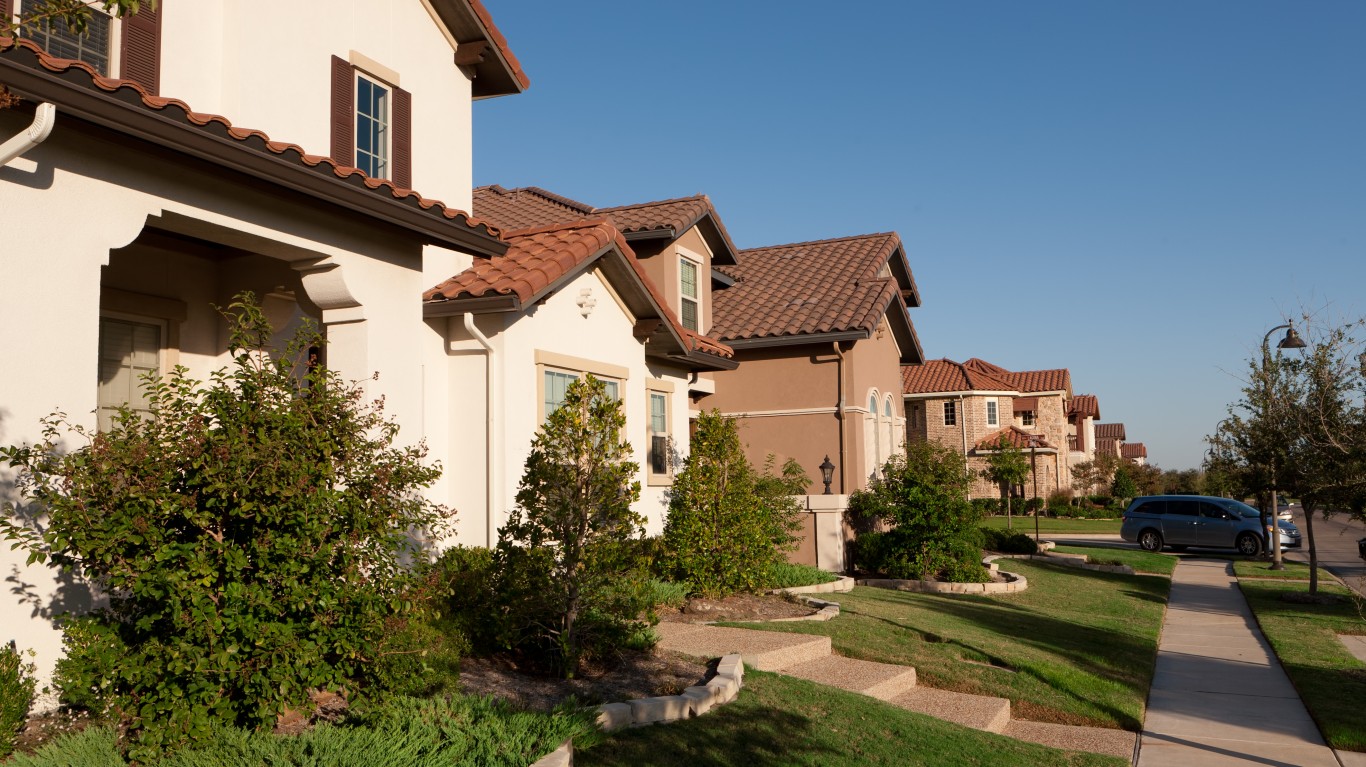
6. Austin,Texas
> Racial disparity in mortgage denial rates: 8.23 percentage points
> Overall purchase mortgage denial rate 10.8%
> Mortgage denial rate for Black borrowers 19.1%
> White homeownership rate: 61.7% — #353 highest of 386 MSAs
> Black homeownership rate: 44.1% — #124 highest of 386 MSAs
> Black population: 6.9% — #182 highest of 386 MSAs
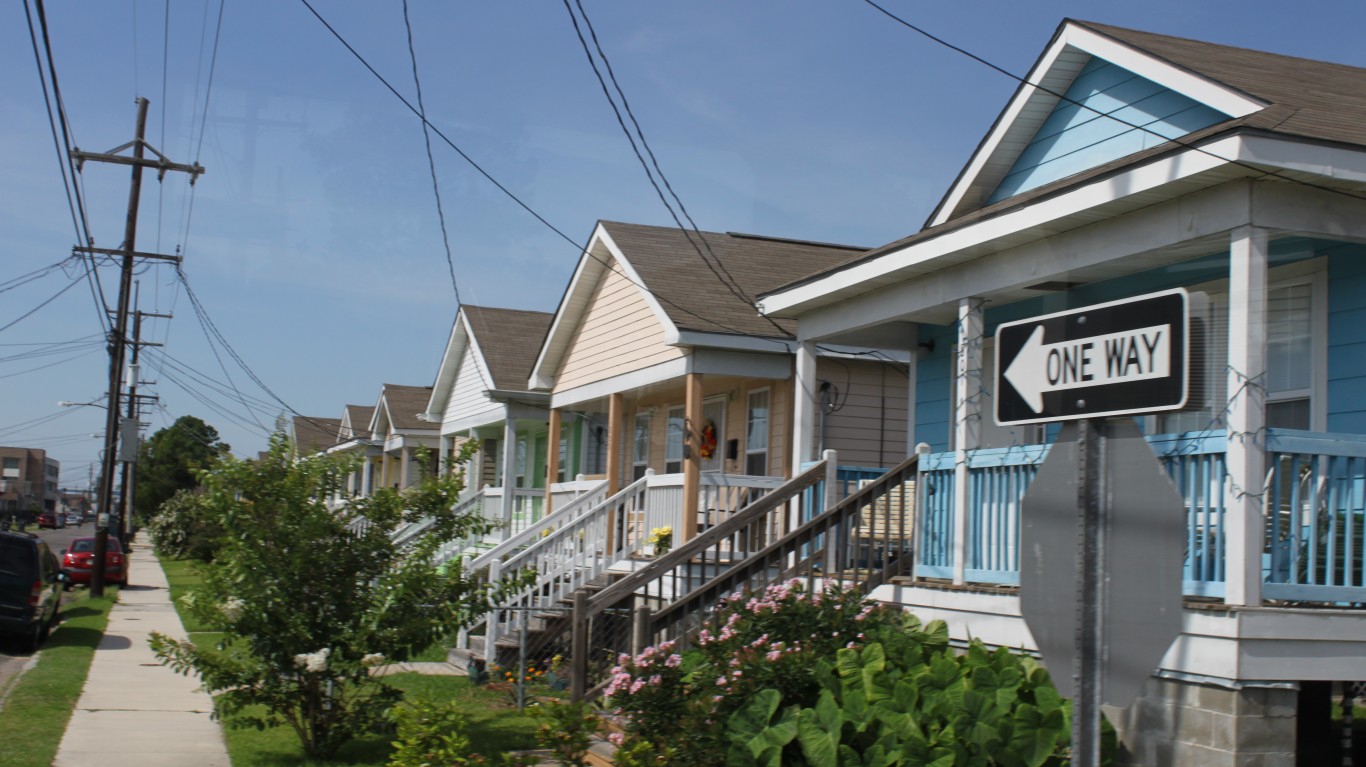
5. New Orleans, Louisiana
> Racial disparity in mortgage denial rates: 8.37 percentage points
> Overall purchase mortgage denial rate 11.3%
> Mortgage denial rate for Black borrowers 19.6%
> White homeownership rate: 72.8% — #160 highest of 386 MSAs
> Black homeownership rate: 47.9% — #70 highest of 386 MSAs
> Black population: 33.9% — #20 highest of 386 MSAs
[in-text-ad]
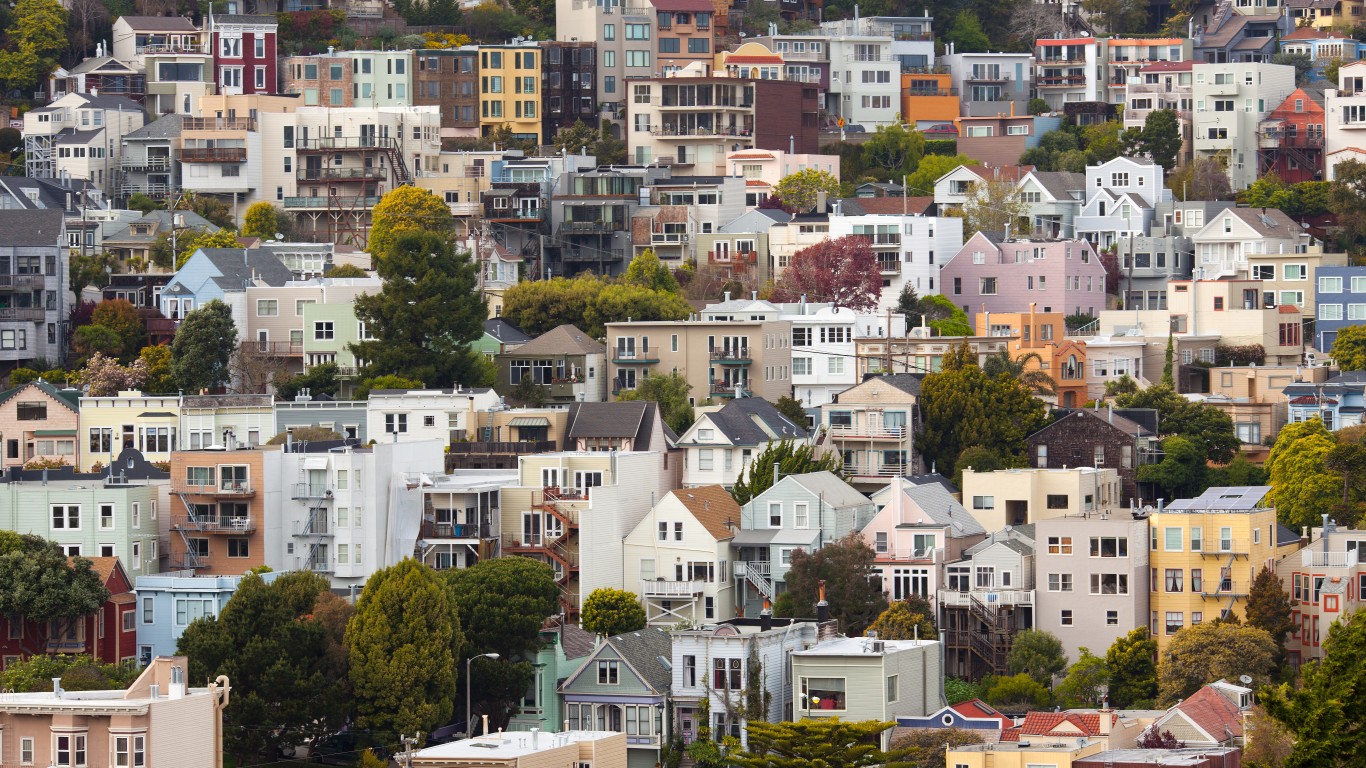
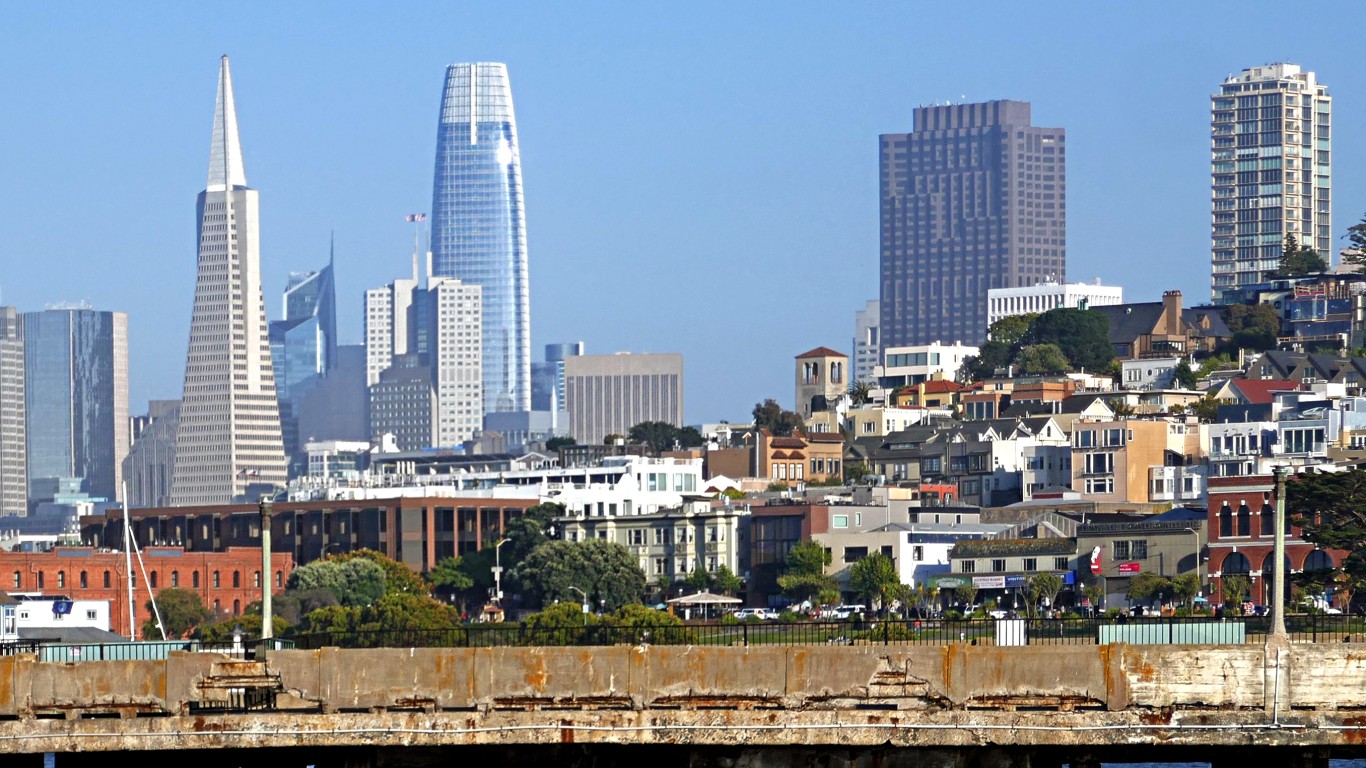
4. San Francisco, California
> Racial disparity in mortgage denial rates: 8.38 percentage points
> Overall purchase mortgage denial rate 6.5%
> Mortgage denial rate for Black borrowers 14.8%
> White homeownership rate: 59.5% — #368 highest of 386 MSAs
> Black homeownership rate: 35.3% — #238 highest of 386 MSAs
> Black population: 6.9% — #179 highest of 386 MSAs
[recirclink id=1203686]
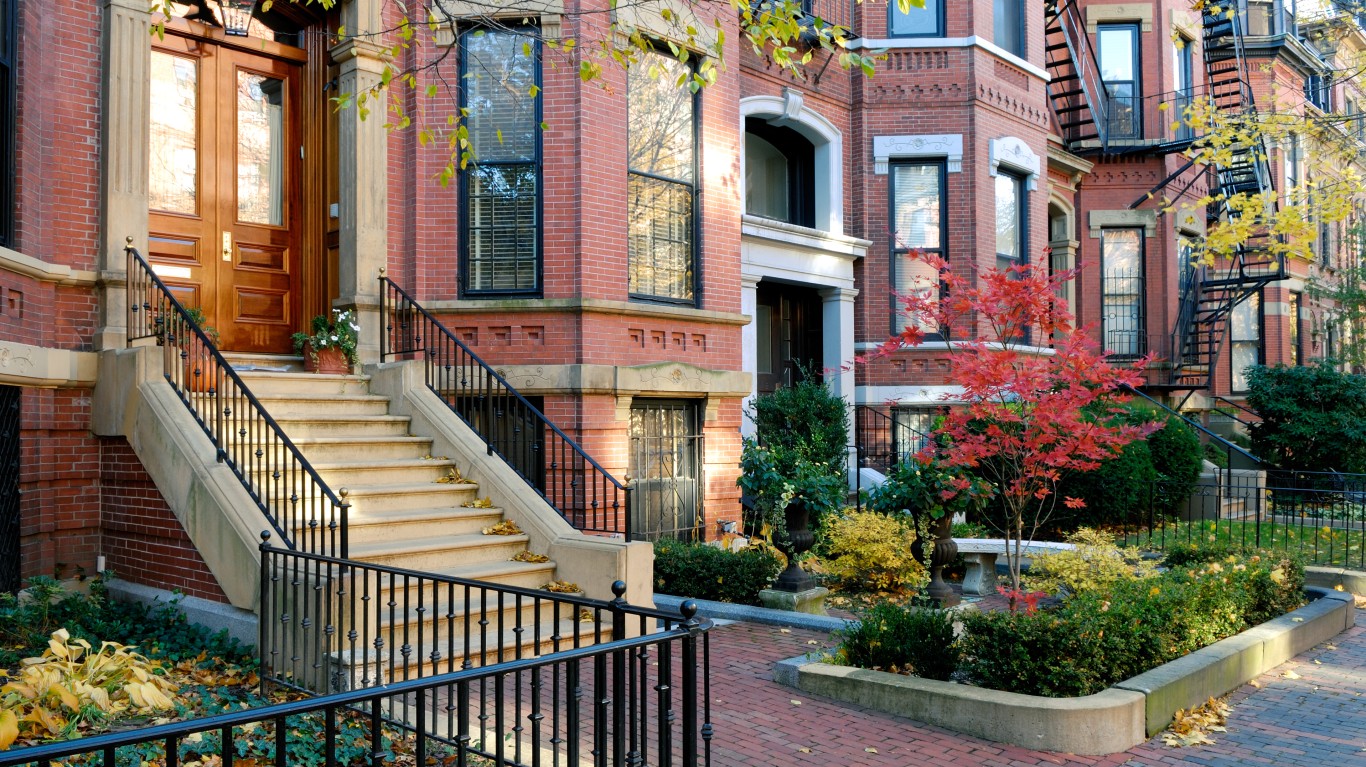
3. Boston, Massachusetts
> Racial disparity in mortgage denial rates: 8.63 percentage points
> Overall purchase mortgage denial rate 7.5%
> Mortgage denial rate for Black borrowers 16.2%
> White homeownership rate: 67.5% — #284 highest of 386 MSAs
> Black homeownership rate: 35.1% — #239 highest of 386 MSAs
> Black population: 7.3% — #176 highest of 386 MSAs
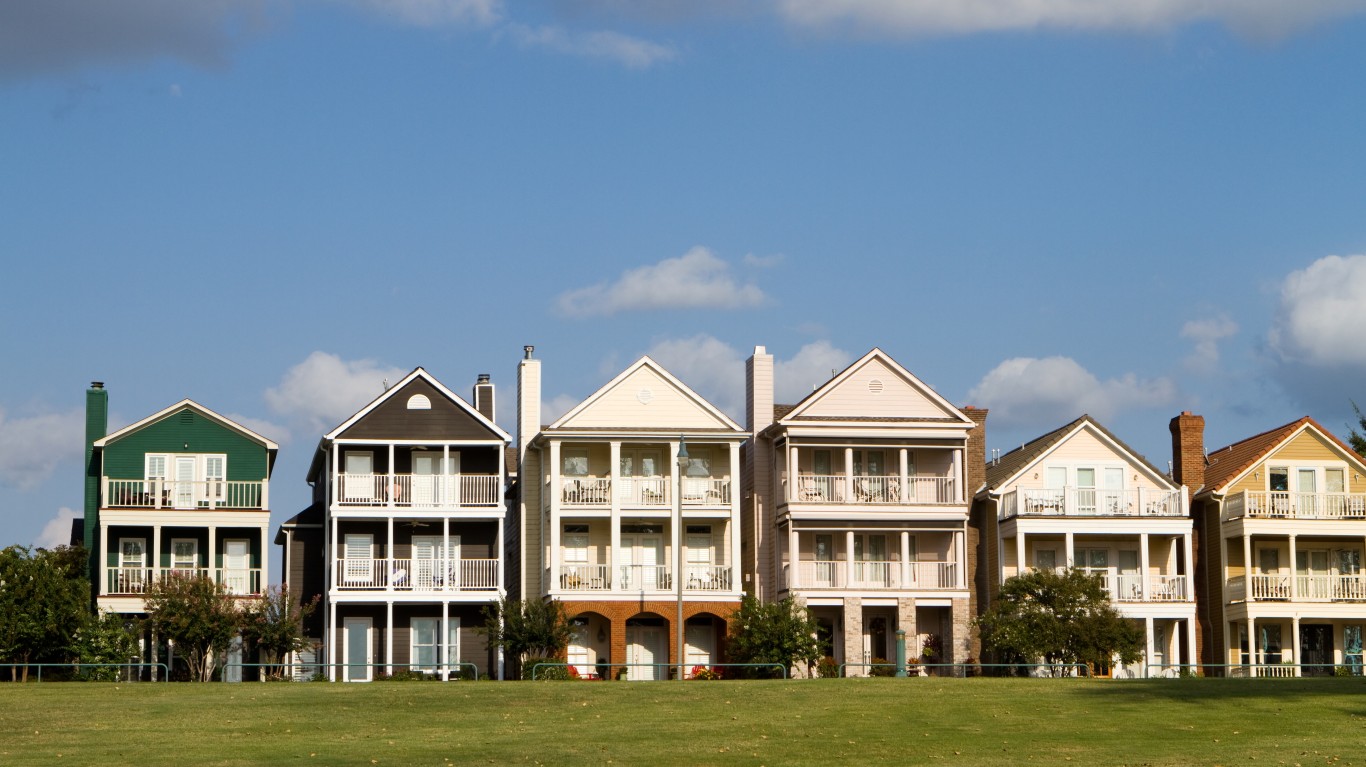
2. Raleigh, North Carolina
> Racial disparity in mortgage denial rates: 8.65 percentage points
> Overall purchase mortgage denial rate 7.2%
> Mortgage denial rate for Black borrowers 15.9%
> White homeownership rate: 73.5% — #140 highest of 386 MSAs
> Black homeownership rate: 46.6% — #90 highest of 386 MSAs
> Black population: 19.1% — #66 highest of 386 MSAs
[in-text-ad-2]
1. Buffalo, New York
> Racial disparity in mortgage denial rates: 9.4 percentage points
> Overall purchase mortgage denial rate 9.0%
> Mortgage denial rate for Black borrowers 18.4%
> White homeownership rate: 72.5% — #172 highest of 386 MSAs
> Black homeownership rate: 36.7% — #221 highest of 386 MSAs
> Black population: 11.4% — #127 highest of 386 MSAs
Methodology:
To identify the cities with the most racist mortgage lending practices, 24/7 Wall St. reviewed a July 2023 analysis by online lending market place LendingTree, “Black Homebuyers in 50 Largest US Metros 1.6 Times More Likely to Be Denied for Mortgage Than Overall Population.” Lending Tree reviewed the racial disparities in mortgage denial rates in the 50 largest metropolitan statistical areas, that is, the difference between the denial rate for the overall population and that for Black homebuyers.
For additional context, we included for each city the white and Black homeownership rate — the percentage of homes that are owned by their occupants — as well as the share of the population who identifies as Black, according to the Census Bureau’s 2021 American Community Survey.
Contact [email protected] for any questions or corrections.