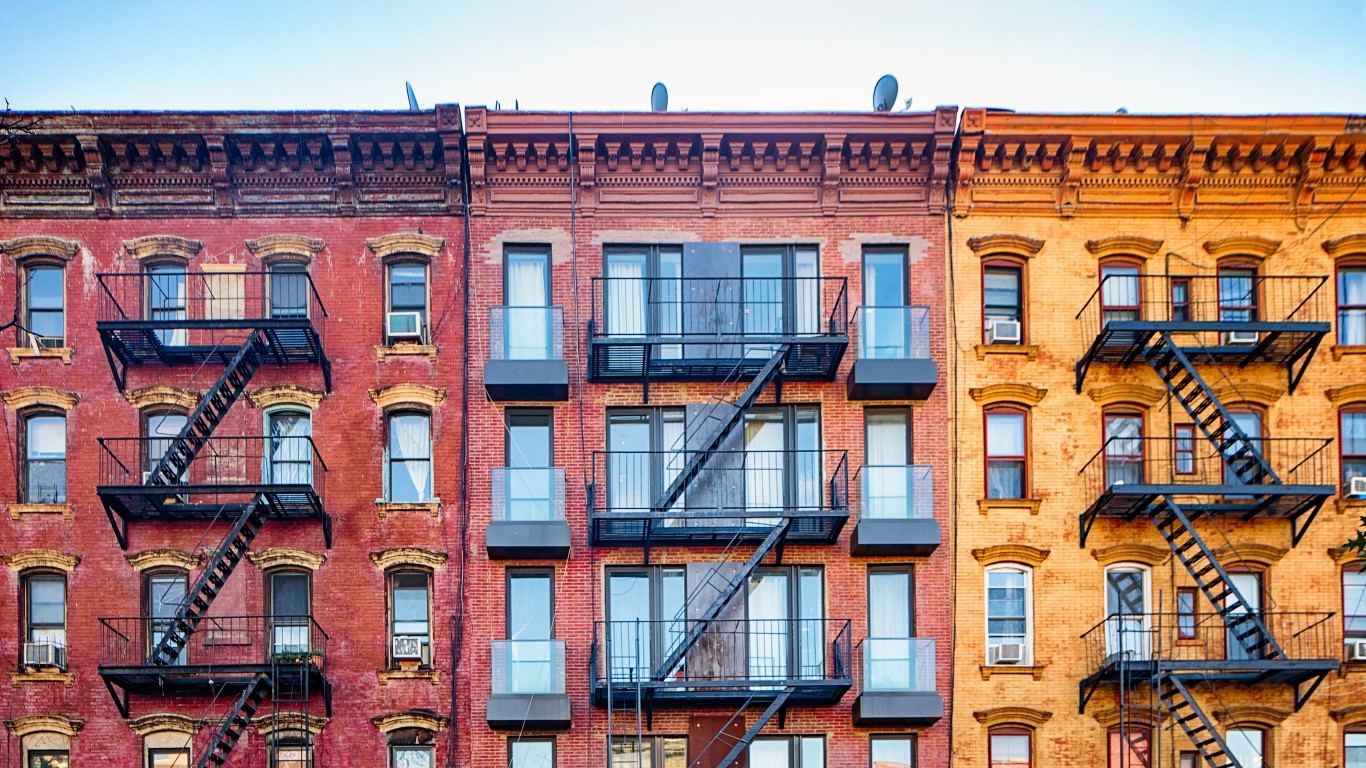
U.S. home sales skyrocketed during the COVID-19 pandemic – hitting a 15-year high of 6.1 million in 2021. The spike in demand, coupled with declining inventory, have put upward pressure on housing prices. Renters have not been spared, as housing has become one of the key drivers of surging U.S. inflation.
According to the Economic Policy Institute, a nonprofit think tank, a family of four – two adults and two children – can expect to pay an estimated $15,031 on housing in 2022. This amount varies across the country, however, and in many major metropolitan areas, families are paying thousands more than the estimated national average.
Using data from the EPI’s Family Budget Calculator, 24/7 Wall St. identified the 50 metro areas where families pay the most for housing. Metro areas are ranked on 2022 estimates of housing and utility costs for a modest two-bedroom rental.
Among the metro areas on this list, housing costs for a family of four range from about $15,600 to nearly $43,000. The largest share of metro areas on this list are in the West, including 14 in California alone. Higher housing costs in these places are often a reflection of what residents can afford. Most metro areas on this list have a higher median family income than the national average of $80,069. Here is a look at the income needed to be middle class in each state.
Home values also tend to be higher in areas with high housing costs, making homeownership prohibitively expensive for larger shares of the population. This may help explain why homeownership rates are lower than the 64.4% national rate in most of the metro areas on this list. Here is a look at the mortgage rate in America every year since 1972.
Click here to see the metros where families pay the most for housing
Click here to read our detailed methodology
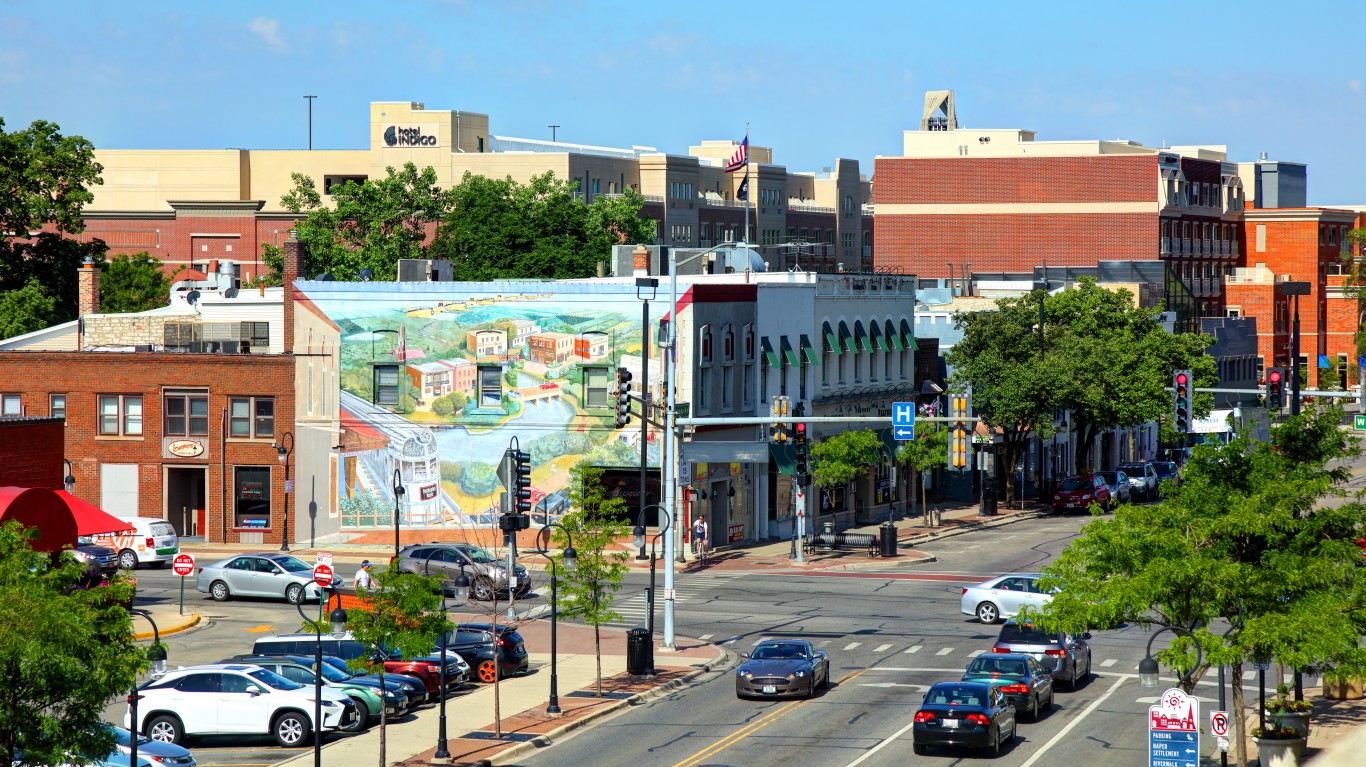
50. Chicago-Naperville-Elgin, IL-IN-WI
> Est. annual housing costs: $15,588
> Median family income: $92,668 — 45th highest of 376 metros
> Homeownership rate: 64.8% — 134th lowest of 376 metros
> Median home value: $247,400 — 92nd highest of 376 metros
[in-text-ad]
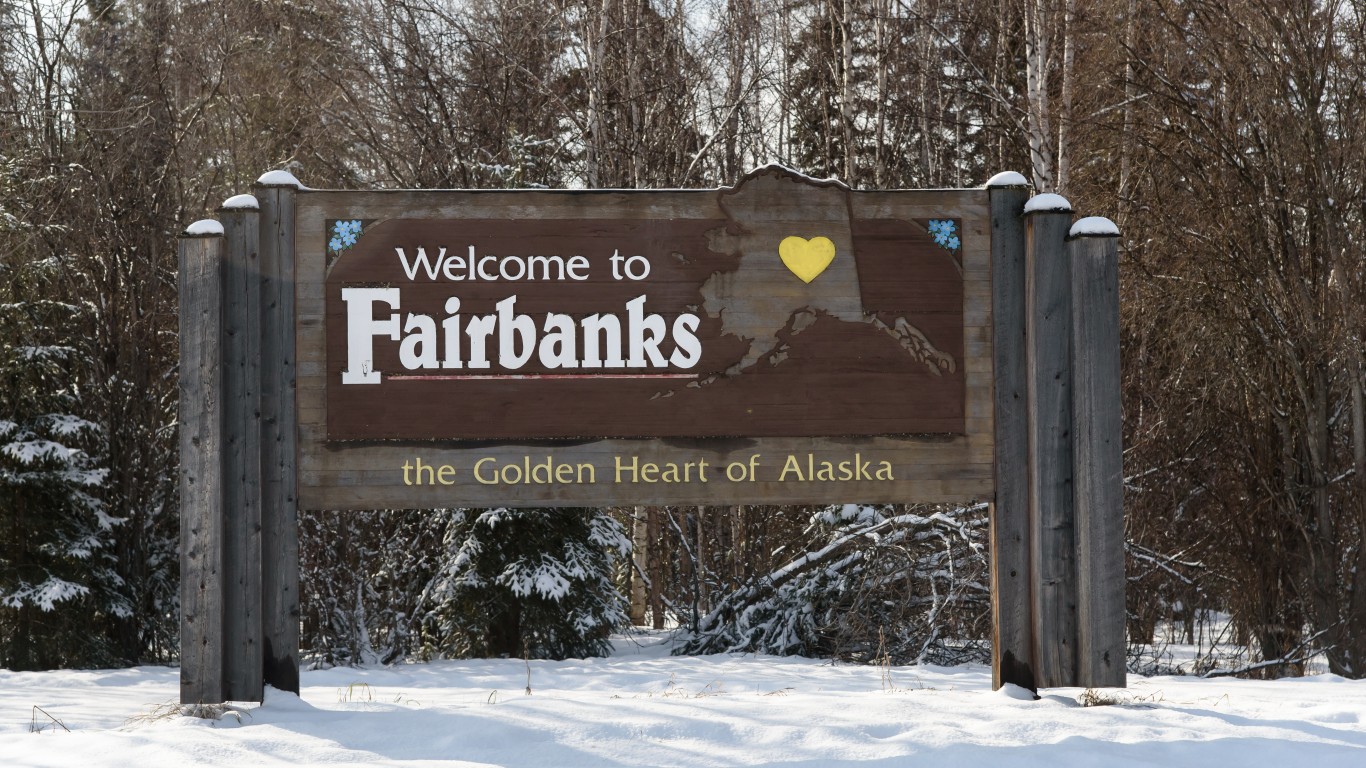
49. Fairbanks, AK
> Est. annual housing costs: $15,612
> Median family income: $89,208 — 61st highest of 376 metros
> Homeownership rate: 58.9% — 45th lowest of 376 metros
> Median home value: $240,300 — 105th highest of 376 metros
[recirclink id=1052847]
48. Minneapolis-St. Paul-Bloomington, MN-WI
> Est. annual housing costs: $15,696
> Median family income: $103,977 — 14th highest of 376 metros
> Homeownership rate: 70.4% — 78th highest of 376 metros
> Median home value: $271,600 — 72nd highest of 376 metros

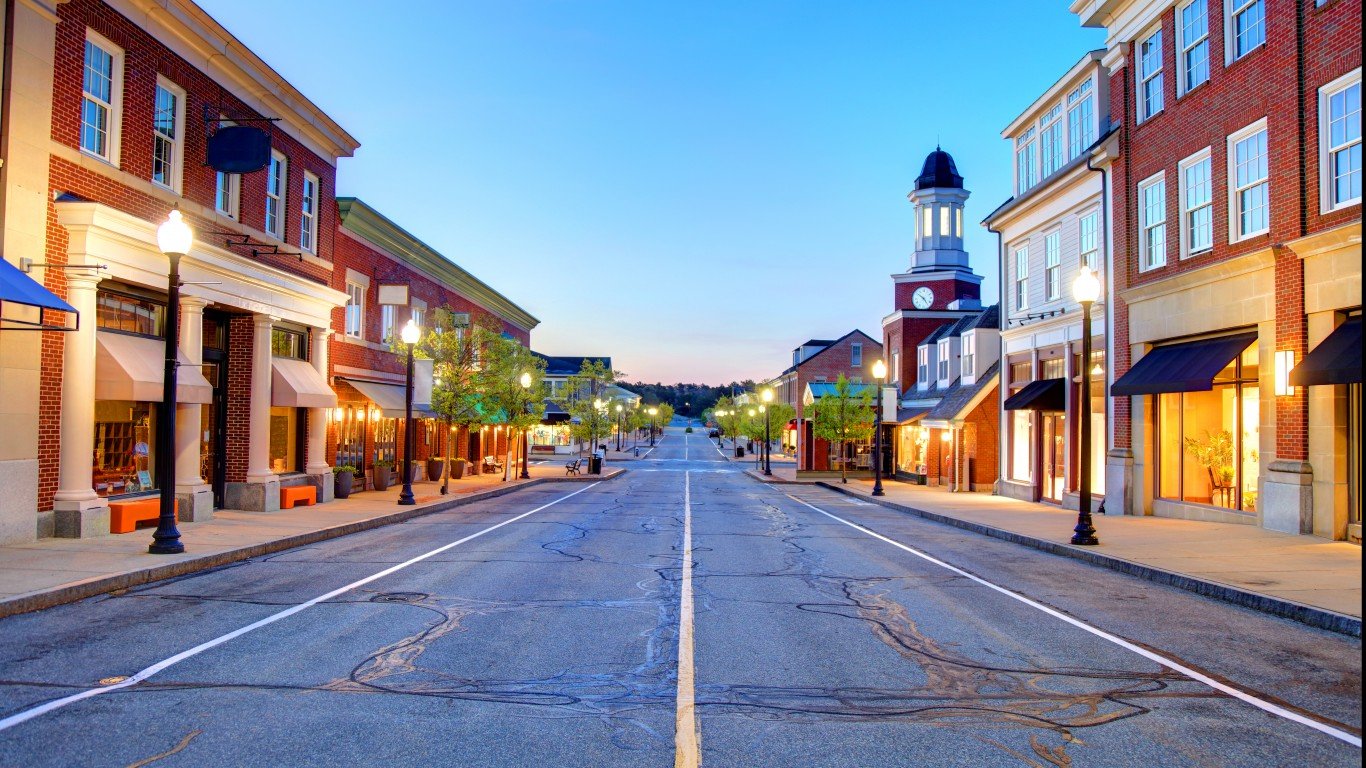
47. Manchester-Nashua, NH
> Est. annual housing costs: $15,768
> Median family income: $103,238 — 16th highest of 376 metros
> Homeownership rate: 65.7% — 159th lowest of 376 metros
> Median home value: $287,900 — 60th highest of 376 metros
[in-text-ad-2]
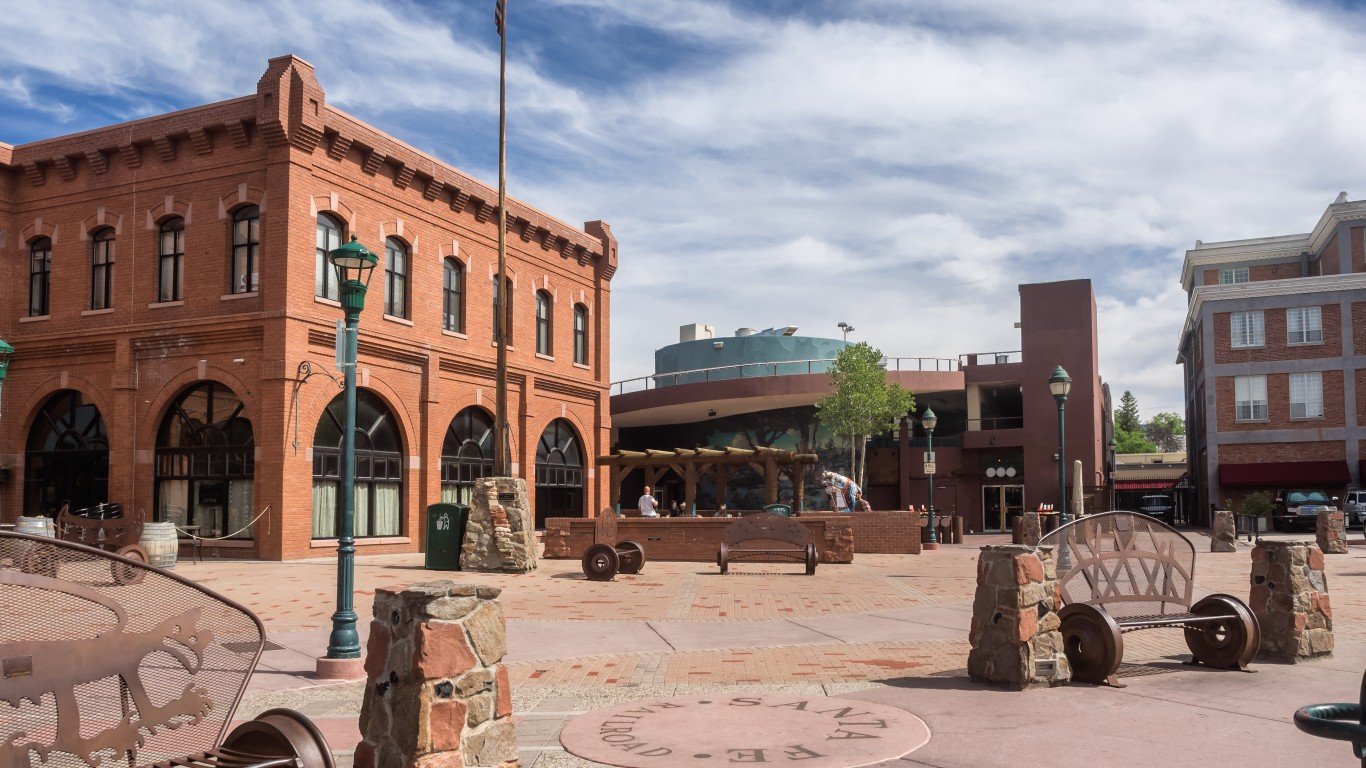
46. Flagstaff, AZ
> Est. annual housing costs: $15,780
> Median family income: $74,357 — 177th highest of 376 metros
> Homeownership rate: 60.8% — 68th lowest of 376 metros
> Median home value: $299,100 — 52nd highest of 376 metros

45. Orlando-Kissimmee-Sanford, FL
> Est. annual housing costs: $15,852
> Median family income: $70,774 — 149th lowest of 376 metros
> Homeownership rate: 61.9% — 78th lowest of 376 metros
> Median home value: $242,100 — 103rd highest of 376 metros
[in-text-ad]
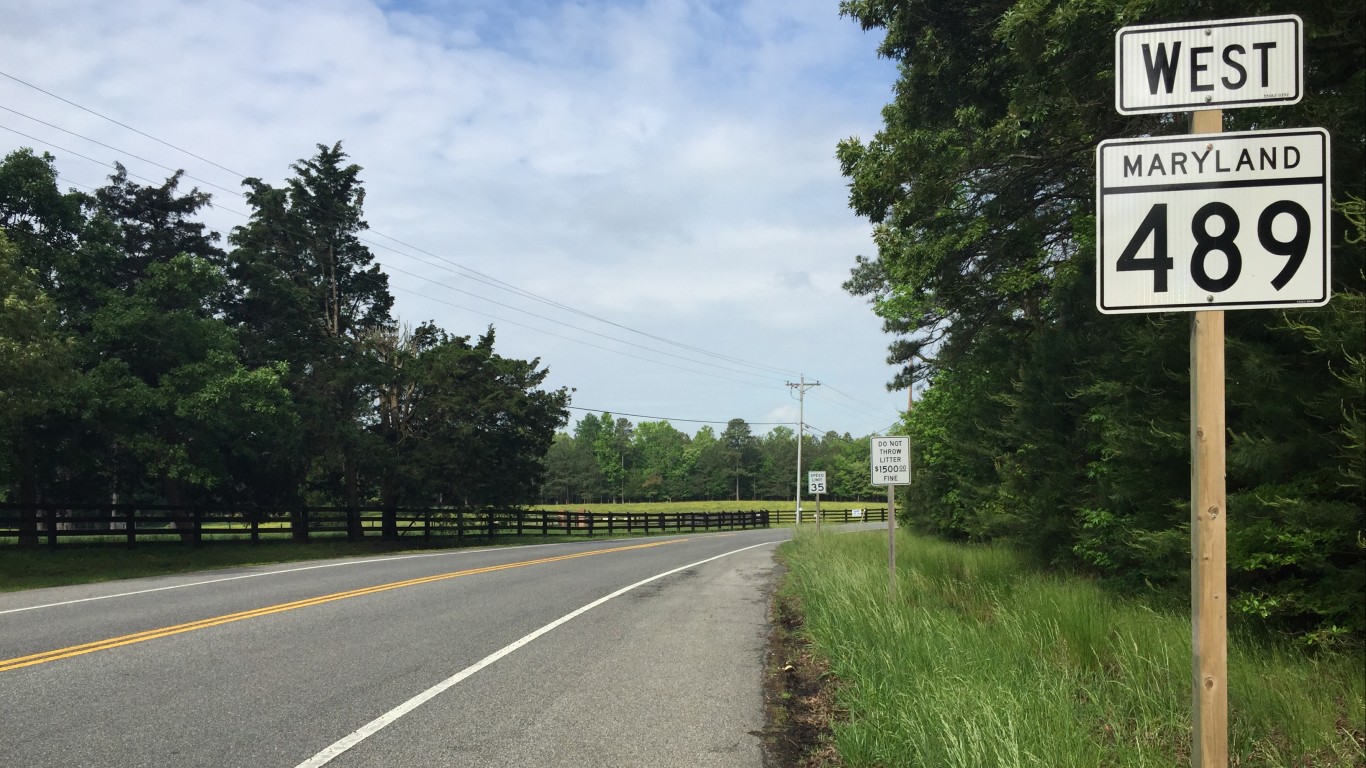
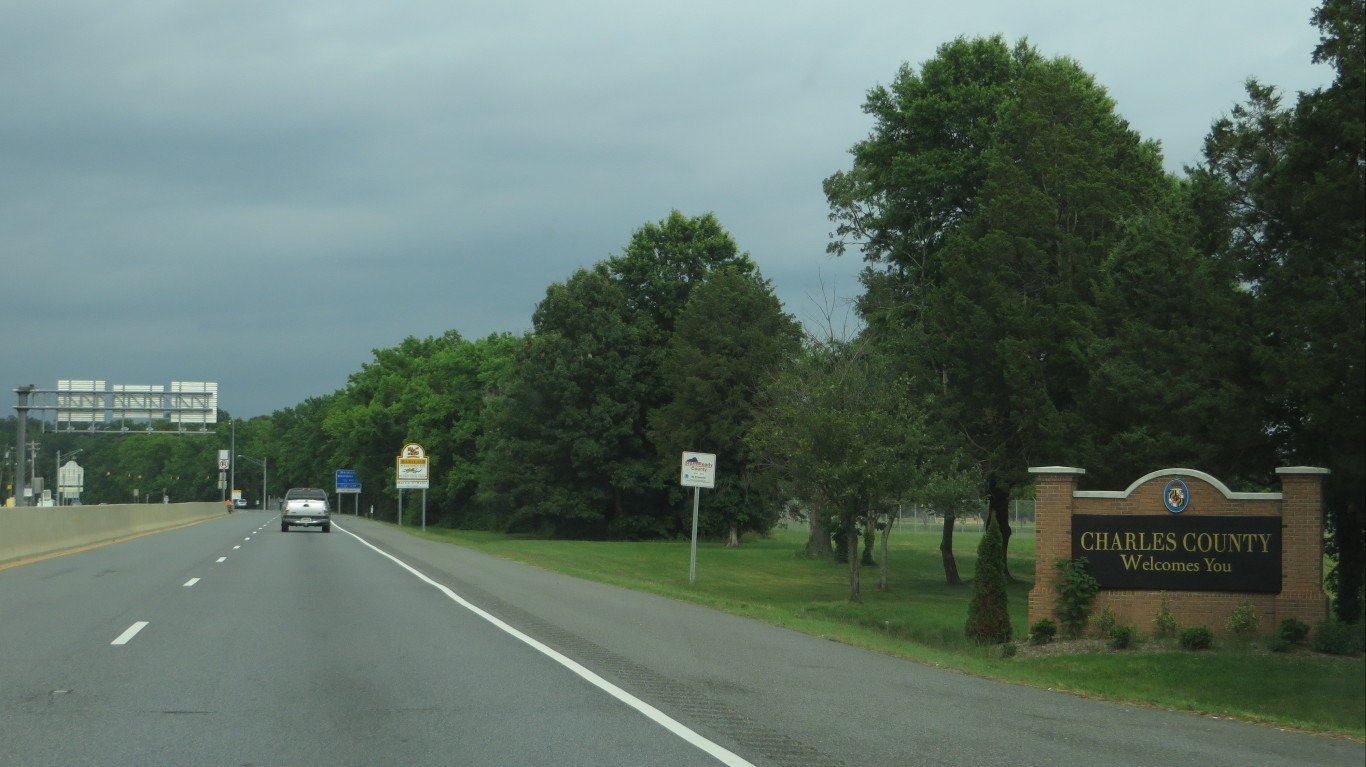
44. California-Lexington Park, MD
> Est. annual housing costs: $16,116
> Median family income: $110,946 — 7th highest of 376 metros
> Homeownership rate: 70.3% — 85th highest of 376 metros
> Median home value: $318,500 — 38th highest of 376 metros
[recirclink id=1065785]

43. Hartford-East Hartford-Middletown, CT
> Est. annual housing costs: $16,164
> Median family income: $101,543 — 19th highest of 376 metros
> Homeownership rate: 66.4% — 180th lowest of 376 metros
> Median home value: $252,500 — 88th highest of 376 metros
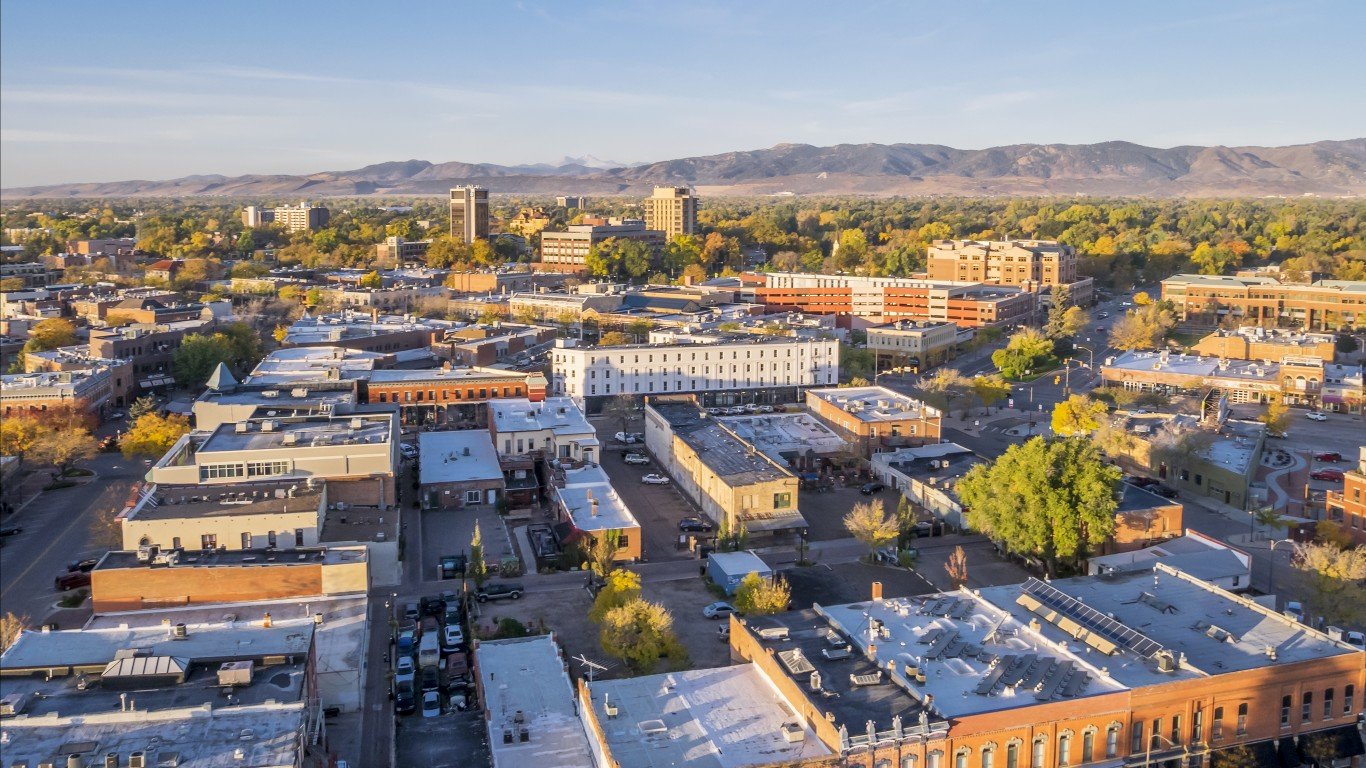
42. Fort Collins, CO
> Est. annual housing costs: $16,212
> Median family income: $96,221 — 31st highest of 376 metros
> Homeownership rate: 66.3% — 179th lowest of 376 metros
> Median home value: $390,600 — 25th highest of 376 metros
[in-text-ad-2]
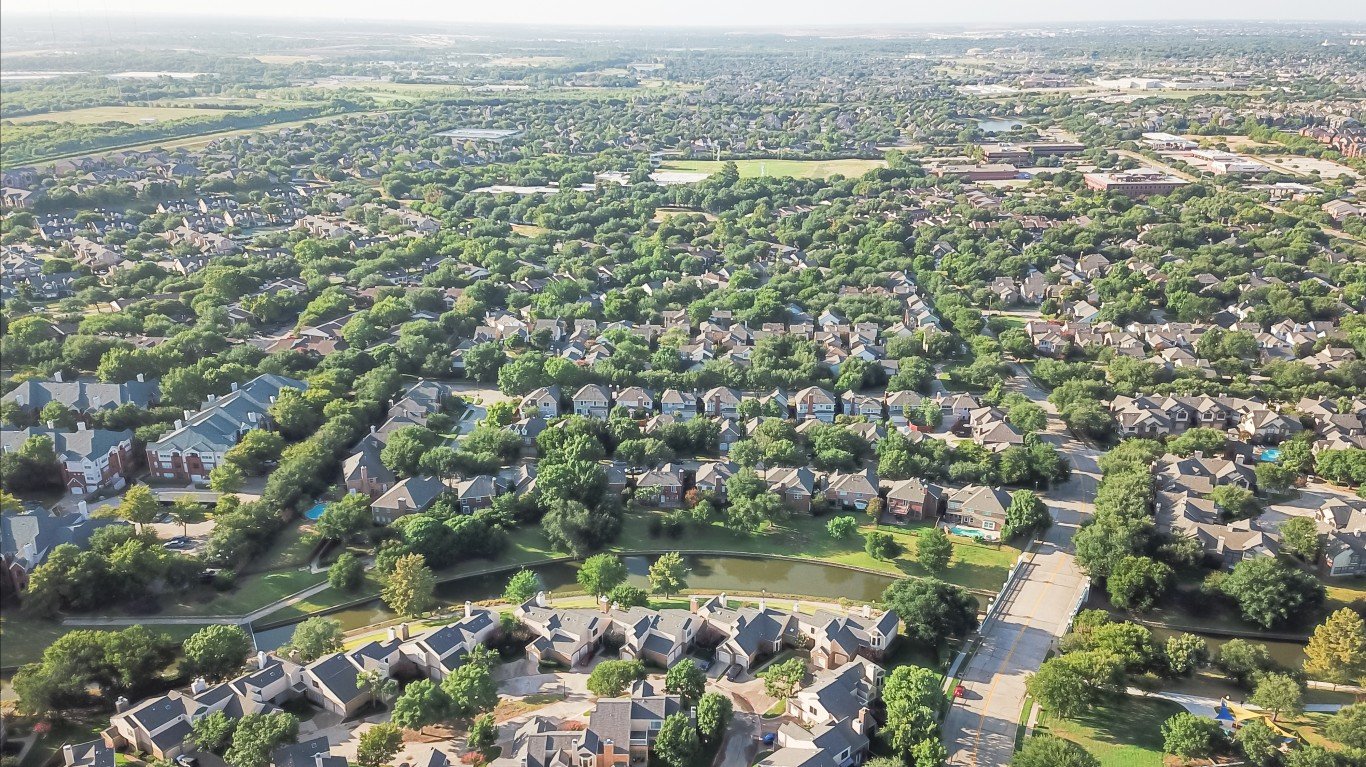
41. Dallas-Fort Worth-Arlington, TX
> Est. annual housing costs: $16,224
> Median family income: $86,296 — 70th highest of 376 metros
> Homeownership rate: 59.7% — 52nd lowest of 376 metros
> Median home value: $236,200 — 110th highest of 376 metros (tied)
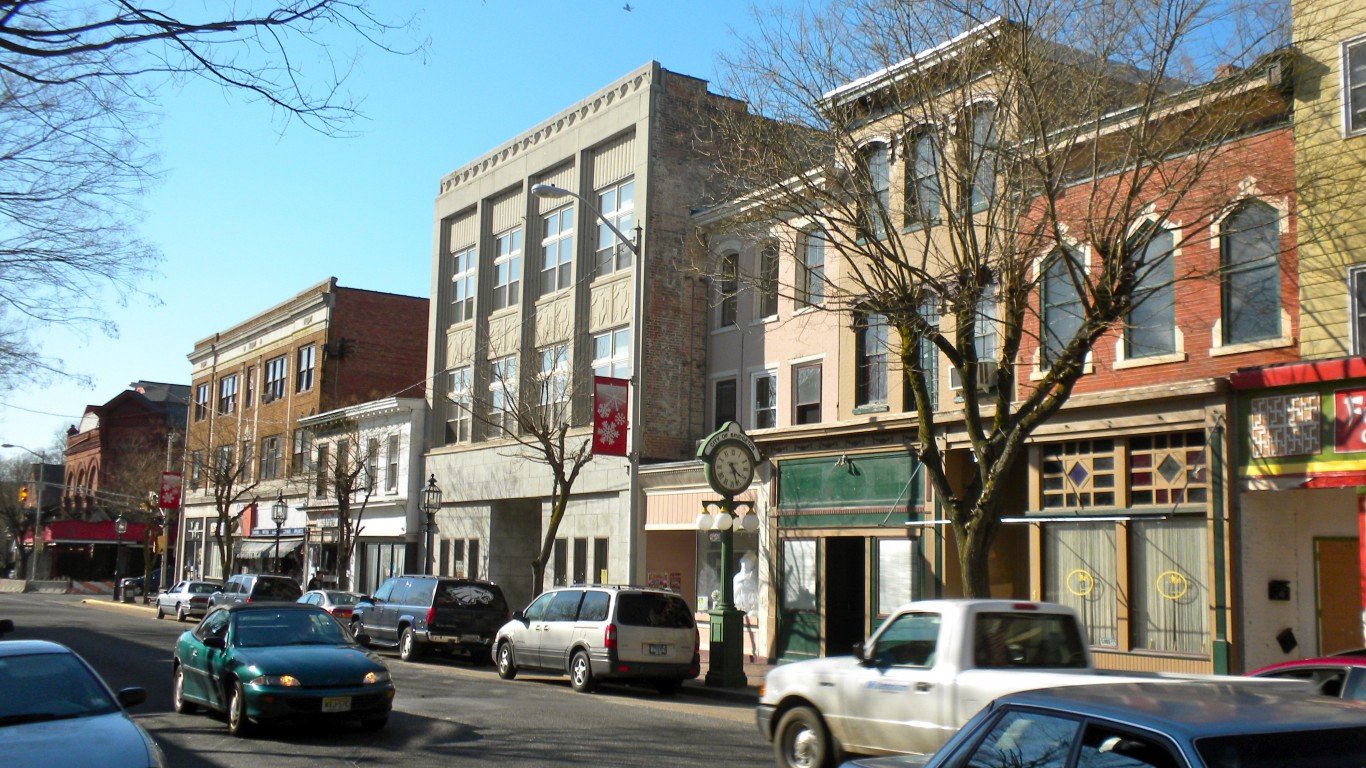
40. Vineland-Bridgeton, NJ
> Est. annual housing costs: $16,236
> Median family income: $67,467 — 106th lowest of 376 metros
> Homeownership rate: 66.3% — 178th lowest of 376 metros
> Median home value: $166,400 — 159th lowest of 376 metros (tied)
[in-text-ad]
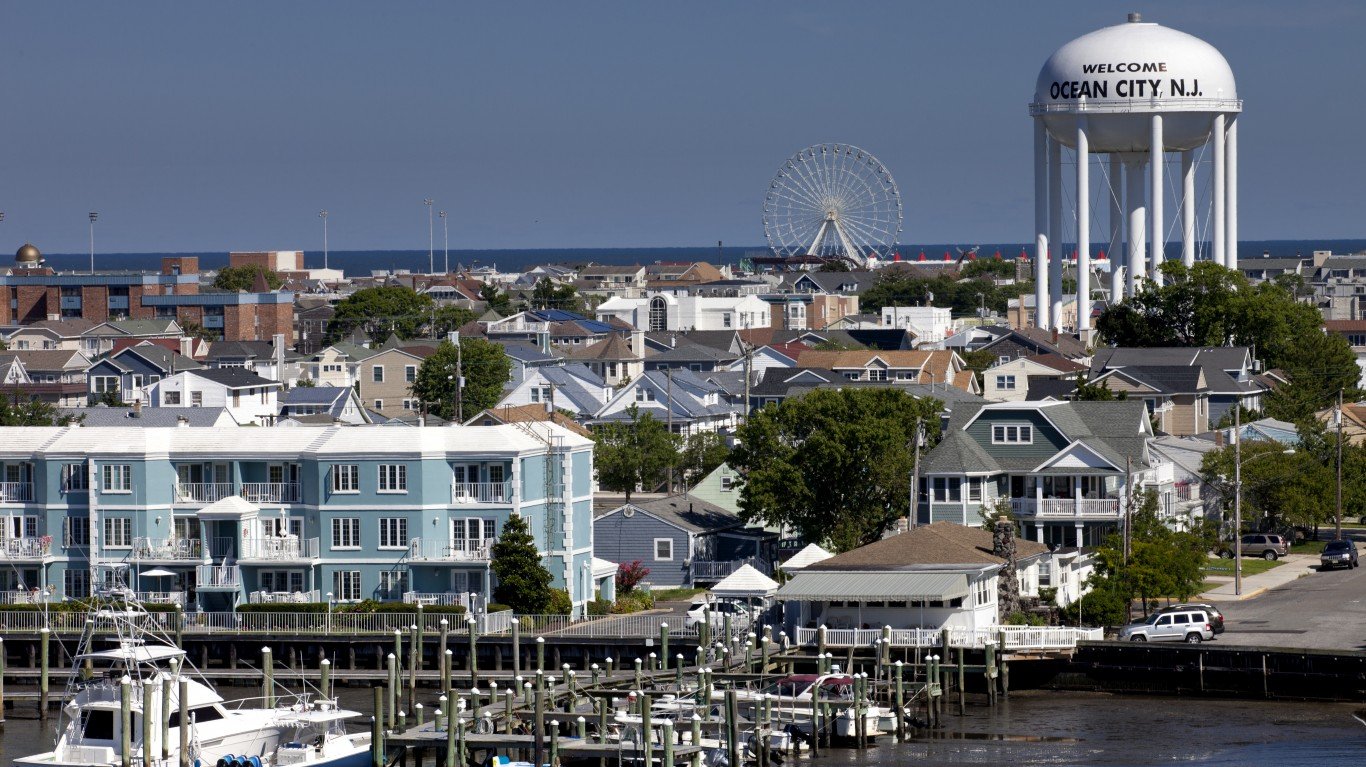
39. Ocean City, NJ
> Est. annual housing costs: $16,332
> Median family income: $87,716 — 65th highest of 376 metros
> Homeownership rate: 78.0% — 7th highest of 376 metros
> Median home value: $306,200 — 43rd highest of 376 metros
[recirclink id=1069876]
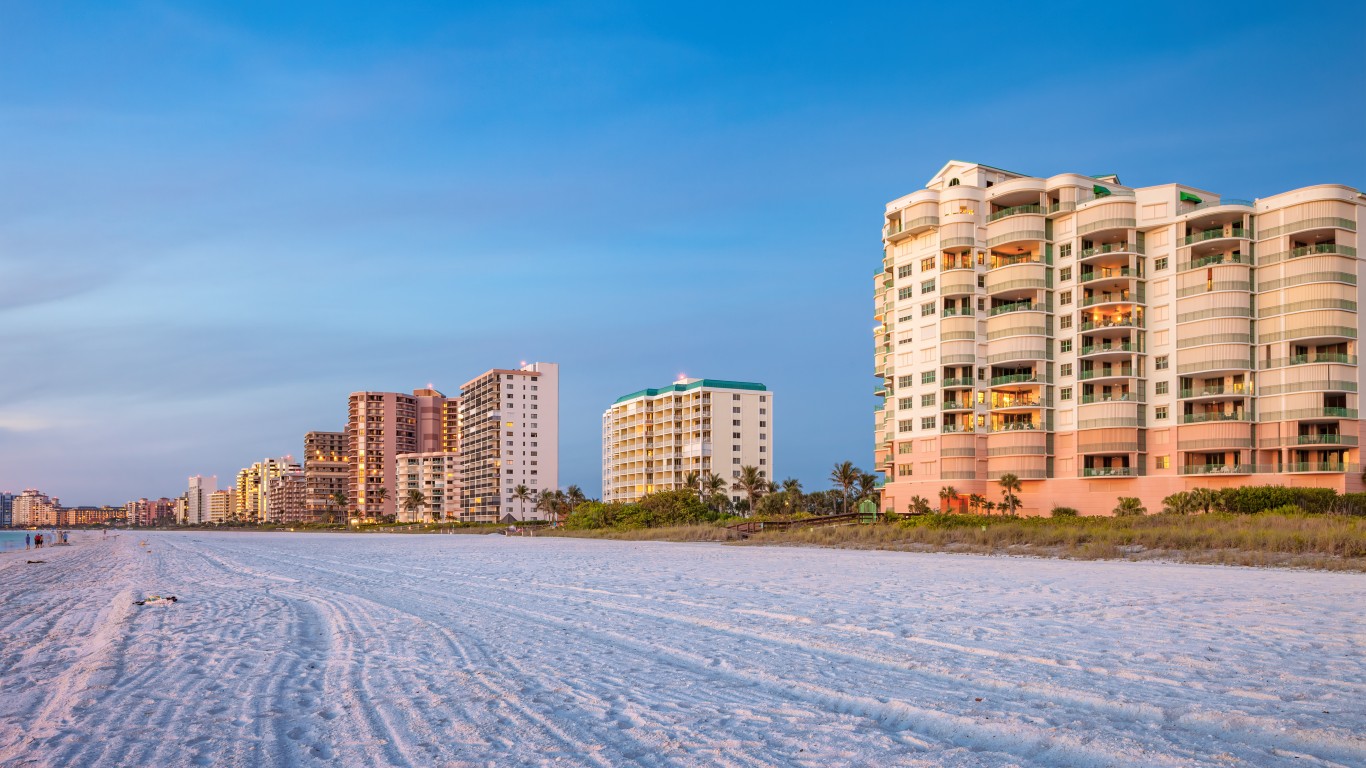
38. Naples-Marco Island, FL
> Est. annual housing costs: $16,512
> Median family income: $84,784 — 78th highest of 376 metros
> Homeownership rate: 74.4% — 27th highest of 376 metros
> Median home value: $366,600 — 29th highest of 376 metros

37. Baltimore-Columbia-Towson, MD
> Est. annual housing costs: $16,608
> Median family income: $104,637 — 13th highest of 376 metros
> Homeownership rate: 66.6% — 185th lowest of 376 metros
> Median home value: $307,200 — 41st highest of 376 metros
[in-text-ad-2]
36. Riverside-San Bernardino-Ontario, CA
> Est. annual housing costs: $16,680
> Median family income: $76,686 — 157th highest of 376 metros
> Homeownership rate: 64.1% — 120th lowest of 376 metros
> Median home value: $360,100 — 31st highest of 376 metros

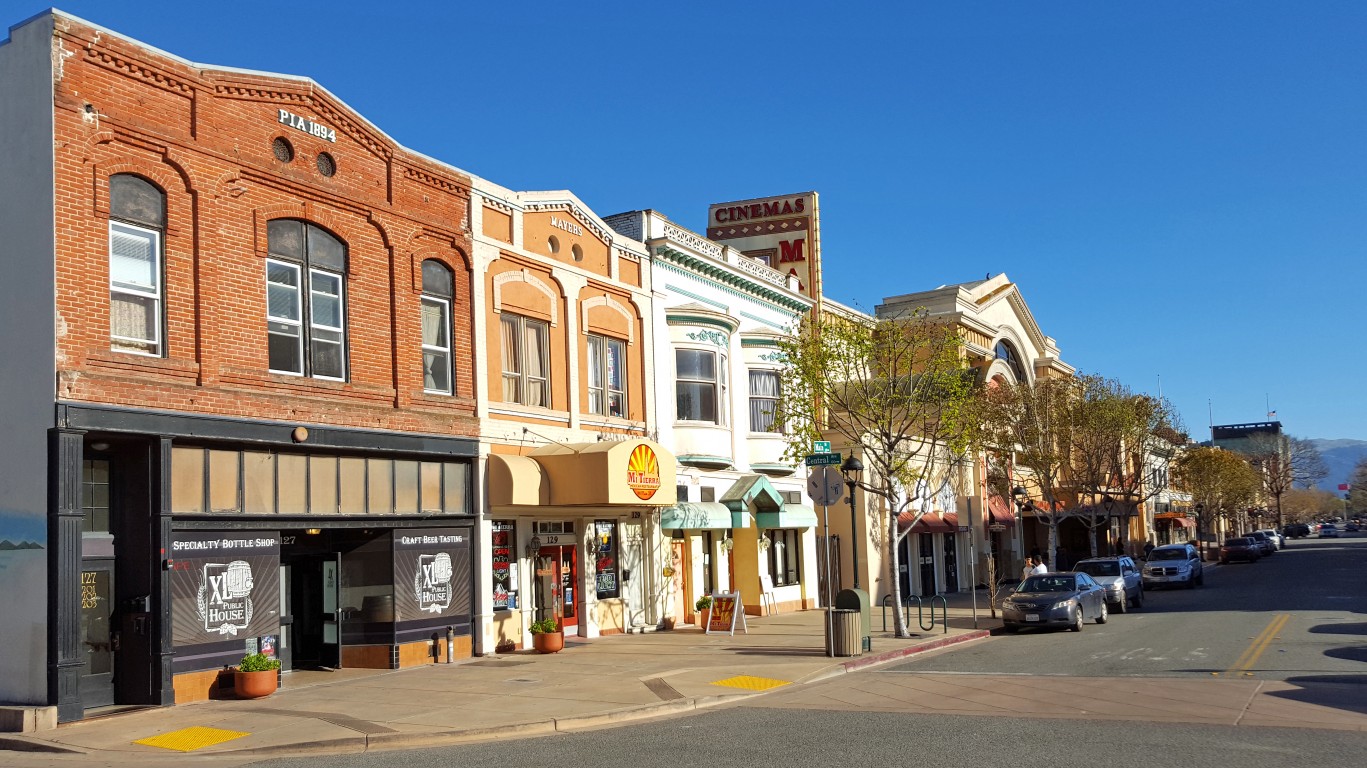
35. Midland, TX
> Est. annual housing costs: $16,692
> Median family income: $97,494 — 27th highest of 376 metros
> Homeownership rate: 66.8% — 188th highest of 376 metros
> Median home value: $231,100 — 115th highest of 376 metros
[in-text-ad]
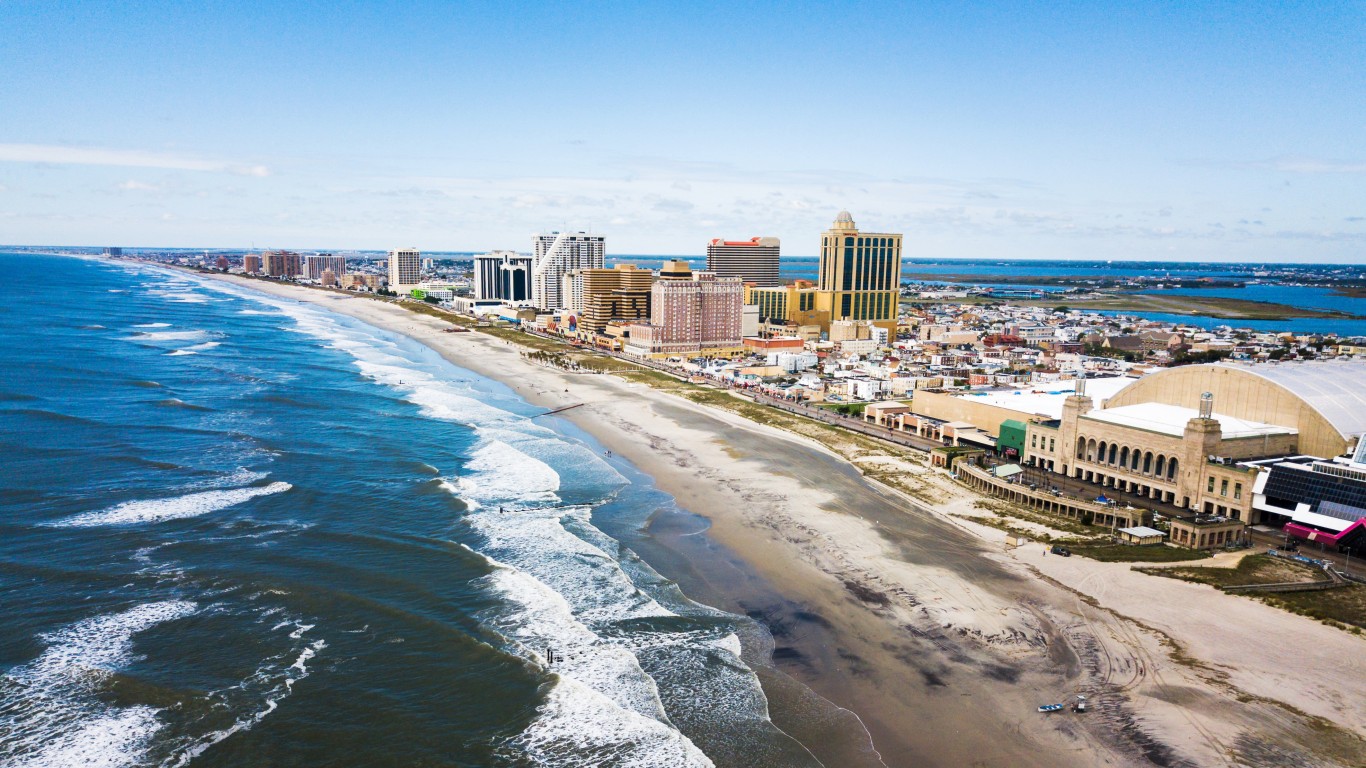
34. Atlantic City-Hammonton, NJ
> Est. annual housing costs: $16,812
> Median family income: $78,974 — 132nd highest of 376 metros
> Homeownership rate: 66.9% — 184th highest of 376 metros
> Median home value: $216,600 — 135th highest of 376 metros
[recirclink id=1076225]

33. Austin-Round Rock-Georgetown, TX
> Est. annual housing costs: $17,208
> Median family income: $100,215 — 21st highest of 376 metros
> Homeownership rate: 58.6% — 42nd lowest of 376 metros
> Median home value: $303,300 — 46th highest of 376 metros

32. New Haven-Milford, CT
> Est. annual housing costs: $17,256
> Median family income: $92,508 — 47th highest of 376 metros
> Homeownership rate: 62.1% — 81st lowest of 376 metros
> Median home value: $252,300 — 89th highest of 376 metros
[in-text-ad-2]

31. Bridgeport-Stamford-Norwalk, CT
> Est. annual housing costs: $17,352
> Median family income: $120,156 — 4th highest of 376 metros
> Homeownership rate: 66.7% — 187th lowest of 376 metros
> Median home value: $433,000 — 20th highest of 376 metros

30. Worcester, MA-CT
> Est. annual housing costs: $17,400
> Median family income: $96,860 — 30th highest of 376 metros
> Homeownership rate: 66.0% — 168th lowest of 376 metros
> Median home value: $283,600 — 65th highest of 376 metros
[in-text-ad]
29. Poughkeepsie-Newburgh-Middletown, NY
> Est. annual housing costs: $17,604
> Median family income: $100,123 — 22nd highest of 376 metros
> Homeownership rate: 68.0% — 148th highest of 376 metros
> Median home value: $284,300 — 64th highest of 376 metros
[recirclink id=1076750]
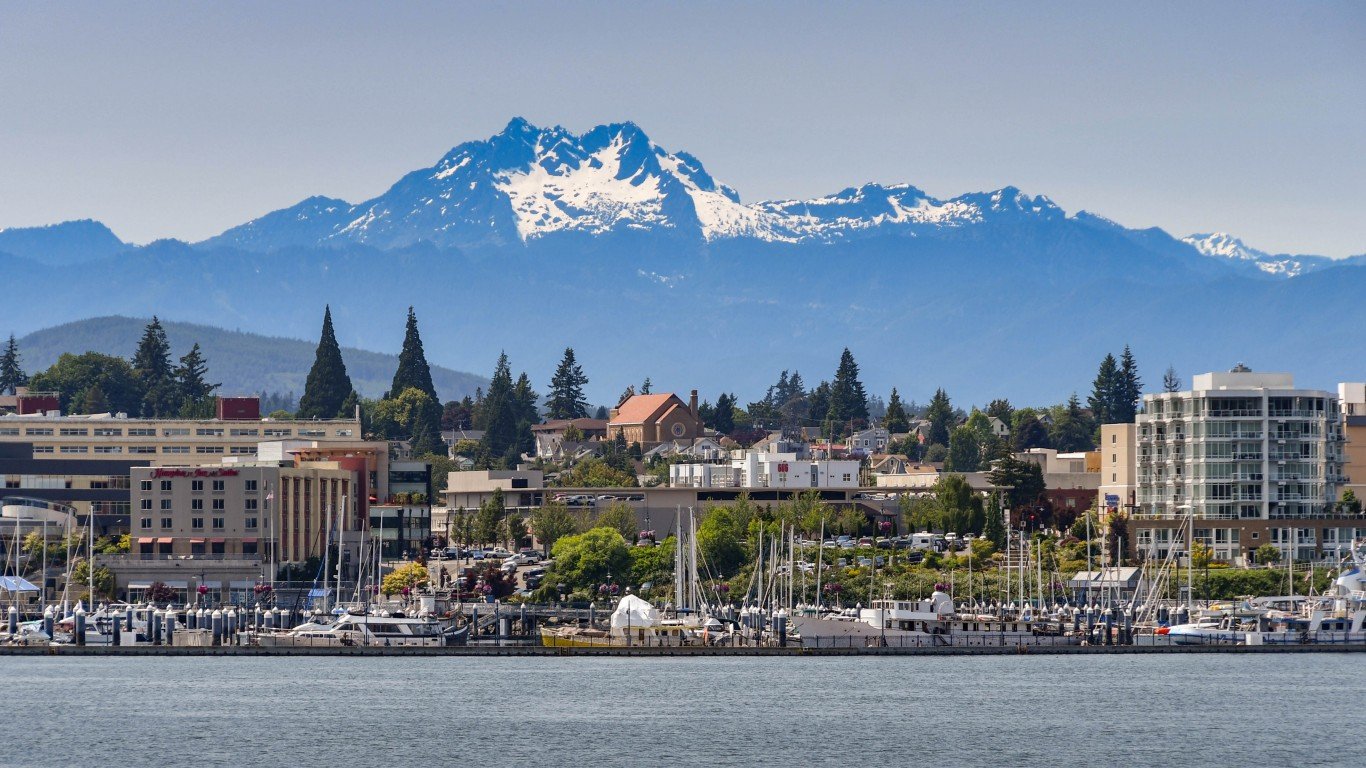
28. Bremerton-Silverdale-Port Orchard, WA
> Est. annual housing costs: $17,748
> Median family income: $93,126 — 44th highest of 376 metros
> Homeownership rate: 68.1% — 144th highest of 376 metros
> Median home value: $362,700 — 30th highest of 376 metros

27. Sacramento-Roseville-Folsom, CA
> Est. annual housing costs: $17,940
> Median family income: $90,500 — 50th highest of 376 metros
> Homeownership rate: 61.2% — 70th lowest of 376 metros
> Median home value: $412,400 — 22nd highest of 376 metros
[in-text-ad-2]
26. Portland-Vancouver-Hillsboro, OR-WA
> Est. annual housing costs: $18,432
> Median family income: $94,727 — 39th highest of 376 metros
> Homeownership rate: 62.3% — 83rd lowest of 376 metros
> Median home value: $392,000 — 24th highest of 376 metros

25. Trenton-Princeton, NJ
> Est. annual housing costs: $18,468
> Median family income: $108,756 — 10th highest of 376 metros
> Homeownership rate: 63.5% — 107th lowest of 376 metros
> Median home value: $290,100 — 58th highest of 376 metros
[in-text-ad]

24. Miami-Fort Lauderdale-Pompano Beach, FL
> Est. annual housing costs: $18,612
> Median family income: $69,172 — 129th lowest of 376 metros
> Homeownership rate: 59.8% — 57th lowest of 376 metros
> Median home value: $298,400 — 53rd highest of 376 metros
[recirclink id=1052847]

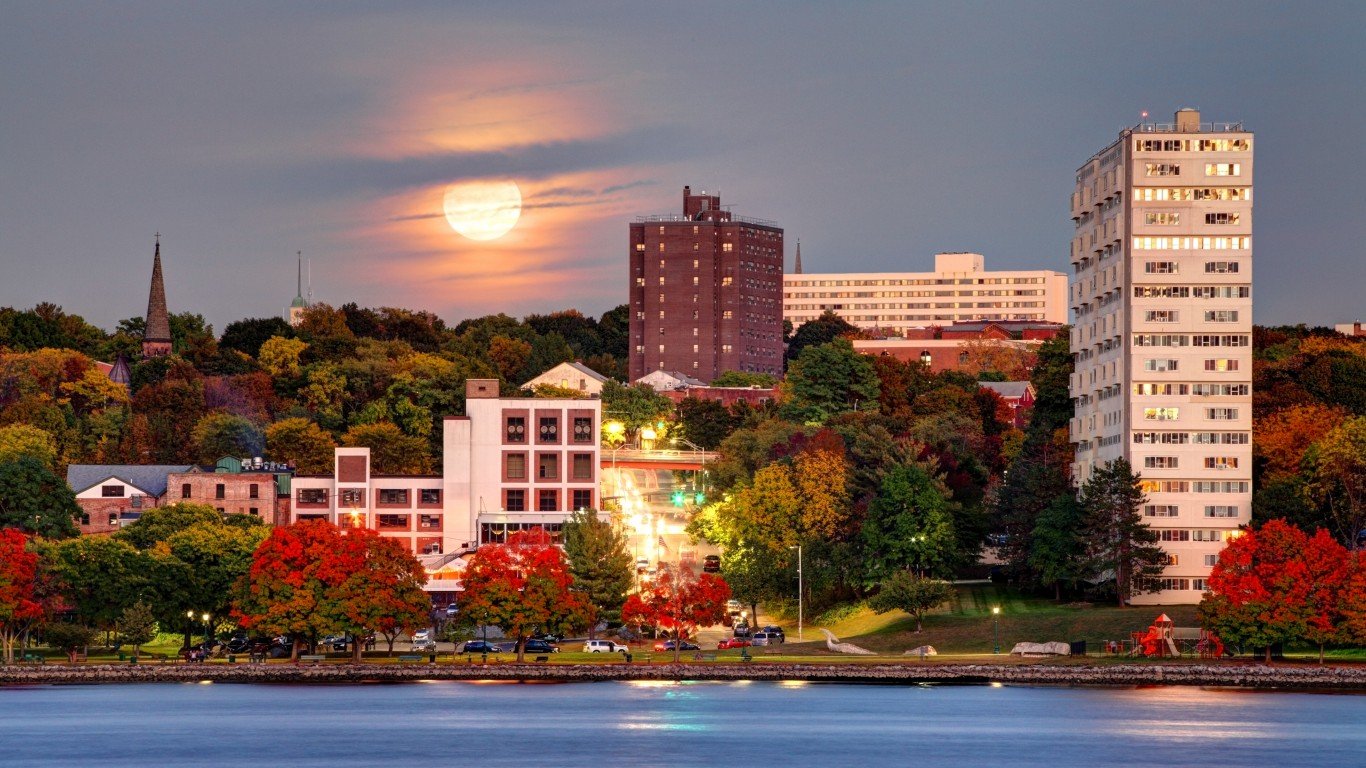
23. Portland-South Portland, ME
> Est. annual housing costs: $19,104
> Median family income: $89,988 — 56th highest of 376 metros
> Homeownership rate: 72.1% — 50th highest of 376 metros
> Median home value: $273,100 — 71st highest of 376 metros
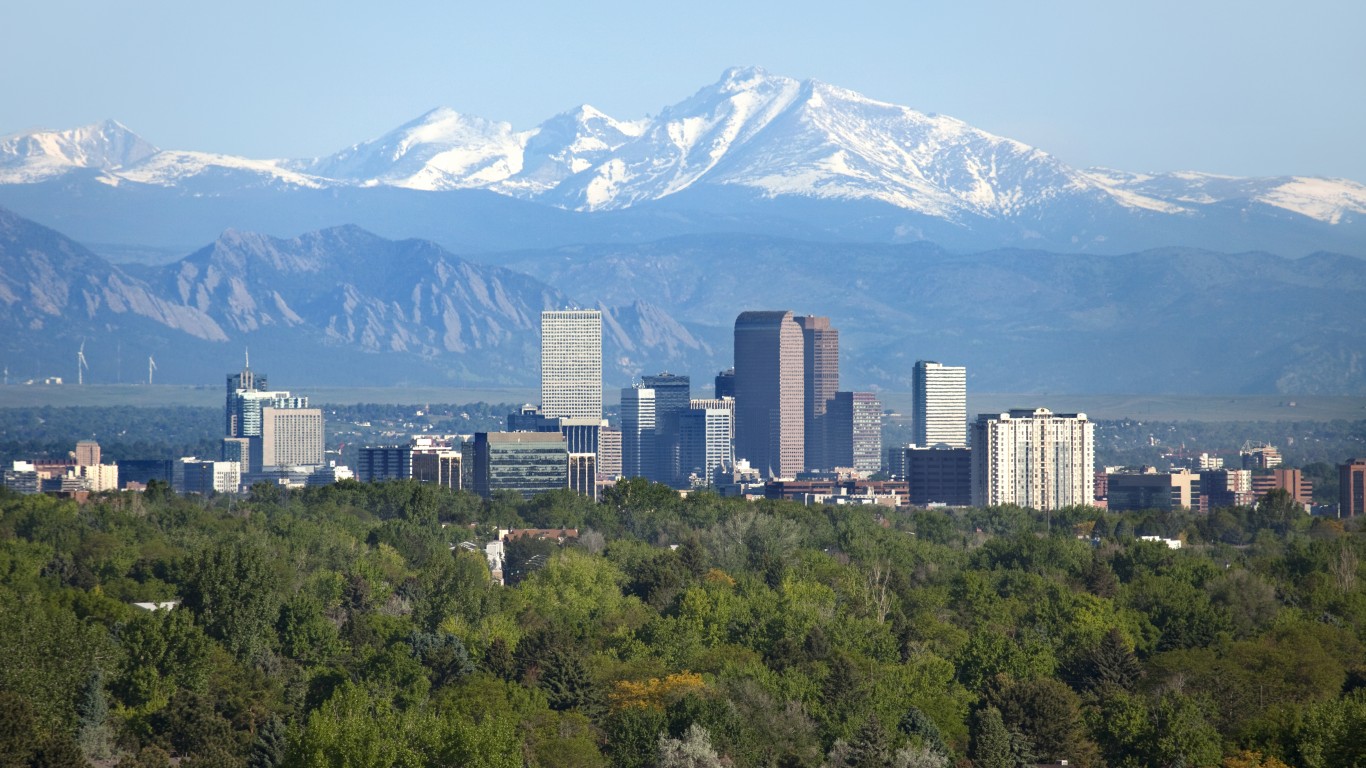
22. Denver-Aurora-Lakewood, CO
> Est. annual housing costs: $19,260
> Median family income: $103,157 — 17th highest of 376 metros
> Homeownership rate: 64.8% — 133rd lowest of 376 metros
> Median home value: $411,800 — 23rd highest of 376 metros
[in-text-ad-2]
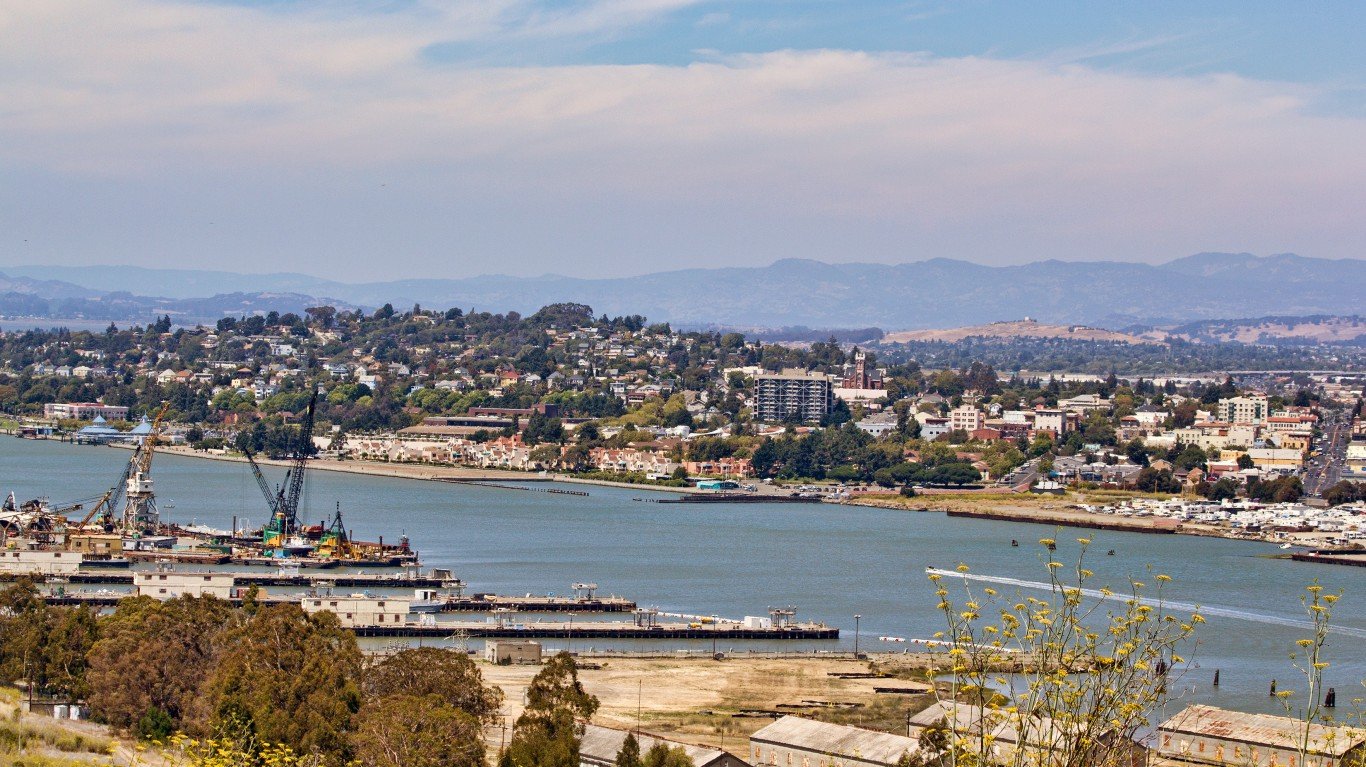
21. Vallejo, CA
> Est. annual housing costs: $19,404
> Median family income: $95,438 — 34th highest of 376 metros (tied)
> Homeownership rate: 62.1% — 80th lowest of 376 metros
> Median home value: $437,900 — 18th highest of 376 metros
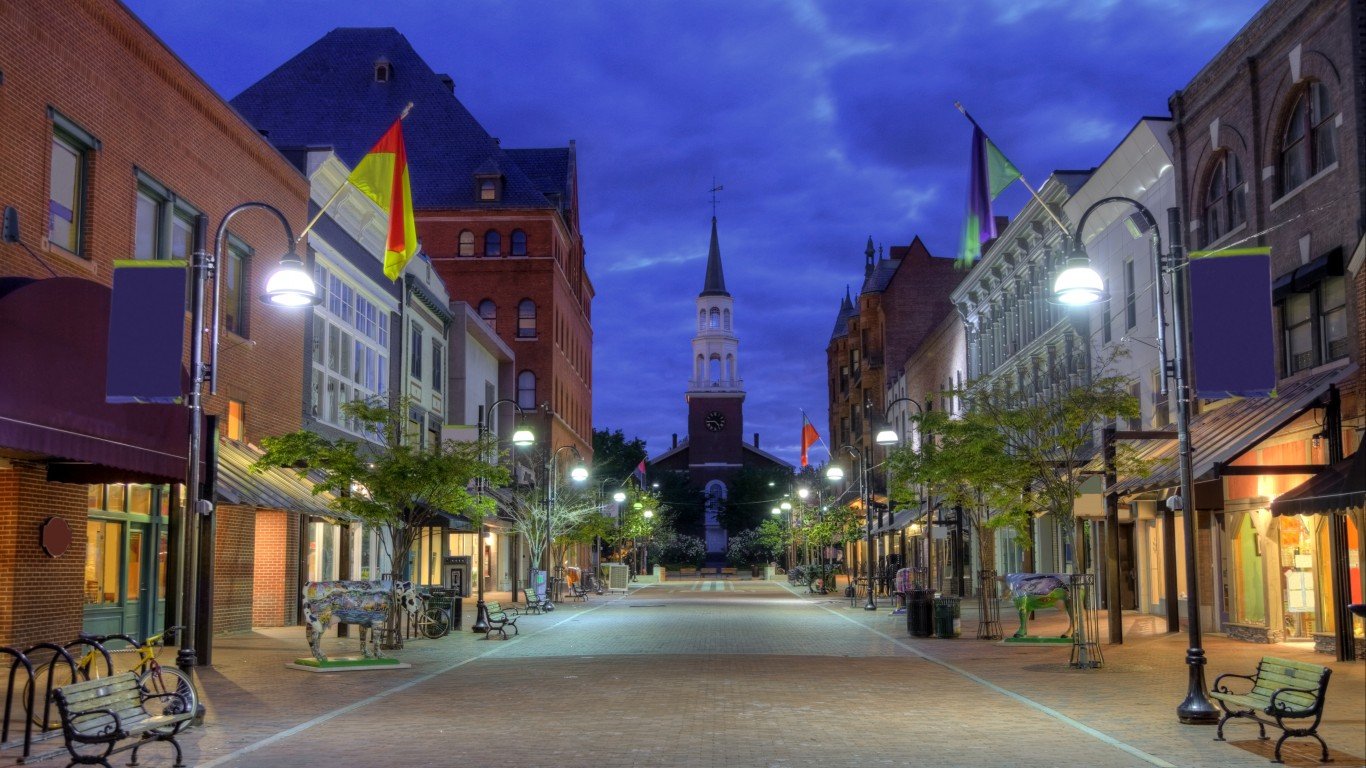
20. Burlington-South Burlington, VT
> Est. annual housing costs: $19,536
> Median family income: $95,011 — 37th highest of 376 metros
> Homeownership rate: 66.8% — 186th highest of 376 metros
> Median home value: $285,200 — 61st highest of 376 metros
[in-text-ad]
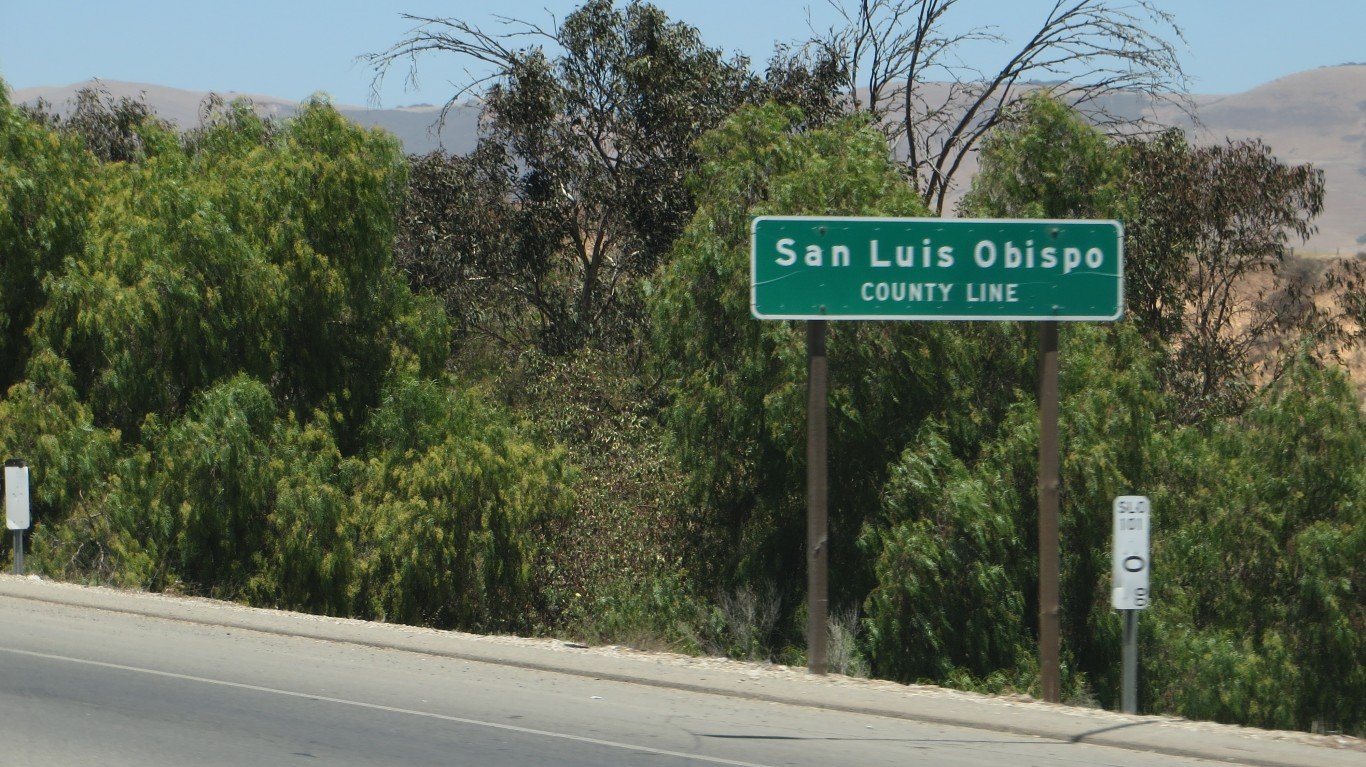
19. San Luis Obispo-Paso Robles, CA
> Est. annual housing costs: $19,980
> Median family income: $97,590 — 26th highest of 376 metros
> Homeownership rate: 62.7% — 94th lowest of 376 metros
> Median home value: $605,200 — 11th highest of 376 metros
[recirclink id=1065785]
18. Barnstable Town, MA
> Est. annual housing costs: $20,004
> Median family income: $99,410 — 23rd highest of 376 metros
> Homeownership rate: 79.6% — 6th highest of 376 metros
> Median home value: $414,000 — 21st highest of 376 metros

17. Boulder, CO
> Est. annual housing costs: $20,688
> Median family income: $118,307 — 5th highest of 376 metros
> Homeownership rate: 63.6% — 111th lowest of 376 metros
> Median home value: $539,100 — 14th highest of 376 metros
[in-text-ad-2]
16. Washington-Arlington-Alexandria, DC-VA-MD-WV
> Est. annual housing costs: $21,180
> Median family income: $126,840 — 3rd highest of 376 metros
> Homeownership rate: 63.9% — 118th lowest of 376 metros
> Median home value: $436,600 — 19th highest of 376 metros

15. Kahului-Wailuku-Lahaina, HI
> Est. annual housing costs: $21,264
> Median family income: $92,627 — 46th highest of 376 metros
> Homeownership rate: 62.5% — 91st lowest of 376 metros
> Median home value: $657,400 — 6th highest of 376 metros
[in-text-ad]
14. Salinas, CA
> Est. annual housing costs: $21,516
> Median family income: $83,052 — 95th highest of 376 metros
> Homeownership rate: 51.8% — 7th lowest of 376 metros
> Median home value: $559,400 — 13th highest of 376 metros
[recirclink id=1069876]

13. Seattle-Tacoma-Bellevue, WA
> Est. annual housing costs: $22,872
> Median family income: $109,109 — 9th highest of 376 metros
> Homeownership rate: 60.2% — 63rd lowest of 376 metros
> Median home value: $471,900 — 15th highest of 376 metros
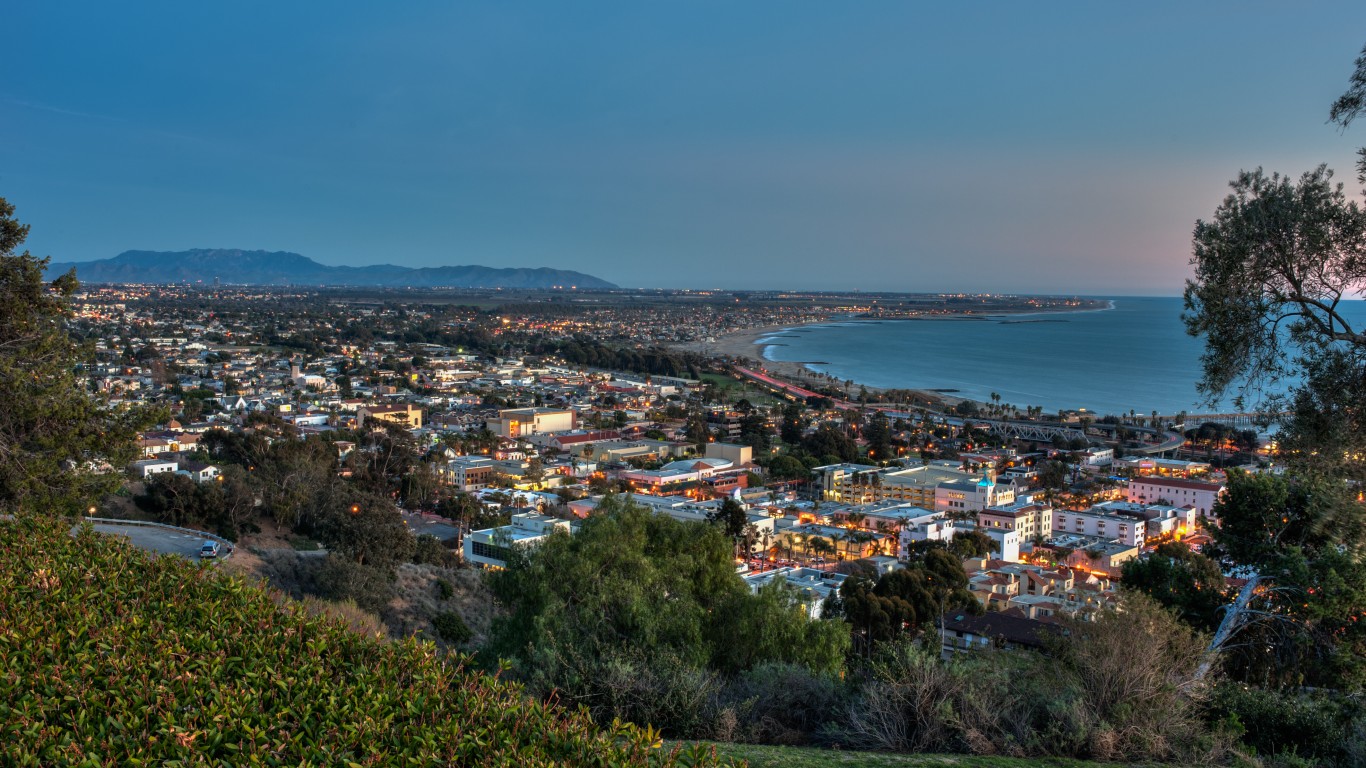
12. Oxnard-Thousand Oaks-Ventura, CA
> Est. annual housing costs: $23,076
> Median family income: $101,160 — 20th highest of 376 metros
> Homeownership rate: 63.3% — 103rd lowest of 376 metros
> Median home value: $609,200 — 10th highest of 376 metros
[in-text-ad-2]

11. Santa Rosa-Petaluma, CA
> Est. annual housing costs: $23,952
> Median family income: $102,411 — 18th highest of 376 metros
> Homeownership rate: 61.3% — 71st lowest of 376 metros
> Median home value: $640,000 — 8th highest of 376 metros

10. Napa, CA
> Est. annual housing costs: $24,216
> Median family income: $107,995 — 11th highest of 376 metros
> Homeownership rate: 64.8% — 135th lowest of 376 metros
> Median home value: $666,900 — 5th highest of 376 metros
[in-text-ad]

9. New York-Newark-Jersey City, NY-NJ-PA
> Est. annual housing costs: $24,636
> Median family income: $99,148 — 24th highest of 376 metros
> Homeownership rate: 51.6% — 6th lowest of 376 metros
> Median home value: $465,400 — 16th highest of 376 metros
[recirclink id=1076225]
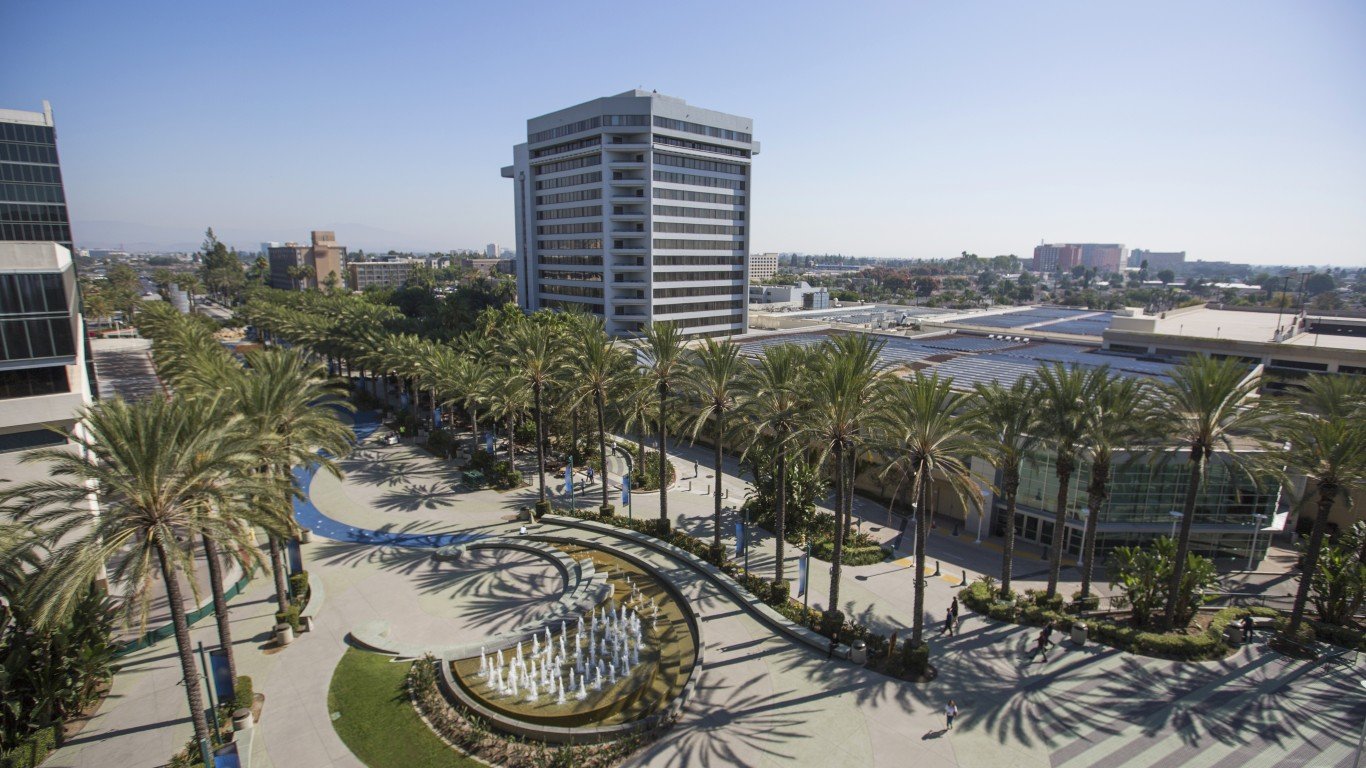
8. Los Angeles-Long Beach-Anaheim, CA
> Est. annual housing costs: $24,696
> Median family income: $86,317 — 69th highest of 376 metros
> Homeownership rate: 48.7% — the lowest of 376 metros
> Median home value: $641,300 — 7th highest of 376 metros

7. Urban Honolulu, HI
> Est. annual housing costs: $24,876
> Median family income: $103,845 — 15th highest of 376 metros
> Homeownership rate: 57.5% — 33rd lowest of 376 metros
> Median home value: $702,300 — 4th highest of 376 metros
[in-text-ad-2]
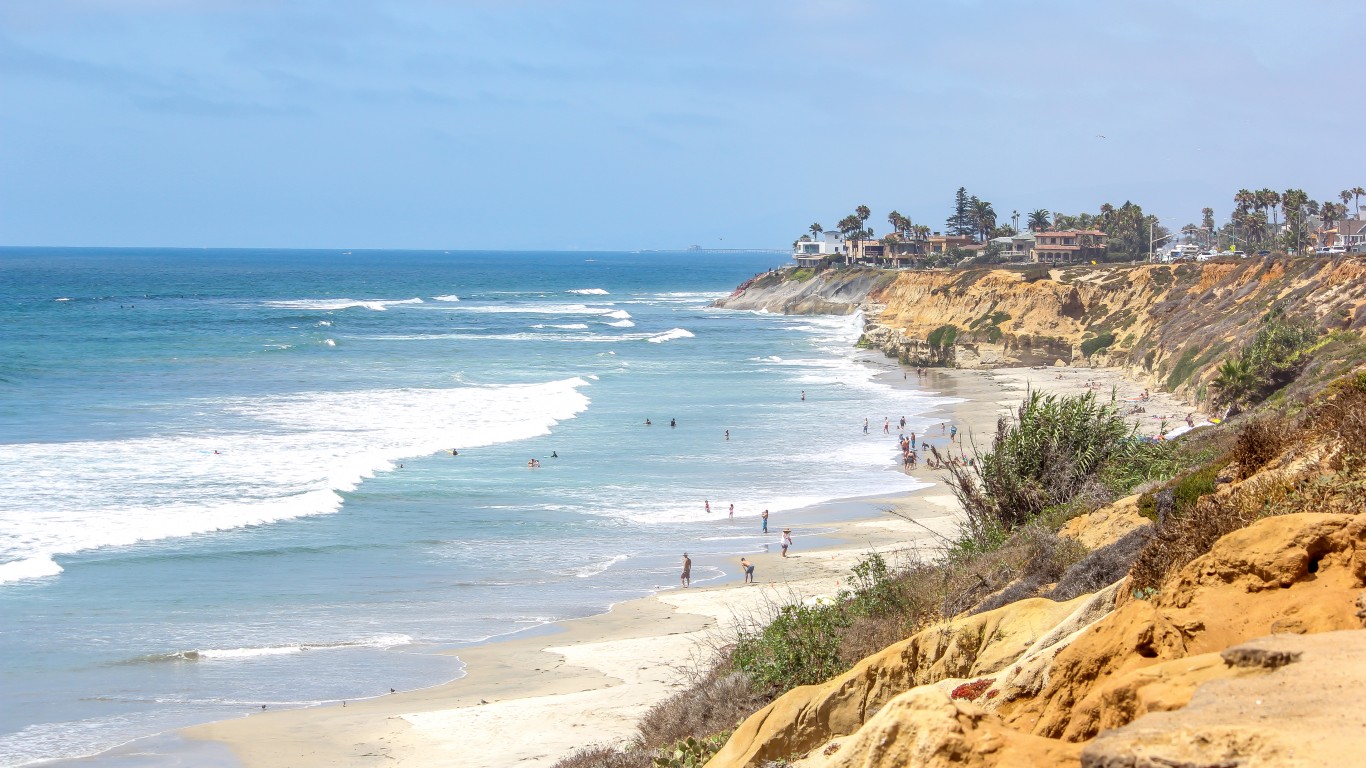
6. San Diego-Chula Vista-Carlsbad, CA
> Est. annual housing costs: $25,488
> Median family income: $95,623 — 33rd highest of 376 metros
> Homeownership rate: 53.9% — 13th lowest of 376 metros
> Median home value: $595,600 — 12th highest of 376 metros

5. Boston-Cambridge-Newton, MA-NH
> Est. annual housing costs: $28,032
> Median family income: $116,181 — 6th highest of 376 metros
> Homeownership rate: 61.7% — 75th lowest of 376 metros
> Median home value: $461,500 — 17th highest of 376 metros
[in-text-ad]
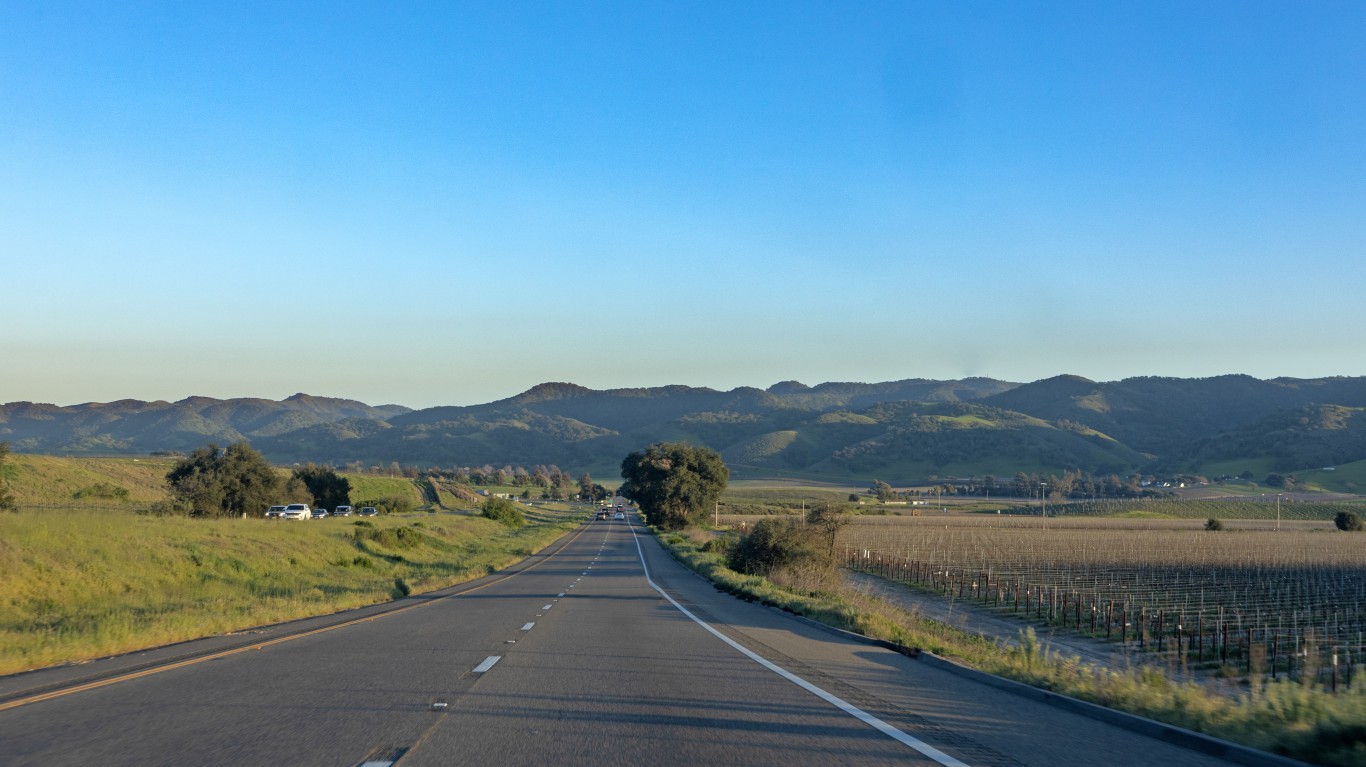
4. Santa Maria-Santa Barbara, CA
> Est. annual housing costs: $28,488
> Median family income: $89,549 — 59th highest of 376 metros
> Homeownership rate: 52.3% — 9th lowest of 376 metros
> Median home value: $610,300 — 9th highest of 376 metros
[recirclink id=1076750]

3. Santa Cruz-Watsonville, CA
> Est. annual housing costs: $36,252
> Median family income: $109,931 — 8th highest of 376 metros
> Homeownership rate: 60.3% — 66th lowest of 376 metros
> Median home value: $787,000 — 3rd highest of 376 metros
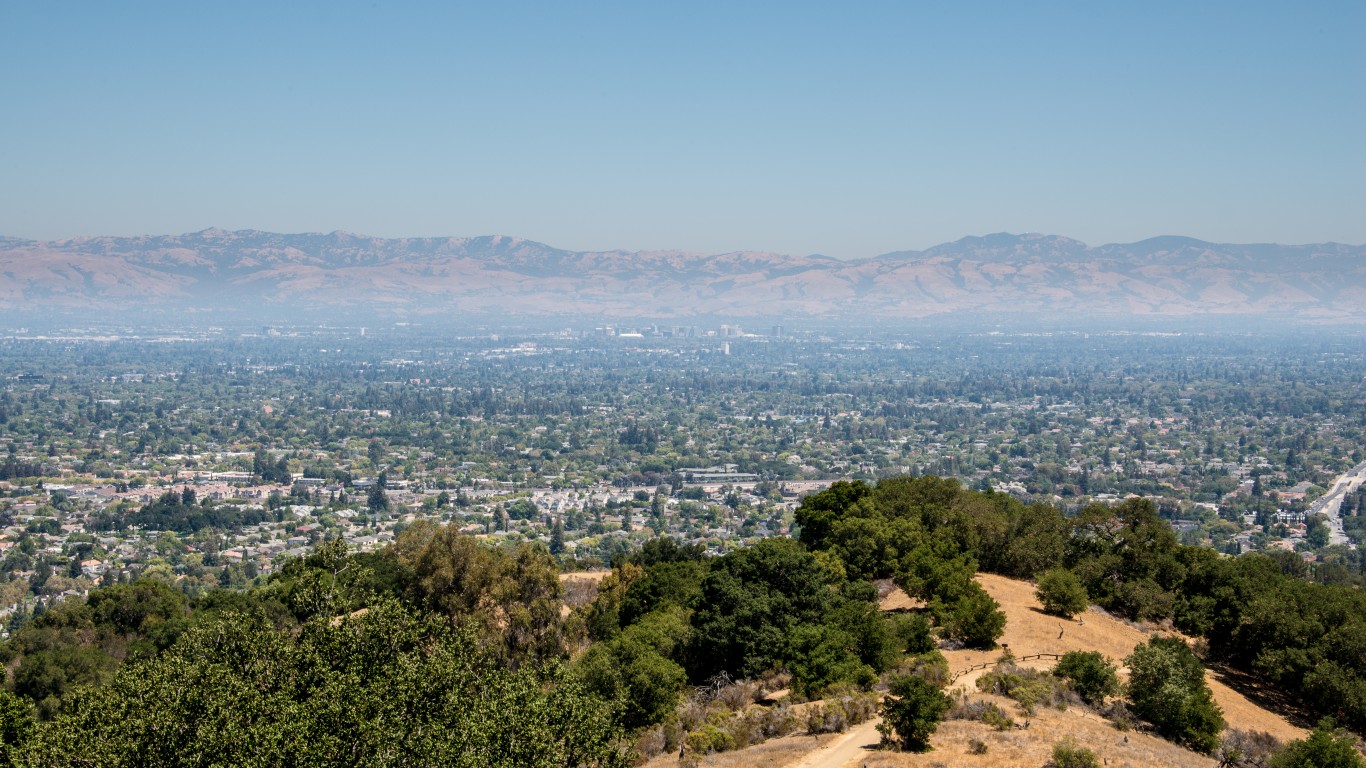
2. San Jose-Sunnyvale-Santa Clara, CA
> Est. annual housing costs: $36,612
> Median family income: $145,548 — the highest of 376 metros
> Homeownership rate: 56.6% — 29th lowest of 376 metros
> Median home value: $1,041,800 — the highest of 376 metros
[in-text-ad-2]

1. San Francisco-Oakland-Berkeley, CA
> Est. annual housing costs: $42,636
> Median family income: $131,087 — 2nd highest of 376 metros
> Homeownership rate: 55.0% — 19th lowest of 376 metros
> Median home value: $888,500 — 2nd highest of 376 metros
Methodology
To determine the metro areas with the highest housing costs for a family of four, 24/7 Wall St. reviewed data from the Economic Policy Institute’s 2022 Family Budget Calculator.
In the Family Budget Calculator, the EPI estimates the housing costs for families to maintain a modest yet adequate standard of living. The budgets are created for 10 family types for U.S. counties and metro areas. A family of four is defined by the EPI as a married couple living with their two children, and the two children are assumed to be a 4-year-old and an 8-year-old.
We used the 384 metropolitan statistical areas as delineated by the United States Office of Management and Budget and used by the Census Bureau as our definition of metro areas.
Metros were ranked based on the EPI’s annual housing cost estimates. Ties were broken by five-year estimates of median gross rent from the U.S. Census Bureau’s 2020 American Community Survey, with higher rental costs ranked higher.
Additional information on median family income, homeownership rate, and median home value are from the U.S. Census Bureau’s 2020 American Community Survey. Because the Census Bureau did not release one-year estimates for 2020 due to data collection issues caused by the COVID-19 pandemic, all ACS data are five-year estimates.
Contact [email protected] for any questions or corrections.