The share of Americans working from home skyrocketed during the pandemic. Before the COVID-19 outbreak, only about 20% of American workers with job responsibilities that could be done remotely worked from home, according to the Pew Research Center. In more recent months, a Gallup study found that 45% of full-time workers in the United States – and two-thirds of white-collar workers – were doing their job remotely at least some of the time.
The shift is proving to be a positive development for millions of Americans. Gallup reports that over 90% of remote workers hope that the trend continues after the pandemic, citing the lack of commute time as the chief benefit. (Here is a look at the state where the most people are working from home.)
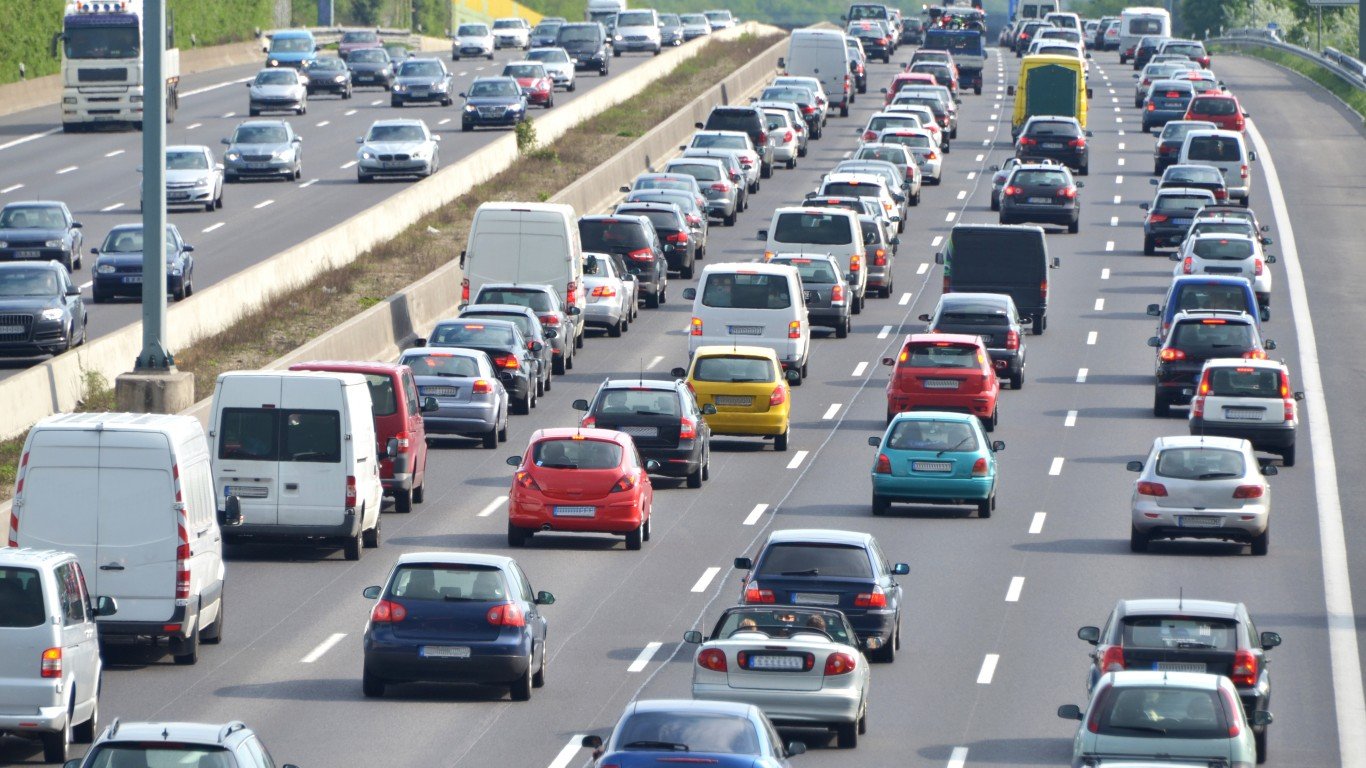
According to the U.S. Census Bureau, the average commute time in the United States is 26.9 minutes. For those who have shifted to full-time remote work, this translates to about 4.5 free hours per week that they did not have before, or nearly 10 days a year.
Of course, commute times vary from person to person, but in some parts of the country, workers are far more likely to have longer commutes than in others. Using census data, 24/7 Wall St. identified the states with the longest commutes. States are ranked based on their average commute time, from shortest to longest.
Depending on the state, average commute times range from as low as 17.3 minutes up to 33.5 minutes. While these differences are minor on any given day, over longer periods, they add up. In some states, average commute times total less than three hours a week, or about six days a year, while in others, they add up to more than five hours a week and 12 days a year. Here is a look at the cities where people lose the most time driving each year.
Variations in average commute times among states appear to be closely tied to means of transportation used. While there are exceptions, in states with the shortest average commute times, the share of commuters who drive to work alone is typically higher than the 74.9% national average. Similarly, in states with the longest commute times, the share of workers who rely on public transit often exceeds the 4.6% national average. Public transit usage rates tend to be higher in states that contain or border a major city, like New York, Washington D.C., or Chicago.
Click here to see the states with the longest commutes
Click here to read our detailed methodology
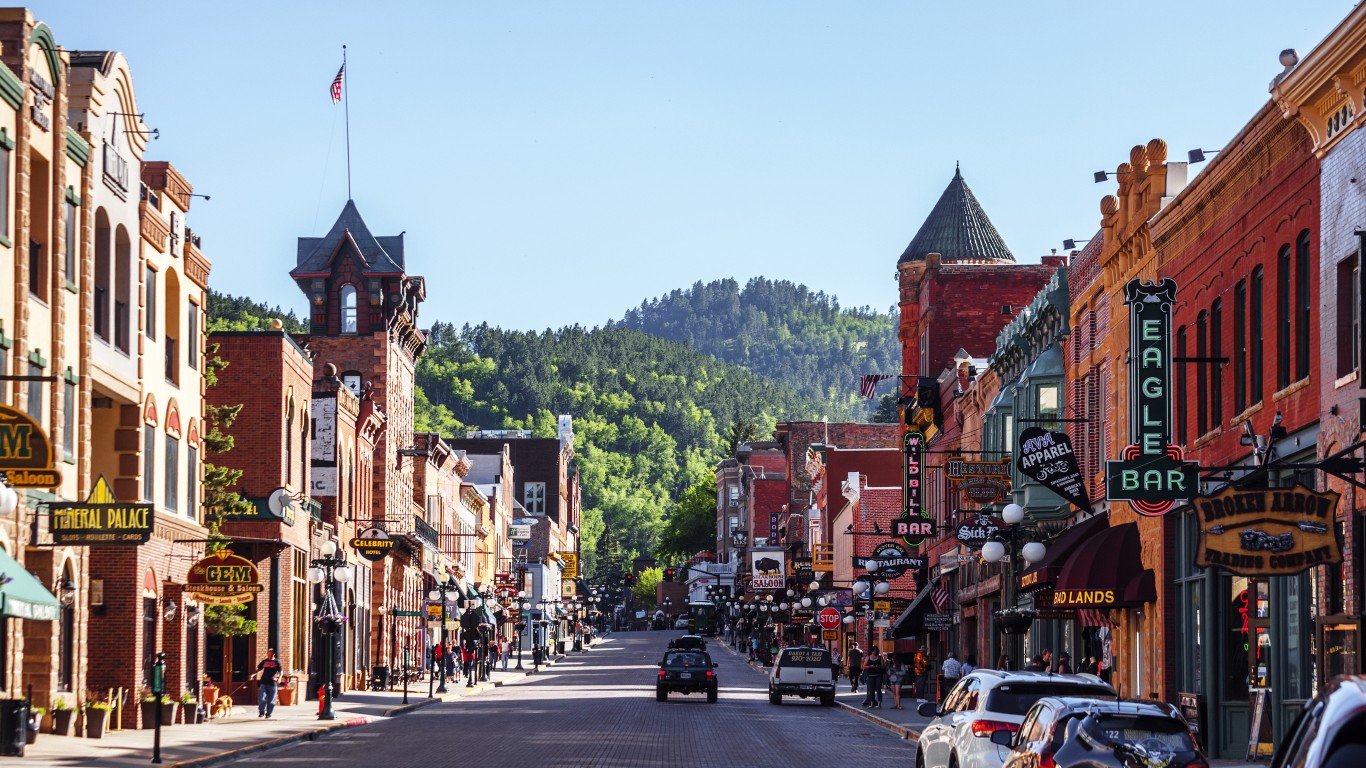
50. South Dakota
> Avg. commute time: 17.3 minutes
> Share of commuters driving alone: 80.0% (18th highest)
> Share of commuters carpooling: 8.1% (11th lowest)
> Share of commuters using public transit: 0.5% (6th lowest)
[in-text-ad]

49. North Dakota
> Avg. commute time: 17.6 minutes
> Share of commuters driving alone: 80.8% (13th highest)
> Share of commuters carpooling: 8.9% (23rd lowest)
> Share of commuters using public transit: 0.5% (8th lowest)
[recirclink id=987778]
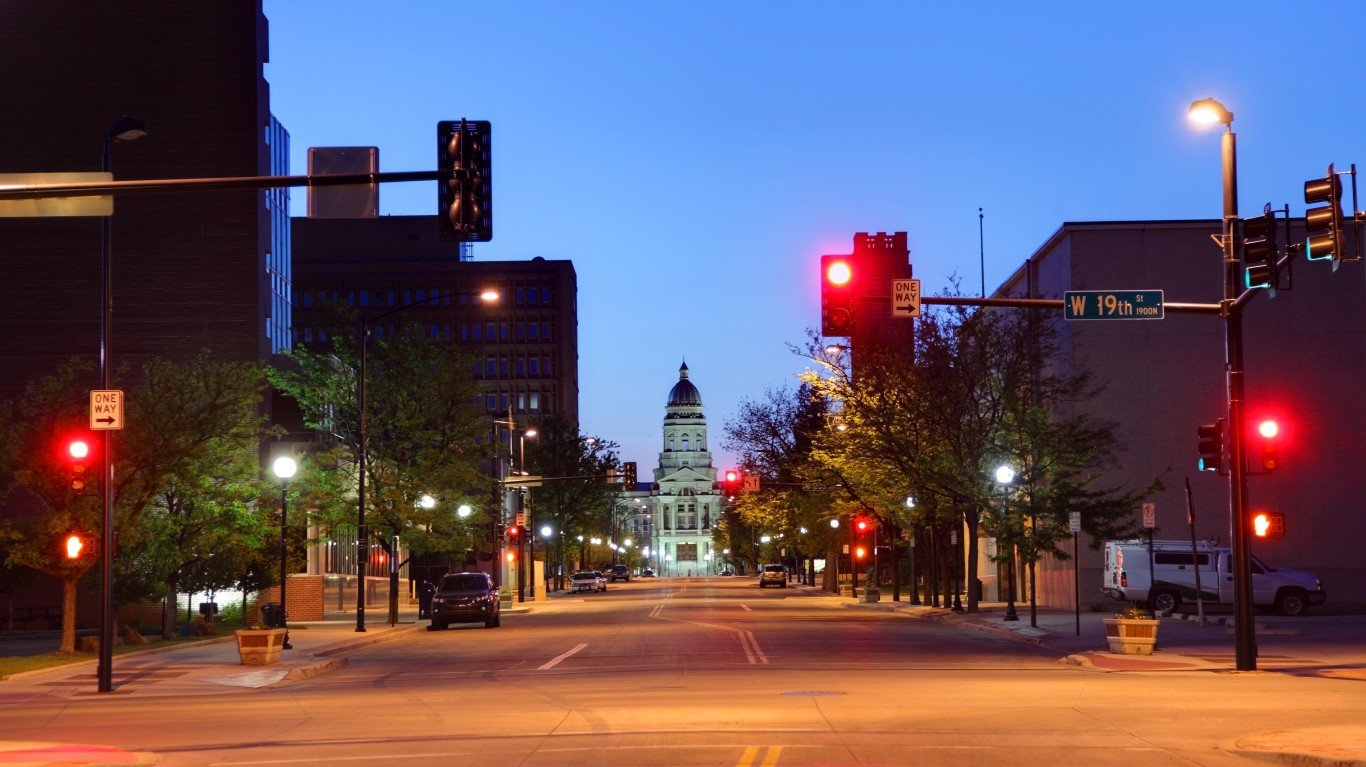
48. Wyoming
> Avg. commute time: 17.9 minutes
> Share of commuters driving alone: 77.4% (22nd lowest)
> Share of commuters carpooling: 10.0% (8th highest)
> Share of commuters using public transit: 1.0% (20th lowest)
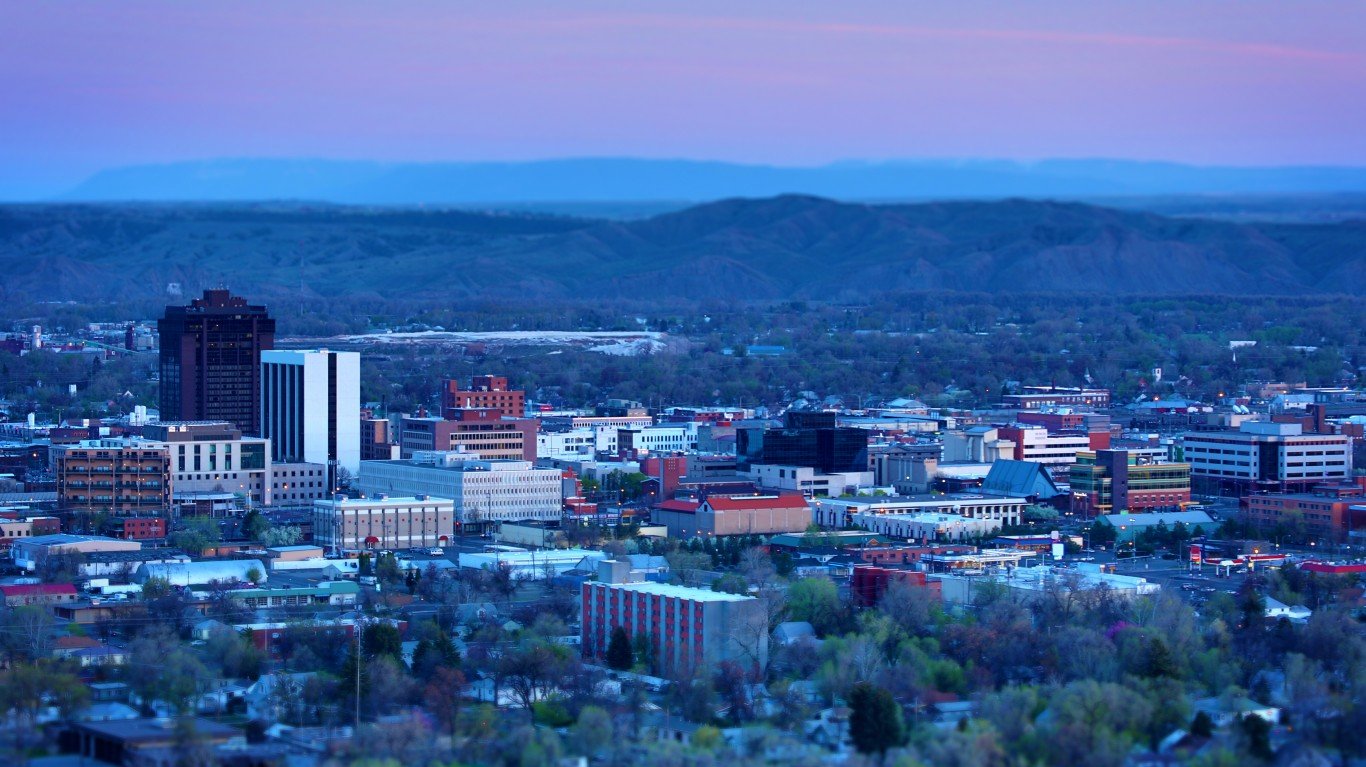
47. Montana
> Avg. commute time: 18.4 minutes
> Share of commuters driving alone: 75.2% (17th lowest)
> Share of commuters carpooling: 9.2% (18th highest)
> Share of commuters using public transit: 0.7% (13th lowest)
[in-text-ad-2]
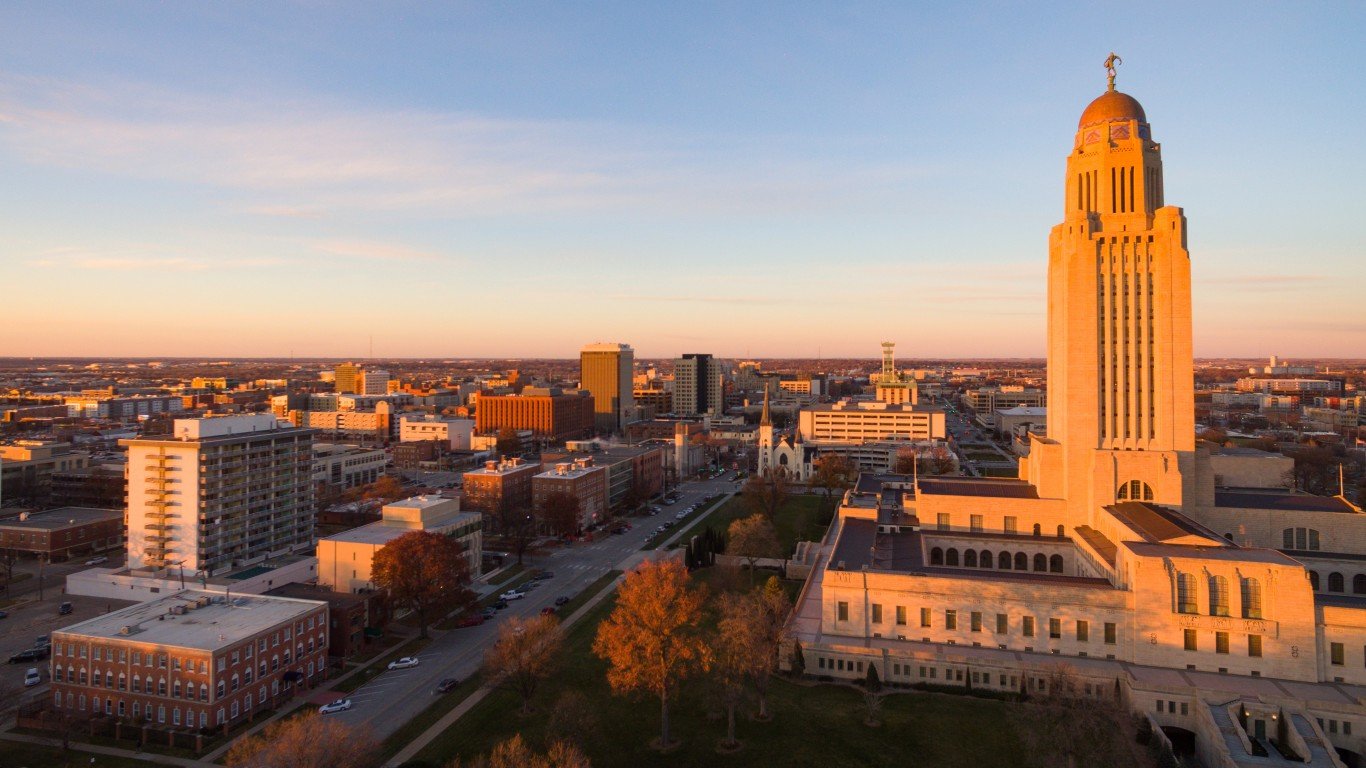
46. Nebraska
> Avg. commute time: 18.9 minutes
> Share of commuters driving alone: 80.7% (15th highest)
> Share of commuters carpooling: 9.0% (23rd highest)
> Share of commuters using public transit: 0.6% (11th lowest)
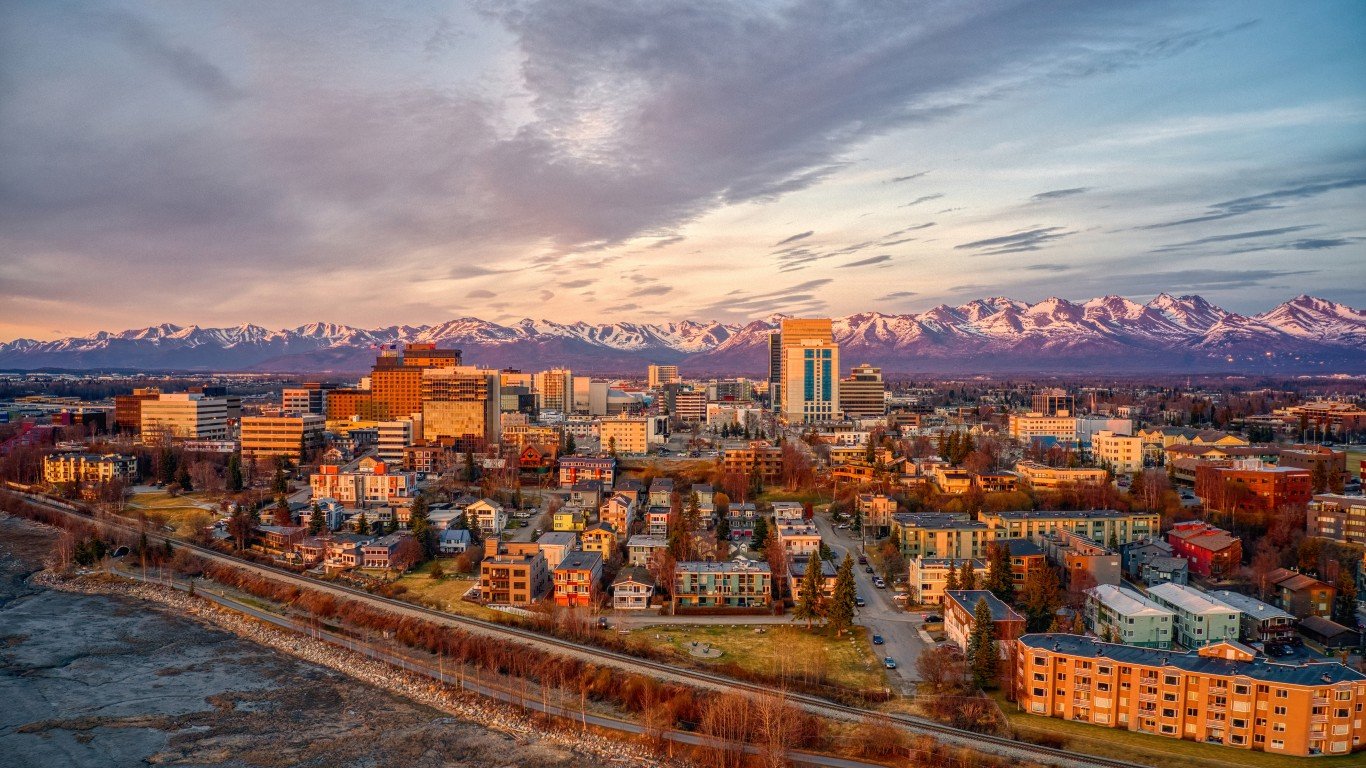
45. Alaska
> Avg. commute time: 18.9 minutes
> Share of commuters driving alone: 68.1% (4th lowest)
> Share of commuters carpooling: 12.1% (2nd highest)
> Share of commuters using public transit: 1.2% (25th lowest)
[in-text-ad]

44. Iowa
> Avg. commute time: 19.5 minutes
> Share of commuters driving alone: 80.2% (17th highest)
> Share of commuters carpooling: 8.0% (9th lowest)
> Share of commuters using public transit: 0.9% (17th lowest)
[recirclink id=1044820]

43. Kansas
> Avg. commute time: 19.6 minutes
> Share of commuters driving alone: 80.7% (14th highest)
> Share of commuters carpooling: 8.9% (24th lowest)
> Share of commuters using public transit: 0.4% (5th lowest)
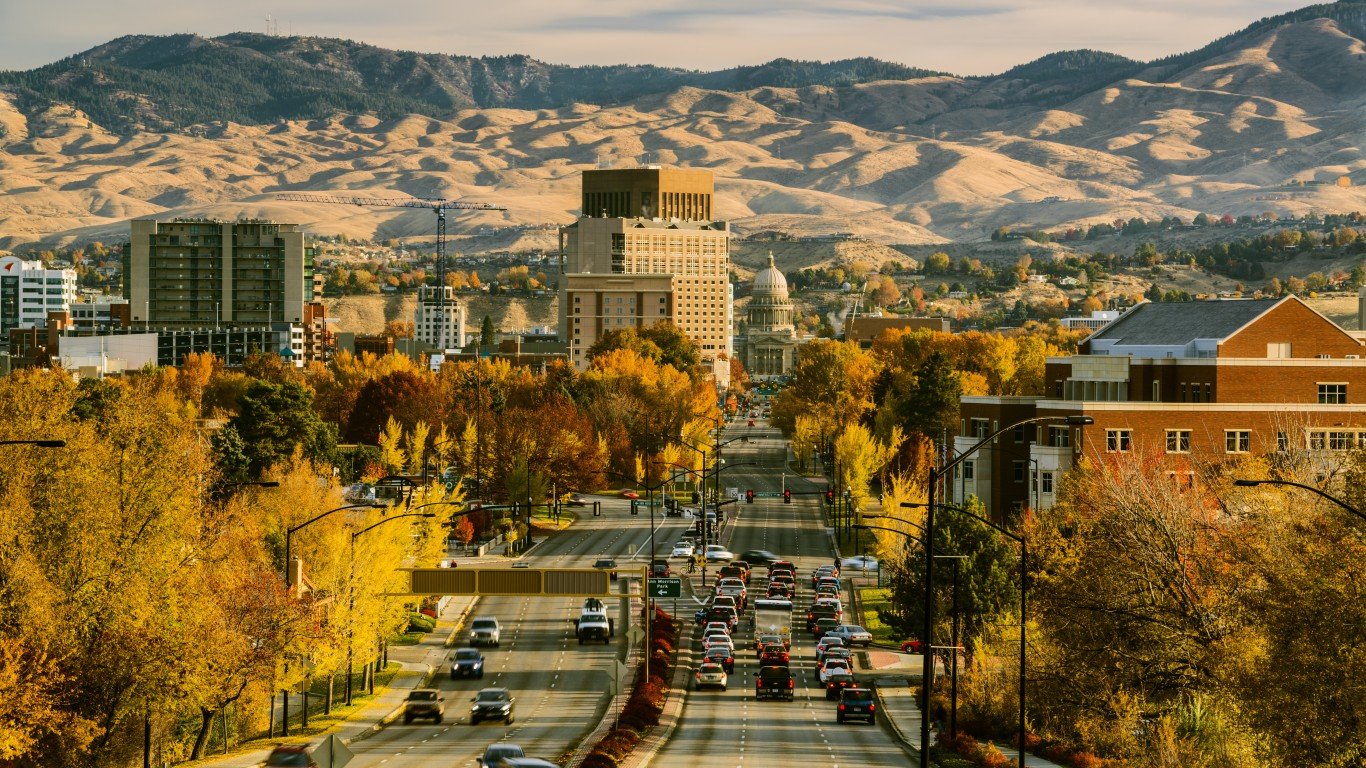
42. Idaho
> Avg. commute time: 21.2 minutes
> Share of commuters driving alone: 77.8% (25th lowest)
> Share of commuters carpooling: 9.3% (14th highest)
> Share of commuters using public transit: 0.6% (12th lowest)
[in-text-ad-2]

41. Arkansas
> Avg. commute time: 21.8 minutes
> Share of commuters driving alone: 82.3% (3rd highest)
> Share of commuters carpooling: 10.2% (6th highest)
> Share of commuters using public transit: 0.3% (2nd lowest)

40. Oklahoma
> Avg. commute time: 22.0 minutes
> Share of commuters driving alone: 81.6% (7th highest)
> Share of commuters carpooling: 9.7% (12th highest)
> Share of commuters using public transit: 0.4% (4th lowest)
[in-text-ad]

39. Utah
> Avg. commute time: 22.0 minutes
> Share of commuters driving alone: 74.4% (13th lowest)
> Share of commuters carpooling: 10.4% (5th highest)
> Share of commuters using public transit: 2.2% (17th highest)
[recirclink id=1054986]

38. Wisconsin
> Avg. commute time: 22.2 minutes
> Share of commuters driving alone: 79.9% (19th highest)
> Share of commuters carpooling: 7.7% (5th lowest)
> Share of commuters using public transit: 1.5% (22nd highest)
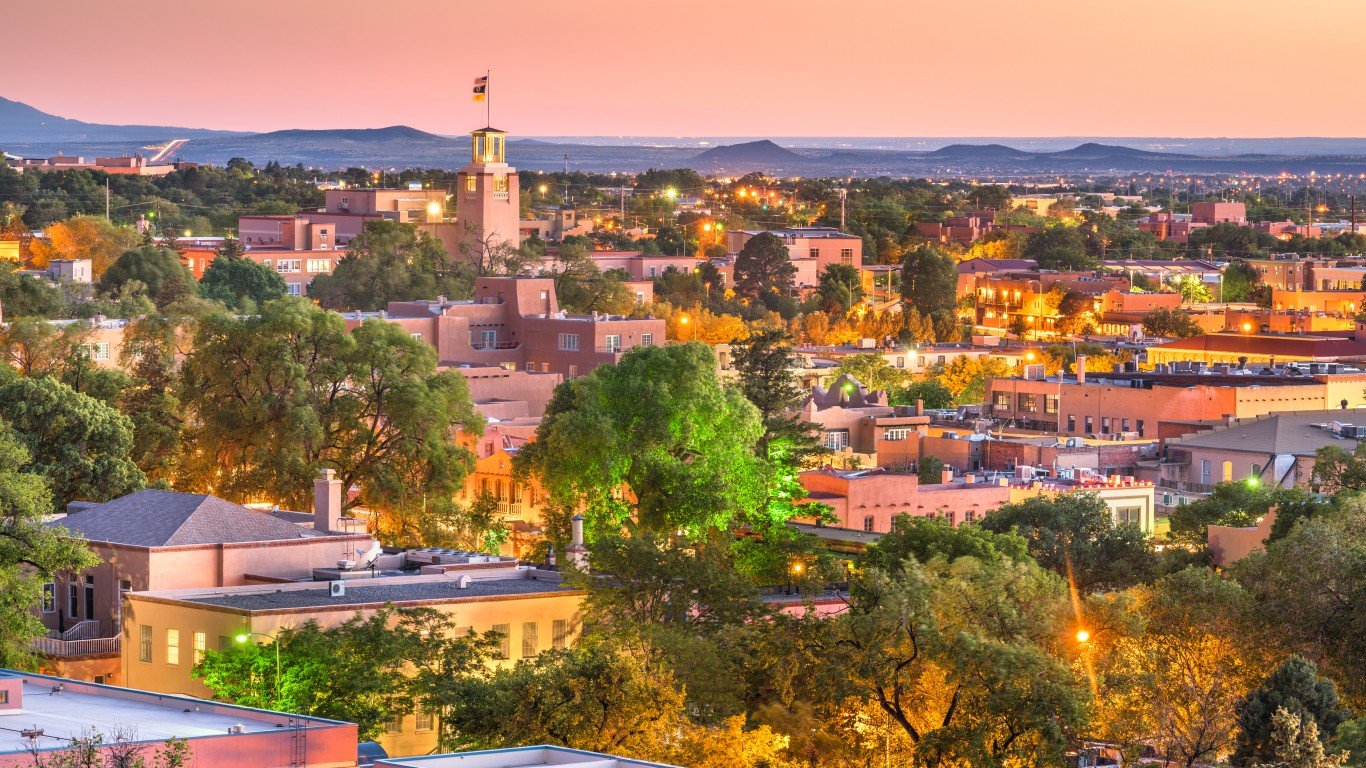
37. New Mexico
> Avg. commute time: 22.7 minutes
> Share of commuters driving alone: 79.1% (23rd highest)
> Share of commuters carpooling: 10.0% (7th highest)
> Share of commuters using public transit: 1.0% (21st lowest)
[in-text-ad-2]
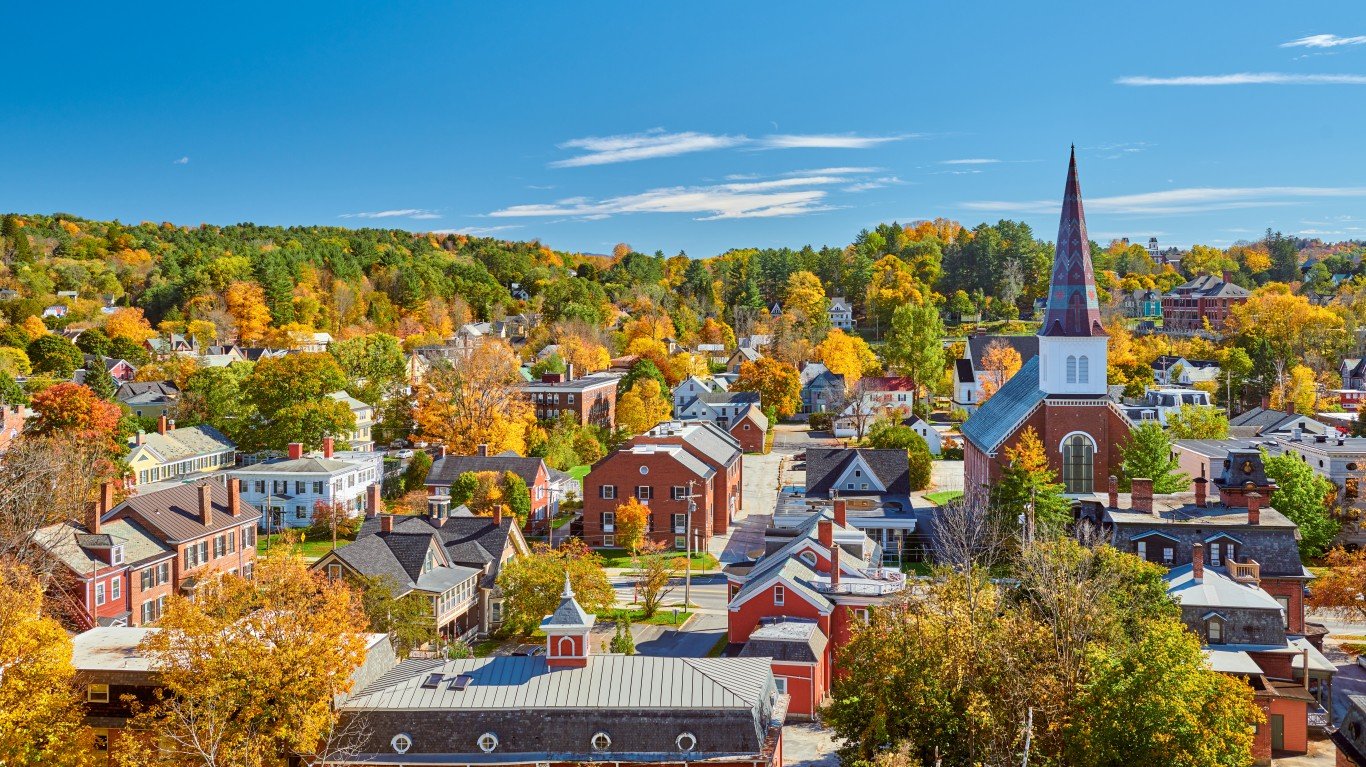
36. Vermont
> Avg. commute time: 23.3 minutes
> Share of commuters driving alone: 74.4% (12th lowest)
> Share of commuters carpooling: 8.5% (16th lowest)
> Share of commuters using public transit: 1.2% (24th lowest)

35. Ohio
> Avg. commute time: 23.7 minutes
> Share of commuters driving alone: 81.5% (9th highest)
> Share of commuters carpooling: 7.6% (3rd lowest)
> Share of commuters using public transit: 1.4% (23rd highest)
[in-text-ad]

34. Kentucky
> Avg. commute time: 23.7 minutes
> Share of commuters driving alone: 81.2% (11th highest)
> Share of commuters carpooling: 9.2% (20th highest)
> Share of commuters using public transit: 0.9% (18th lowest)
[recirclink id=1060122]

33. Minnesota
> Avg. commute time: 23.8 minutes
> Share of commuters driving alone: 76.0% (18th lowest)
> Share of commuters carpooling: 8.1% (12th lowest)
> Share of commuters using public transit: 3.2% (13th highest)
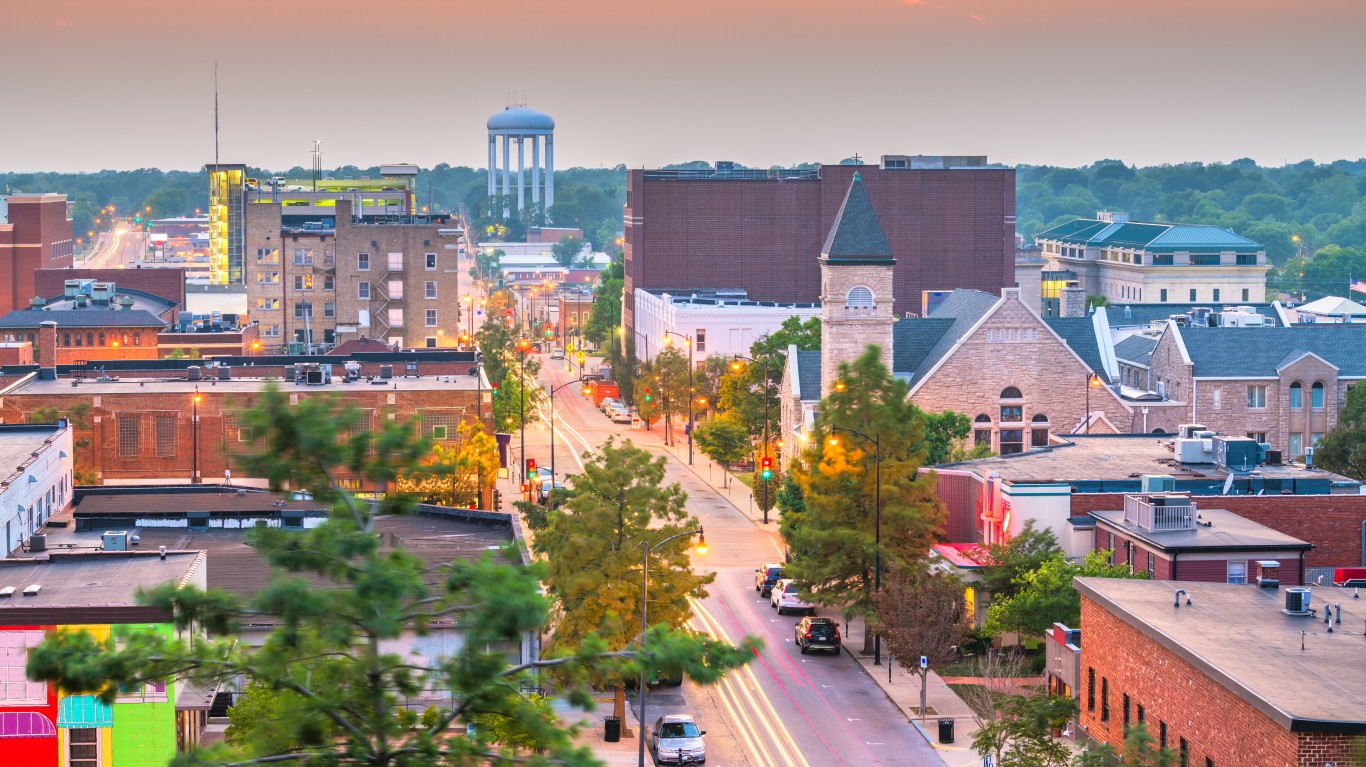
32. Missouri
> Avg. commute time: 23.9 minutes
> Share of commuters driving alone: 80.8% (12th highest)
> Share of commuters carpooling: 8.4% (15th lowest)
> Share of commuters using public transit: 1.2% (23rd lowest)
[in-text-ad-2]

31. Indiana
> Avg. commute time: 23.9 minutes
> Share of commuters driving alone: 81.3% (10th highest)
> Share of commuters carpooling: 9.0% (22nd highest)
> Share of commuters using public transit: 0.9% (16th lowest)

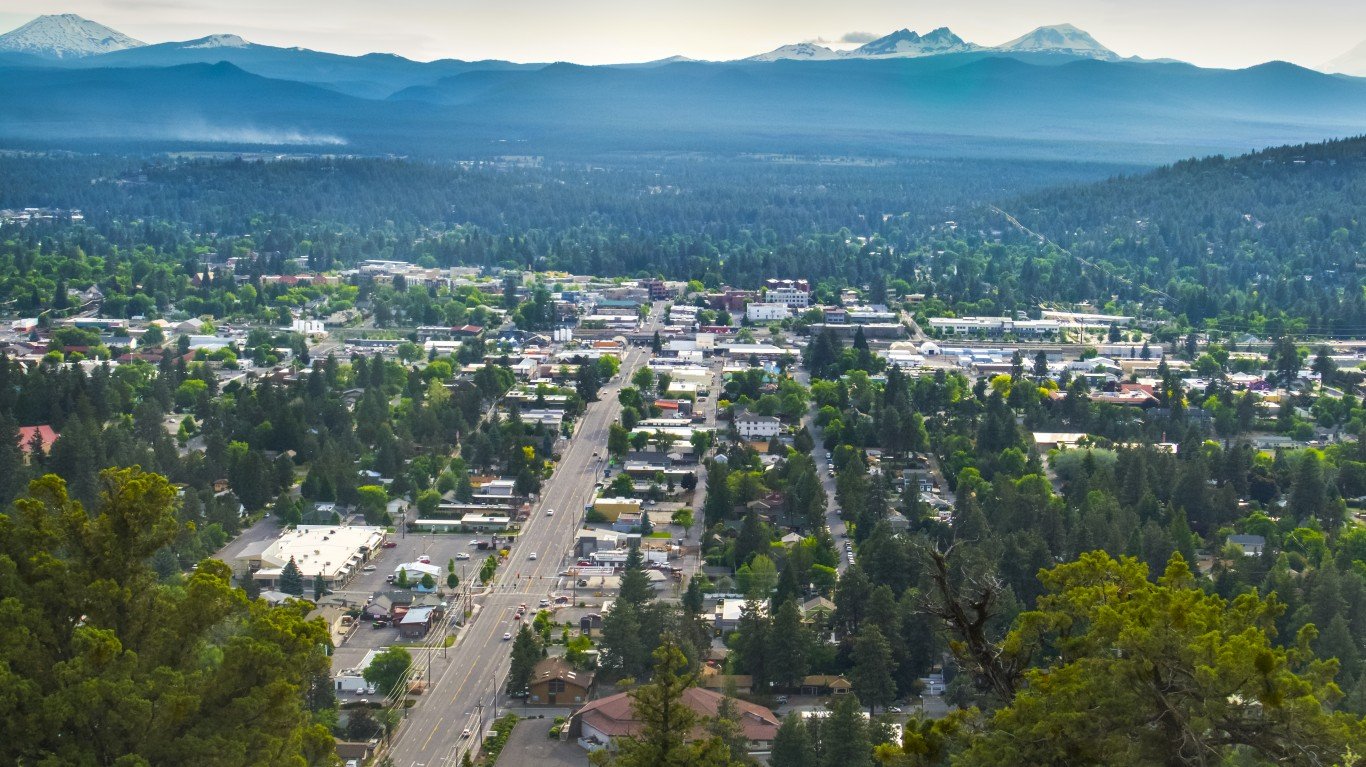
30. Oregon
> Avg. commute time: 23.9 minutes
> Share of commuters driving alone: 70.5% (7th lowest)
> Share of commuters carpooling: 9.4% (13th highest)
> Share of commuters using public transit: 4.0% (11th highest)
[in-text-ad]

29. Maine
> Avg. commute time: 24.3 minutes
> Share of commuters driving alone: 77.2% (21st lowest)
> Share of commuters carpooling: 9.2% (17th highest)
> Share of commuters using public transit: 0.5% (9th lowest)
[recirclink id=1024519]

28. Nevada
> Avg. commute time: 24.6 minutes
> Share of commuters driving alone: 76.8% (20th lowest)
> Share of commuters carpooling: 10.6% (4th highest)
> Share of commuters using public transit: 2.9% (14th highest)
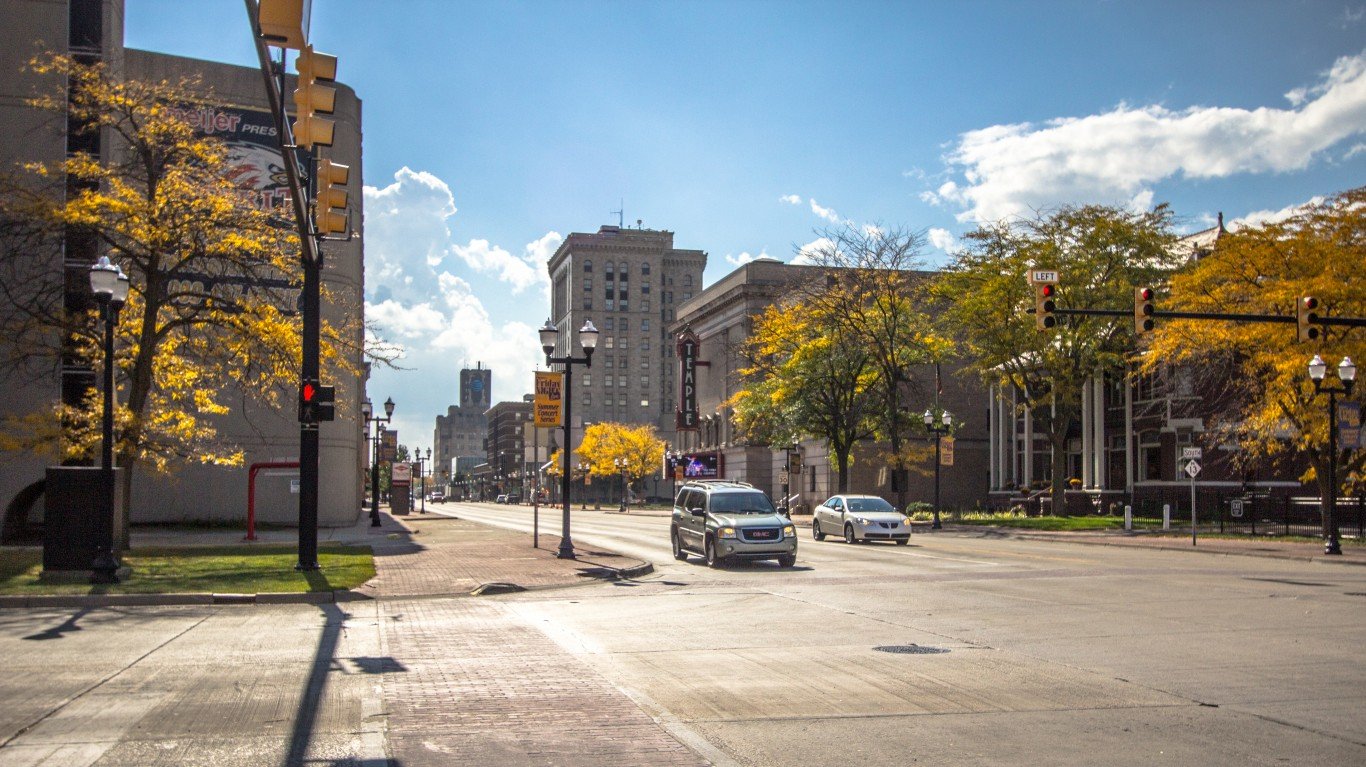
27. Michigan
> Avg. commute time: 24.6 minutes
> Share of commuters driving alone: 80.7% (16th highest)
> Share of commuters carpooling: 8.6% (19th lowest)
> Share of commuters using public transit: 1.3% (24th highest)
[in-text-ad-2]

26. North Carolina
> Avg. commute time: 24.9 minutes
> Share of commuters driving alone: 79.3% (22nd highest)
> Share of commuters carpooling: 9.0% (24th highest)
> Share of commuters using public transit: 1.0% (19th lowest)

25. South Carolina
> Avg. commute time: 25.1 minutes
> Share of commuters driving alone: 81.5% (8th highest)
> Share of commuters carpooling: 8.9% (25th lowest)
> Share of commuters using public transit: 0.5% (7th lowest)
[in-text-ad]

24. Mississippi
> Avg. commute time: 25.2 minutes
> Share of commuters driving alone: 84.6% (2nd highest)
> Share of commuters carpooling: 9.2% (16th highest)
> Share of commuters using public transit: 0.3% (the lowest)
[recirclink id=987778]

23. Alabama
> Avg. commute time: 25.2 minutes
> Share of commuters driving alone: 84.9% (the highest)
> Share of commuters carpooling: 8.3% (14th lowest)
> Share of commuters using public transit: 0.3% (3rd lowest)

22. Rhode Island
> Avg. commute time: 25.3 minutes
> Share of commuters driving alone: 79.7% (20th highest)
> Share of commuters carpooling: 8.1% (10th lowest)
> Share of commuters using public transit: 2.2% (16th highest)
[in-text-ad-2]

21. Tennessee
> Avg. commute time: 25.4 minutes
> Share of commuters driving alone: 81.9% (5th highest)
> Share of commuters carpooling: 8.8% (22nd lowest)
> Share of commuters using public transit: 0.6% (10th lowest)

20. Arizona
> Avg. commute time: 25.8 minutes
> Share of commuters driving alone: 74.5% (15th lowest)
> Share of commuters carpooling: 10.7% (3rd highest)
> Share of commuters using public transit: 1.6% (21st highest)
[in-text-ad]

19. Louisiana
> Avg. commute time: 25.8 minutes
> Share of commuters driving alone: 81.9% (6th highest)
> Share of commuters carpooling: 9.0% (21st highest)
> Share of commuters using public transit: 1.1% (22nd lowest)
[recirclink id=1044820]

18. Colorado
> Avg. commute time: 25.8 minutes
> Share of commuters driving alone: 72.9% (11th lowest)
> Share of commuters carpooling: 8.6% (18th lowest)
> Share of commuters using public transit: 2.8% (15th highest)
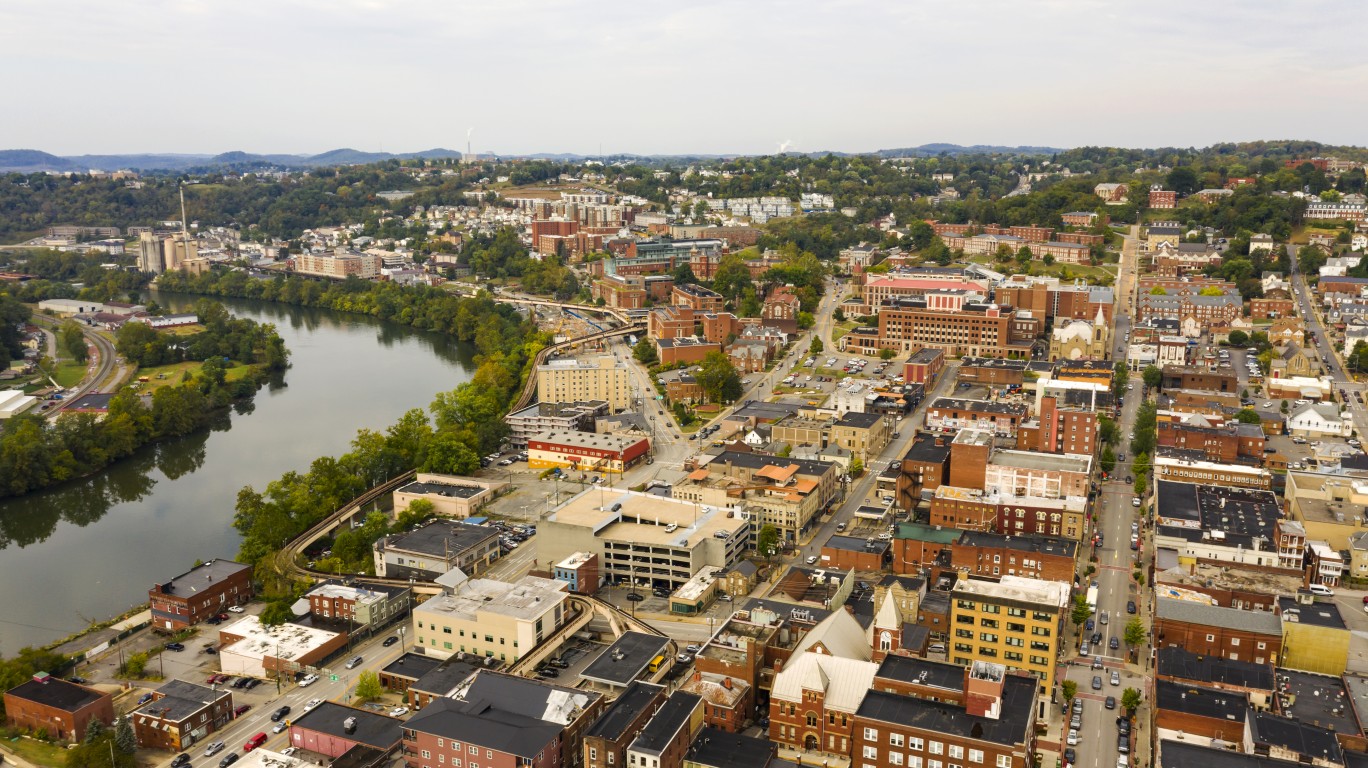
17. West Virginia
> Avg. commute time: 26.1 minutes
> Share of commuters driving alone: 82.0% (4th highest)
> Share of commuters carpooling: 8.6% (21st lowest)
> Share of commuters using public transit: 0.8% (15th lowest)
[in-text-ad-2]

16. Delaware
> Avg. commute time: 26.2 minutes
> Share of commuters driving alone: 78.8% (24th highest)
> Share of commuters carpooling: 8.6% (17th lowest)
> Share of commuters using public transit: 2.2% (18th highest)

15. Texas
> Avg. commute time: 26.6 minutes
> Share of commuters driving alone: 78.7% (25th highest)
> Share of commuters carpooling: 9.9% (10th highest)
> Share of commuters using public transit: 1.3% (25th highest)
[in-text-ad]

14. Connecticut
> Avg. commute time: 26.7 minutes
> Share of commuters driving alone: 76.3% (19th lowest)
> Share of commuters carpooling: 7.8% (8th lowest)
> Share of commuters using public transit: 4.4% (10th highest)
[recirclink id=1054986]
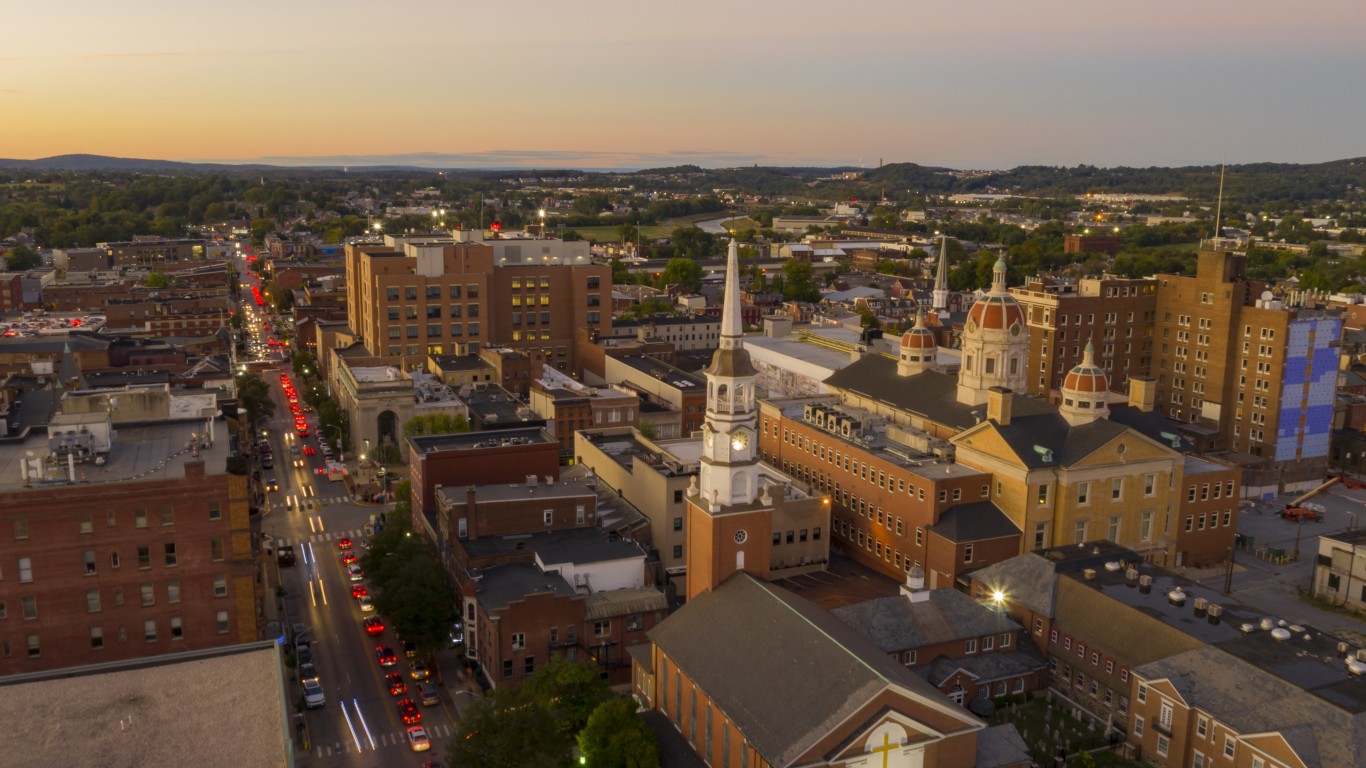
13. Pennsylvania
> Avg. commute time: 27.1 minutes
> Share of commuters driving alone: 74.4% (14th lowest)
> Share of commuters carpooling: 8.2% (13th lowest)
> Share of commuters using public transit: 5.2% (8th highest)

12. Hawaii
> Avg. commute time: 27.1 minutes
> Share of commuters driving alone: 67.6% (2nd lowest)
> Share of commuters carpooling: 13.4% (the highest)
> Share of commuters using public transit: 5.5% (7th highest)
[in-text-ad-2]

11. New Hampshire
> Avg. commute time: 27.4 minutes
> Share of commuters driving alone: 79.5% (21st highest)
> Share of commuters carpooling: 7.7% (4th lowest)
> Share of commuters using public transit: 0.8% (14th lowest)

10. Florida
> Avg. commute time: 27.9 minutes
> Share of commuters driving alone: 77.7% (24th lowest)
> Share of commuters carpooling: 9.2% (19th highest)
> Share of commuters using public transit: 1.6% (20th highest)
[in-text-ad]

9. Washington
> Avg. commute time: 28.0 minutes
> Share of commuters driving alone: 69.7% (6th lowest)
> Share of commuters carpooling: 9.7% (11th highest)
> Share of commuters using public transit: 6.0% (6th highest)
[recirclink id=1060122]

8. Virginia
> Avg. commute time: 28.6 minutes
> Share of commuters driving alone: 74.9% (16th lowest)
> Share of commuters carpooling: 8.9% (25th highest)
> Share of commuters using public transit: 4.0% (12th highest)

7. Georgia
> Avg. commute time: 28.7 minutes
> Share of commuters driving alone: 77.7% (23rd lowest)
> Share of commuters carpooling: 9.3% (15th highest)
> Share of commuters using public transit: 1.9% (19th highest)
[in-text-ad-2]

6. Illinois
> Avg. commute time: 29.0 minutes
> Share of commuters driving alone: 71.5% (8th lowest)
> Share of commuters carpooling: 7.8% (6th lowest)
> Share of commuters using public transit: 8.8% (4th highest)

5. California
> Avg. commute time: 29.8 minutes
> Share of commuters driving alone: 72.1% (9th lowest)
> Share of commuters carpooling: 10.0% (9th highest)
> Share of commuters using public transit: 4.6% (9th highest)
[in-text-ad]

4. Massachusetts
> Avg. commute time: 30.0 minutes
> Share of commuters driving alone: 68.0% (3rd lowest)
> Share of commuters carpooling: 7.3% (2nd lowest)
> Share of commuters using public transit: 9.5% (3rd highest)
[recirclink id=1024519]
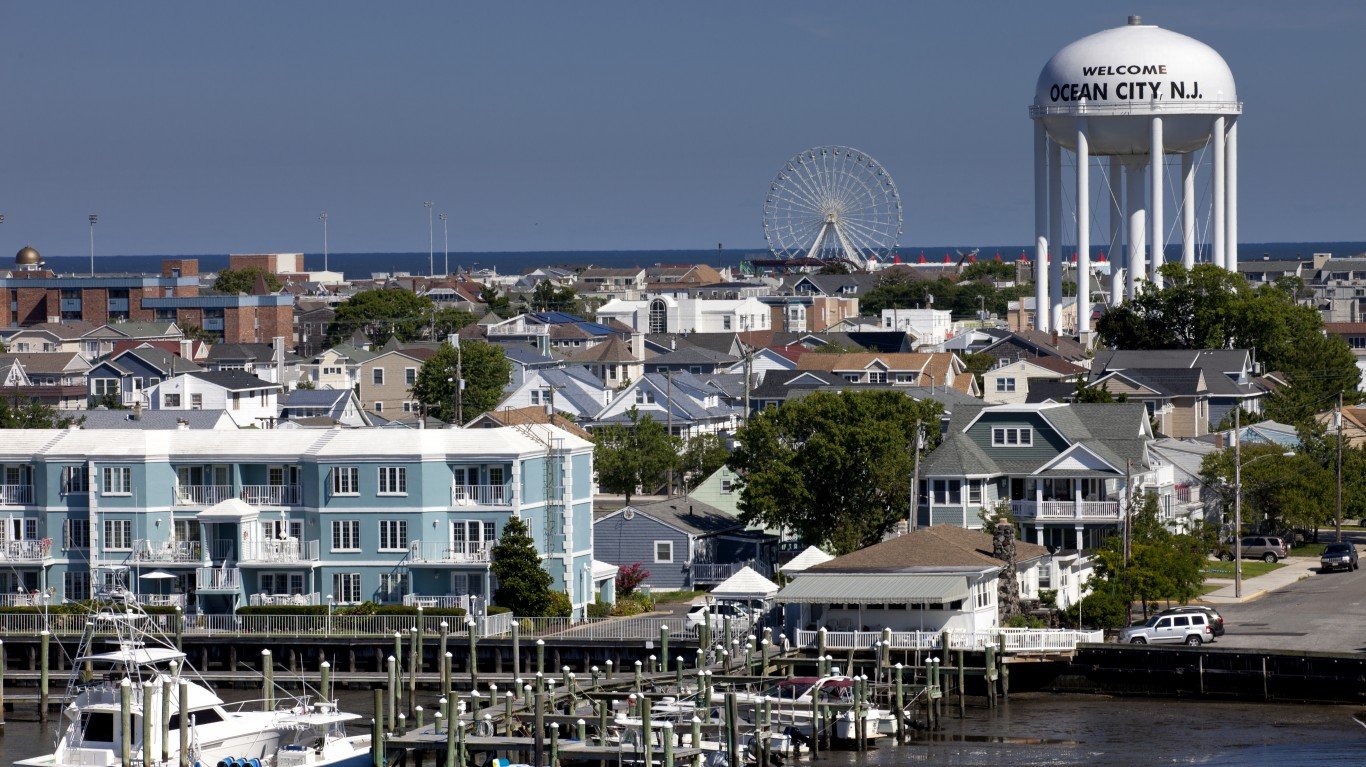
3. New Jersey
> Avg. commute time: 32.0 minutes
> Share of commuters driving alone: 69.6% (5th lowest)
> Share of commuters carpooling: 7.8% (7th lowest)
> Share of commuters using public transit: 10.8% (2nd highest)

2. Maryland
> Avg. commute time: 33.0 minutes
> Share of commuters driving alone: 72.1% (10th lowest)
> Share of commuters carpooling: 8.6% (20th lowest)
> Share of commuters using public transit: 7.4% (5th highest)
[in-text-ad-2]

1. New York
> Avg. commute time: 33.5 minutes
> Share of commuters driving alone: 52.3% (the lowest)
> Share of commuters carpooling: 6.4% (the lowest)
> Share of commuters using public transit: 26.2% (the highest)
Methodology
To determine the states with the longest commutes, 24/7 Wall St. reviewed five-year estimates of average commute times from the U.S. Census Bureau’s 2020 American Community Survey.
States were ranked based on their average commute time. To break ties, we used the share of workers with a commute of 45 minutes or longer.
Additional information on the share of commuters driving alone, carpooling, and using public transit is also from the 2020 ACS and figures are five-year estimates. Because the Census Bureau did not release one-year estimates for 2020 due to data collection issues caused by the COVID-19 pandemic, all ACS data are five-year estimates.
Contact [email protected] for any questions or corrections.