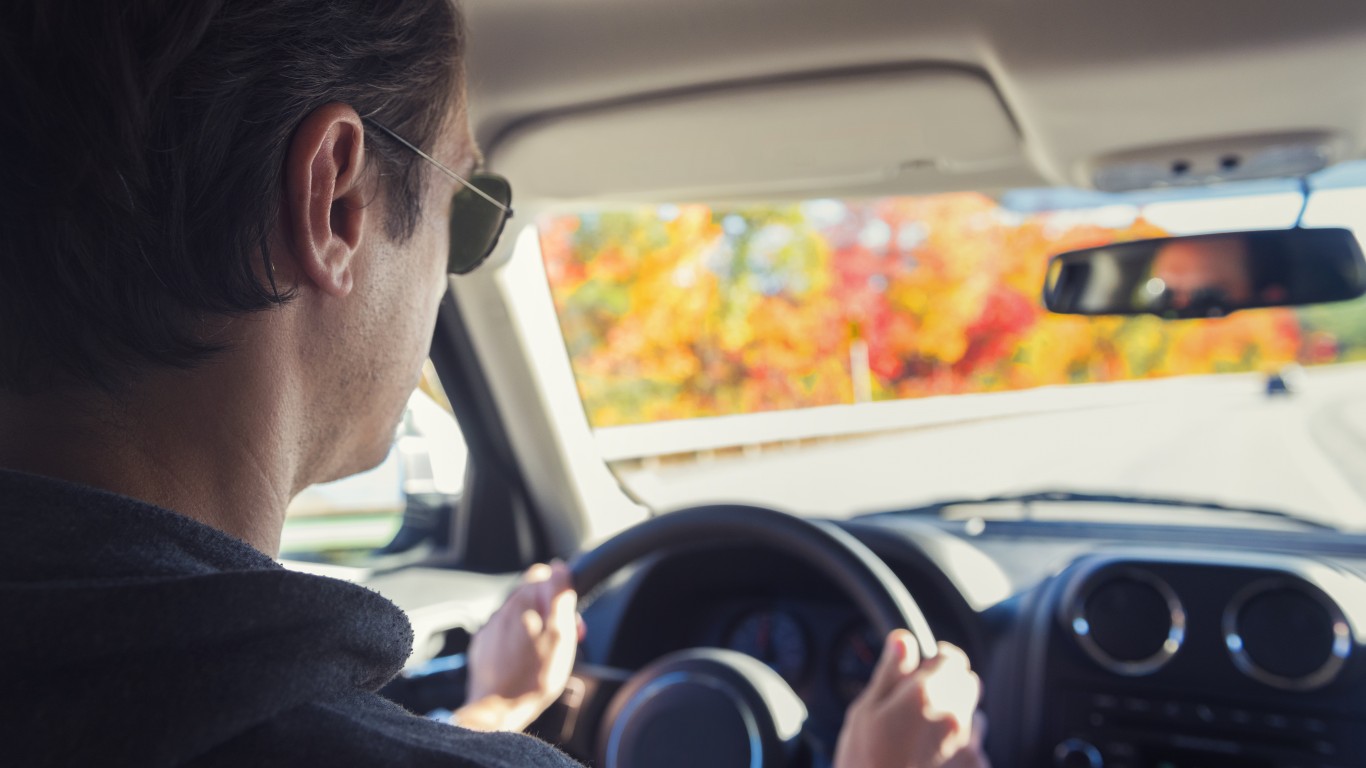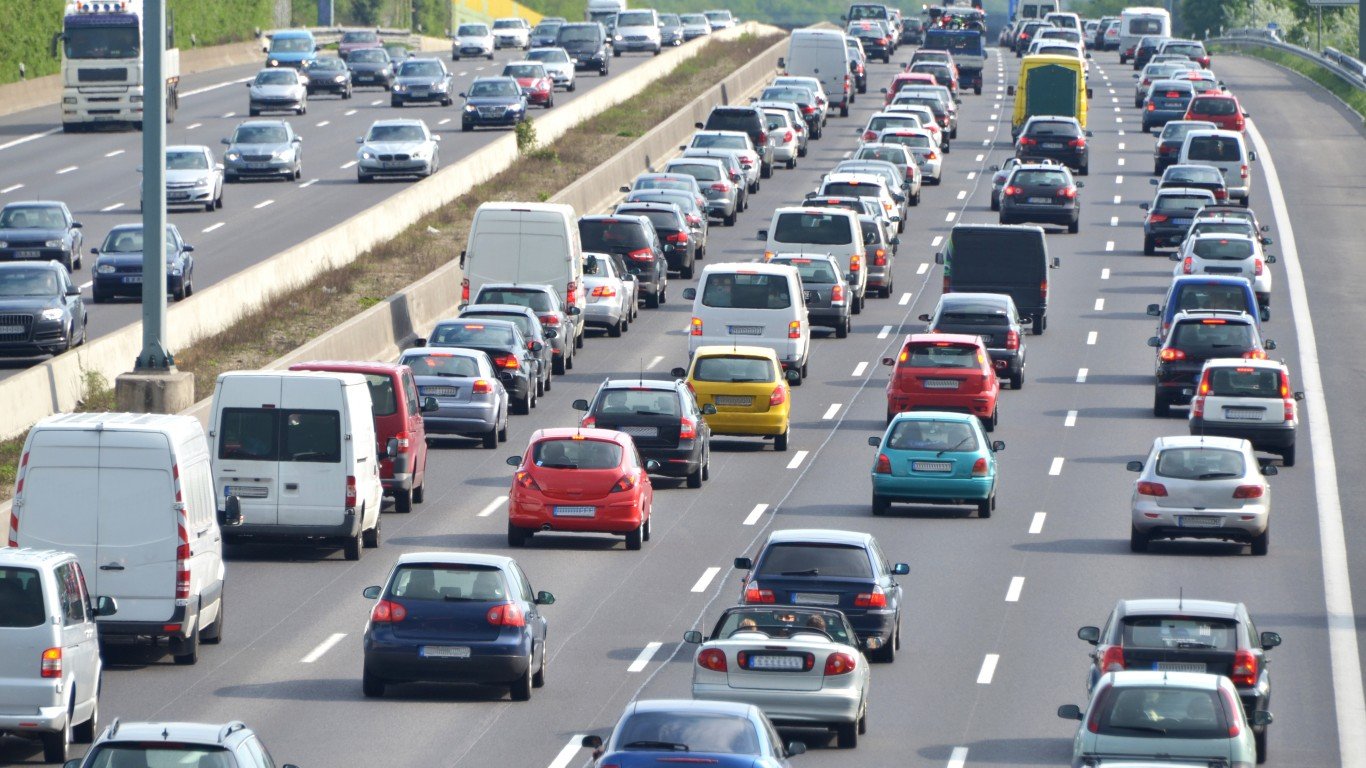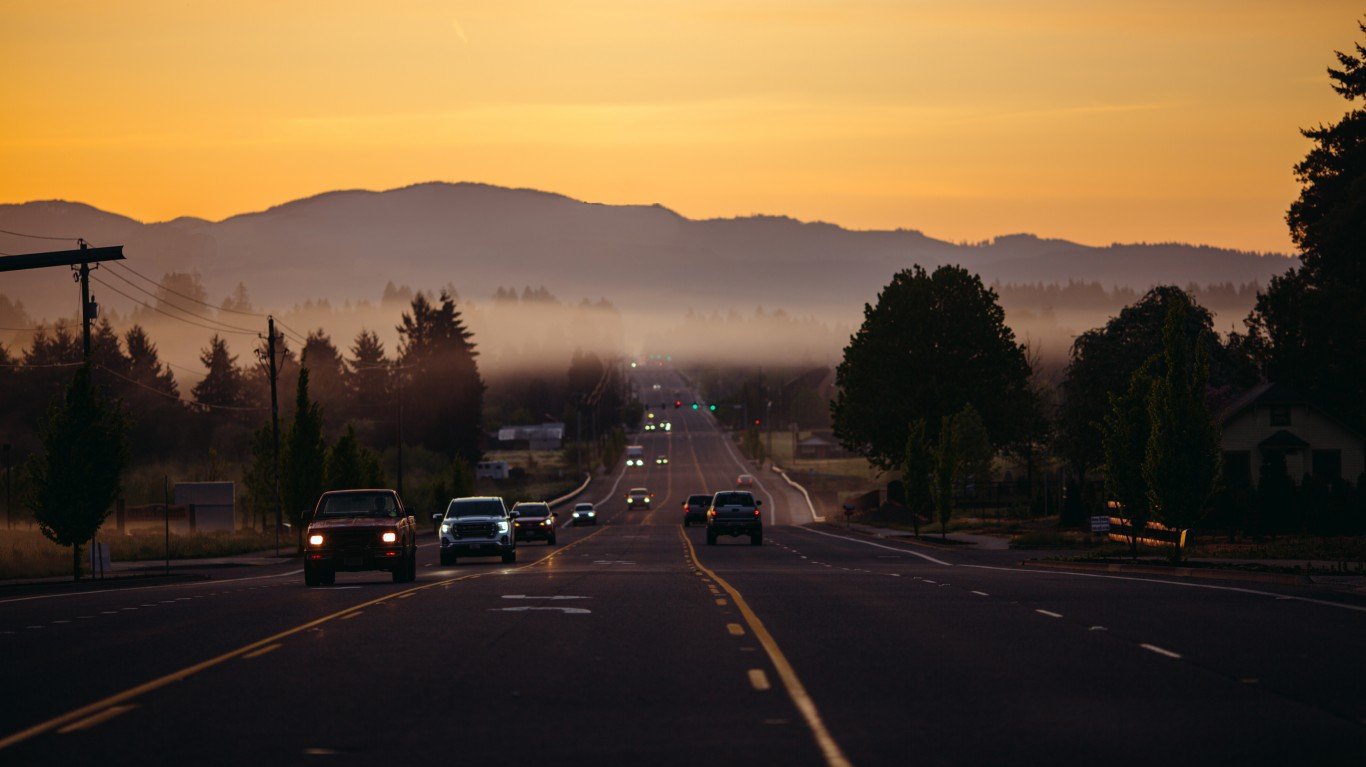
The share of Americans working from home skyrocketed during the pandemic. A recent Gallup study found that 45% of full-time workers in the United States – and two-thirds of white-collar workers – were doing their job remotely at least some of the time.
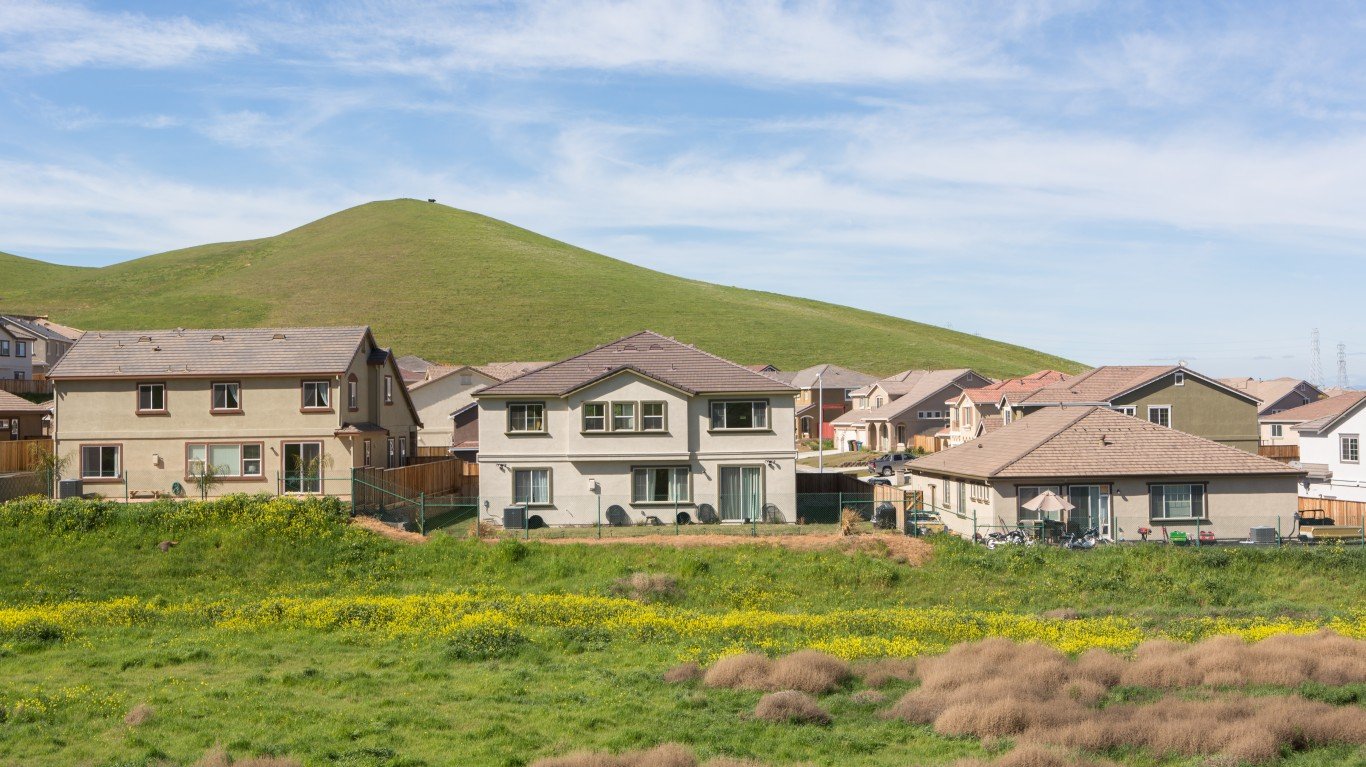
The shift is proving to be a positive development for millions of Americans. Gallup reports that over 90% of remote workers hope that the trend continues after the pandemic, citing the lack of commute time as the chief benefit. (Here is a look at the state where the most people are working from home.)
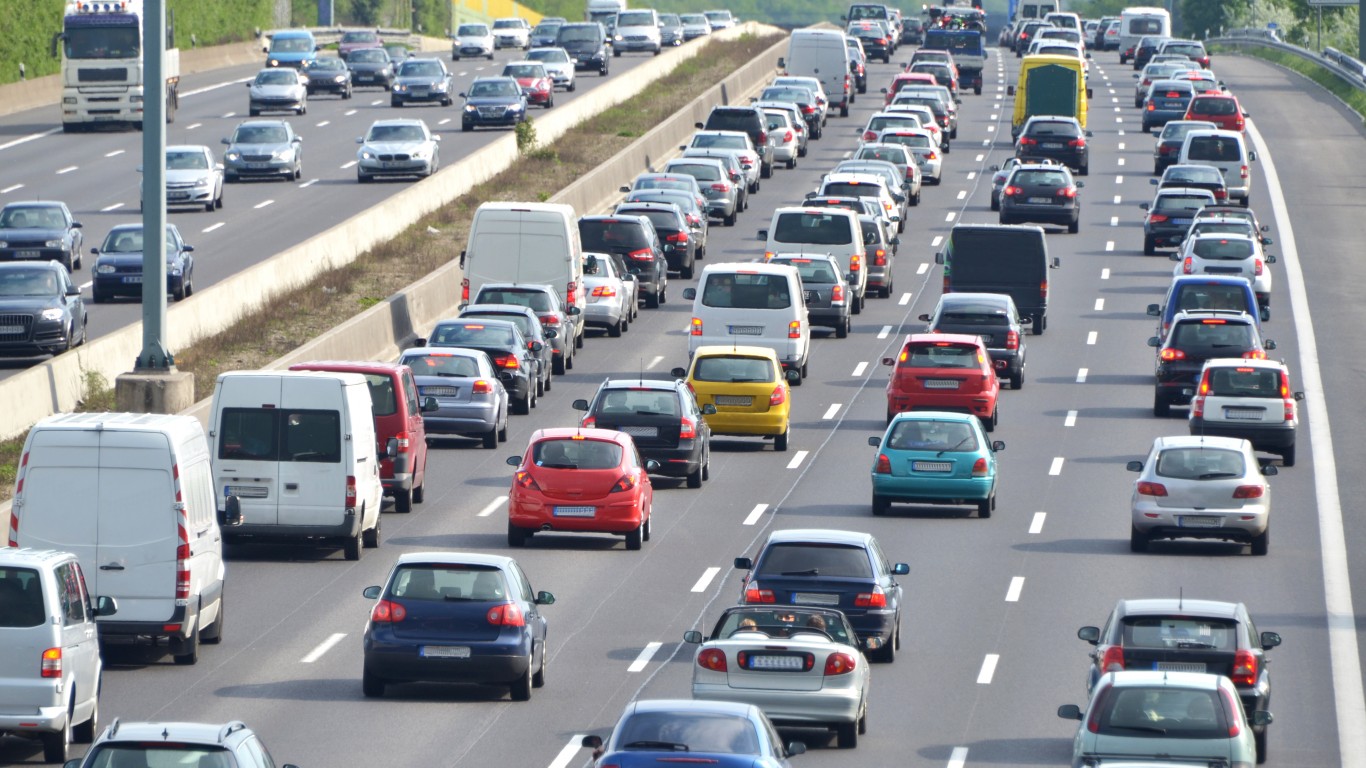
According to the U.S. Census Bureau, the average commute time in the United States is 26.9 minutes. For those who have shifted to full-time remote work, this translates to about 4.5 hours per week, or nearly 10 days a year, of time that they did not have before.
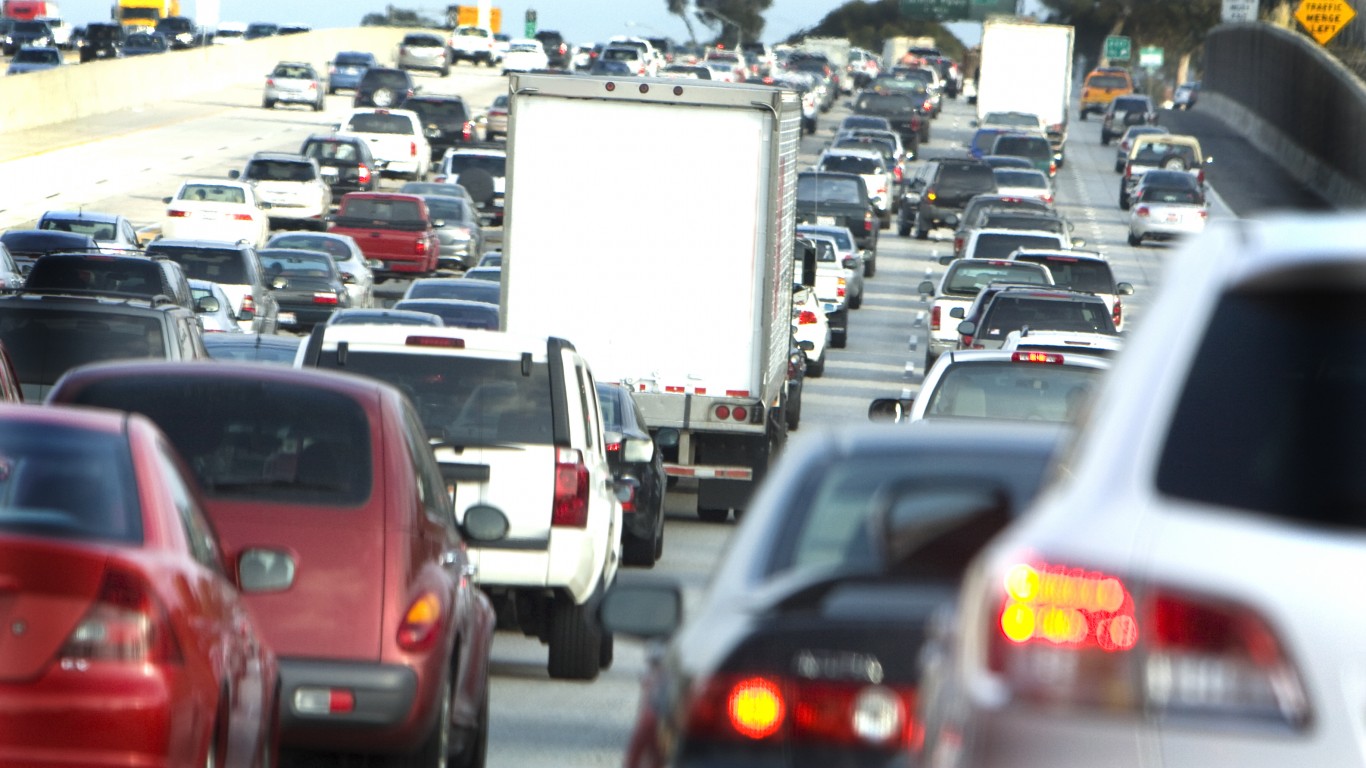
Of course, commute times vary from person to person, but in some parts of the country, workers are far more likely to have longer commutes than in others. Using census data, 24/7 Wall St. identified the 50 U.S. ZIP codes with the longest commutes.
Among the ZIP codes on this list, average commute times range from about 48 minutes up to over 66 minutes. Over the course of a week, these commute times add up, from nearly eight hours up to 11 – and in some cases, more than three weeks over the course of a year for those who commute every Monday through Friday.
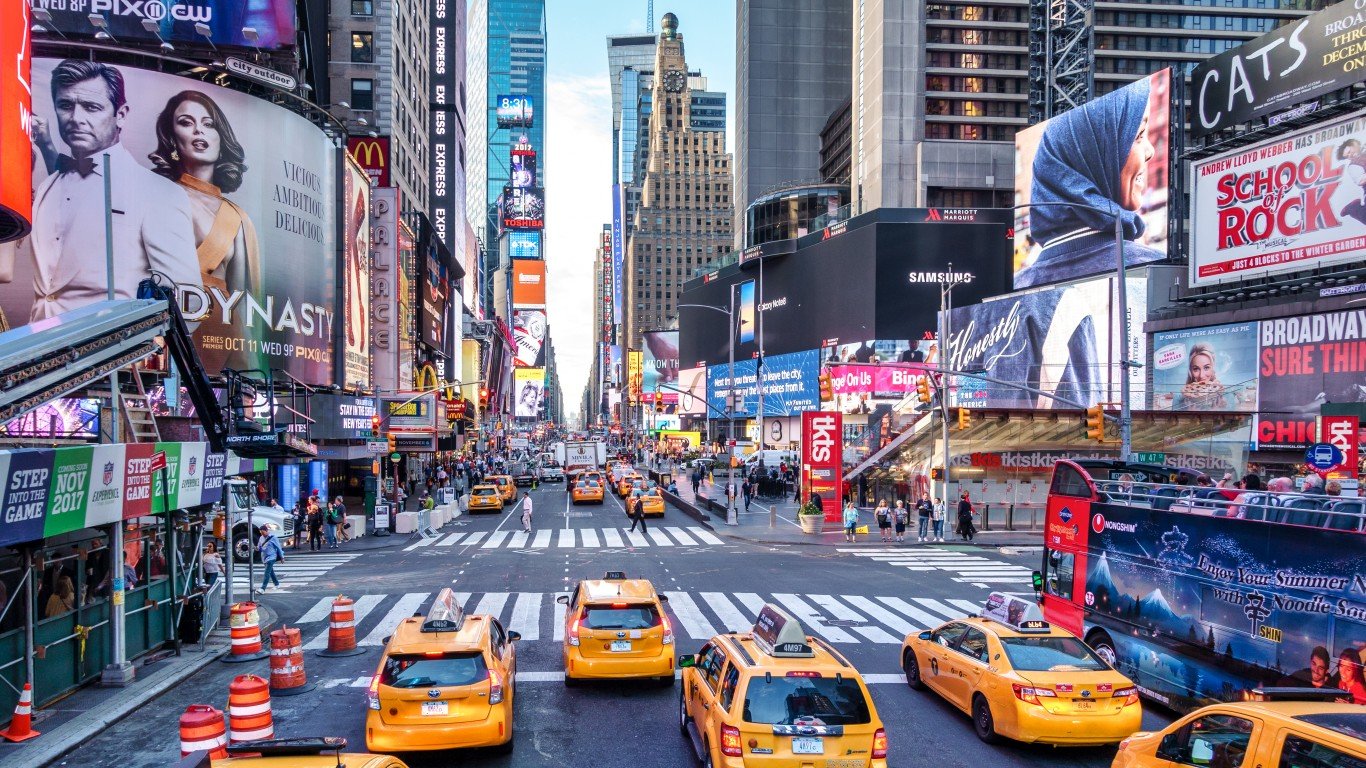
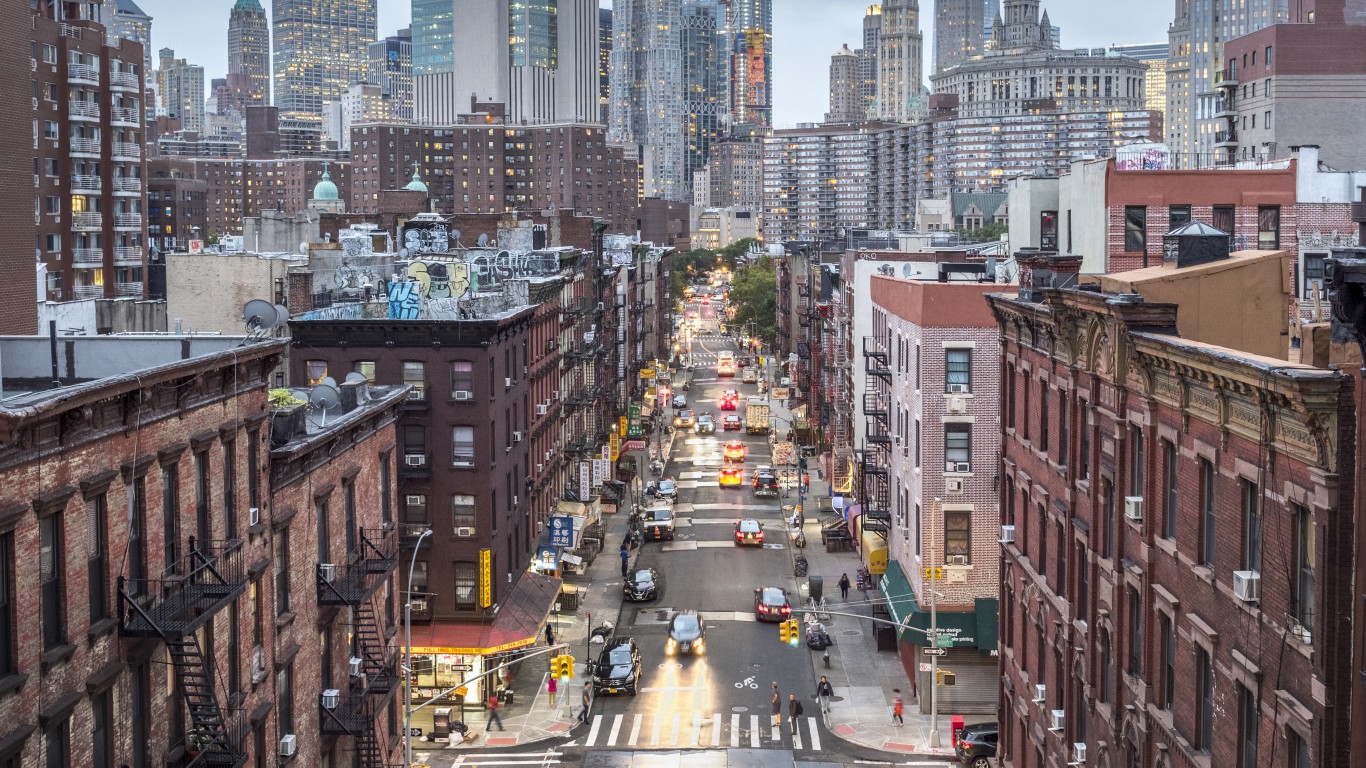
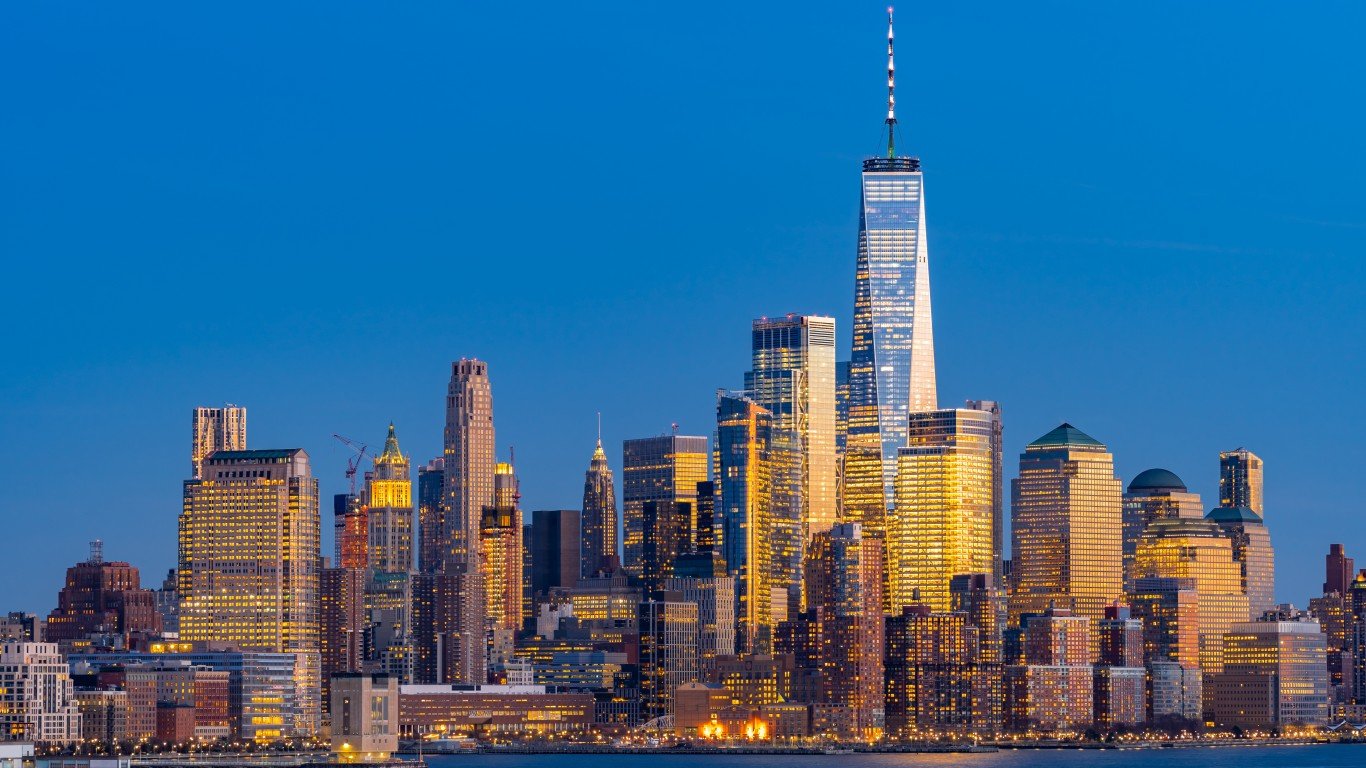
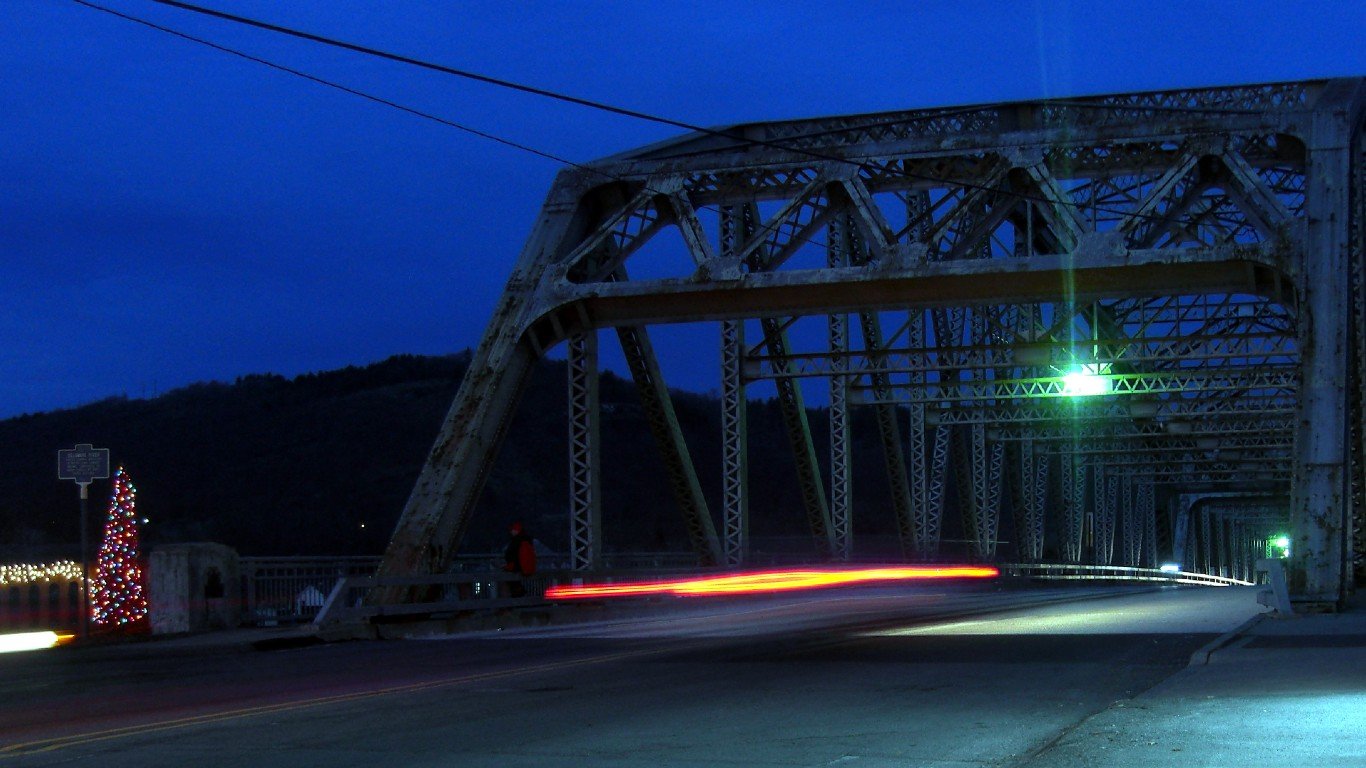
A disproportionate share of ZIP codes on this list are in New York, a city where a large share of commuters rely on the subway and bus systems. Public transportation is less direct than simply driving from door to door, which may help explain the longer than average commutes in and around the New York City area as well as other cities with broad public transit usage.
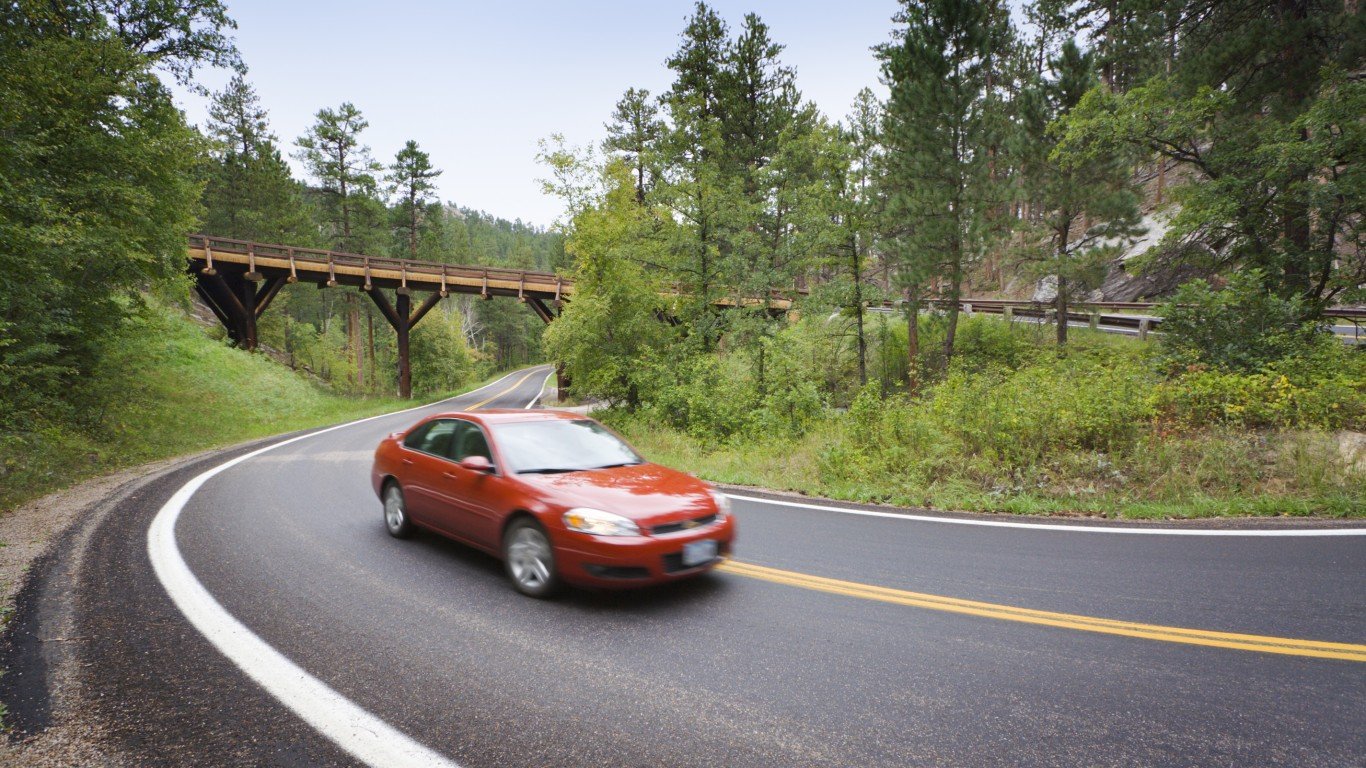
In contrast to the New York City areas, several ZIP codes on this list are relatively isolated, located well beyond the outskirts of the nearest major city. In many of these places, the share of commuters driving themselves to work far exceeds the 74.9% national average. Here is a look at the cities where people lose the most time driving each year.
Click here to see zip codes where it takes the longest to get to work
Click here to see our detailed methodology
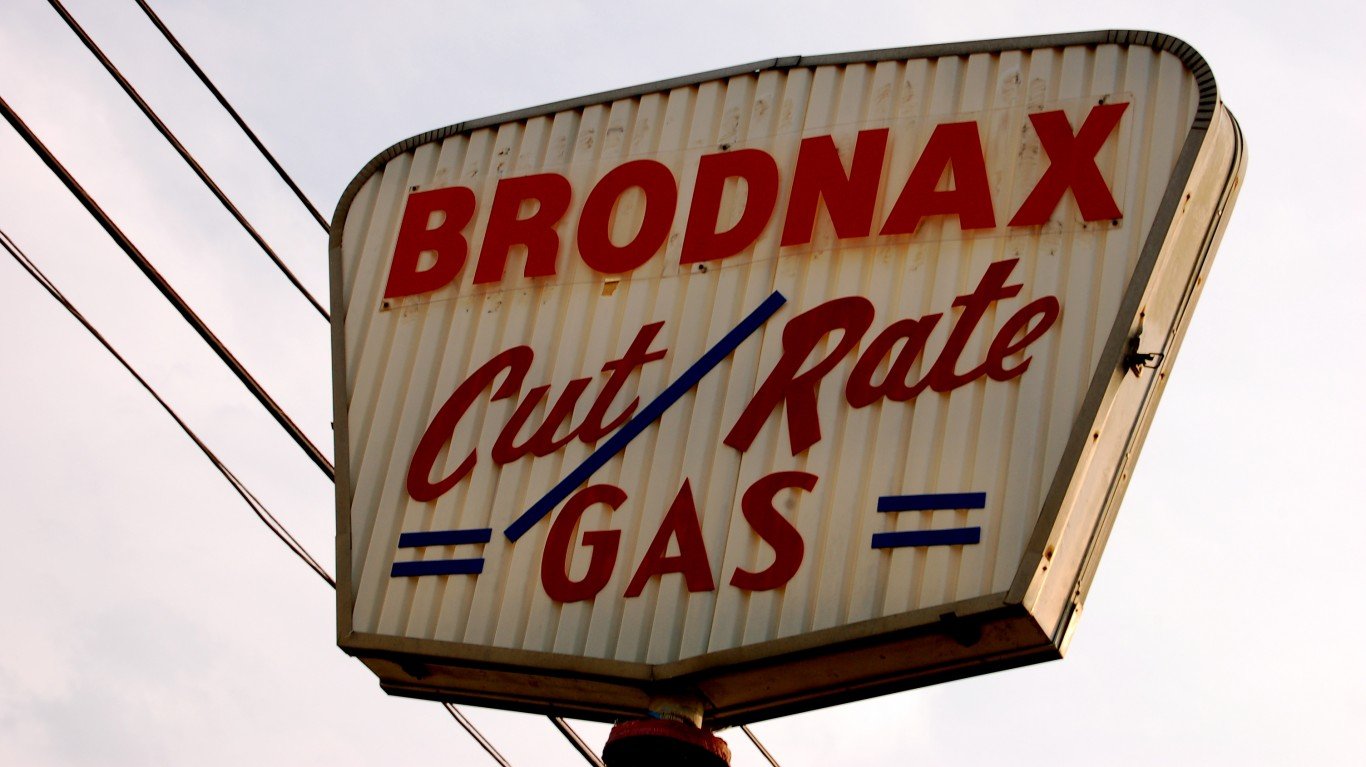
50. 23920
> Location: Brodnax, Virginia
> Avg. commute time (minutes): 47.6
> Share of commuters driving alone: 92.2% — 211th highest of 16,964 zip codes
> Share of commuters carpooling: 6.4% — 4,785th lowest of 16,964 zip codes
> Share of commuters using public transit: 0.0% reported — the lowest of 16,964 zip codes (tied)
[in-text-ad]
49. 07460
> Location: Stockholm, New Jersey
> Avg. commute time (minutes): 47.6
> Share of commuters driving alone: 80.9% — 7,578th highest of 16,964 zip codes
> Share of commuters carpooling: 9.3% — 6,643rd highest of 16,964 zip codes
> Share of commuters using public transit: 5.8% — 2,032nd highest of 16,964 zip codes
[recirclink id=987778]
48. 20106
> Location: Amissville, Virginia
> Avg. commute time (minutes): 47.7
> Share of commuters driving alone: 75.5% — 4,637th lowest of 16,964 zip codes
> Share of commuters carpooling: 14.0% — 1,567th highest of 16,964 zip codes
> Share of commuters using public transit: 1.1% — 6,220th highest of 16,964 zip codes

47. 11207
> Location: New York, New York
> Avg. commute time (minutes): 47.7
> Share of commuters driving alone: 20.9% — 141st lowest of 16,964 zip codes
> Share of commuters carpooling: 4.3% — 1,624th lowest of 16,964 zip codes
> Share of commuters using public transit: 64.3% — 36th highest of 16,964 zip codes
[in-text-ad-2]
46. 39483
> Location: Foxworth, Mississippi
> Avg. commute time (minutes): 47.8
> Share of commuters driving alone: 80.8% — 7,696th highest of 16,964 zip codes
> Share of commuters carpooling: 11.9% — 3,077th highest of 16,964 zip codes
> Share of commuters using public transit: 0.0% reported — the lowest of 16,964 zip codes (tied)
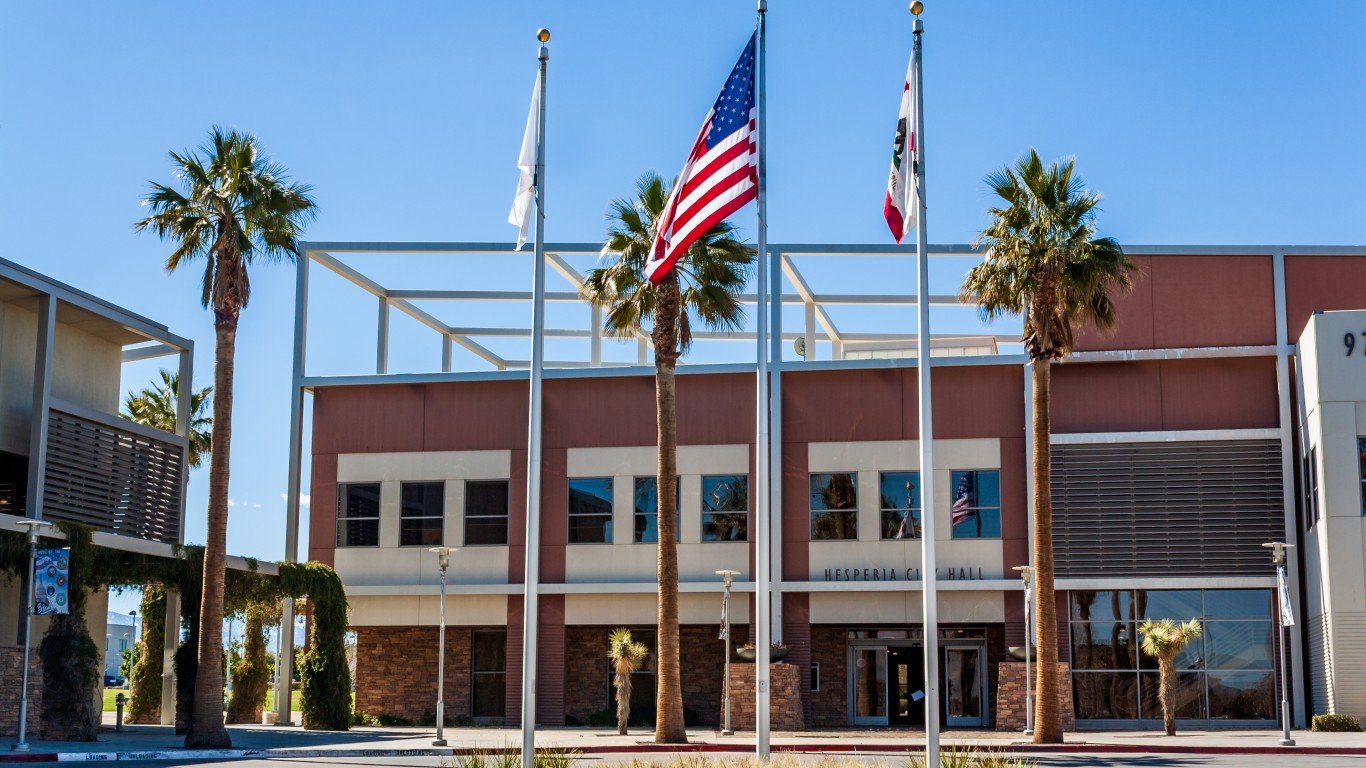
45. 92344
> Location: Hesperia, California
> Avg. commute time (minutes): 47.9
> Share of commuters driving alone: 83.3% — 5,070th highest of 16,964 zip codes
> Share of commuters carpooling: 12.0% — 2,960th highest of 16,964 zip codes
> Share of commuters using public transit: 0.0% reported — the lowest of 16,964 zip codes (tied)
[in-text-ad]

44. 10468
> Location: New York, New York
> Avg. commute time (minutes): 48.1
> Share of commuters driving alone: 14.2% — 91st lowest of 16,964 zip codes
> Share of commuters carpooling: 2.3% — 337th lowest of 16,964 zip codes
> Share of commuters using public transit: 68.5% — 12th highest of 16,964 zip codes
[recirclink id=1044820]

43. 11421
> Location: New York, New York
> Avg. commute time (minutes): 48.1
> Share of commuters driving alone: 28.8% — 209th lowest of 16,964 zip codes
> Share of commuters carpooling: 5.2% — 2,673rd lowest of 16,964 zip codes
> Share of commuters using public transit: 56.7% — 68th highest of 16,964 zip codes

42. 11419
> Location: New York, New York
> Avg. commute time (minutes): 48.3
> Share of commuters driving alone: 36.6% — 278th lowest of 16,964 zip codes
> Share of commuters carpooling: 8.8% — 7,530th highest of 16,964 zip codes
> Share of commuters using public transit: 47.9% — 106th highest of 16,964 zip codes
[in-text-ad-2]

41. 10462
> Location: New York, New York
> Avg. commute time (minutes): 48.3
> Share of commuters driving alone: 24.5% — 172nd lowest of 16,964 zip codes
> Share of commuters carpooling: 4.4% — 1,713th lowest of 16,964 zip codes
> Share of commuters using public transit: 58.8% — 62nd highest of 16,964 zip codes
40. 23086
> Location: Central Garage, Virginia
> Avg. commute time (minutes): 48.4
> Share of commuters driving alone: 85.6% — 2,911th highest of 16,964 zip codes
> Share of commuters carpooling: 4.4% — 1,765th lowest of 16,964 zip codes
> Share of commuters using public transit: 0.0% reported — the lowest of 16,964 zip codes (tied)
[in-text-ad]

39. 11413
> Location: New York, New York
> Avg. commute time (minutes): 48.4
> Share of commuters driving alone: 51.9% — 594th lowest of 16,964 zip codes
> Share of commuters carpooling: 4.8% — 2,131st lowest of 16,964 zip codes
> Share of commuters using public transit: 33.6% — 220th highest of 16,964 zip codes
[recirclink id=1054986]
38. 34759
> Location: Poinciana, Florida
> Avg. commute time (minutes): 48.4
> Share of commuters driving alone: 78.1% — 6,693rd lowest of 16,964 zip codes
> Share of commuters carpooling: 15.8% — 819th highest of 16,964 zip codes
> Share of commuters using public transit: 0.9% — 6,563rd highest of 16,964 zip codes
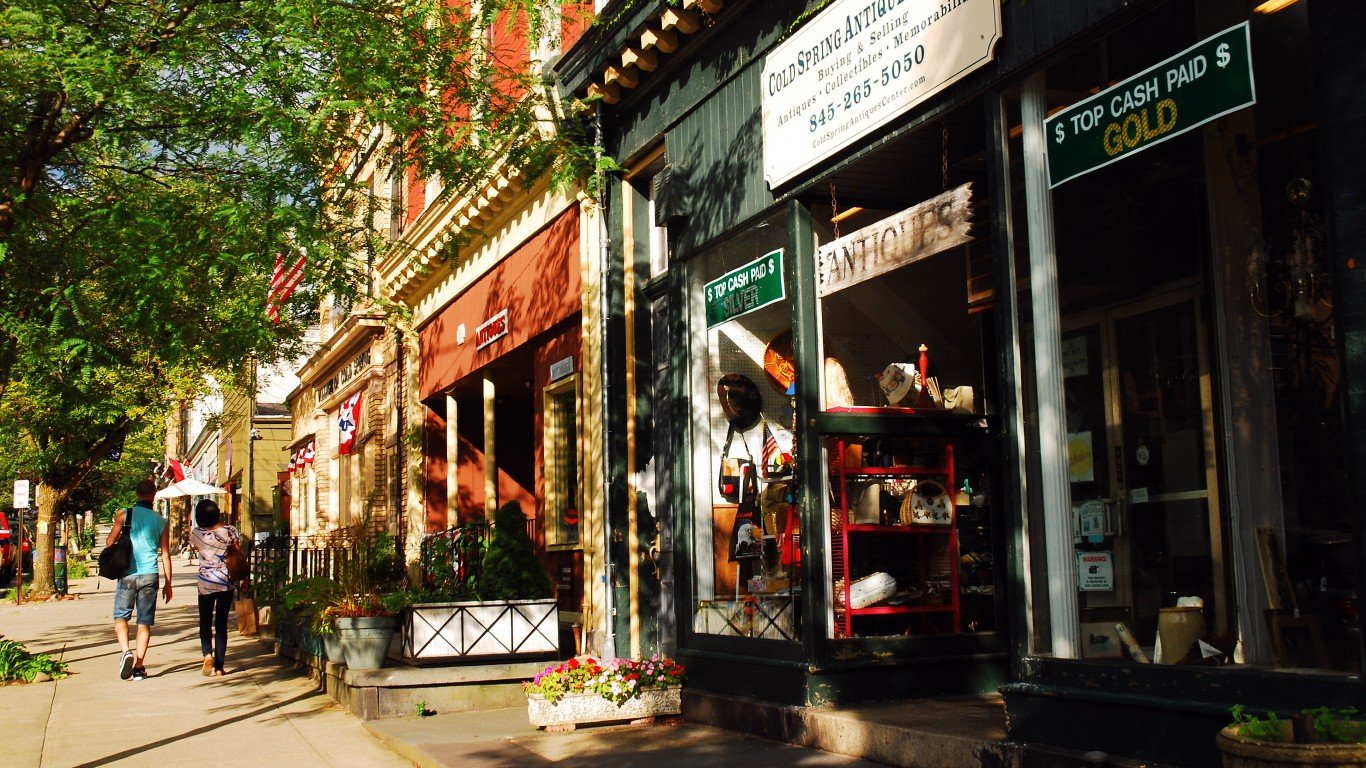
37. 10516
> Location: Cold Spring, New York
> Avg. commute time (minutes): 48.5
> Share of commuters driving alone: 45.7% — 437th lowest of 16,964 zip codes
> Share of commuters carpooling: 5.6% — 3,321st lowest of 16,964 zip codes
> Share of commuters using public transit: 21.8% — 441st highest of 16,964 zip codes
[in-text-ad-2]
36. 11229
> Location: New York, New York
> Avg. commute time (minutes): 48.5
> Share of commuters driving alone: 29.6% — 219th lowest of 16,964 zip codes
> Share of commuters carpooling: 5.8% — 3,701st lowest of 16,964 zip codes
> Share of commuters using public transit: 47.4% — 109th highest of 16,964 zip codes
35. 11433
> Location: New York, New York
> Avg. commute time (minutes): 48.6
> Share of commuters driving alone: 39.7% — 332nd lowest of 16,964 zip codes
> Share of commuters carpooling: 6.3% — 4,624th lowest of 16,964 zip codes
> Share of commuters using public transit: 46.8% — 113th highest of 16,964 zip codes
[in-text-ad]

34. 11434
> Location: New York, New York
> Avg. commute time (minutes): 48.9
> Share of commuters driving alone: 44.4% — 410th lowest of 16,964 zip codes
> Share of commuters carpooling: 4.5% — 1,865th lowest of 16,964 zip codes
> Share of commuters using public transit: 44.3% — 124th highest of 16,964 zip codes
[recirclink id=1060122]

33. 11411
> Location: New York, New York
> Avg. commute time (minutes): 49.3
> Share of commuters driving alone: 54.7% — 697th lowest of 16,964 zip codes
> Share of commuters carpooling: 4.9% — 2,314th lowest of 16,964 zip codes
> Share of commuters using public transit: 35.0% — 203rd highest of 16,964 zip codes

32. 11691
> Location: New York, New York
> Avg. commute time (minutes): 49.4
> Share of commuters driving alone: 43.3% — 384th lowest of 16,964 zip codes
> Share of commuters carpooling: 4.5% — 1,776th lowest of 16,964 zip codes
> Share of commuters using public transit: 38.3% — 165th highest of 16,964 zip codes
[in-text-ad-2]
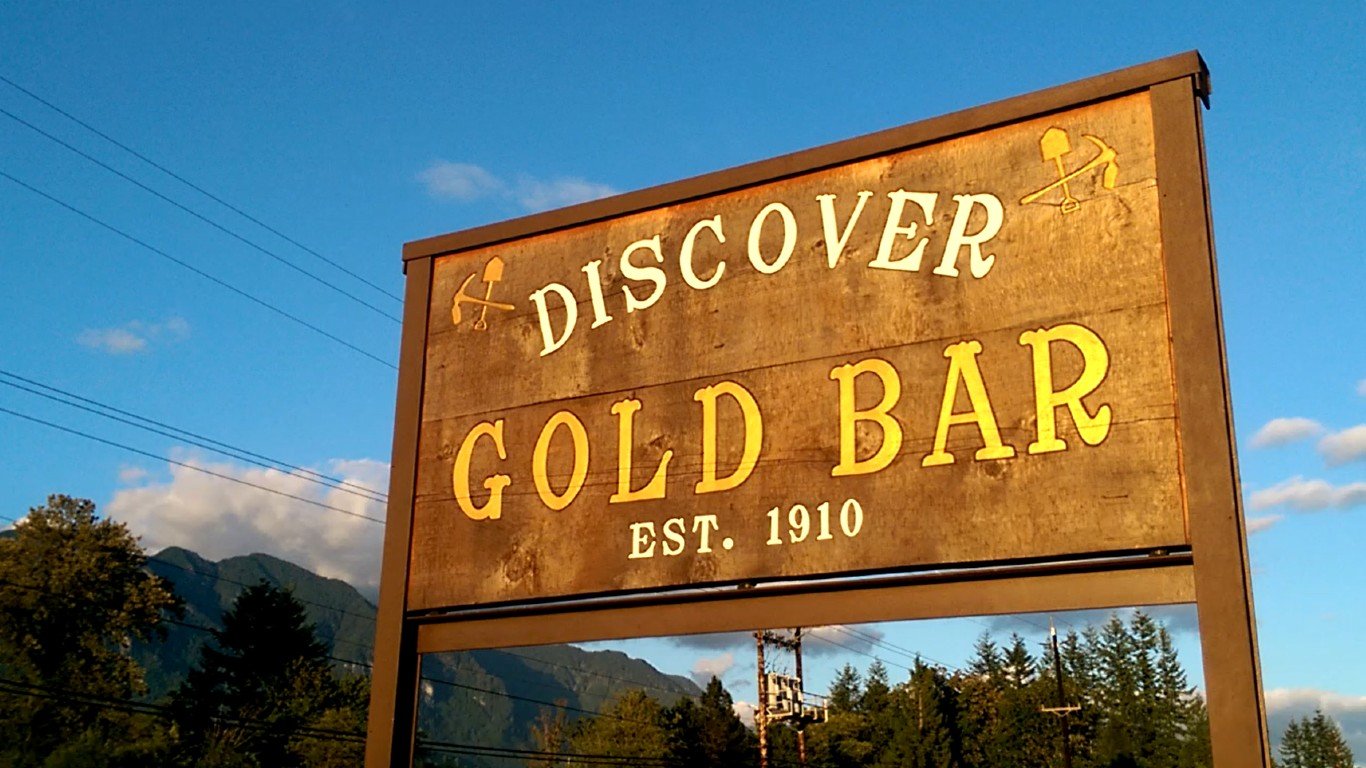
31. 98251
> Location: Gold Bar, Washington
> Avg. commute time (minutes): 49.6
> Share of commuters driving alone: 74.9% — 4,302nd lowest of 16,964 zip codes
> Share of commuters carpooling: 10.1% — 5,365th highest of 16,964 zip codes
> Share of commuters using public transit: 0.5% — 8,481st highest of 16,964 zip codes

30. 10475
> Location: New York, New York
> Avg. commute time (minutes): 49.6
> Share of commuters driving alone: 32.0% — 238th lowest of 16,964 zip codes
> Share of commuters carpooling: 2.5% — 408th lowest of 16,964 zip codes
> Share of commuters using public transit: 53.6% — 79th highest of 16,964 zip codes
[in-text-ad]
29. 70744
> Location: Holden, Louisiana
> Avg. commute time (minutes): 49.7
> Share of commuters driving alone: 89.8% — 672nd highest of 16,964 zip codes
> Share of commuters carpooling: 4.9% — 2,344th lowest of 16,964 zip codes
> Share of commuters using public transit: 0.0% reported — the lowest of 16,964 zip codes (tied)
[recirclink id=1024519]

28. 11212
> Location: New York, New York
> Avg. commute time (minutes): 49.7
> Share of commuters driving alone: 16.9% — 109th lowest of 16,964 zip codes
> Share of commuters carpooling: 4.1% — 1,426th lowest of 16,964 zip codes
> Share of commuters using public transit: 67.4% — 17th highest of 16,964 zip codes

27. 11693
> Location: New York, New York
> Avg. commute time (minutes): 49.8
> Share of commuters driving alone: 55.7% — 749th lowest of 16,964 zip codes
> Share of commuters carpooling: 2.0% — 238th lowest of 16,964 zip codes
> Share of commuters using public transit: 36.8% — 185th highest of 16,964 zip codes
[in-text-ad-2]
26. 95666
> Location: Buckhorn, California
> Avg. commute time (minutes): 49.9
> Share of commuters driving alone: 79.0% — 7,497th lowest of 16,964 zip codes
> Share of commuters carpooling: 8.3% — 8,420th highest of 16,964 zip codes
> Share of commuters using public transit: 1.2% — 5,977th highest of 16,964 zip codes

25. 11234
> Location: New York, New York
> Avg. commute time (minutes): 50.0
> Share of commuters driving alone: 39.4% — 326th lowest of 16,964 zip codes
> Share of commuters carpooling: 8.7% — 7,695th highest of 16,964 zip codes
> Share of commuters using public transit: 42.4% — 135th highest of 16,964 zip codes
[in-text-ad]
24. 92356
> Location: Lucerne Valley, California
> Avg. commute time (minutes): 50.2
> Share of commuters driving alone: 81.0% — 7,452nd highest of 16,964 zip codes
> Share of commuters carpooling: 6.2% — 4,392nd lowest of 16,964 zip codes
> Share of commuters using public transit: 1.0% — 6,417th highest of 16,964 zip codes
[recirclink id=987778]
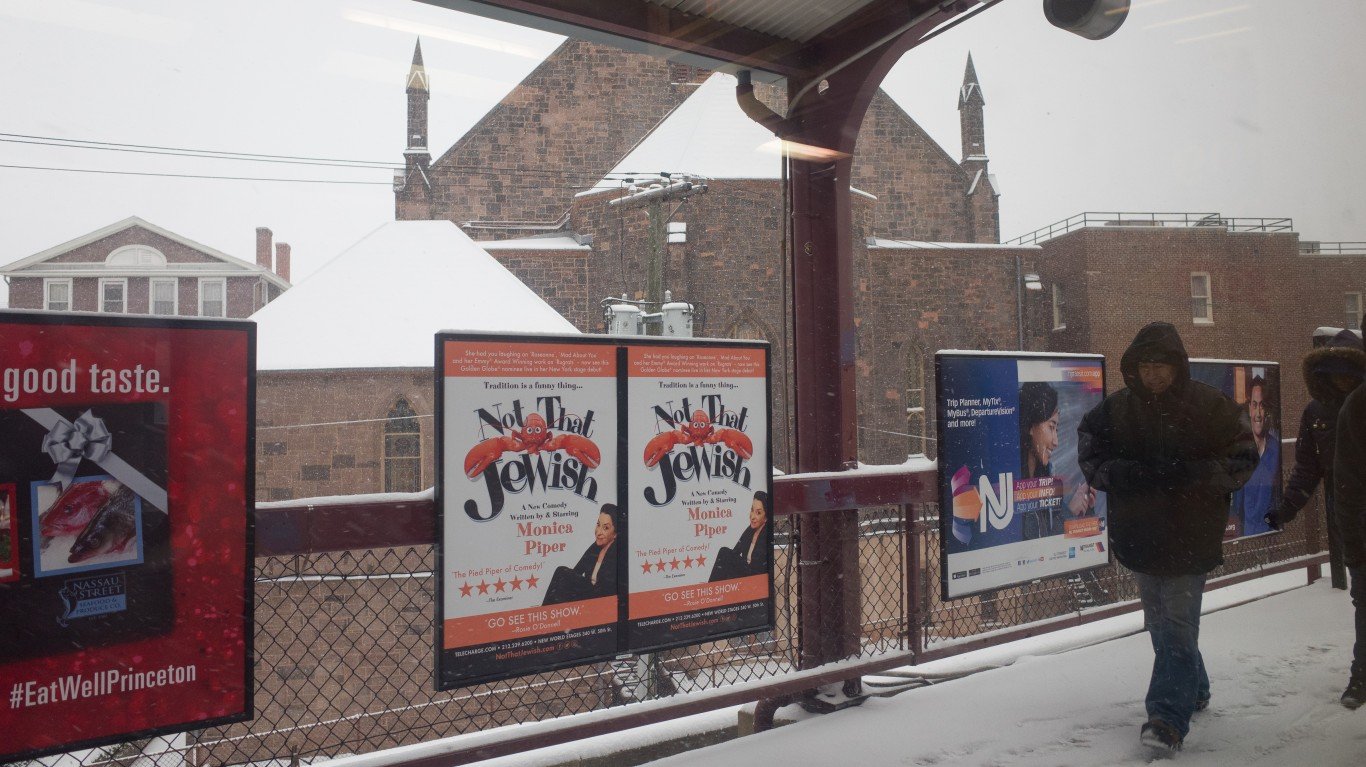
23. 08550
> Location: Princeton Junction, New Jersey
> Avg. commute time (minutes): 50.2
> Share of commuters driving alone: 51.8% — 589th lowest of 16,964 zip codes
> Share of commuters carpooling: 3.7% — 1,023rd lowest of 16,964 zip codes
> Share of commuters using public transit: 22.7% — 407th highest of 16,964 zip codes

22. 11236
> Location: New York, New York
> Avg. commute time (minutes): 50.3
> Share of commuters driving alone: 33.8% — 255th lowest of 16,964 zip codes
> Share of commuters carpooling: 6.4% — 4,663rd lowest of 16,964 zip codes
> Share of commuters using public transit: 53.5% — 80th highest of 16,964 zip codes
[in-text-ad-2]

21. 11422
> Location: New York, New York
> Avg. commute time (minutes): 50.4
> Share of commuters driving alone: 54.8% — 701st lowest of 16,964 zip codes
> Share of commuters carpooling: 6.5% — 5,066th lowest of 16,964 zip codes
> Share of commuters using public transit: 30.9% — 250th highest of 16,964 zip codes

20. 11429
> Location: New York, New York
> Avg. commute time (minutes): 50.6
> Share of commuters driving alone: 46.2% — 450th lowest of 16,964 zip codes
> Share of commuters carpooling: 8.0% — 7,995th lowest of 16,964 zip codes
> Share of commuters using public transit: 38.0% — 168th highest of 16,964 zip codes
[in-text-ad]
19. 20637
> Location: Hughesville, Maryland
> Avg. commute time (minutes): 50.6
> Share of commuters driving alone: 77.0% — 5,717th lowest of 16,964 zip codes
> Share of commuters carpooling: 6.4% — 4,660th lowest of 16,964 zip codes
> Share of commuters using public transit: 9.0% — 1,306th highest of 16,964 zip codes
[recirclink id=1044820]
18. 93510
> Location: Acton, California
> Avg. commute time (minutes): 50.8
> Share of commuters driving alone: 78.8% — 7,283rd lowest of 16,964 zip codes
> Share of commuters carpooling: 11.2% — 3,824th highest of 16,964 zip codes
> Share of commuters using public transit: 0.8% — 7,018th highest of 16,964 zip codes
17. 07421
> Location: Hewitt, New Jersey
> Avg. commute time (minutes): 51.1
> Share of commuters driving alone: 71.1% — 2,688th lowest of 16,964 zip codes
> Share of commuters carpooling: 7.7% — 7,271st lowest of 16,964 zip codes
> Share of commuters using public transit: 4.8% — 2,375th highest of 16,964 zip codes
[in-text-ad-2]
16. 93591
> Location: Lake Los Angeles, California
> Avg. commute time (minutes): 51.3
> Share of commuters driving alone: 82.3% — 6,077th highest of 16,964 zip codes
> Share of commuters carpooling: 6.5% — 4,860th lowest of 16,964 zip codes
> Share of commuters using public transit: 0.6% — 7,927th highest of 16,964 zip codes
15. 94531
> Location: Antioch, California
> Avg. commute time (minutes): 51.3
> Share of commuters driving alone: 64.7% — 1,422nd lowest of 16,964 zip codes
> Share of commuters carpooling: 16.5% — 651st highest of 16,964 zip codes
> Share of commuters using public transit: 7.9% — 1,517th highest of 16,964 zip codes
[in-text-ad]
14. 25434
> Location: Paw Paw, West Virginia
> Avg. commute time (minutes): 51.4
> Share of commuters driving alone: 79.1% — 7,577th lowest of 16,964 zip codes
> Share of commuters carpooling: 5.6% — 3,288th lowest of 16,964 zip codes (tied)
> Share of commuters using public transit: 0.0% reported — the lowest of 16,964 zip codes (tied)
[recirclink id=1054986]

13. 11224
> Location: New York, New York
> Avg. commute time (minutes): 51.7
> Share of commuters driving alone: 24.2% — 170th lowest of 16,964 zip codes
> Share of commuters carpooling: 3.8% — 1,154th lowest of 16,964 zip codes
> Share of commuters using public transit: 55.6% — 76th highest of 16,964 zip codes
12. 22642
> Location: Apple Mountain Lake, Virginia
> Avg. commute time (minutes): 51.8
> Share of commuters driving alone: 75.6% — 4,714th lowest of 16,964 zip codes
> Share of commuters carpooling: 15.0% — 1,107th highest of 16,964 zip codes
> Share of commuters using public transit: 0.0% reported — the lowest of 16,964 zip codes (tied)
[in-text-ad-2]

11. 18328
> Location: Birchwood Lakes, Pennsylvania
> Avg. commute time (minutes): 52.0
> Share of commuters driving alone: 76.4% — 5,259th lowest of 16,964 zip codes
> Share of commuters carpooling: 11.4% — 3,533rd highest of 16,964 zip codes
> Share of commuters using public transit: 1.1% — 6,224th highest of 16,964 zip codes
10. 20616
> Location: Bryans Road, Maryland
> Avg. commute time (minutes): 52.9
> Share of commuters driving alone: 81.7% — 6,795th highest of 16,964 zip codes
> Share of commuters carpooling: 7.4% — 6,658th lowest of 16,964 zip codes
> Share of commuters using public transit: 6.4% — 1,900th highest of 16,964 zip codes
[in-text-ad]
9. 18302
> Location: Saw Creek, Pennsylvania
> Avg. commute time (minutes): 54.2
> Share of commuters driving alone: 74.2% — 3,947th lowest of 16,964 zip codes
> Share of commuters carpooling: 11.3% — 3,677th highest of 16,964 zip codes
> Share of commuters using public transit: 7.6% — 1,577th highest of 16,964 zip codes
[recirclink id=1060122]
8. 11239
> Location: New York, New York
> Avg. commute time (minutes): 54.4
> Share of commuters driving alone: 24.9% — 176th lowest of 16,964 zip codes
> Share of commuters carpooling: 3.8% — 1,135th lowest of 16,964 zip codes
> Share of commuters using public transit: 57.5% — 63rd highest of 16,964 zip codes
7. 71433
> Location: Glenmora, Louisiana
> Avg. commute time (minutes): 55.0
> Share of commuters driving alone: 61.8% — 1,122nd lowest of 16,964 zip codes
> Share of commuters carpooling: 11.3% — 3,675th highest of 16,964 zip codes
> Share of commuters using public transit: 0.0% reported — the lowest of 16,964 zip codes (tied)
[in-text-ad-2]
6. 85736
> Location: Three Points, Arizona
> Avg. commute time (minutes): 55.4
> Share of commuters driving alone: 83.1% — 5,195th highest of 16,964 zip codes
> Share of commuters carpooling: 6.6% — 5,153rd lowest of 16,964 zip codes
> Share of commuters using public transit: 0.0% reported — the lowest of 16,964 zip codes (tied)

5. 11692
> Location: New York, New York
> Avg. commute time (minutes): 55.8
> Share of commuters driving alone: 40.5% — 348th lowest of 16,964 zip codes
> Share of commuters carpooling: 6.5% — 4,954th lowest of 16,964 zip codes
> Share of commuters using public transit: 45.7% — 116th highest of 16,964 zip codes
[in-text-ad]

4. 98266
> Location: Peaceful Valley, Washington
> Avg. commute time (minutes): 58.9
> Share of commuters driving alone: 80.2% — 8,234th highest of 16,964 zip codes
> Share of commuters carpooling: 14.2% — 1,446th highest of 16,964 zip codes
> Share of commuters using public transit: 0.0% reported — the lowest of 16,964 zip codes (tied)
[recirclink id=1024519]
3. 18324
> Location: Saw Creek, Pennsylvania
> Avg. commute time (minutes): 64.4
> Share of commuters driving alone: 76.7% — 5,570th lowest of 16,964 zip codes
> Share of commuters carpooling: 10.0% — 5,470th highest of 16,964 zip codes (tied)
> Share of commuters using public transit: 5.5% — 2,127th highest of 16,964 zip codes

2. 96737
> Location: Hawaiian Ocean View, Hawaii
> Avg. commute time (minutes): 65.6
> Share of commuters driving alone: 52.0% — 595th lowest of 16,964 zip codes
> Share of commuters carpooling: 39.2% — 5th highest of 16,964 zip codes
> Share of commuters using public transit: 0.0% reported — the lowest of 16,964 zip codes (tied)
[in-text-ad-2]
1. 95391
> Location: Mountain House, California
> Avg. commute time (minutes): 66.3
> Share of commuters driving alone: 64.2% — 1,353rd lowest of 16,964 zip codes
> Share of commuters carpooling: 16.3% — 692nd highest of 16,964 zip codes
> Share of commuters using public transit: 6.1% — 1,956th highest of 16,964 zip codes
Methodology
To determine the ZIP codes with the longest commutes, 24/7 Wall St. reviewed five-year estimates of average commute times from the U.S. Census Bureau’s 2020 American Community Survey.
We used ZIP code tabulation areas — a census geography type that defines areal representations of United States Postal Service zip codes (USPS ZIP codes do not define geographic boundaries but instead are a network of mail delivery routes in a service area). We refer to census ZCTAs as ZIP codes.
ZIP codes were excluded if average commute time estimates were not available in the 2020 ACS, if there were fewer than 1,000 workers 16 years and over who did not work from home, or if the sampling error associated with a ZIP code’s data was deemed too high.
The sampling error was defined as too high if the coefficient of variation — a statistical assessment of how reliable an estimate is — for a ZIP code’s average commute time was above 15% and greater than two standard deviations above the mean CV for all ZIP codes’ average commute times. We similarly excluded ZIP codes that had a sampling error too high for their population, using the same definition.
ZIP codes were ranked based on their average commute time. To break ties, we used the share of workers with a commute of 45 minutes or longer.
Additional information on the share of commuters driving alone, carpooling, and using public transit are also five-year estimates from the 2020 ACS.
Contact [email protected] for any questions or corrections.