Motor vehicle theft, one of the most serious offenses tracked by the FBI, is on the rise in the United States. There were a total of 810,400 motor vehicle thefts nationwide in 2020, up 12% from the previous year and the most in over a decade.
Motor vehicle theft can be either the theft or attempted theft of a vehicle, such as a car or ATV. Some experts attribute the rising rates of vehicle theft to the COVID-19 pandemic, which led to vehicles sitting unattended and unused for longer stretches than usual. Here is a look at the 10 most stolen cars in America.
While cases of motor vehicle theft are surging across the country, some major metropolitan areas are bucking the national trend, reporting substantial year-over-year declines in vehicle theft cases per capita.
Using data from the FBI’s 2020 Uniform Crime Report, 24/7 Wall St. identified the 50 metro areas where vehicle theft is falling fastest. Metro areas are ranked by the year-over-year change in the number of reported vehicle thefts per 100,000 people. Among the metro areas on this list, the vehicle theft rate fell anywhere from nine incidents per 100,000 people to 138 per 100,000 people. For context, the national motor vehicle theft rate climbed by 25 incidents per 100,000 people in 2020.
Vehicle theft – along with larceny and burglary – is one component of the overall property crime category. Due in part to falling rates of vehicle theft, the vast majority of metro areas on this list reported a decline in the overall property crime rate in 2020. Here is a look at the cities where property crime is falling fastest.
The metro areas that reported the largest declines in vehicle thefts are concentrated in the South and the West. California alone is home to nine, more than any other state. Despite the decline in cases of vehicle theft, in nearly half of the metro areas on this list, the vehicle theft rate remains higher than the national rate of 246 per 100,000 people.
Click here to see the metros where the motor vehicle theft rate is falling
Click here to read our detailed methodology
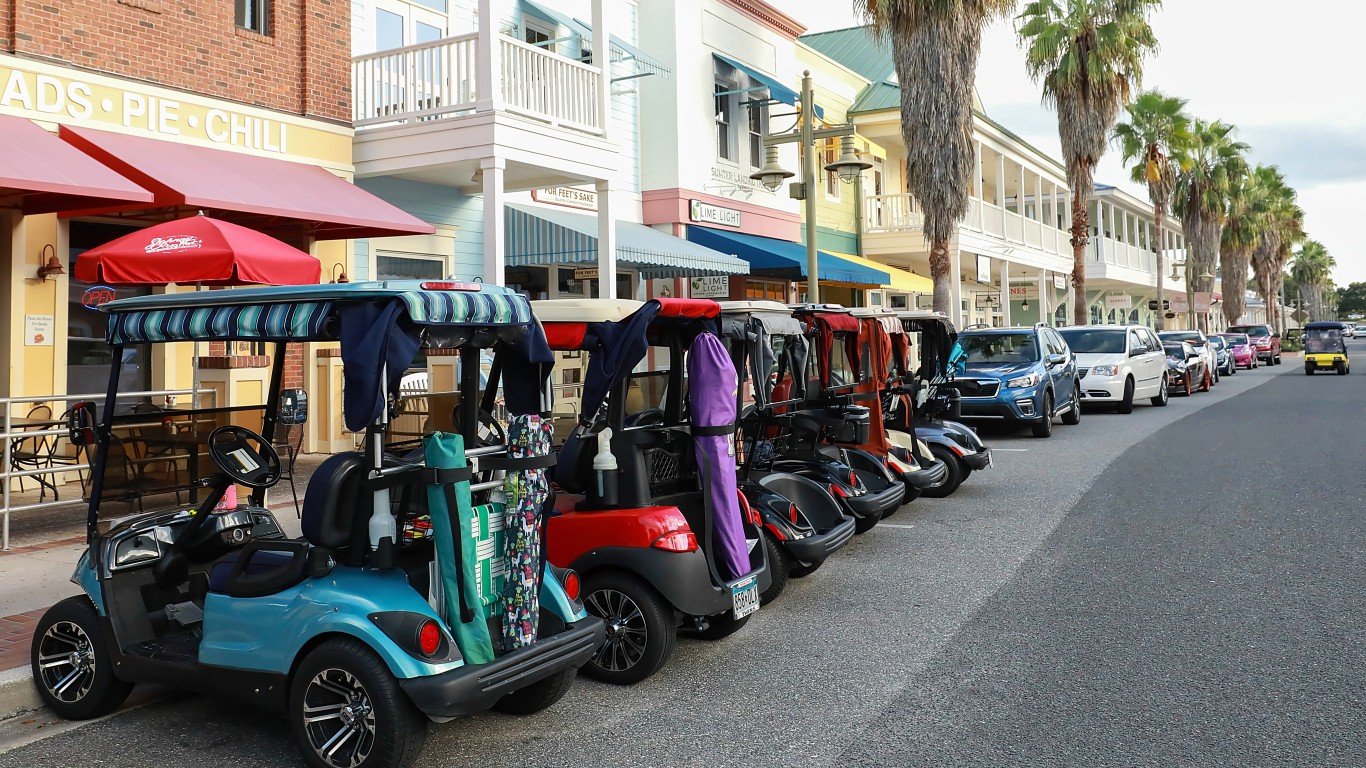
50. The Villages, FL
> Change in reported vehicle theft rate, 2019-2020: -8.6
> Vehicle-thefts reported in 2020: 110 – 19th lowest of 212 metros
> Vehicle-thefts per 100K people in 2020: 80.2 – 20th lowest of 212 metros
> 1-yr. change in all property crime: -151.7 – 81st highest of 188 metros
> Property crimes per 100K people in 2020: 705.3 – 2nd lowest of 198 metros
> Population: 132,420
[in-text-ad]

49. Visalia, CA
> Change in reported vehicle theft rate, 2019-2020: -8.7
> Vehicle-thefts reported in 2020: 1,802 – 38th highest of 212 metros
> Vehicle-thefts per 100K people in 2020: 388.2 – 23rd highest of 212 metros
> 1-yr. change in all property crime: -260.5 – 66th lowest of 188 metros
> Property crimes per 100K people in 2020: 2,025.2 – 92nd highest of 198 metros
> Population: 466,195
[recirclink id=1016086]

48. Twin Falls, ID
> Change in reported vehicle theft rate, 2019-2020: -9.1
> Vehicle-thefts reported in 2020: 90 – 11th lowest of 212 metros
> Vehicle-thefts per 100K people in 2020: 79.3 – 19th lowest of 212 metros
> 1-yr. change in all property crime: N/A
> Property crimes per 100K people in 2020: N/A
> Population: 109,784

47. San Diego-Chula Vista-Carlsbad, CA
> Change in reported vehicle theft rate, 2019-2020: -10.0
> Vehicle-thefts reported in 2020: 9,307 – 9th highest of 212 metros
> Vehicle-thefts per 100K people in 2020: 279.3 – 55th highest of 212 metros
> 1-yr. change in all property crime: -166.1 – 89th highest of 188 metros
> Property crimes per 100K people in 2020: 1,484.8 – 51st lowest of 198 metros
> Population: 3,338,330
[in-text-ad-2]

46. St. George, UT
> Change in reported vehicle theft rate, 2019-2020: -11.1
> Vehicle-thefts reported in 2020: 193 – 48th lowest of 212 metros (tied)
> Vehicle-thefts per 100K people in 2020: 106.0 – 41st lowest of 212 metros
> 1-yr. change in all property crime: -277.8 – 62nd lowest of 188 metros
> Property crimes per 100K people in 2020: 1,163.3 – 24th lowest of 198 metros
> Population: 177,556

45. Palm Bay-Melbourne-Titusville, FL
> Change in reported vehicle theft rate, 2019-2020: -11.1
> Vehicle-thefts reported in 2020: 872 – 72nd highest of 212 metros
> Vehicle-thefts per 100K people in 2020: 143.7 – 70th lowest of 212 metros
> 1-yr. change in all property crime: -289.9 – 56th lowest of 188 metros
> Property crimes per 100K people in 2020: 1,756.6 – 74th lowest of 198 metros
> Population: 601,942
[in-text-ad]

44. El Centro, CA
> Change in reported vehicle theft rate, 2019-2020: -11.2
> Vehicle-thefts reported in 2020: 465 – 104th lowest of 212 metros
> Vehicle-thefts per 100K people in 2020: 258.1 – 62nd highest of 212 metros
> 1-yr. change in all property crime: -39.8 – 45th highest of 188 metros
> Property crimes per 100K people in 2020: 1,957.5 – 98th lowest of 198 metros
> Population: 181,215
[recirclink id=1062431]

43. Albuquerque, NM
> Change in reported vehicle theft rate, 2019-2020: -11.5
> Vehicle-thefts reported in 2020: 6,120 – 13th highest of 212 metros
> Vehicle-thefts per 100K people in 2020: 662.5 – 2nd highest of 212 metros
> 1-yr. change in all property crime: N/A
> Property crimes per 100K people in 2020: 3,654.1 – 5th highest of 198 metros
> Population: 914,480

42. Sacramento-Roseville-Folsom, CA
> Change in reported vehicle theft rate, 2019-2020: -11.7
> Vehicle-thefts reported in 2020: 6,434 – 12th highest of 212 metros
> Vehicle-thefts per 100K people in 2020: 272.1 – 58th highest of 212 metros
> 1-yr. change in all property crime: -178.6 – 92nd lowest of 188 metros
> Property crimes per 100K people in 2020: 2,015.3 – 94th highest of 198 metros
> Population: 2,363,730
[in-text-ad-2]
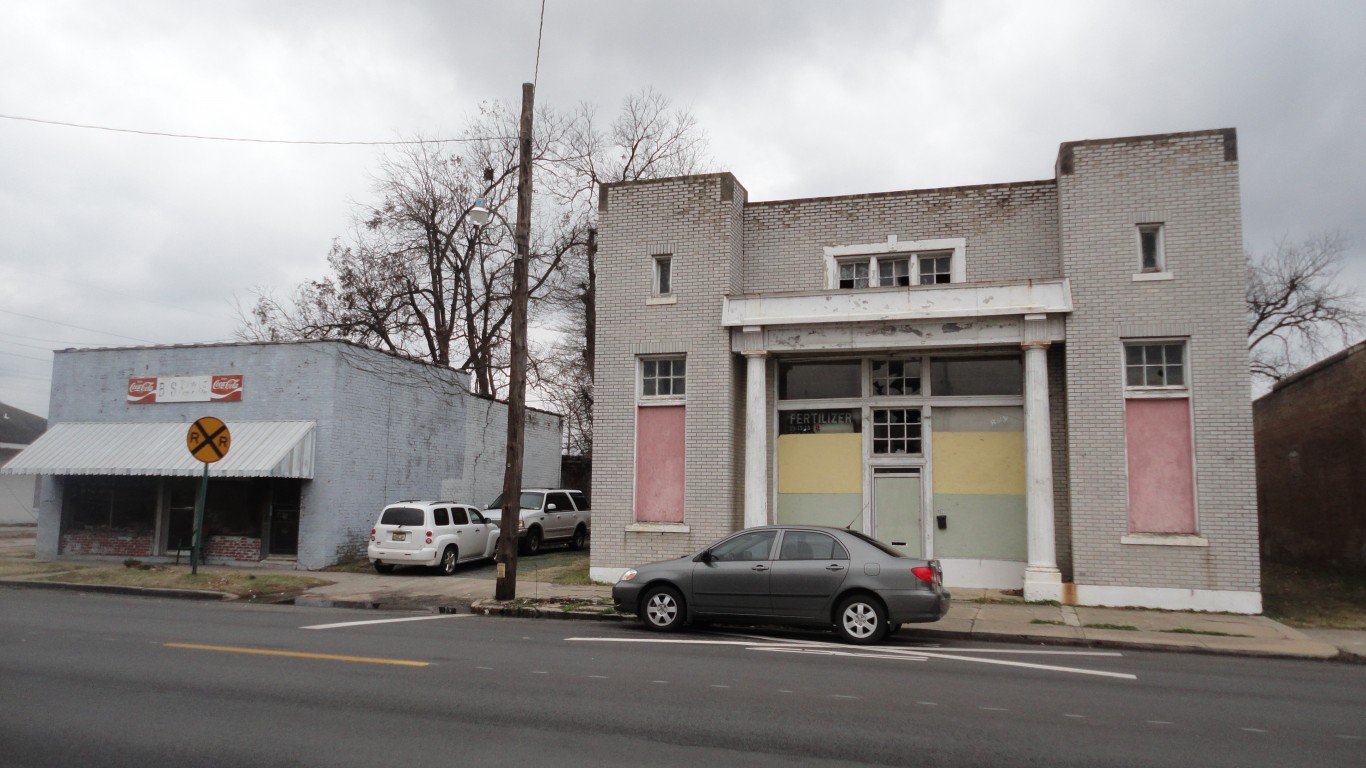
41. Pine Bluff, AR
> Change in reported vehicle theft rate, 2019-2020: -13.7
> Vehicle-thefts reported in 2020: 350 – 84th lowest of 212 metros
> Vehicle-thefts per 100K people in 2020: 404.4 – 19th highest of 212 metros
> 1-yr. change in all property crime: N/A
> Property crimes per 100K people in 2020: 3,048.3 – 17th highest of 198 metros
> Population: 89,437

40. Victoria, TX
> Change in reported vehicle theft rate, 2019-2020: -14.6
> Vehicle-thefts reported in 2020: 162 – 36th lowest of 212 metros
> Vehicle-thefts per 100K people in 2020: 161.9 – 85th lowest of 212 metros
> 1-yr. change in all property crime: -255.4 – 68th lowest of 188 metros
> Property crimes per 100K people in 2020: 2,203.9 – 66th highest of 198 metros
> Population: 99,090
[in-text-ad]

39. Yakima, WA
> Change in reported vehicle theft rate, 2019-2020: -14.7
> Vehicle-thefts reported in 2020: 1,067 – 56th highest of 212 metros
> Vehicle-thefts per 100K people in 2020: 425.5 – 16th highest of 212 metros
> 1-yr. change in all property crime: +126.3 – 17th highest of 188 metros
> Property crimes per 100K people in 2020: 2,725.4 – 29th highest of 198 metros
> Population: 250,873
[recirclink id=1066891]

38. Huntington-Ashland, WV-KY-OH
> Change in reported vehicle theft rate, 2019-2020: -15.0
> Vehicle-thefts reported in 2020: 501 – 104th highest of 212 metros
> Vehicle-thefts per 100K people in 2020: 141.6 – 69th lowest of 212 metros
> 1-yr. change in all property crime: -201.9 – 78th lowest of 188 metros
> Property crimes per 100K people in 2020: 1,472.9 – 48th lowest of 198 metros
> Population: 355,873

37. Wilmington, NC
> Change in reported vehicle theft rate, 2019-2020: -16.3
> Vehicle-thefts reported in 2020: 363 – 88th lowest of 212 metros
> Vehicle-thefts per 100K people in 2020: 120.0 – 53rd lowest of 212 metros
> 1-yr. change in all property crime: -179.7 – 91st lowest of 188 metros
> Property crimes per 100K people in 2020: 2,001.9 – 96th highest of 198 metros
> Population: 297,533
[in-text-ad-2]
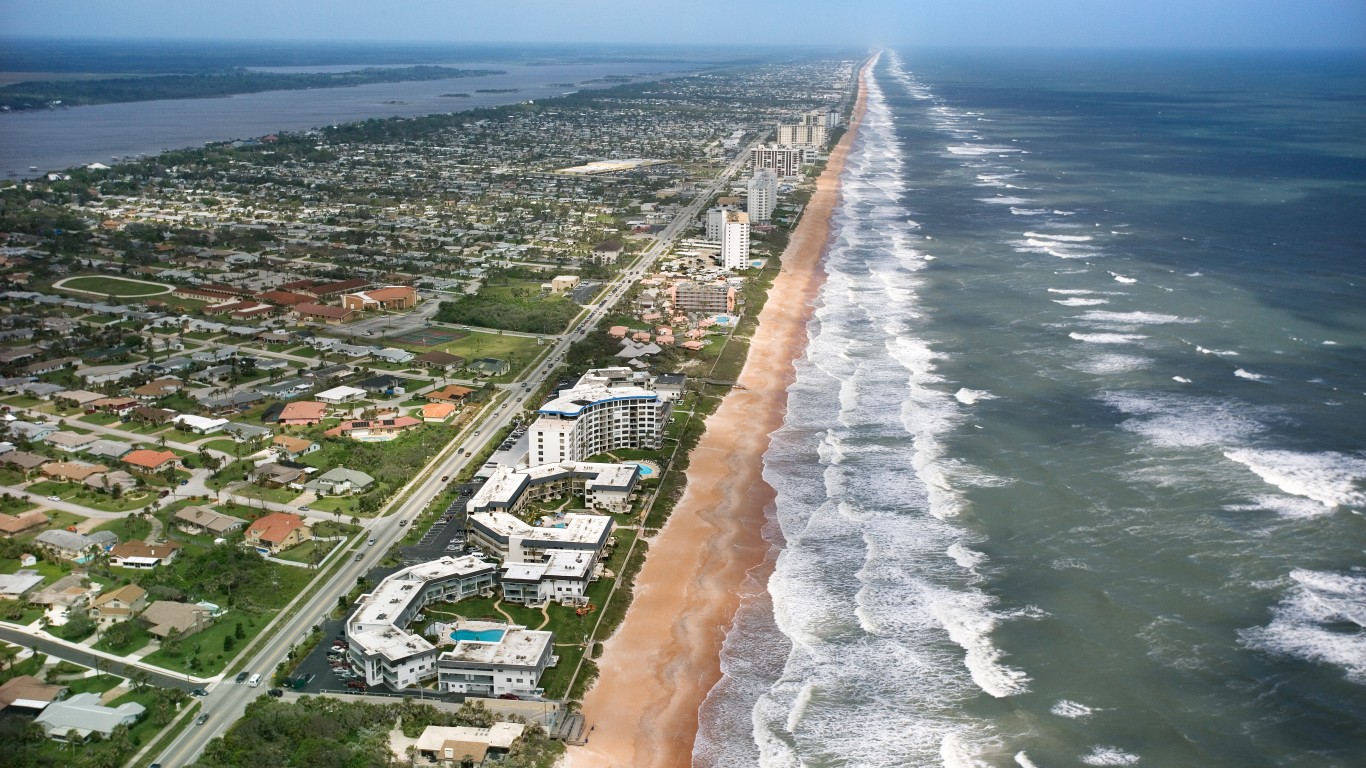
36. Deltona-Daytona Beach-Ormond Beach, FL
> Change in reported vehicle theft rate, 2019-2020: -16.3
> Vehicle-thefts reported in 2020: 835 – 77th highest of 212 metros
> Vehicle-thefts per 100K people in 2020: 123.6 – 56th lowest of 212 metros
> 1-yr. change in all property crime: -352.7 – 35th lowest of 188 metros
> Property crimes per 100K people in 2020: 1,452.7 – 46th lowest of 198 metros
> Population: 668,365

35. Columbus, OH
> Change in reported vehicle theft rate, 2019-2020: -16.9
> Vehicle-thefts reported in 2020: 4,353 – 18th highest of 212 metros
> Vehicle-thefts per 100K people in 2020: 202.9 – 93rd highest of 212 metros
> 1-yr. change in all property crime: -180.4 – 90th lowest of 188 metros
> Property crimes per 100K people in 2020: 2,209.9 – 65th highest of 198 metros
> Population: 2,122,271
[in-text-ad]

34. Richmond, VA
> Change in reported vehicle theft rate, 2019-2020: -18.1
> Vehicle-thefts reported in 2020: 1,887 – 37th highest of 212 metros
> Vehicle-thefts per 100K people in 2020: 144.8 – 72nd lowest of 212 metros
> 1-yr. change in all property crime: -326.6 – 43rd lowest of 188 metros
> Property crimes per 100K people in 2020: 1,834.5 – 84th lowest of 198 metros
> Population: 1,290,866
[recirclink id=1033410]
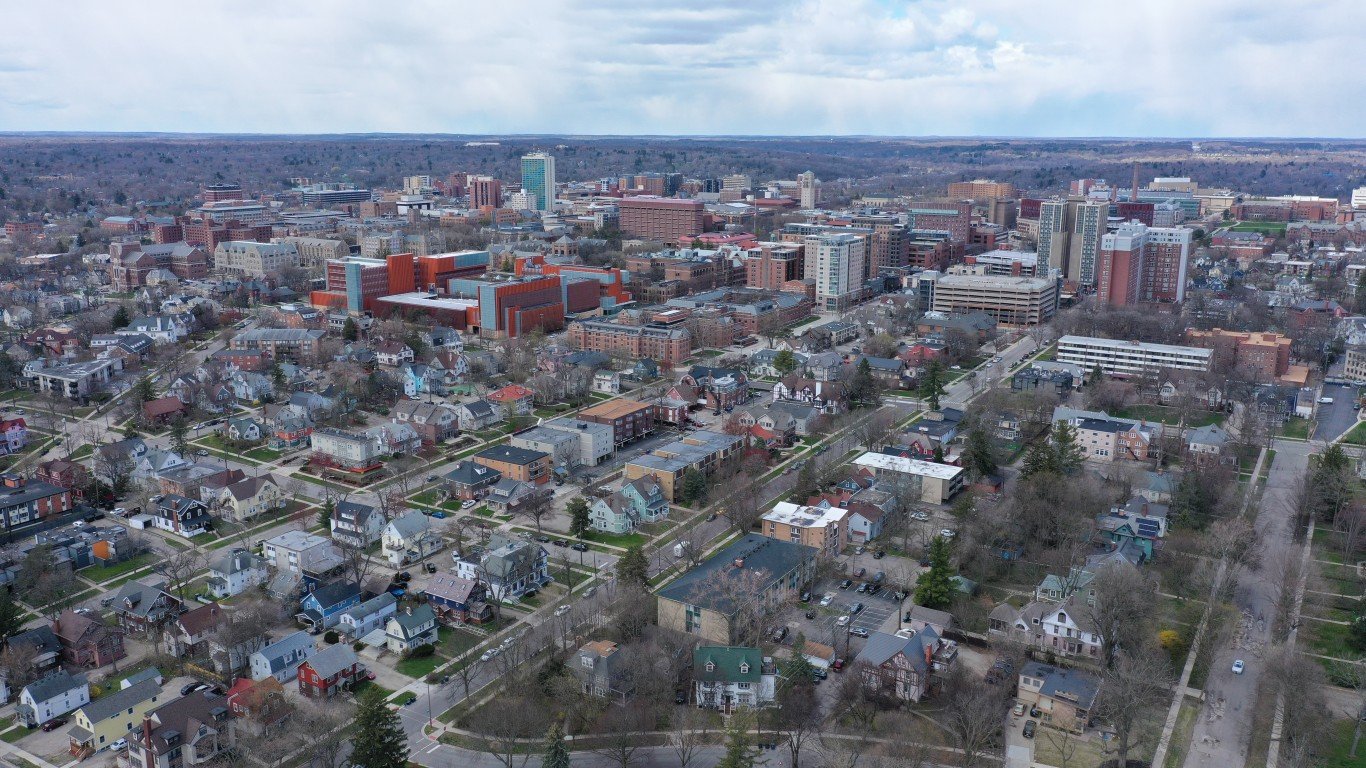
33. Ann Arbor, MI
> Change in reported vehicle theft rate, 2019-2020: -18.3
> Vehicle-thefts reported in 2020: 403 – 97th lowest of 212 metros
> Vehicle-thefts per 100K people in 2020: 109.3 – 46th lowest of 212 metros
> 1-yr. change in all property crime: -383.8 – 29th lowest of 188 metros
> Property crimes per 100K people in 2020: 1,266.0 – 28th lowest of 198 metros
> Population: 367,601

32. Grants Pass, OR
> Change in reported vehicle theft rate, 2019-2020: -18.3
> Vehicle-thefts reported in 2020: 284 – 71st lowest of 212 metros
> Vehicle-thefts per 100K people in 2020: 324.3 – 36th highest of 212 metros
> 1-yr. change in all property crime: -163.6 – 87th highest of 188 metros
> Property crimes per 100K people in 2020: 1,712.8 – 71st lowest of 198 metros
> Population: 87,487
[in-text-ad-2]

31. Clarksville, TN-KY
> Change in reported vehicle theft rate, 2019-2020: -18.7
> Vehicle-thefts reported in 2020: 630 – 91st highest of 212 metros
> Vehicle-thefts per 100K people in 2020: 202.0 – 97th highest of 212 metros
> 1-yr. change in all property crime: -407.9 – 24th lowest of 188 metros
> Property crimes per 100K people in 2020: 1,852.5 – 85th lowest of 198 metros
> Population: 311,073

30. Staunton, VA
> Change in reported vehicle theft rate, 2019-2020: -19.2
> Vehicle-thefts reported in 2020: 118 – 22nd lowest of 212 metros (tied)
> Vehicle-thefts per 100K people in 2020: 95.5 – 31st lowest of 212 metros
> 1-yr. change in all property crime: +37.6 – 31st highest of 188 metros
> Property crimes per 100K people in 2020: 1,466.4 – 47th lowest of 198 metros
> Population: 123,120
[in-text-ad]

29. Merced, CA
> Change in reported vehicle theft rate, 2019-2020: -20.9
> Vehicle-thefts reported in 2020: 1,346 – 45th highest of 212 metros
> Vehicle-thefts per 100K people in 2020: 485.4 – 11th highest of 212 metros
> 1-yr. change in all property crime: -364.4 – 34th lowest of 188 metros
> Property crimes per 100K people in 2020: 2,146.0 – 77th highest of 198 metros
> Population: 277,680
[recirclink id=1026293]
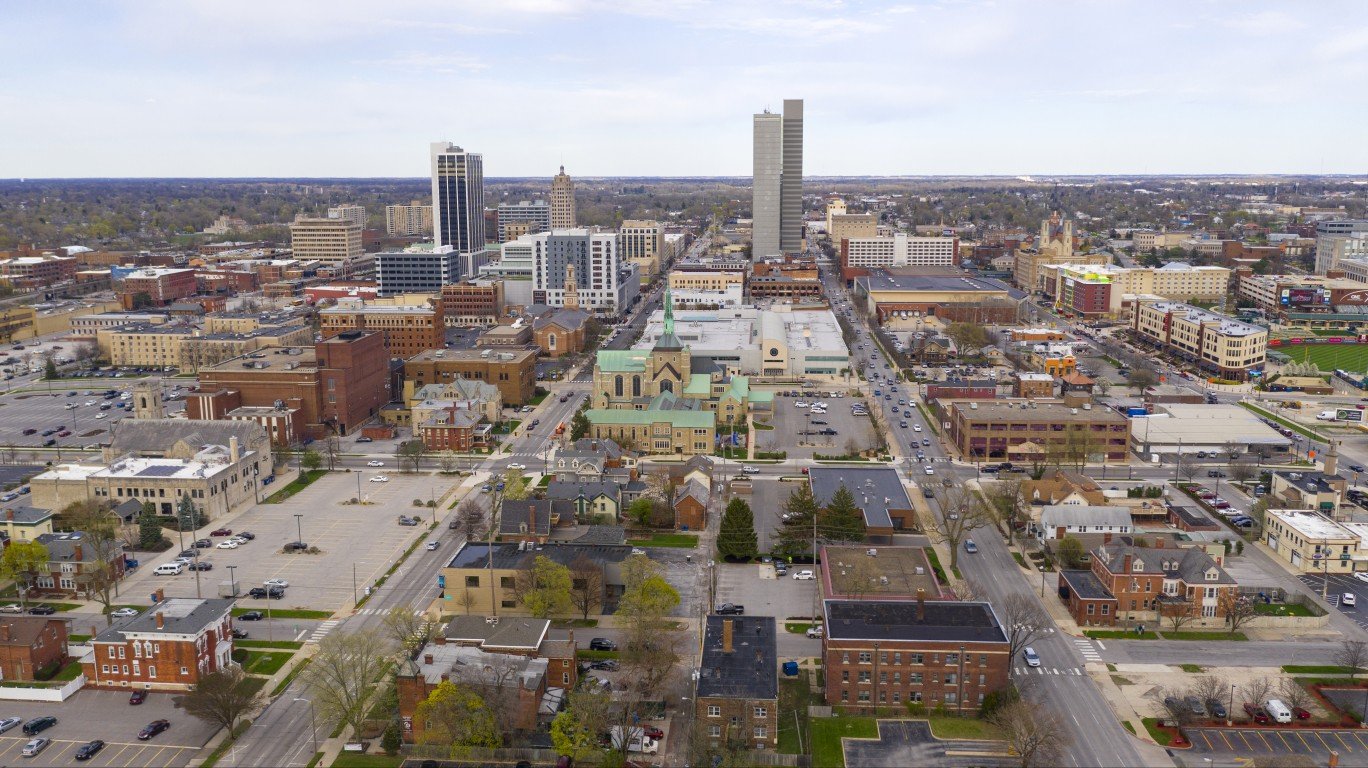
28. Fort Wayne, IN
> Change in reported vehicle theft rate, 2019-2020: -20.9
> Vehicle-thefts reported in 2020: 633 – 90th highest of 212 metros
> Vehicle-thefts per 100K people in 2020: 152.3 – 81st lowest of 212 metros
> 1-yr. change in all property crime: -365.5 – 33rd lowest of 188 metros
> Property crimes per 100K people in 2020: 1,748.2 – 73rd lowest of 198 metros
> Population: 413,263

27. Detroit-Warren-Dearborn, MI
> Change in reported vehicle theft rate, 2019-2020: -22.3
> Vehicle-thefts reported in 2020: 10,326 – 7th highest of 212 metros
> Vehicle-thefts per 100K people in 2020: 239.7 – 73rd highest of 212 metros
> 1-yr. change in all property crime: -349.1 – 38th lowest of 188 metros
> Property crimes per 100K people in 2020: 1,333.3 – 37th lowest of 198 metros
> Population: 4,319,629
[in-text-ad-2]
26. Omaha-Council Bluffs, NE-IA
> Change in reported vehicle theft rate, 2019-2020: -23.1
> Vehicle-thefts reported in 2020: 4,012 – 19th highest of 212 metros
> Vehicle-thefts per 100K people in 2020: 420.2 – 17th highest of 212 metros
> 1-yr. change in all property crime: -365.7 – 32nd lowest of 188 metros
> Property crimes per 100K people in 2020: 2,280.9 – 58th highest of 198 metros
> Population: 949,726

25. Coeur d’Alene, ID
> Change in reported vehicle theft rate, 2019-2020: -24.7
> Vehicle-thefts reported in 2020: 96 – 15th lowest of 212 metros
> Vehicle-thefts per 100K people in 2020: 56.4 – 7th lowest of 212 metros
> 1-yr. change in all property crime: -208.2 – 76th lowest of 188 metros
> Property crimes per 100K people in 2020: 1,061.5 – 14th lowest of 198 metros
> Population: 165,697
[in-text-ad]

24. Salinas, CA
> Change in reported vehicle theft rate, 2019-2020: -25.5
> Vehicle-thefts reported in 2020: 1,529 – 42nd highest of 212 metros
> Vehicle-thefts per 100K people in 2020: 354.2 – 33rd highest of 212 metros
> 1-yr. change in all property crime: +9.3 – 36th highest of 188 metros
> Property crimes per 100K people in 2020: 1,790.1 – 77th lowest of 198 metros
> Population: 434,061
[recirclink id=1016086]

23. Yuma, AZ
> Change in reported vehicle theft rate, 2019-2020: -25.6
> Vehicle-thefts reported in 2020: 398 – 96th lowest of 212 metros
> Vehicle-thefts per 100K people in 2020: 183.6 – 103rd lowest of 212 metros
> 1-yr. change in all property crime: -238.5 – 71st lowest of 188 metros
> Property crimes per 100K people in 2020: 1,492.0 – 52nd lowest of 198 metros
> Population: 213,787
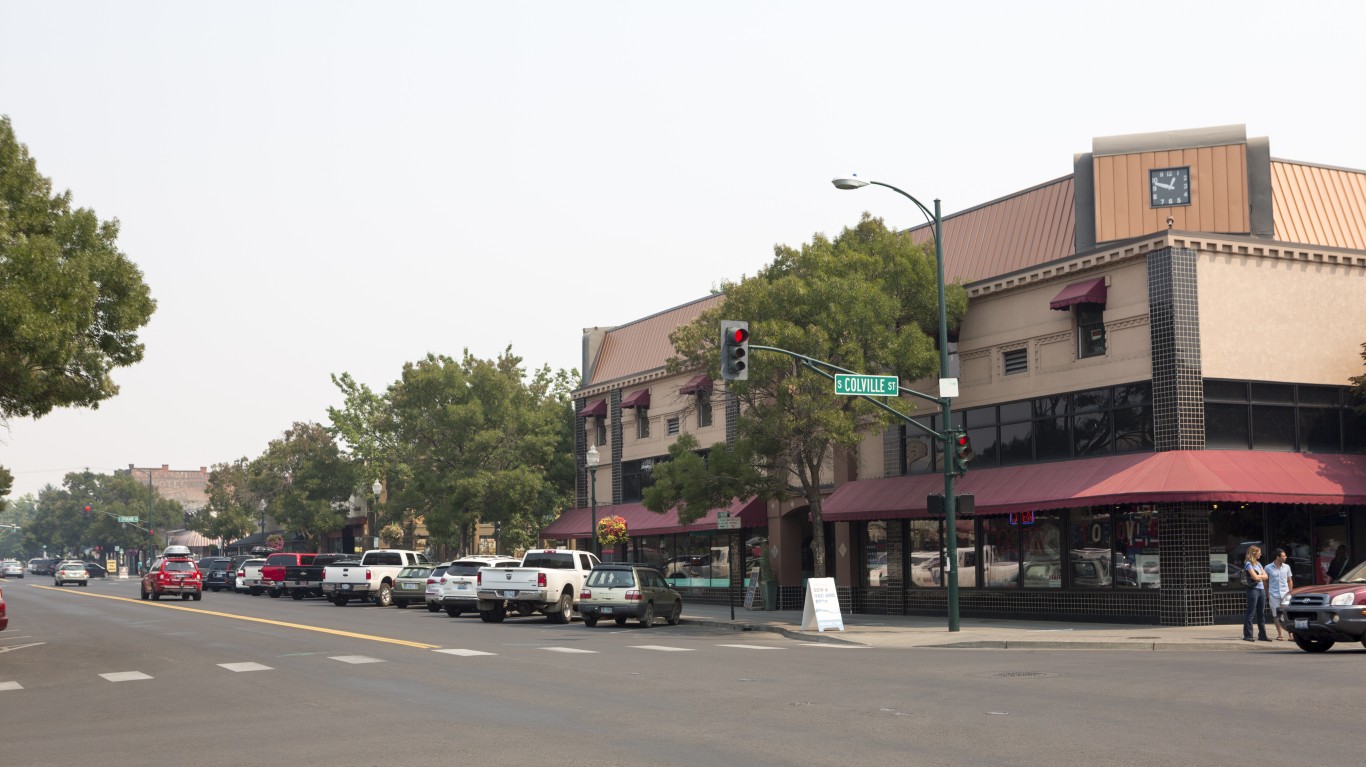
22. Walla Walla, WA
> Change in reported vehicle theft rate, 2019-2020: -25.8
> Vehicle-thefts reported in 2020: 92 – 12th lowest of 212 metros (tied)
> Vehicle-thefts per 100K people in 2020: 151.4 – 79th lowest of 212 metros
> 1-yr. change in all property crime: -341.1 – 40th lowest of 188 metros
> Property crimes per 100K people in 2020: 2,085.0 – 85th highest of 198 metros
> Population: 60,760
[in-text-ad-2]

21. Columbia, SC
> Change in reported vehicle theft rate, 2019-2020: -28.2
> Vehicle-thefts reported in 2020: 3,234 – 23rd highest of 212 metros
> Vehicle-thefts per 100K people in 2020: 381.6 – 25th highest of 212 metros
> 1-yr. change in all property crime: -100.3 – 67th highest of 188 metros
> Property crimes per 100K people in 2020: 3,272.0 – 14th highest of 198 metros
> Population: 839,039

20. Stockton, CA
> Change in reported vehicle theft rate, 2019-2020: -28.2
> Vehicle-thefts reported in 2020: 2,897 – 24th highest of 212 metros
> Vehicle-thefts per 100K people in 2020: 379.6 – 28th highest of 212 metros
> 1-yr. change in all property crime: -503.4 – 14th lowest of 188 metros
> Property crimes per 100K people in 2020: 2,332.8 – 54th highest of 198 metros
> Population: 762,148
[in-text-ad]

19. Las Vegas-Henderson-Paradise, NV
> Change in reported vehicle theft rate, 2019-2020: -29.0
> Vehicle-thefts reported in 2020: 8,564 – 10th highest of 212 metros
> Vehicle-thefts per 100K people in 2020: 370.1 – 30th highest of 212 metros
> 1-yr. change in all property crime: -517.5 – 11th lowest of 188 metros
> Property crimes per 100K people in 2020: 2,046.5 – 90th highest of 198 metros
> Population: 2,266,715
[recirclink id=1062431]

18. Tallahassee, FL
> Change in reported vehicle theft rate, 2019-2020: -29.4
> Vehicle-thefts reported in 2020: 840 – 76th highest of 212 metros
> Vehicle-thefts per 100K people in 2020: 216.4 – 86th highest of 212 metros
> 1-yr. change in all property crime: -703.9 – 4th lowest of 188 metros
> Property crimes per 100K people in 2020: 2,226.7 – 62nd highest of 198 metros
> Population: 386,454

17. Orlando-Kissimmee-Sanford, FL
> Change in reported vehicle theft rate, 2019-2020: -29.6
> Vehicle-thefts reported in 2020: 4,770 – 16th highest of 212 metros
> Vehicle-thefts per 100K people in 2020: 179.4 – 100th lowest of 212 metros
> 1-yr. change in all property crime: -537.9 – 9th lowest of 188 metros
> Property crimes per 100K people in 2020: 1,862.1 – 88th lowest of 198 metros
> Population: 2,608,147
[in-text-ad-2]

16. Sumter, SC
> Change in reported vehicle theft rate, 2019-2020: -31.3
> Vehicle-thefts reported in 2020: 286 – 72nd lowest of 212 metros (tied)
> Vehicle-thefts per 100K people in 2020: 203.7 – 92nd highest of 212 metros
> 1-yr. change in all property crime: -407.1 – 25th lowest of 188 metros
> Property crimes per 100K people in 2020: 2,743.6 – 28th highest of 198 metros
> Population: 140,466

15. Enid, OK
> Change in reported vehicle theft rate, 2019-2020: -32.2
> Vehicle-thefts reported in 2020: 107 – 17th lowest of 212 metros (tied)
> Vehicle-thefts per 100K people in 2020: 175.1 – 96th lowest of 212 metros
> 1-yr. change in all property crime: -401.9 – 27th lowest of 188 metros
> Property crimes per 100K people in 2020: 2,579.7 – 36th highest of 198 metros
> Population: 61,056
[in-text-ad]

14. Hot Springs, AR
> Change in reported vehicle theft rate, 2019-2020: -33.0
> Vehicle-thefts reported in 2020: 323 – 77th lowest of 212 metros
> Vehicle-thefts per 100K people in 2020: 323.8 – 37th highest of 212 metros
> 1-yr. change in all property crime: N/A
> Property crimes per 100K people in 2020: 3,583.5 – 8th highest of 198 metros
> Population: 99,386
[recirclink id=1066891]
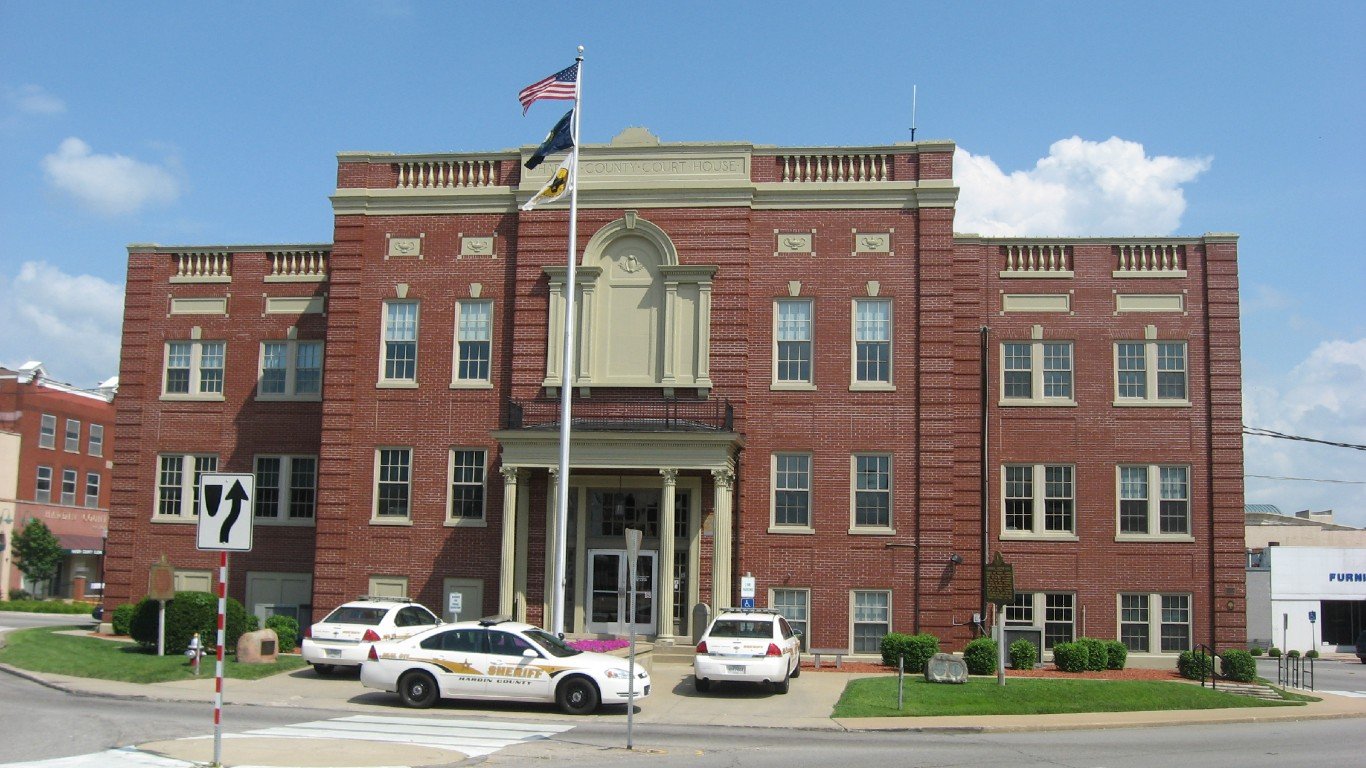
13. Elizabethtown-Fort Knox, KY
> Change in reported vehicle theft rate, 2019-2020: -33.3
> Vehicle-thefts reported in 2020: 171 – 42nd lowest of 212 metros
> Vehicle-thefts per 100K people in 2020: 110.9 – 49th lowest of 212 metros
> 1-yr. change in all property crime: -300.2 – 49th lowest of 188 metros
> Property crimes per 100K people in 2020: 833.8 – 4th lowest of 198 metros
> Population: 154,713

12. Panama City, FL
> Change in reported vehicle theft rate, 2019-2020: -33.5
> Vehicle-thefts reported in 2020: 384 – 93rd lowest of 212 metros
> Vehicle-thefts per 100K people in 2020: 219.6 – 83rd highest of 212 metros
> 1-yr. change in all property crime: -421.7 – 23rd lowest of 188 metros
> Property crimes per 100K people in 2020: 2,645.6 – 34th highest of 198 metros
> Population: 174,705
[in-text-ad-2]
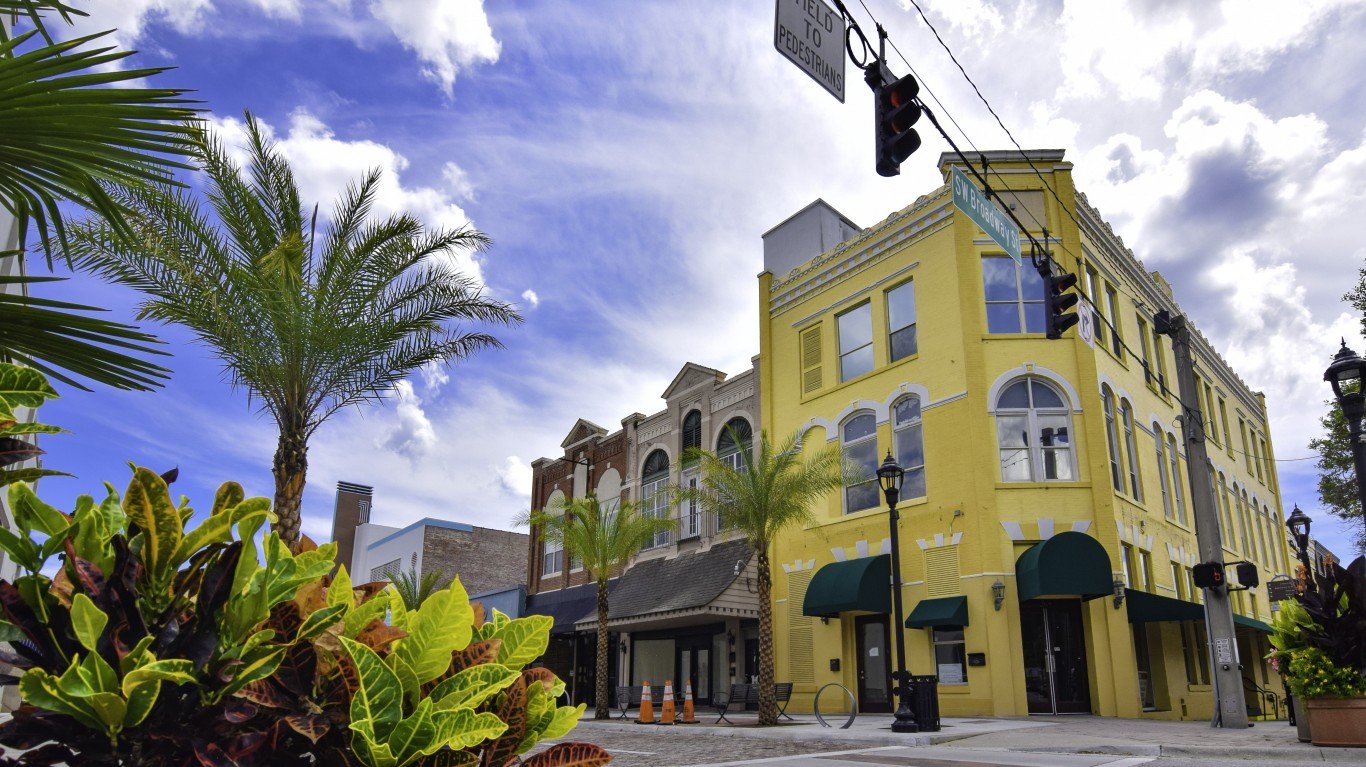
11. Ocala, FL
> Change in reported vehicle theft rate, 2019-2020: -34.8
> Vehicle-thefts reported in 2020: 582 – 96th highest of 212 metros
> Vehicle-thefts per 100K people in 2020: 157.9 – 84th lowest of 212 metros
> 1-yr. change in all property crime: -262.9 – 65th lowest of 188 metros
> Property crimes per 100K people in 2020: 1,631.5 – 61st lowest of 198 metros
> Population: 365,579

10. Lake Havasu City-Kingman, AZ
> Change in reported vehicle theft rate, 2019-2020: -39.6
> Vehicle-thefts reported in 2020: 430 – 101st lowest of 212 metros
> Vehicle-thefts per 100K people in 2020: 200.3 – 98th highest of 212 metros
> 1-yr. change in all property crime: -475.5 – 18th lowest of 188 metros
> Property crimes per 100K people in 2020: 2,163.3 – 69th highest of 198 metros
> Population: 212,181
[in-text-ad]

9. Spokane-Spokane Valley, WA
> Change in reported vehicle theft rate, 2019-2020: -40.7
> Vehicle-thefts reported in 2020: 1,787 – 39th highest of 212 metros
> Vehicle-thefts per 100K people in 2020: 312.0 – 40th highest of 212 metros
> 1-yr. change in all property crime: -367.6 – 31st lowest of 188 metros
> Property crimes per 100K people in 2020: 3,478.6 – 10th highest of 198 metros
> Population: 568,521
[recirclink id=1033410]

8. Charleston-North Charleston, SC
> Change in reported vehicle theft rate, 2019-2020: -42.1
> Vehicle-thefts reported in 2020: 2,339 – 28th highest of 212 metros
> Vehicle-thefts per 100K people in 2020: 285.4 – 50th highest of 212 metros
> 1-yr. change in all property crime: -198.2 – 79th lowest of 188 metros
> Property crimes per 100K people in 2020: 2,480.6 – 44th highest of 198 metros
> Population: 802,122

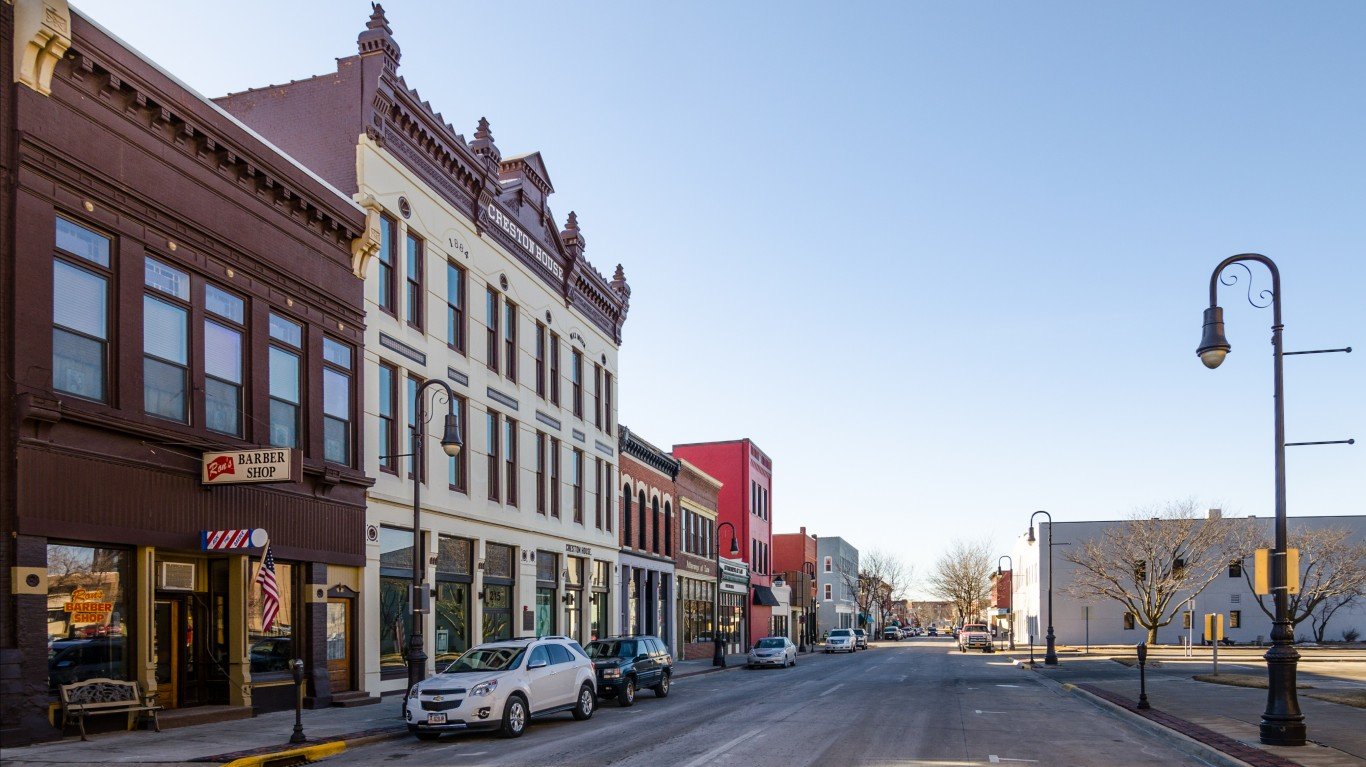
7. St. Joseph, MO-KS
> Change in reported vehicle theft rate, 2019-2020: -52.3
> Vehicle-thefts reported in 2020: 663 – 87th highest of 212 metros (tied)
> Vehicle-thefts per 100K people in 2020: 530.7 – 8th highest of 212 metros
> 1-yr. change in all property crime: -331.2 – 42nd lowest of 188 metros
> Property crimes per 100K people in 2020: 3,541.3 – 9th highest of 198 metros
> Population: 125,411
[in-text-ad-2]
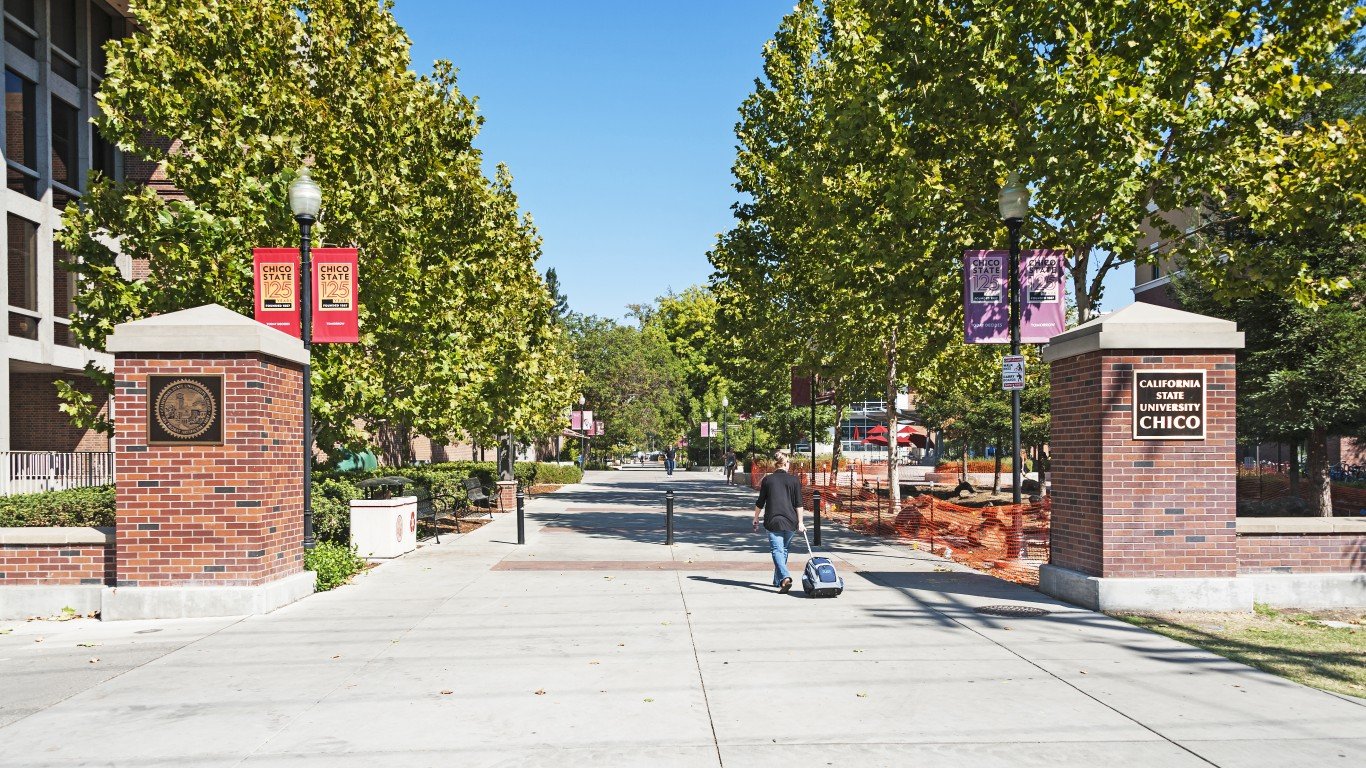
6. Chico, CA
> Change in reported vehicle theft rate, 2019-2020: -70.5
> Vehicle-thefts reported in 2020: 663 – 87th highest of 212 metros (tied)
> Vehicle-thefts per 100K people in 2020: 305.6 – 41st highest of 212 metros
> 1-yr. change in all property crime: -311.4 – 48th lowest of 188 metros
> Property crimes per 100K people in 2020: 1,995.0 – 98th highest of 198 metros
> Population: 219,186

5. Modesto, CA
> Change in reported vehicle theft rate, 2019-2020: -72.5
> Vehicle-thefts reported in 2020: 2,091 – 33rd highest of 212 metros
> Vehicle-thefts per 100K people in 2020: 380.7 – 27th highest of 212 metros
> 1-yr. change in all property crime: -622.7 – 5th lowest of 188 metros
> Property crimes per 100K people in 2020: 1,974.3 – 99th lowest of 198 metros
> Population: 550,660
[in-text-ad]

4. Colorado Springs, CO
> Change in reported vehicle theft rate, 2019-2020: -106.4
> Vehicle-thefts reported in 2020: 2,896 – 25th highest of 212 metros
> Vehicle-thefts per 100K people in 2020: 384.9 – 24th highest of 212 metros
> 1-yr. change in all property crime: -194.7 – 84th lowest of 188 metros
> Property crimes per 100K people in 2020: 2,653.0 – 33rd highest of 198 metros
> Population: 745,791
[recirclink id=1026293]

3. Great Falls, MT
> Change in reported vehicle theft rate, 2019-2020: -133.0
> Vehicle-thefts reported in 2020: 187 – 44th lowest of 212 metros (tied)
> Vehicle-thefts per 100K people in 2020: 229.4 – 79th highest of 212 metros
> 1-yr. change in all property crime: -486.9 – 17th lowest of 188 metros
> Property crimes per 100K people in 2020: 3,999.8 – 3rd highest of 198 metros
> Population: 81,366

2. Anchorage, AK
> Change in reported vehicle theft rate, 2019-2020: -135.1
> Vehicle-thefts reported in 2020: 1,202 – 50th highest of 212 metros
> Vehicle-thefts per 100K people in 2020: 393.8 – 22nd highest of 212 metros
> 1-yr. change in all property crime: -914.3 – the lowest of 188 metros
> Property crimes per 100K people in 2020: 3,404.7 – 12th highest of 198 metros
> Population: 396,317
[in-text-ad-2]

1. Kahului-Wailuku-Lahaina, HI
> Change in reported vehicle theft rate, 2019-2020: -138.1
> Vehicle-thefts reported in 2020: 429 – 100th lowest of 212 metros
> Vehicle-thefts per 100K people in 2020: 256.6 – 65th highest of 212 metros
> 1-yr. change in all property crime: -860.3 – 2nd lowest of 188 metros
> Property crimes per 100K people in 2020: 2,115.7 – 80th highest of 198 metros
> Population: 167,488
Methodology
To determine the metro areas where the motor vehicle theft rate is falling, 24/7 Wall St. reviewed the change in motor vehicle theft rate per 100,000 people from the FBI’s 2019 and 2020 Uniform Crime Reports. Crime rates were calculated using population figures provided by the FBI in the 2020 and 2019 UCR.
Limited data was available in the 2020 UCR for areas in Alabama, Maryland, Pennsylvania, and Illinois, though metro areas in these states were not excluded from analysis. Only metro areas for which the boundaries defined by the FBI match the boundaries as defined by the U.S. Census Bureau were considered. Because some state and local agencies changed reporting practices between 2019 and 2020, the figures are not comparable, and the areas were excluded.
Population figures are five-year estimates from the U.S. Census Bureau’s 2019 American Community Survey.
Contact [email protected] for any questions or corrections.