
The U.S. property crime rate fell for the 19th consecutive year in 2020 – a bright spot in an otherwise bleak year defined largely by the COVID-19 pandemic and a historic surge in deadly violence.
Property crime is made up of three categories of offenses: larceny, defined as the unlawful taking of property; burglary, or the illegal entry of a structure to commit a crime; and vehicle theft, which can be either the theft, or the attempted theft, of a vehicle, such a car or ATV. Here is a look at the city in every state where your car is most likely to be stolen.
There were a total 6.5 million property crimes reported in the U.S. in 2020, or 1,958 for every 100,000 people, a decrease of 172 incidents per 100,000 people from the previous year. Not all parts of the country benefited from the decline, however. Several major metropolitan areas bucked the national trend and reported a year-over-year surge in property crime.
Using data from the FBI’s 2020 Uniform Crime Report, 24/7 Wall St. identified the 30 metro areas where property crime is soaring. Metro areas are ranked by the year-over-year change in property crimes reported for every 100,000 residents.
Despite the decline in much of the country, property crimes remain the most common of the most serious crimes tracked by the FBI, known as Part I offenses. Each year, property crimes result in the loss of tens of billions of dollars worth of property – much of which is never recovered.
The vast majority of metro areas that reported the largest increase in property crime rate in 2020 are in the Midwest and Western United States. It is important to note that while each of the 30 metro areas on this list reported an increase in property crime, 12 of them have a lower overall property crime rate than the national average.
Click here to see the metros where property crime is soaring
Click here to read our detailed methodology

30. Shreveport-Bossier City, LA
> 1-yr. change in property crime rate: 49.7 more crimes per 100k people
> Property crimes reported in 2020: 14,095 — 35th highest of 188 metros
> Property crimes reported in 2019: 13,978 — 39th highest of 188 metros
> Property crimes per 100K people in 2020: 3,588.1 — 6th highest of 188 metros
> Property crimes per 100K people in 2019: 3,538.4 — 9th highest of 188 metros
> Population: 394,706
[in-text-ad]
29. Fond du Lac, WI
> 1-yr. change in property crime rate: 49.9 more crimes per 100k people
> Property crimes reported in 2020: 1,187 — 4th lowest of 188 metros
> Property crimes reported in 2019: 1,131 — 3rd lowest of 188 metros
> Property crimes per 100K people in 2020: 1,146.7 — 18th lowest of 188 metros
> Property crimes per 100K people in 2019: 1,096.7 — 9th lowest of 188 metros
> Population: 103,403
[recirclink id=1015043]

28. Buffalo-Cheektowaga, NY
> 1-yr. change in property crime rate: 57.9 more crimes per 100k people
> Property crimes reported in 2020: 21,574 — 23rd highest of 188 metros
> Property crimes reported in 2019: 20,987 — 28th highest of 188 metros
> Property crimes per 100K people in 2020: 1,926.3 — 90th lowest of 188 metros
> Property crimes per 100K people in 2019: 1,868.4 — 70th lowest of 188 metros
> Population: 1,127,983

27. Oxnard-Thousand Oaks-Ventura, CA
> 1-yr. change in property crime rate: 66.2 more crimes per 100k people
> Property crimes reported in 2020: 13,083 — 37th highest of 188 metros
> Property crimes reported in 2019: 12,634 — 44th highest of 188 metros
> Property crimes per 100K people in 2020: 1,557.8 — 56th lowest of 188 metros
> Property crimes per 100K people in 2019: 1,491.5 — 38th lowest of 188 metros
> Population: 846,006
[in-text-ad-2]

26. Cedar Rapids, IA
> 1-yr. change in property crime rate: 74.6 more crimes per 100k people
> Property crimes reported in 2020: 5,803 — 85th highest of 188 metros
> Property crimes reported in 2019: 5,566 — 91st highest of 188 metros
> Property crimes per 100K people in 2020: 2,115.5 — 75th highest of 188 metros
> Property crimes per 100K people in 2019: 2,040.9 — 82nd lowest of 188 metros
> Population: 273,032
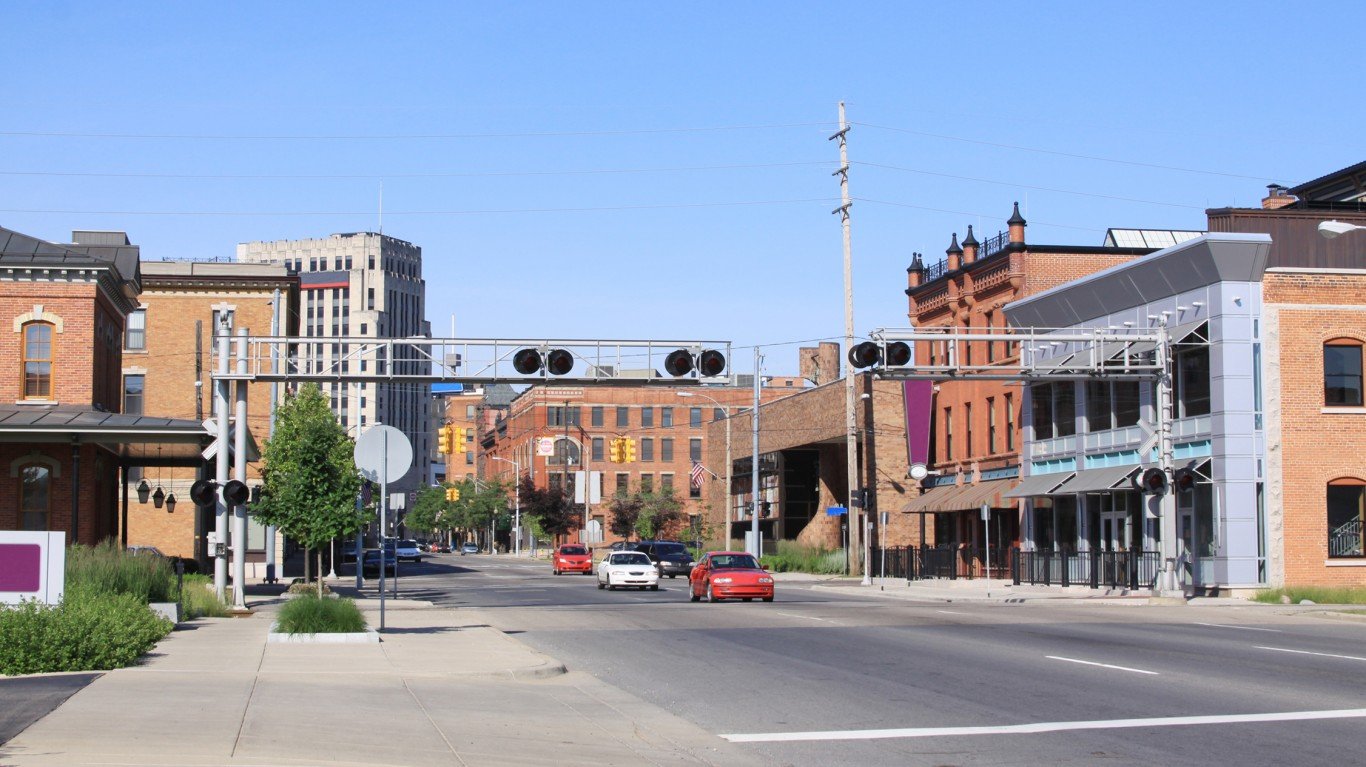
25. Kalamazoo-Portage, MI
> 1-yr. change in property crime rate: 80.1 more crimes per 100k people
> Property crimes reported in 2020: 8,789 — 56th highest of 188 metros
> Property crimes reported in 2019: 8,583 — 63rd highest of 188 metros
> Property crimes per 100K people in 2020: 3,306.6 — 11th highest of 188 metros
> Property crimes per 100K people in 2019: 3,226.5 — 13th highest of 188 metros
> Population: 265,066
[in-text-ad]

24. Appleton, WI
> 1-yr. change in property crime rate: 81.3 more crimes per 100k people
> Property crimes reported in 2020: 2,798 — 50th lowest of 188 metros
> Property crimes reported in 2019: 2,599 — 40th lowest of 188 metros
> Property crimes per 100K people in 2020: 1,170.0 — 25th lowest of 188 metros
> Property crimes per 100K people in 2019: 1,088.7 — 6th lowest of 188 metros
> Population: 237,974
[recirclink id=1030620]

23. Salem, OR
> 1-yr. change in property crime rate: 84.6 more crimes per 100k people
> Property crimes reported in 2020: 12,462 — 40th highest of 188 metros
> Property crimes reported in 2019: 12,057 — 47th highest of 188 metros
> Property crimes per 100K people in 2020: 2,853.6 — 20th highest of 188 metros
> Property crimes per 100K people in 2019: 2,769.0 — 29th highest of 188 metros
> Population: 433,903

22. Akron, OH
> 1-yr. change in property crime rate: 86.9 more crimes per 100k people
> Property crimes reported in 2020: 15,032 — 33rd highest of 188 metros
> Property crimes reported in 2019: 14,445 — 35th highest of 188 metros
> Property crimes per 100K people in 2020: 2,139.4 — 73rd highest of 188 metros
> Property crimes per 100K people in 2019: 2,052.5 — 85th lowest of 188 metros
> Population: 703,479
[in-text-ad-2]
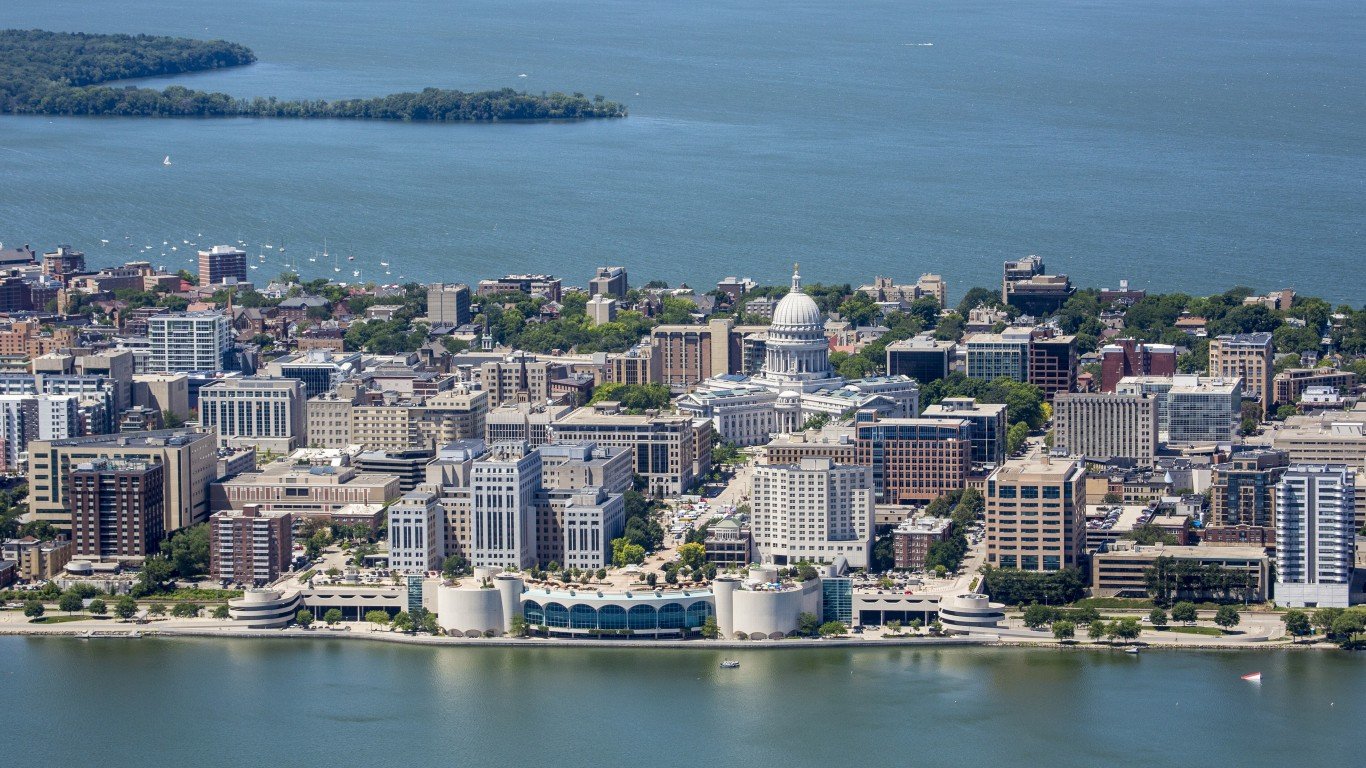
21. Madison, WI
> 1-yr. change in property crime rate: 90.7 more crimes per 100k people
> Property crimes reported in 2020: 12,117 — 43rd highest of 188 metros
> Property crimes reported in 2019: 11,432 — 50th highest of 188 metros
> Property crimes per 100K people in 2020: 1,805.4 — 77th lowest of 188 metros
> Property crimes per 100K people in 2019: 1,714.7 — 61st lowest of 188 metros
> Population: 664,865

20. Sioux Falls, SD
> 1-yr. change in property crime rate: 97.1 more crimes per 100k people
> Property crimes reported in 2020: 6,891 — 73rd highest of 188 metros
> Property crimes reported in 2019: 6,522 — 81st highest of 188 metros
> Property crimes per 100K people in 2020: 2,524.2 — 36th highest of 188 metros
> Property crimes per 100K people in 2019: 2,427.1 — 62nd highest of 188 metros
> Population: 268,833
[in-text-ad]

19. Raleigh-Cary, NC
> 1-yr. change in property crime rate: 106.6 more crimes per 100k people
> Property crimes reported in 2020: 21,397 — 24th highest of 188 metros
> Property crimes reported in 2019: 19,469 — 30th highest of 188 metros
> Property crimes per 100K people in 2020: 1,504.3 — 52nd lowest of 188 metros
> Property crimes per 100K people in 2019: 1,397.7 — 31st lowest of 188 metros
> Population: 1,390,785
[recirclink id=1033410]
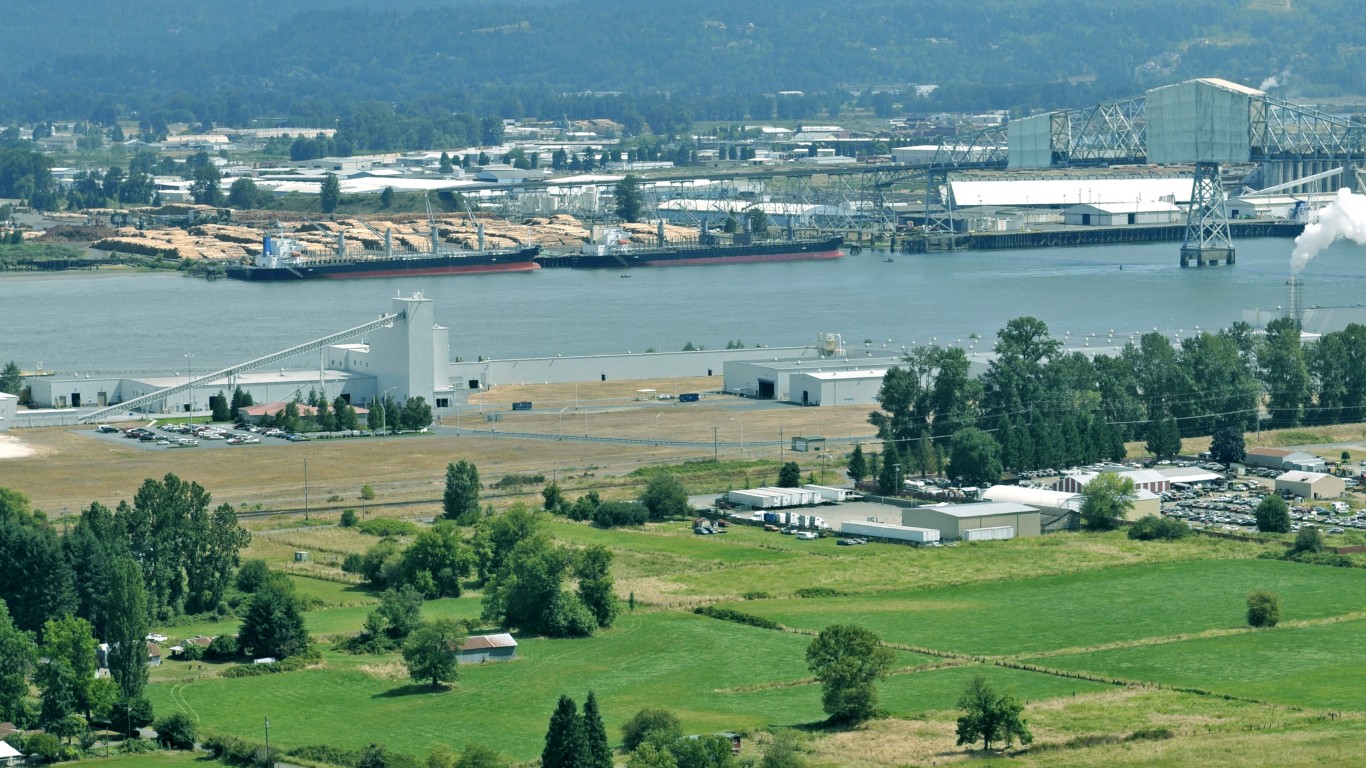
18. Longview, WA
> 1-yr. change in property crime rate: 123.9 more crimes per 100k people
> Property crimes reported in 2020: 2,224 — 36th lowest of 188 metros
> Property crimes reported in 2019: 2,054 — 28th lowest of 188 metros
> Property crimes per 100K people in 2020: 2,000.3 — 90th highest of 188 metros
> Property crimes per 100K people in 2019: 1,876.4 — 72nd lowest of 188 metros
> Population: 110,593

17. Yakima, WA
> 1-yr. change in property crime rate: 126.3 more crimes per 100k people
> Property crimes reported in 2020: 6,835 — 75th highest of 188 metros
> Property crimes reported in 2019: 6,536 — 79th highest of 188 metros
> Property crimes per 100K people in 2020: 2,725.4 — 25th highest of 188 metros
> Property crimes per 100K people in 2019: 2,599.1 — 44th highest of 188 metros
> Population: 250,873
[in-text-ad-2]

16. Napa, CA
> 1-yr. change in property crime rate: 129.5 more crimes per 100k people
> Property crimes reported in 2020: 2,306 — 38th lowest of 188 metros
> Property crimes reported in 2019: 2,162 — 33rd lowest of 188 metros
> Property crimes per 100K people in 2020: 1,689.7 — 65th lowest of 188 metros
> Property crimes per 100K people in 2019: 1,560.2 — 43rd lowest of 188 metros
> Population: 137,744

15. Oshkosh-Neenah, WI
> 1-yr. change in property crime rate: 152.9 more crimes per 100k people
> Property crimes reported in 2020: 2,283 — 37th lowest of 188 metros
> Property crimes reported in 2019: 2,008 — 25th lowest of 188 metros
> Property crimes per 100K people in 2020: 1,325.0 — 35th lowest of 188 metros
> Property crimes per 100K people in 2019: 1,172.2 — 18th lowest of 188 metros
> Population: 171,907
[in-text-ad]

14. Idaho Falls, ID
> 1-yr. change in property crime rate: 199.1 more crimes per 100k people
> Property crimes reported in 2020: 1,994 — 31st lowest of 188 metros
> Property crimes reported in 2019: 1,651 — 15th lowest of 188 metros
> Property crimes per 100K people in 2020: 1,288.2 — 32nd lowest of 188 metros
> Property crimes per 100K people in 2019: 1,089.1 — 7th lowest of 188 metros
> Population: 151,516
[recirclink id=1039645]

13. Eau Claire, WI
> 1-yr. change in property crime rate: 200.4 more crimes per 100k people
> Property crimes reported in 2020: 2,951 — 56th lowest of 188 metros
> Property crimes reported in 2019: 2,600 — 41st lowest of 188 metros
> Property crimes per 100K people in 2020: 1,735.6 — 69th lowest of 188 metros
> Property crimes per 100K people in 2019: 1,535.2 — 41st lowest of 188 metros
> Population: 169,304
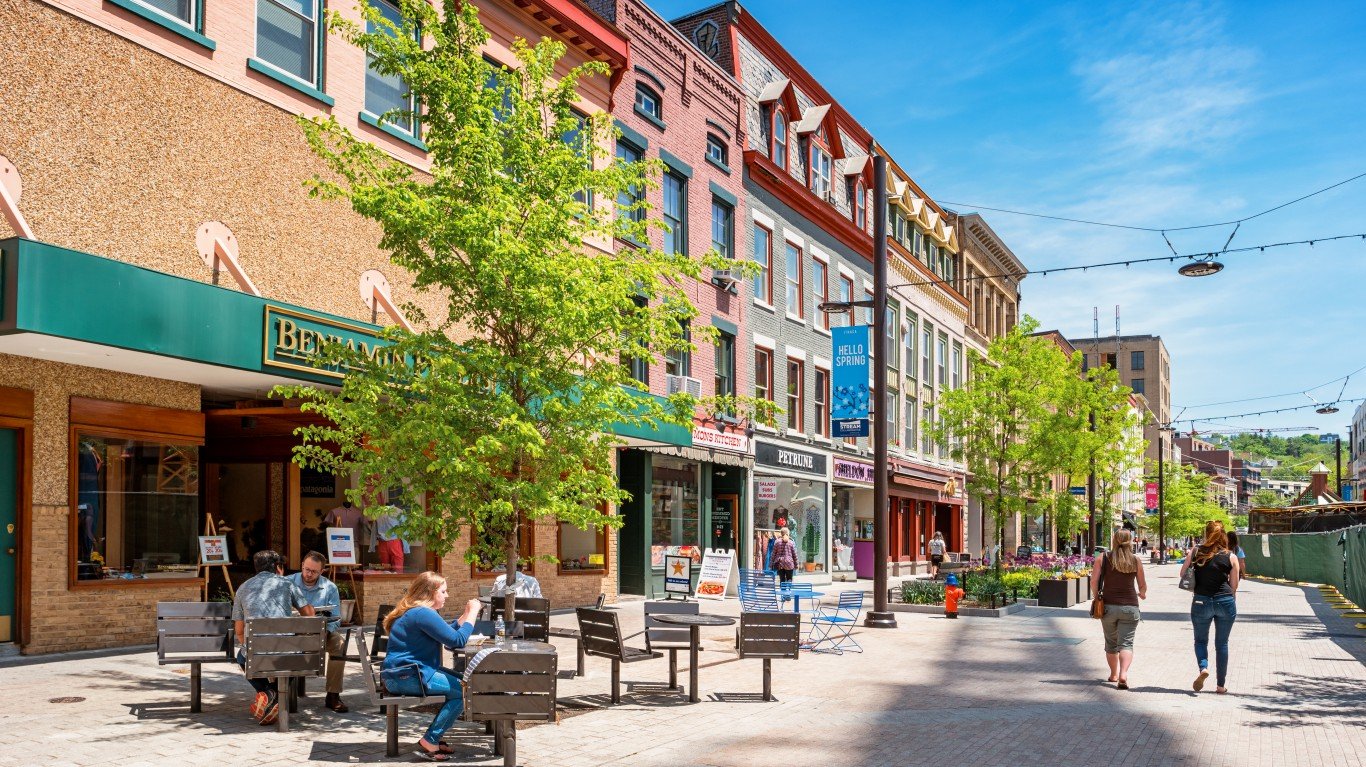
12. Ithaca, NY
> 1-yr. change in property crime rate: 226.5 more crimes per 100k people
> Property crimes reported in 2020: 1,924 — 29th lowest of 188 metros
> Property crimes reported in 2019: 1,707 — 16th lowest of 188 metros
> Property crimes per 100K people in 2020: 1,894.1 — 88th lowest of 188 metros
> Property crimes per 100K people in 2019: 1,667.6 — 52nd lowest of 188 metros
> Population: 102,180
[in-text-ad-2]
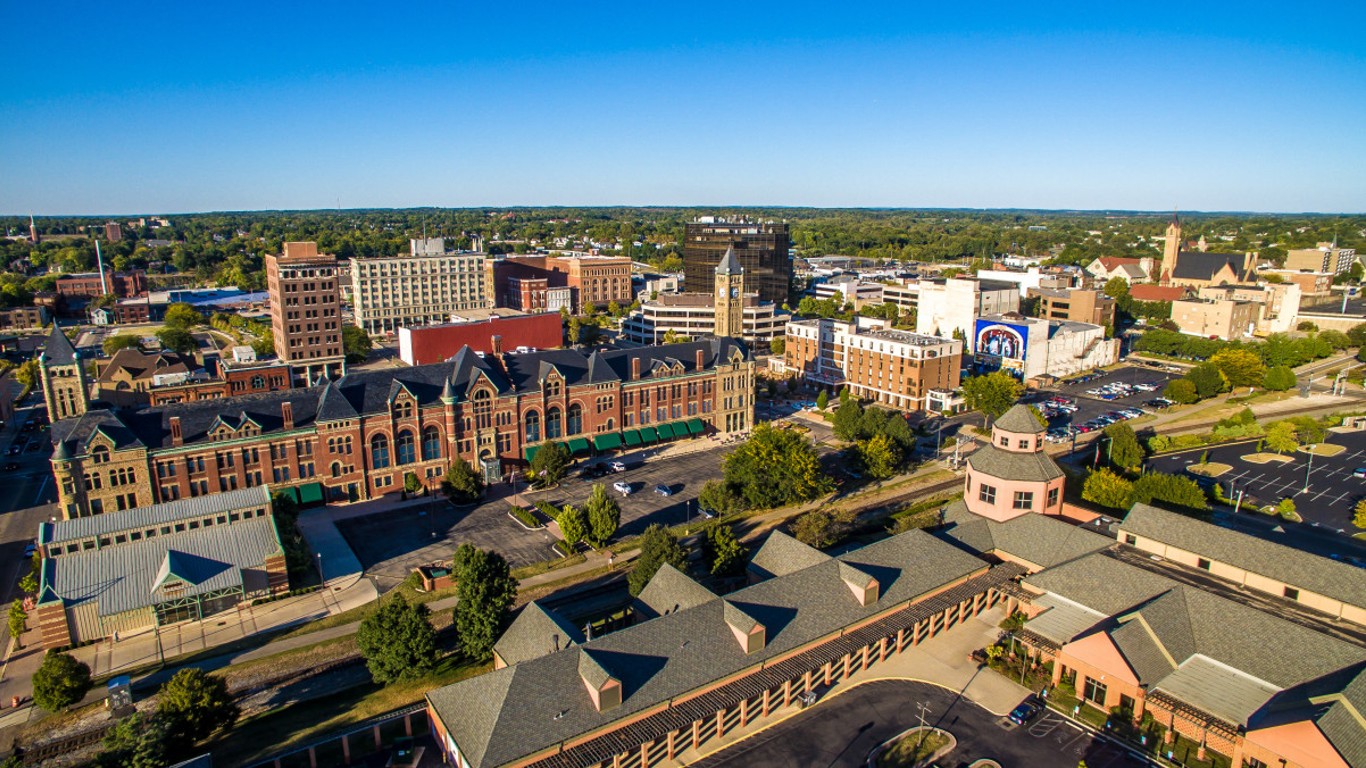
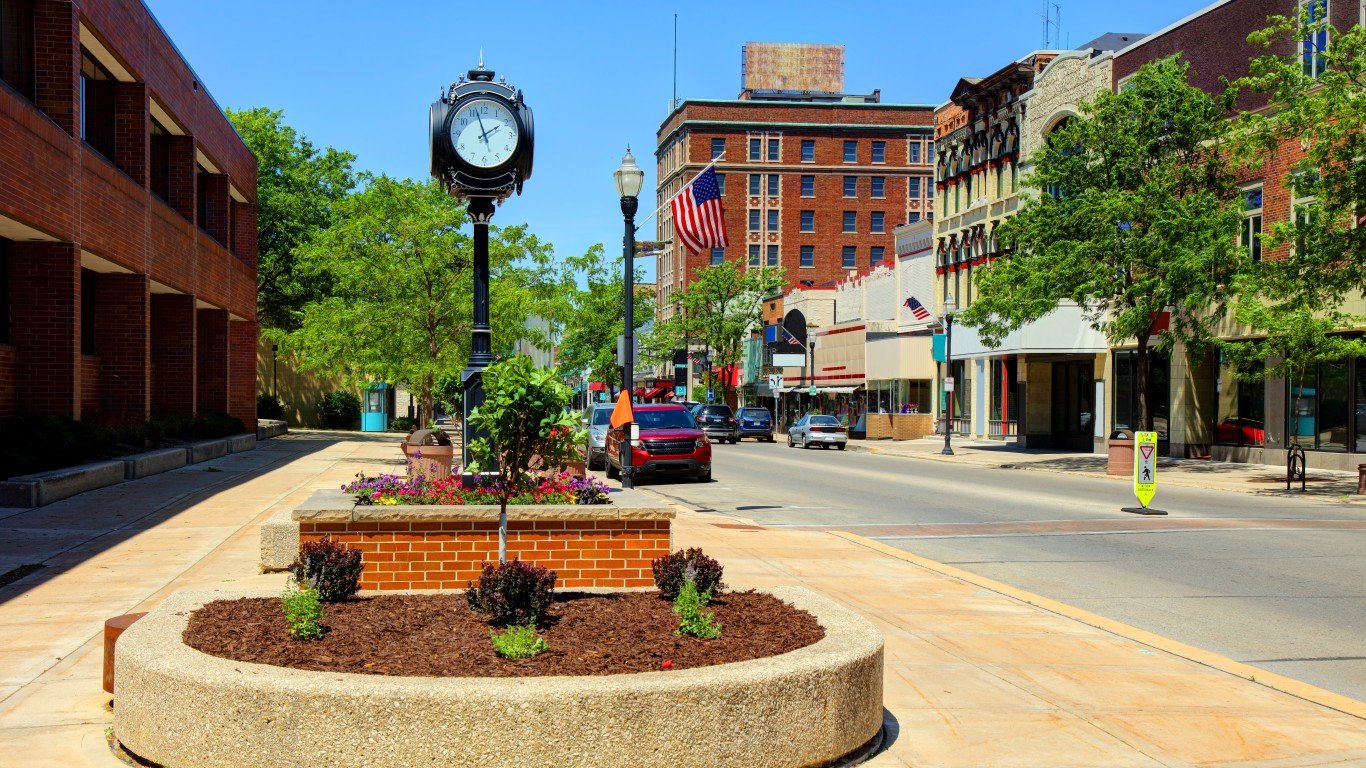
11. Springfield, OH
> 1-yr. change in property crime rate: 246.8 more crimes per 100k people
> Property crimes reported in 2020: 3,872 — 79th lowest of 188 metros
> Property crimes reported in 2019: 3,554 — 64th lowest of 188 metros
> Property crimes per 100K people in 2020: 2,901.3 — 18th highest of 188 metros
> Property crimes per 100K people in 2019: 2,654.5 — 40th highest of 188 metros
> Population: 134,083

10. Bellingham, WA
> 1-yr. change in property crime rate: 254.4 more crimes per 100k people
> Property crimes reported in 2020: 5,459 — 88th highest of 188 metros (tied)
> Property crimes reported in 2019: 4,792 — 87th lowest of 188 metros
> Property crimes per 100K people in 2020: 2,355.2 — 47th highest of 188 metros
> Property crimes per 100K people in 2019: 2,100.9 — 88th lowest of 188 metros
> Population: 229,247
[in-text-ad]

9. Dubuque, IA
> 1-yr. change in property crime rate: 257.1 more crimes per 100k people
> Property crimes reported in 2020: 1,363 — 10th lowest of 188 metros
> Property crimes reported in 2019: 1,103 — 2nd lowest of 188 metros
> Property crimes per 100K people in 2020: 1,397.2 — 43rd lowest of 188 metros
> Property crimes per 100K people in 2019: 1,140.1 — 14th lowest of 188 metros
> Population: 97,311
[recirclink id=1055273]
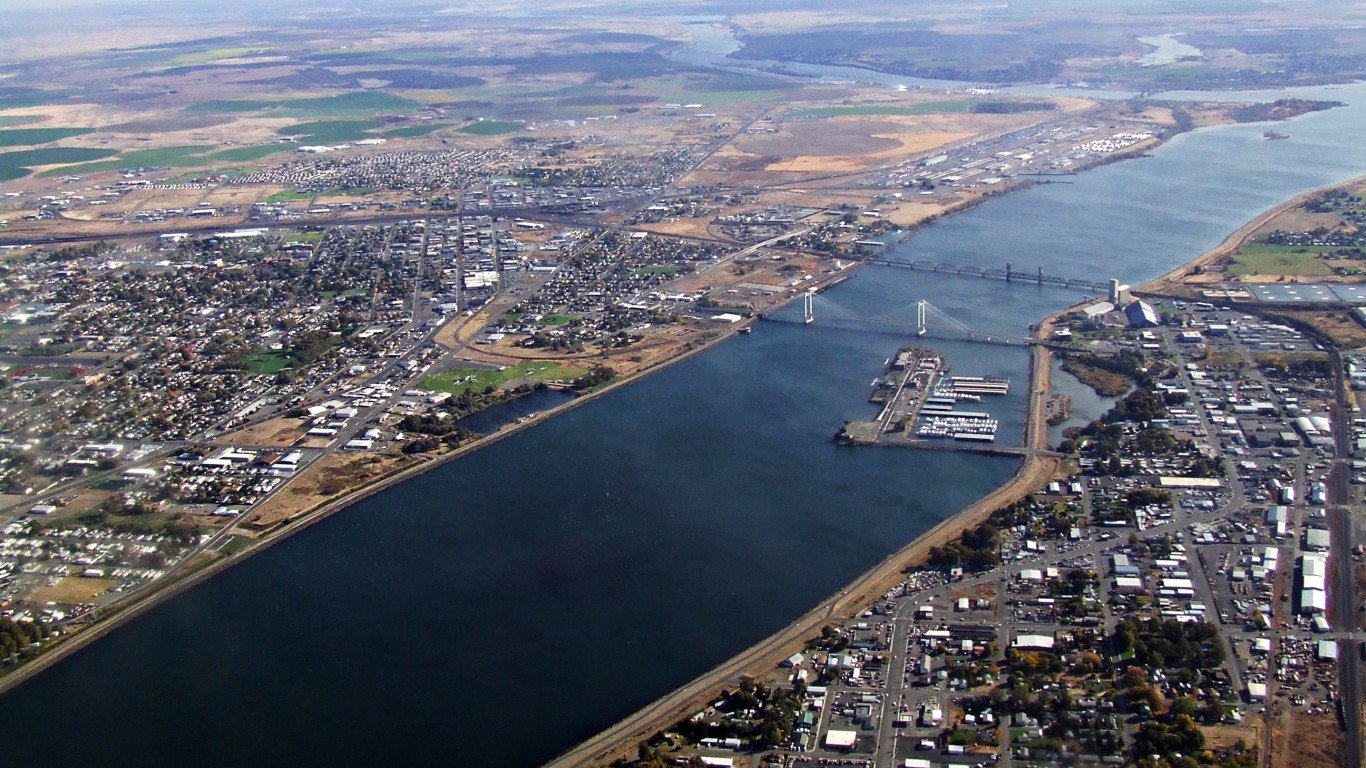
8. Kennewick-Richland, WA
> 1-yr. change in property crime rate: 314.1 more crimes per 100k people
> Property crimes reported in 2020: 6,869 — 74th highest of 188 metros
> Property crimes reported in 2019: 5,851 — 87th highest of 188 metros
> Property crimes per 100K people in 2020: 2,259.8 — 55th highest of 188 metros
> Property crimes per 100K people in 2019: 1,945.8 — 76th lowest of 188 metros
> Population: 299,612

7. Boulder, CO
> 1-yr. change in property crime rate: 314.5 more crimes per 100k people
> Property crimes reported in 2020: 9,046 — 54th highest of 188 metros
> Property crimes reported in 2019: 8,038 — 67th highest of 188 metros
> Property crimes per 100K people in 2020: 2,760.1 — 23rd highest of 188 metros
> Property crimes per 100K people in 2019: 2,445.6 — 60th highest of 188 metros
> Population: 326,196
[in-text-ad-2]

6. Grand Junction, CO
> 1-yr. change in property crime rate: 443.3 more crimes per 100k people
> Property crimes reported in 2020: 4,594 — 89th lowest of 188 metros
> Property crimes reported in 2019: 3,893 — 73rd lowest of 188 metros
> Property crimes per 100K people in 2020: 2,980.7 — 15th highest of 188 metros
> Property crimes per 100K people in 2019: 2,537.3 — 50th highest of 188 metros
> Population: 154,210
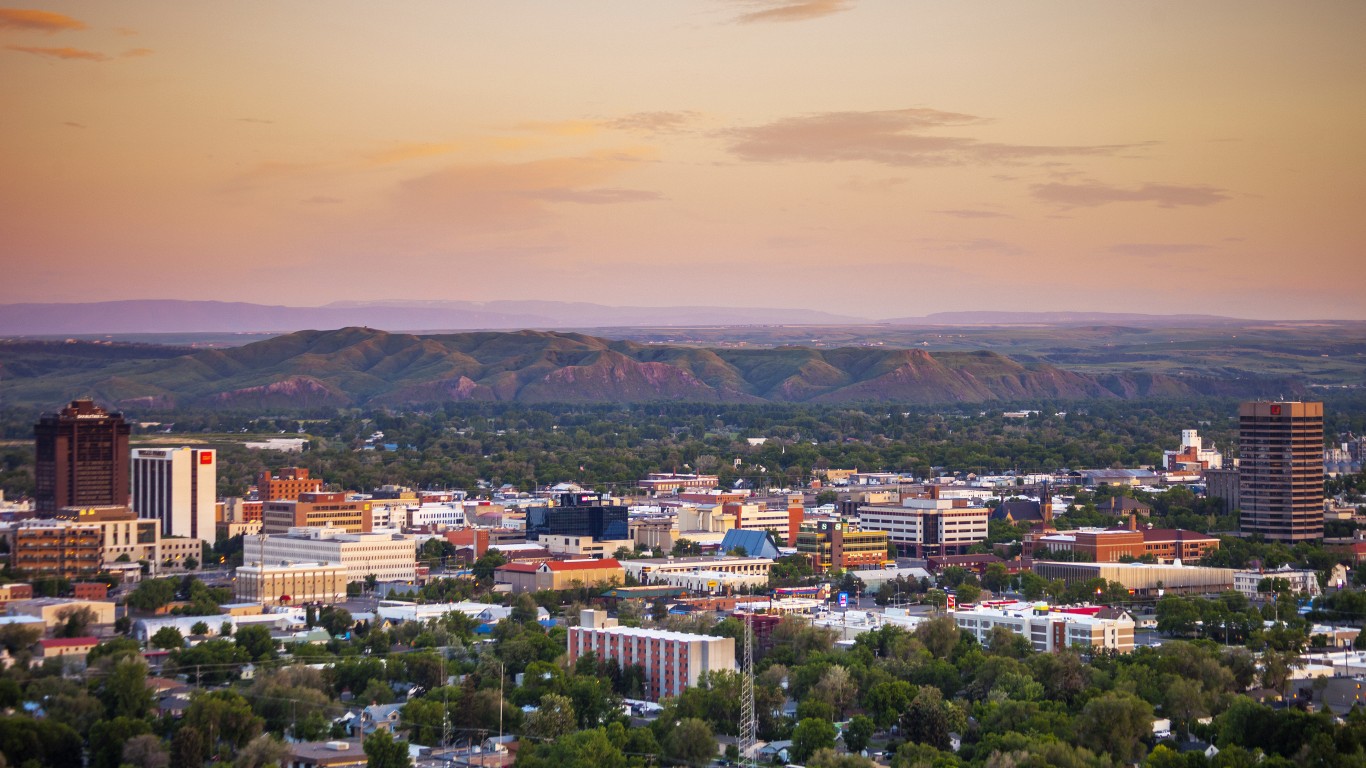
5. Billings, MT
> 1-yr. change in property crime rate: 459.4 more crimes per 100k people
> Property crimes reported in 2020: 6,378 — 79th highest of 188 metros
> Property crimes reported in 2019: 5,468 — 93rd highest of 188 metros
> Property crimes per 100K people in 2020: 3,471.9 — 9th highest of 188 metros
> Property crimes per 100K people in 2019: 3,012.4 — 18th highest of 188 metros
> Population: 181,667
[in-text-ad]
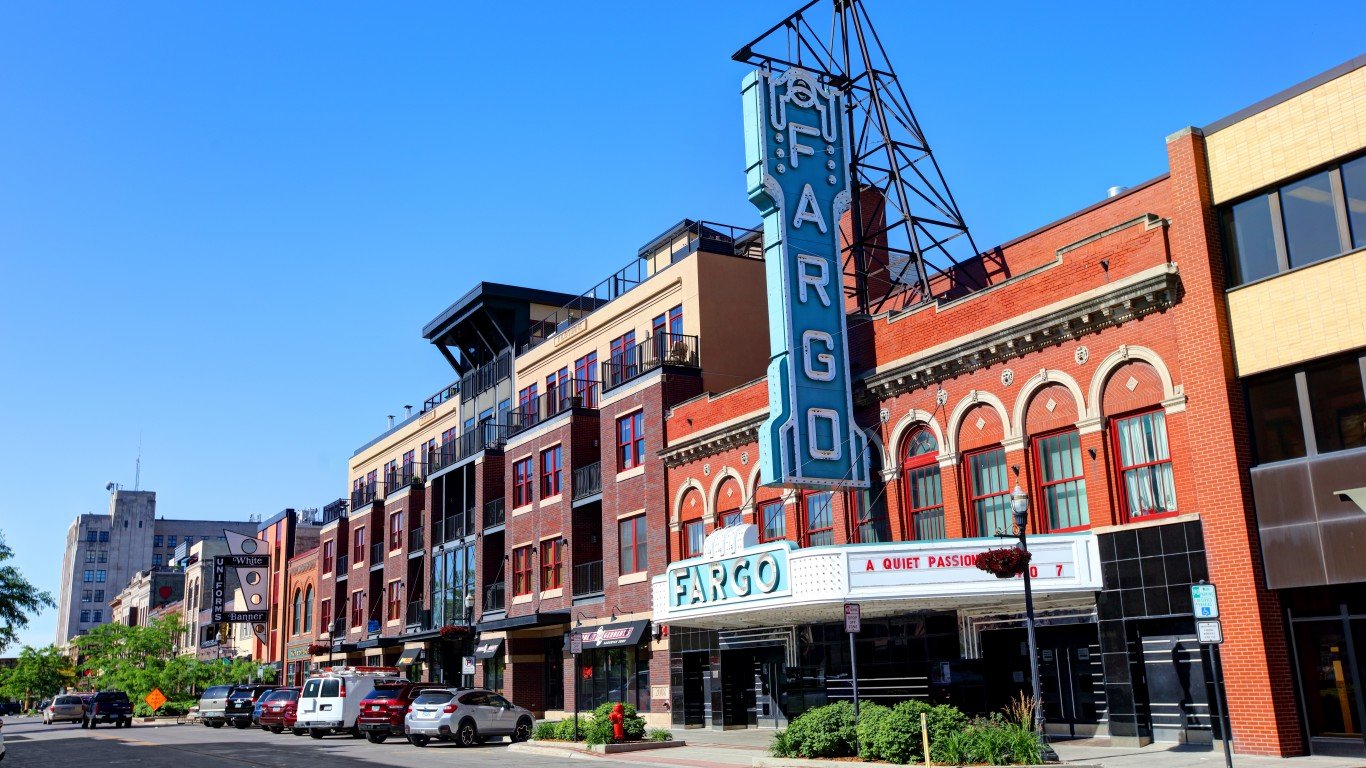
4. Fargo, ND-MN
> 1-yr. change in property crime rate: 490.7 more crimes per 100k people
> Property crimes reported in 2020: 7,027 — 72nd highest of 188 metros
> Property crimes reported in 2019: 5,794 — 88th highest of 188 metros
> Property crimes per 100K people in 2020: 2,829.3 — 22nd highest of 188 metros
> Property crimes per 100K people in 2019: 2,338.5 — 75th highest of 188 metros
> Population: 246,145
[recirclink id=1015043]

3. Greeley, CO
> 1-yr. change in property crime rate: 530.5 more crimes per 100k people
> Property crimes reported in 2020: 7,165 — 70th highest of 188 metros
> Property crimes reported in 2019: 5,246 — 92nd lowest of 188 metros
> Property crimes per 100K people in 2020: 2,162.8 — 64th highest of 188 metros
> Property crimes per 100K people in 2019: 1,632.3 — 45th lowest of 188 metros
> Population: 324,492

2. Bismarck, ND
> 1-yr. change in property crime rate: 532.4 more crimes per 100k people
> Property crimes reported in 2020: 3,692 — 75th lowest of 188 metros
> Property crimes reported in 2019: 2,983 — 51st lowest of 188 metros
> Property crimes per 100K people in 2020: 2,847.1 — 21st highest of 188 metros
> Property crimes per 100K people in 2019: 2,314.8 — 77th highest of 188 metros
> Population: 129,115
[in-text-ad-2]
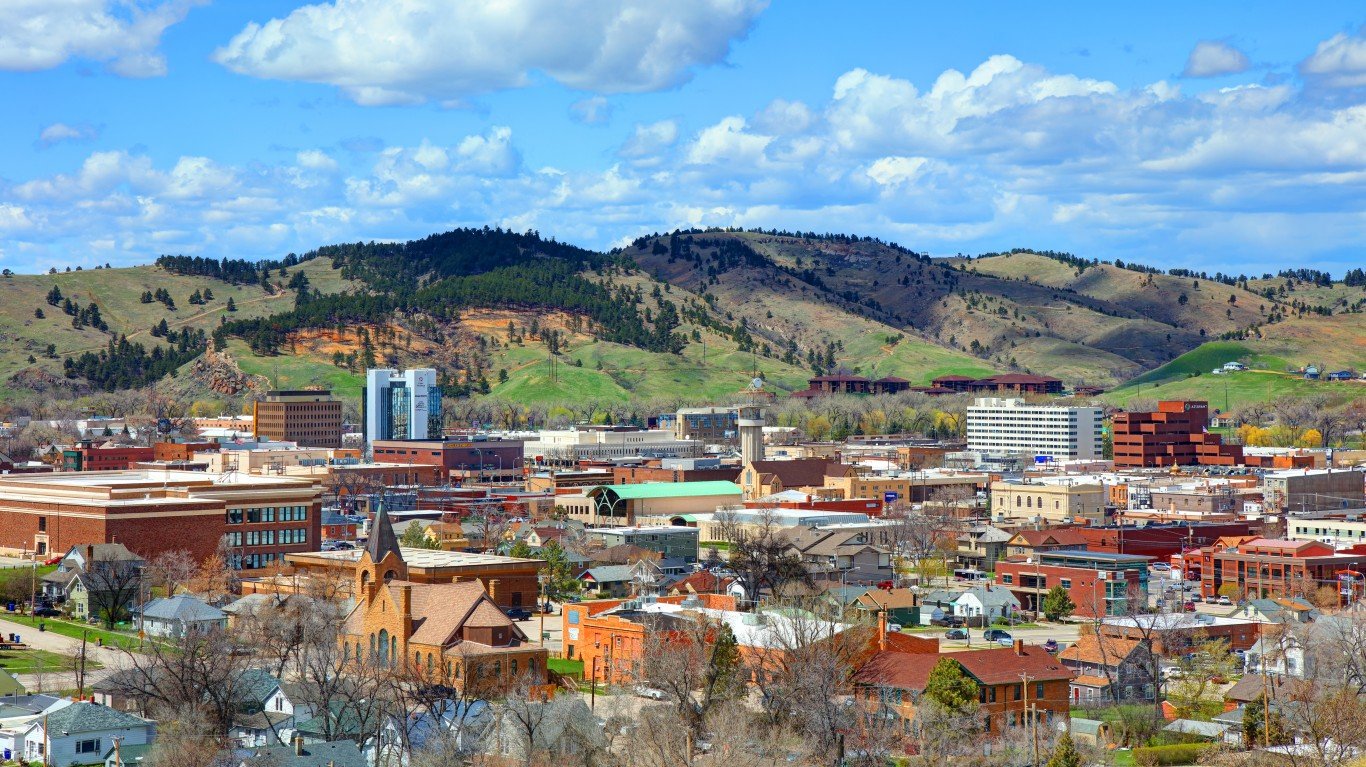
1. Rapid City, SD
> 1-yr. change in property crime rate: 568.2 more crimes per 100k people
> Property crimes reported in 2020: 4,275 — 85th lowest of 188 metros
> Property crimes reported in 2019: 3,382 — 61st lowest of 188 metros
> Property crimes per 100K people in 2020: 2,971.1 — 16th highest of 188 metros
> Property crimes per 100K people in 2019: 2,403.0 — 67th highest of 188 metros
> Population: 142,191
Methodology
To determine the metro areas where property crime is soaring, 24/7 Wall St. reviewed the change in property crime rate per 100k people from the FBI’s 2019 and 2020 Uniform Crime Reports. Property crime includes larceny-theft, burglary, and motor vehicle theft.
Limited data was available in the 2020 UCR for areas in Alabama, Maryland, Pennsylvania, and Illinois, though metro areas in these states were not excluded from analysis. Only metro areas for which the boundaries defined by the FBI match the boundaries as defined by the U.S. Census Bureau were considered. Because some state and local agencies changed reporting practices between 2019 and 2020, the figures are not comparable, and these areas were excluded.
Population figures are one-year estimates from the U.S. Census Bureau’s 2019 American Community Survey. However, these estimates were not used to calculate crime rates. Crime rates per 100,000 people were calculated using population figures provided by the FBI in the 2020 and 2019 UCR.
Contact [email protected] for any questions or corrections.