
In March 2022, about a month after Russia invaded Ukraine, President Joe Biden announced plans for the United States to accept 100,000 refugees fleeing the war in that country. A month after that, the Biden administration said it would launch a program through which American citizens can sponsor Ukrainians displaced by the war, allowing them to work and live in the U.S. for two years. (This is how many refugees the U.S. has accepted every year since 1980.)
Refugees often go where they have connections, if they can. Since the start of the war, many Ukrainians have tried to enter the U.S. through Mexico, among other portals, and many appear to be heading to relatives already living in the U.S.
Currently, nearly 360,000 Ukrainian-born immigrants live in this country. To determine the number of Ukrainian-born people in every state, 24/7 Tempo reviewed 2020 five-year population estimates from the U.S. Census Bureau.
Click here to learn how many Ukrainian-born people there are in every state
California and New York are home to the most Ukrainian-born immigrants, with 57,234 and 74,130, respectively (and New York City alone is home to about 150,000 residents of Ukrainian descent, more than any other U.S. city). However, South Dakota – where there are substantial Ukrainian communities in Sioux Falls and Rapid City – has the most native Ukrainians as a percentage of foreign-born residents – 4.12%. (These are 32 things you may not know about Ukraine.)

Alabama
> Ukrainian-born residents: 998
> Pct. of total foreign-born residents: 0.59% (23rd lowest)
> Total foreign-born residents: 168,053
> Total population: 4,893,186
[in-text-ad]

Alaska
> Ukrainian-born residents: 538
> Pct. of total foreign-born residents: 0.94% (16th highest)
> Total foreign-born residents: 57,342
> Total population: 736,990
[recirclink id=1090321]

Arizona
> Ukrainian-born residents: 2,154
> Pct. of total foreign-born residents: 0.23% (5th lowest)
> Total foreign-born residents: 947,589
> Total population: 7,174,064

Arkansas
> Ukrainian-born residents: 218
> Pct. of total foreign-born residents: 0.15% (3rd lowest)
> Total foreign-born residents: 148,142
> Total population: 3,011,873
[in-text-ad-2]

California
> Ukrainian-born residents: 57,234
> Pct. of total foreign-born residents: 0.55% (21st lowest)
> Total foreign-born residents: 10,463,785
> Total population: 39,346,023

Colorado
> Ukrainian-born residents: 3,606
> Pct. of total foreign-born residents: 0.67% (24th highest)
> Total foreign-born residents: 539,514
> Total population: 5,684,926
[in-text-ad]

Connecticut
> Ukrainian-born residents: 4,593
> Pct. of total foreign-born residents: 0.88% (19th highest)
> Total foreign-born residents: 521,372
> Total population: 3,570,549
[recirclink id=1076135]

Delaware
> Ukrainian-born residents: 369
> Pct. of total foreign-born residents: 0.40% (14th lowest)
> Total foreign-born residents: 91,133
> Total population: 967,679

Florida
> Ukrainian-born residents: 18,697
> Pct. of total foreign-born residents: 0.42% (15th lowest)
> Total foreign-born residents: 4,410,199
> Total population: 21,216,924
[in-text-ad-2]

Georgia
> Ukrainian-born residents: 3,688
> Pct. of total foreign-born residents: 0.35% (12th lowest)
> Total foreign-born residents: 1,068,027
> Total population: 10,516,579

Hawaii
> Ukrainian-born residents: 291
> Pct. of total foreign-born residents: 0.11% (the lowest)
> Total foreign-born residents: 259,672
> Total population: 1,420,074
[in-text-ad]

Idaho
> Ukrainian-born residents: 1,544
> Pct. of total foreign-born residents: 1.50% (10th highest)
> Total foreign-born residents: 103,021
> Total population: 1,754,367
[recirclink id=1094883]

Illinois
> Ukrainian-born residents: 26,433
> Pct. of total foreign-born residents: 1.49% (11th highest)
> Total foreign-born residents: 1,773,067
> Total population: 12,716,164

Indiana
> Ukrainian-born residents: 2,549
> Pct. of total foreign-born residents: 0.72% (22nd highest)
> Total foreign-born residents: 355,838
> Total population: 6,696,893
[in-text-ad-2]

Iowa
> Ukrainian-born residents: 738
> Pct. of total foreign-born residents: 0.43% (16th lowest)
> Total foreign-born residents: 170,325
> Total population: 3,150,011

Kansas
> Ukrainian-born residents: 908
> Pct. of total foreign-born residents: 0.45% (18th lowest)
> Total foreign-born residents: 204,026
> Total population: 2,912,619
[in-text-ad]

Kentucky
> Ukrainian-born residents: 1,026
> Pct. of total foreign-born residents: 0.58% (22nd lowest)
> Total foreign-born residents: 176,323
> Total population: 4,461,952
[recirclink id=1094852]

Louisiana
> Ukrainian-born residents: 543
> Pct. of total foreign-born residents: 0.28% (10th lowest)
> Total foreign-born residents: 193,041
> Total population: 4,664,616

Maine
> Ukrainian-born residents: 232
> Pct. of total foreign-born residents: 0.48% (19th lowest)
> Total foreign-born residents: 48,139
> Total population: 1,340,825
[in-text-ad-2]
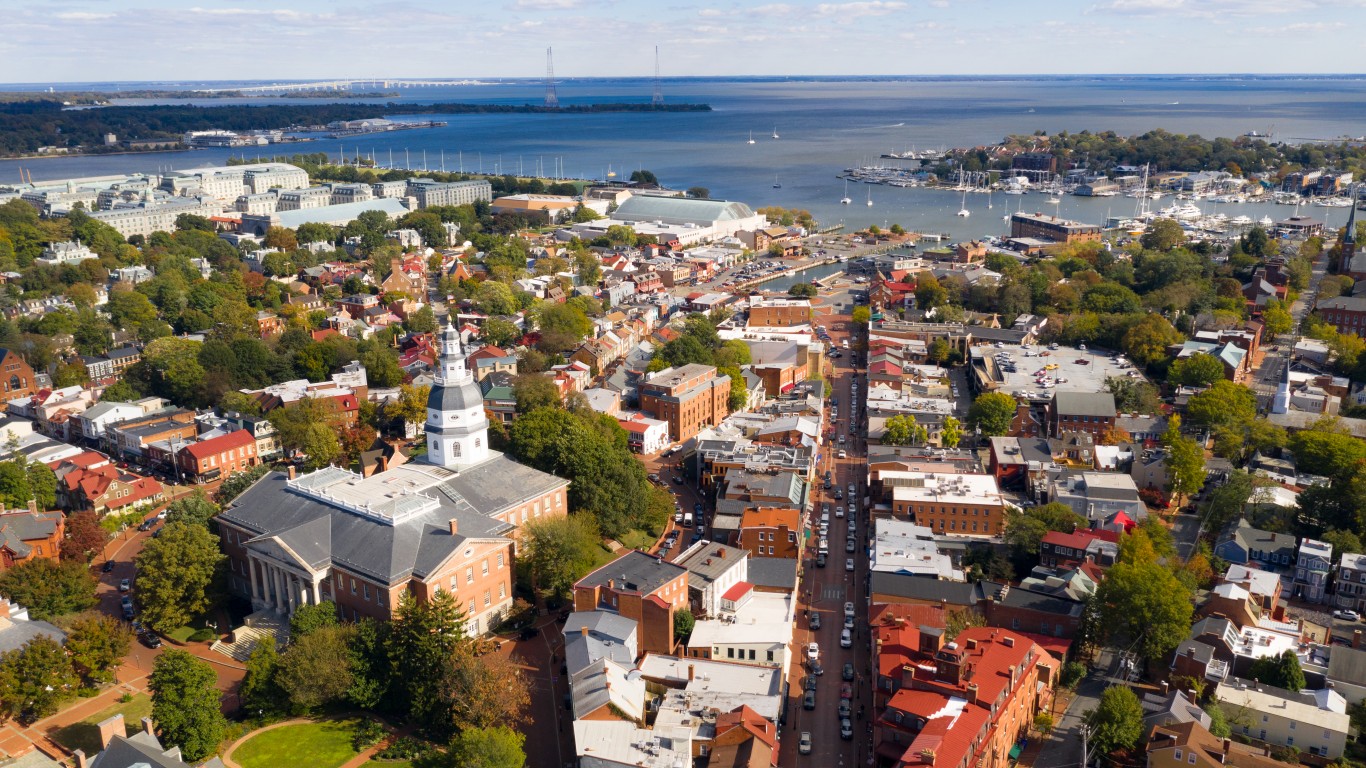
Maryland
> Ukrainian-born residents: 6,285
> Pct. of total foreign-born residents: 0.69% (23rd highest)
> Total foreign-born residents: 915,996
> Total population: 6,037,624

Massachusetts
> Ukrainian-born residents: 10,507
> Pct. of total foreign-born residents: 0.91% (17th highest)
> Total foreign-born residents: 1,158,909
> Total population: 6,873,003
[in-text-ad]

Michigan
> Ukrainian-born residents: 5,802
> Pct. of total foreign-born residents: 0.84% (20th highest)
> Total foreign-born residents: 686,637
> Total population: 9,973,907
[recirclink id=1083287]

Minnesota
> Ukrainian-born residents: 4,504
> Pct. of total foreign-born residents: 0.96% (15th highest)
> Total foreign-born residents: 470,687
> Total population: 5,600,166

Mississippi
> Ukrainian-born residents: 178
> Pct. of total foreign-born residents: 0.26% (8th lowest)
> Total foreign-born residents: 69,211
> Total population: 2,981,835
[in-text-ad-2]

Missouri
> Ukrainian-born residents: 2,995
> Pct. of total foreign-born residents: 1.17% (12th highest)
> Total foreign-born residents: 256,336
> Total population: 6,124,160
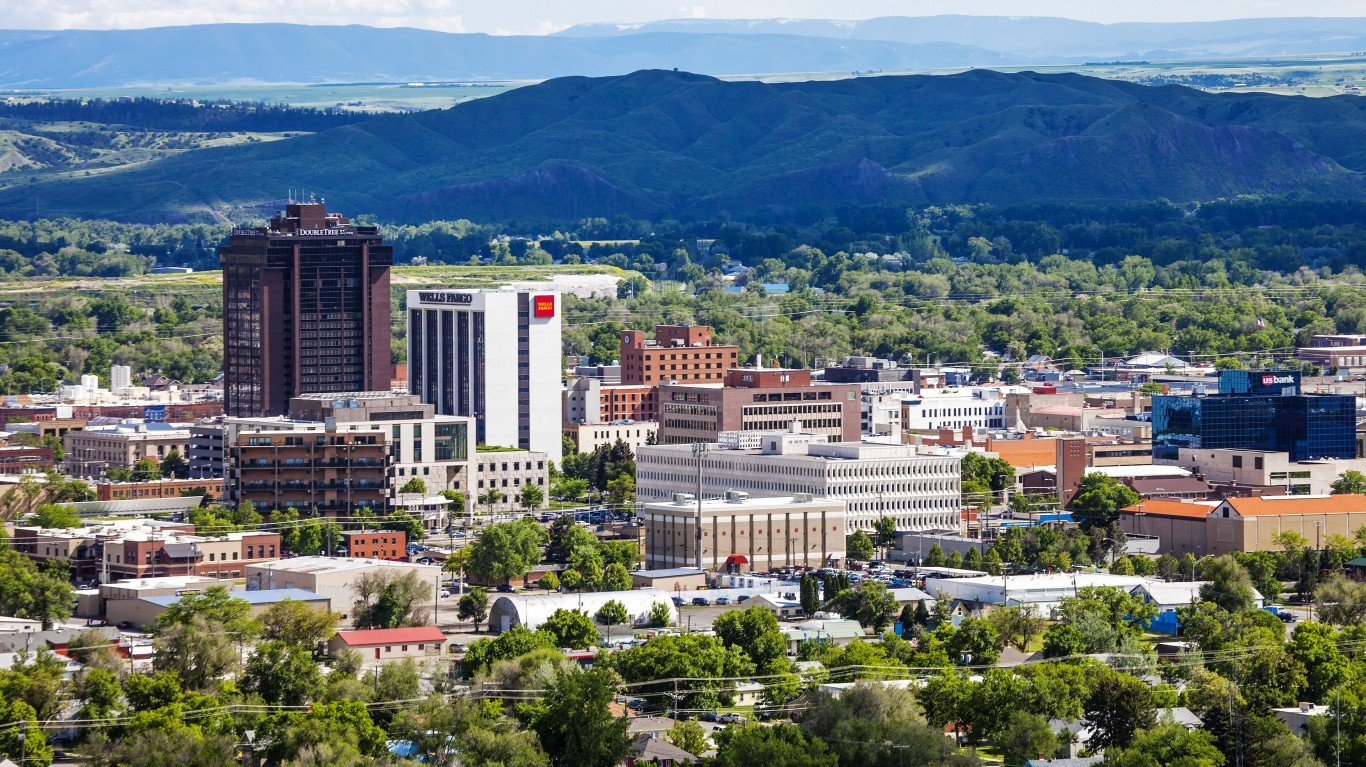
Montana
> Ukrainian-born residents: 531
> Pct. of total foreign-born residents: 2.28% (4th highest)
> Total foreign-born residents: 23,321
> Total population: 1,061,705
[in-text-ad]

Nebraska
> Ukrainian-born residents: 934
> Pct. of total foreign-born residents: 0.65% (25th highest)
> Total foreign-born residents: 142,616
> Total population: 1,923,826
[recirclink id=1090321]

Nevada
> Ukrainian-born residents: 1,488
> Pct. of total foreign-born residents: 0.25% (7th lowest)
> Total foreign-born residents: 587,797
> Total population: 3,030,281

New Hampshire
> Ukrainian-born residents: 826
> Pct. of total foreign-born residents: 1.00% (14th highest)
> Total foreign-born residents: 82,622
> Total population: 1,355,244
[in-text-ad-2]

New Jersey
> Ukrainian-born residents: 21,236
> Pct. of total foreign-born residents: 1.06% (13th highest)
> Total foreign-born residents: 2,012,872
> Total population: 8,885,418

New Mexico
> Ukrainian-born residents: 441
> Pct. of total foreign-born residents: 0.23% (6th lowest)
> Total foreign-born residents: 193,223
> Total population: 2,097,021
[in-text-ad]

New York
> Ukrainian-born residents: 74,130
> Pct. of total foreign-born residents: 1.70% (8th highest)
> Total foreign-born residents: 4,372,163
> Total population: 19,514,849
[recirclink id=1076135]

North Carolina
> Ukrainian-born residents: 5,348
> Pct. of total foreign-born residents: 0.64% (24th lowest)
> Total foreign-born residents: 832,602
> Total population: 10,386,227

North Dakota
> Ukrainian-born residents: 88
> Pct. of total foreign-born residents: 0.27% (9th lowest)
> Total foreign-born residents: 32,389
> Total population: 760,394
[in-text-ad-2]

Ohio
> Ukrainian-born residents: 9,396
> Pct. of total foreign-born residents: 1.73% (7th highest)
> Total foreign-born residents: 542,658
> Total population: 11,675,275

Oklahoma
> Ukrainian-born residents: 816
> Pct. of total foreign-born residents: 0.34% (11th lowest)
> Total foreign-born residents: 237,812
> Total population: 3,949,342
[in-text-ad]

Oregon
> Ukrainian-born residents: 9,576
> Pct. of total foreign-born residents: 2.34% (3rd highest)
> Total foreign-born residents: 409,867
> Total population: 4,176,346
[recirclink id=1094883]

Pennsylvania
> Ukrainian-born residents: 18,868
> Pct. of total foreign-born residents: 2.10% (5th highest)
> Total foreign-born residents: 896,848
> Total population: 12,794,885

Rhode Island
> Ukrainian-born residents: 801
> Pct. of total foreign-born residents: 0.54% (20th lowest)
> Total foreign-born residents: 148,305
> Total population: 1,057,798
[in-text-ad-2]

South Carolina
> Ukrainian-born residents: 3,977
> Pct. of total foreign-born residents: 1.51% (9th highest)
> Total foreign-born residents: 263,203
> Total population: 5,091,517

South Dakota
> Ukrainian-born residents: 1,440
> Pct. of total foreign-born residents: 4.12% (the highest)
> Total foreign-born residents: 34,911
> Total population: 879,336
[in-text-ad]

Tennessee
> Ukrainian-born residents: 2,763
> Pct. of total foreign-born residents: 0.80% (21st highest)
> Total foreign-born residents: 347,210
> Total population: 6,772,268
[recirclink id=1094852]

Texas
> Ukrainian-born residents: 6,751
> Pct. of total foreign-born residents: 0.14% (2nd lowest)
> Total foreign-born residents: 4,822,952
> Total population: 28,635,442

Utah
> Ukrainian-born residents: 583
> Pct. of total foreign-born residents: 0.22% (4th lowest)
> Total foreign-born residents: 264,538
> Total population: 3,151,239
[in-text-ad-2]

Vermont
> Ukrainian-born residents: 253
> Pct. of total foreign-born residents: 0.89% (18th highest)
> Total foreign-born residents: 28,468
> Total population: 624,340

Virginia
> Ukrainian-born residents: 4,732
> Pct. of total foreign-born residents: 0.44% (17th lowest)
> Total foreign-born residents: 1,068,470
> Total population: 8,509,358
[in-text-ad]

Washington
> Ukrainian-born residents: 34,277
> Pct. of total foreign-born residents: 3.15% (2nd highest)
> Total foreign-born residents: 1,089,651
> Total population: 7,512,465
[recirclink id=1083287]

West Virginia
> Ukrainian-born residents: 115
> Pct. of total foreign-born residents: 0.39% (13th lowest)
> Total foreign-born residents: 29,584
> Total population: 1,807,426

Wisconsin
> Ukrainian-born residents: 1,872
> Pct. of total foreign-born residents: 0.64% (25th lowest)
> Total foreign-born residents: 291,187
> Total population: 5,806,975
[in-text-ad-2]

Wyoming
> Ukrainian-born residents: 372
> Pct. of total foreign-born residents: 1.93% (6th highest)
> Total foreign-born residents: 19,274
> Total population: 581,348
Contact [email protected] for any questions or corrections.