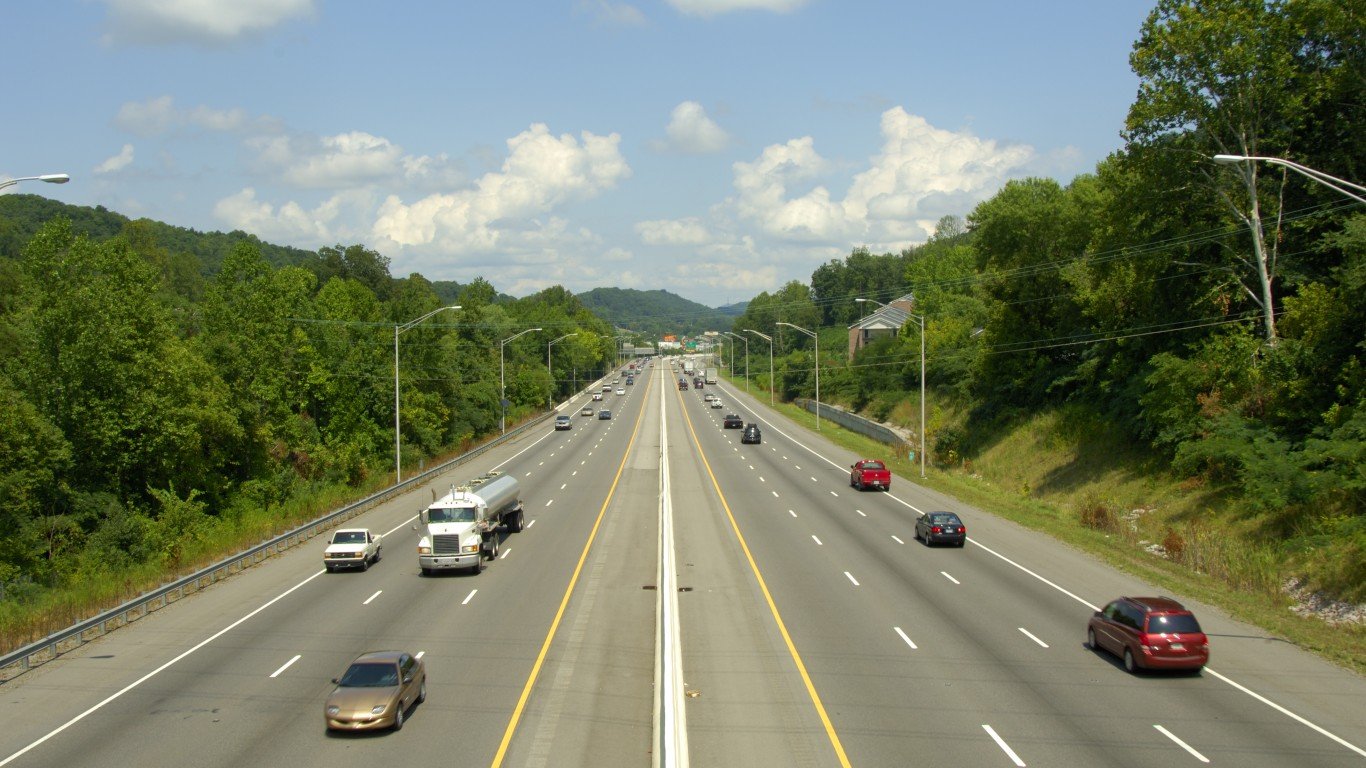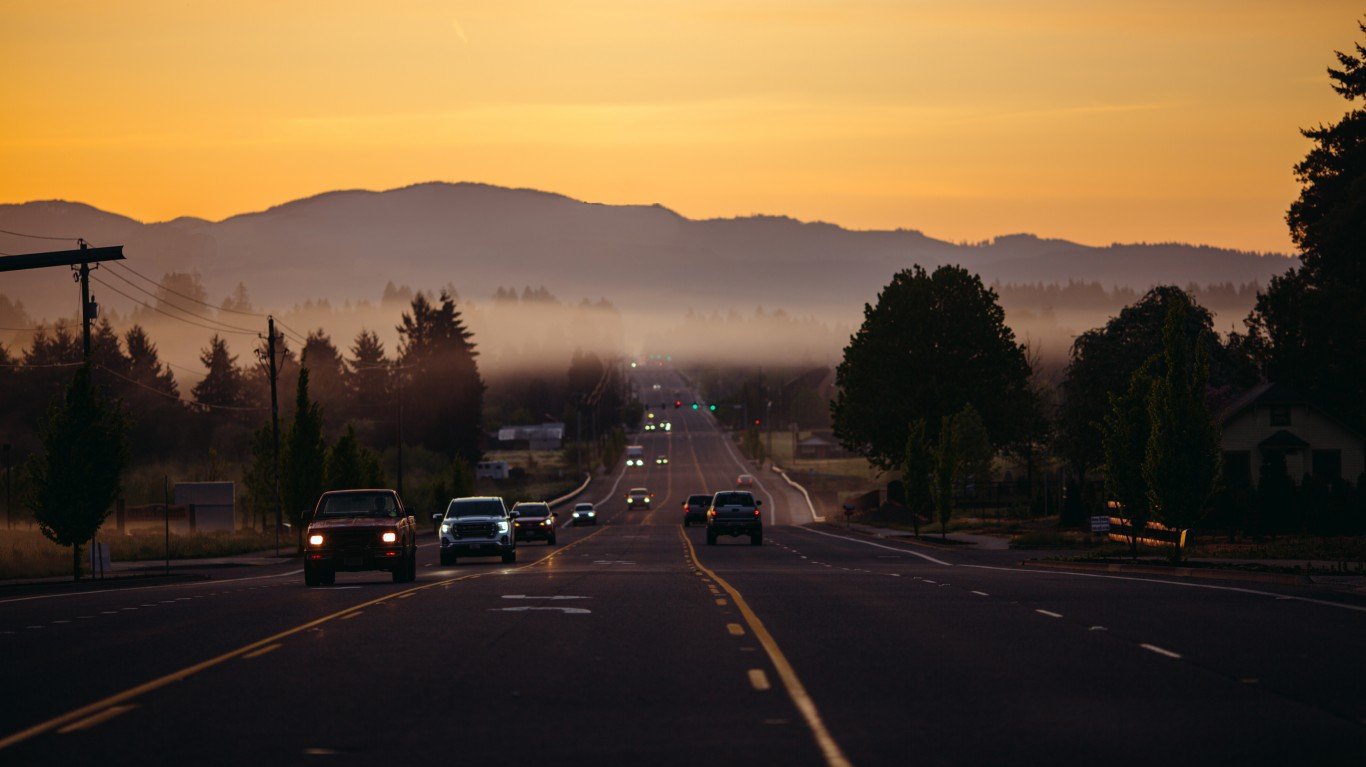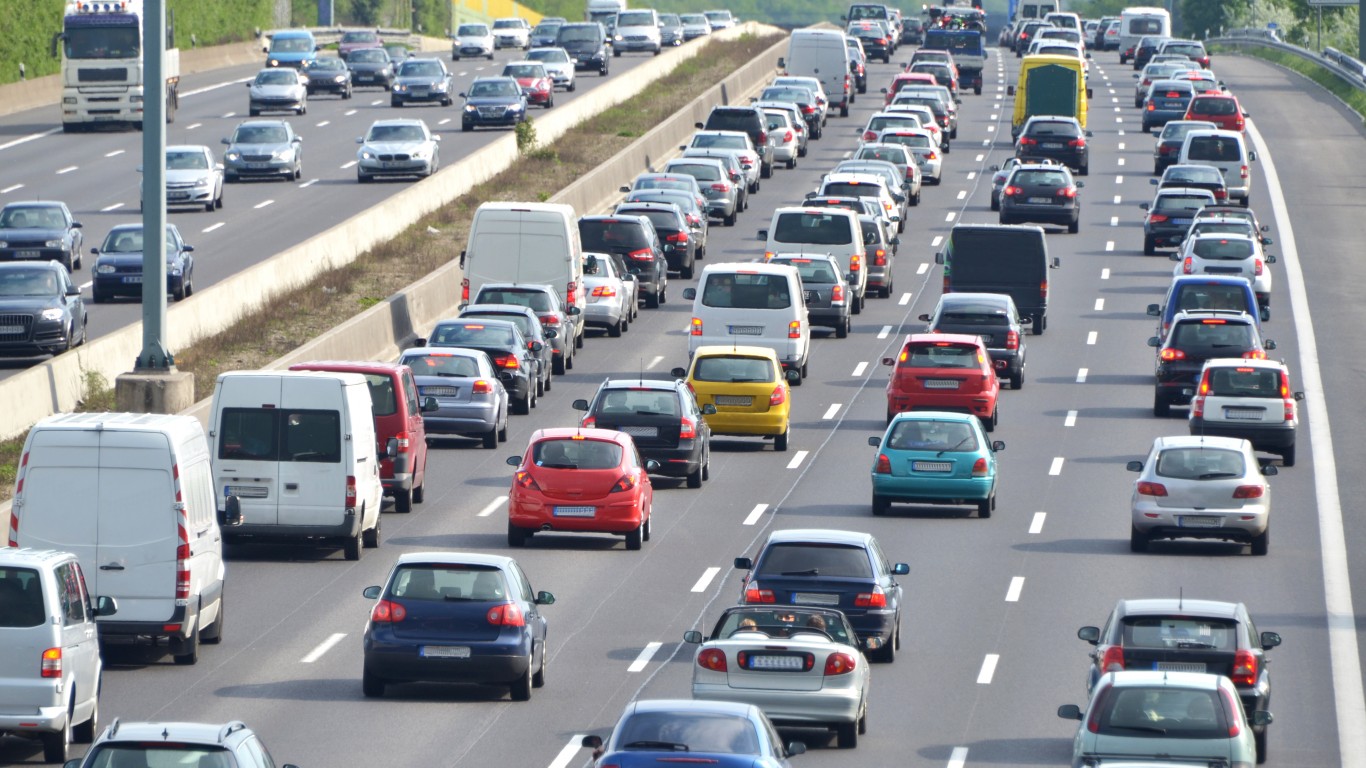
The share of Americans working from home skyrocketed during the pandemic. A recent Gallup study found that 45% of full-time workers in the United States – and two-thirds of white-collar workers – were doing their job remotely at least some of the time.
The shift is proving to be a positive development for millions of Americans. Gallup reports that over 90% of remote workers hope that the trend continues after the pandemic, citing the lack of commute time as the chief benefit. (Here is a look at the state where the most people are working from home.)
According to the U.S. Census Bureau, the average commute time in the United States is 26.9 minutes. For those who have shifted to full-time remote work, this translates to about 4.5 hours per week, or nearly 10 days a year, of time that they did not have before.
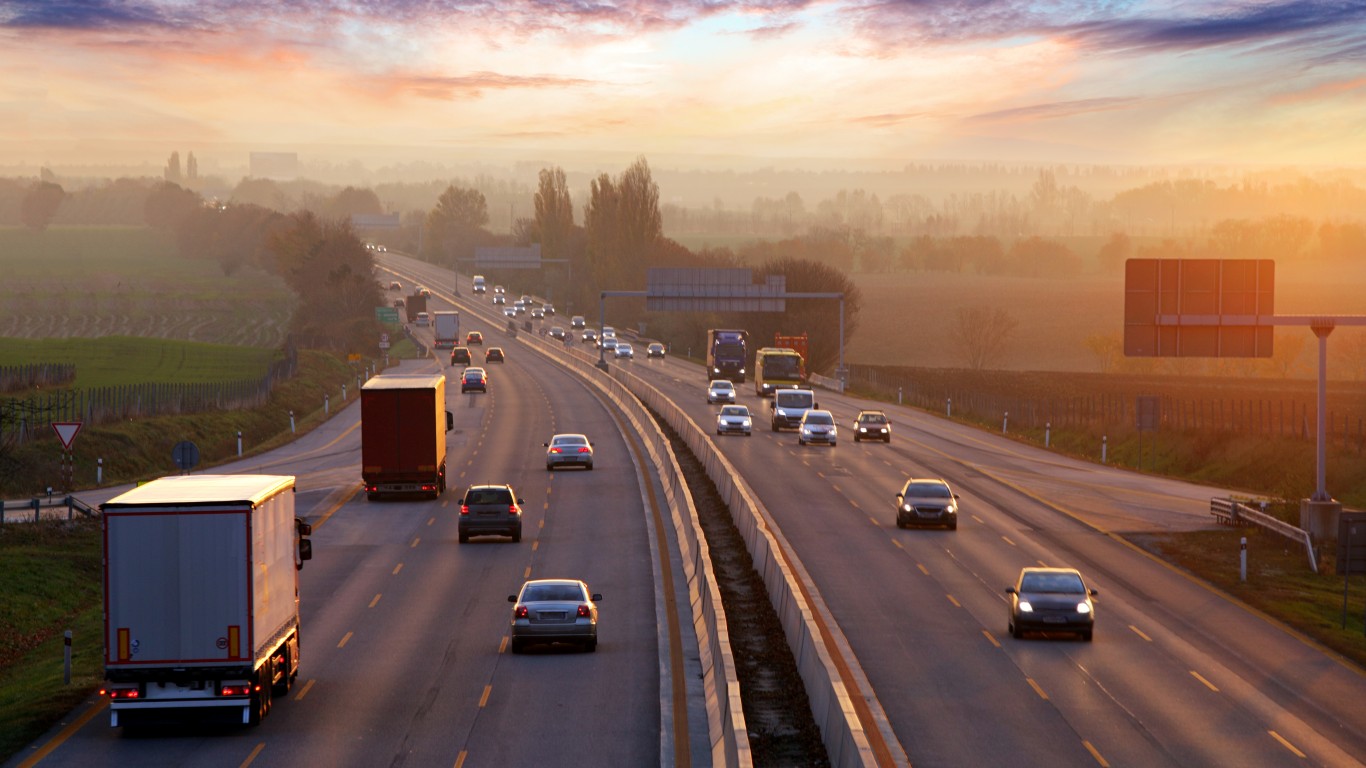
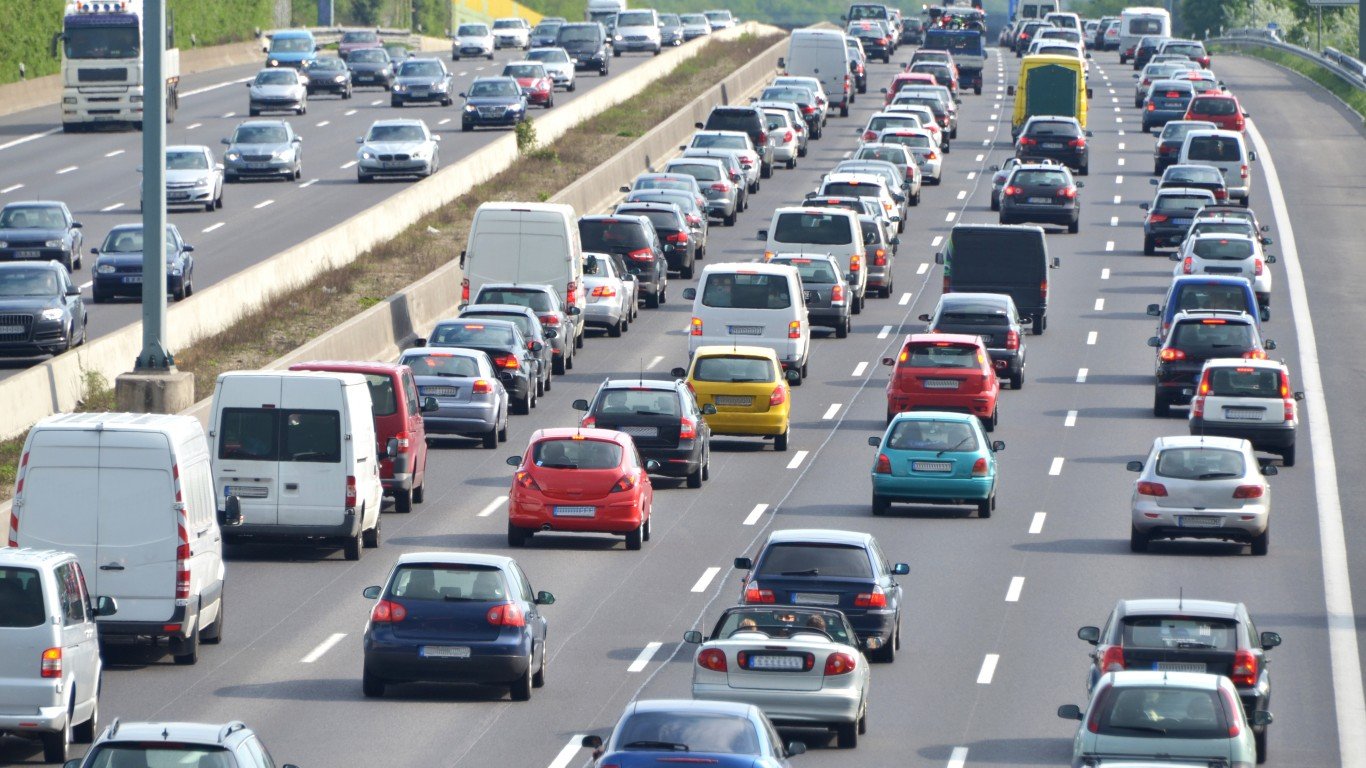
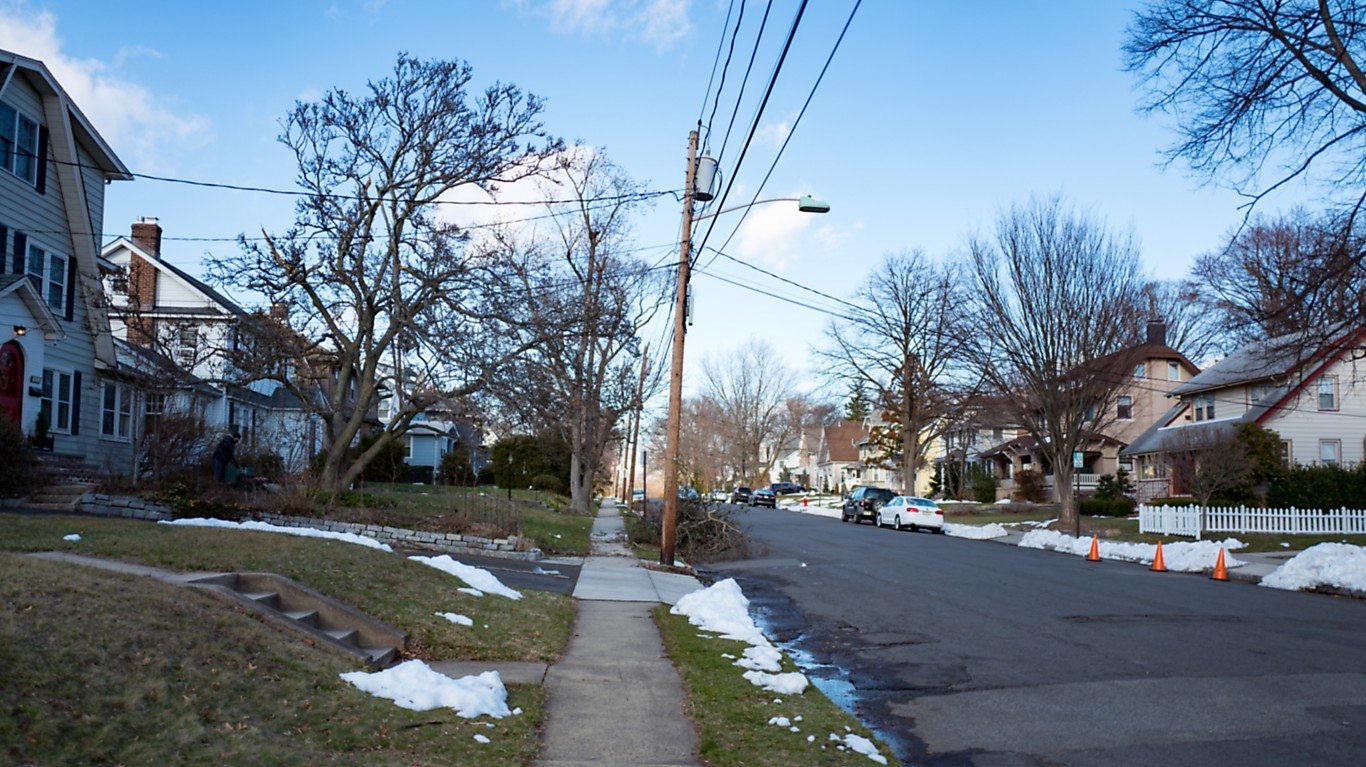
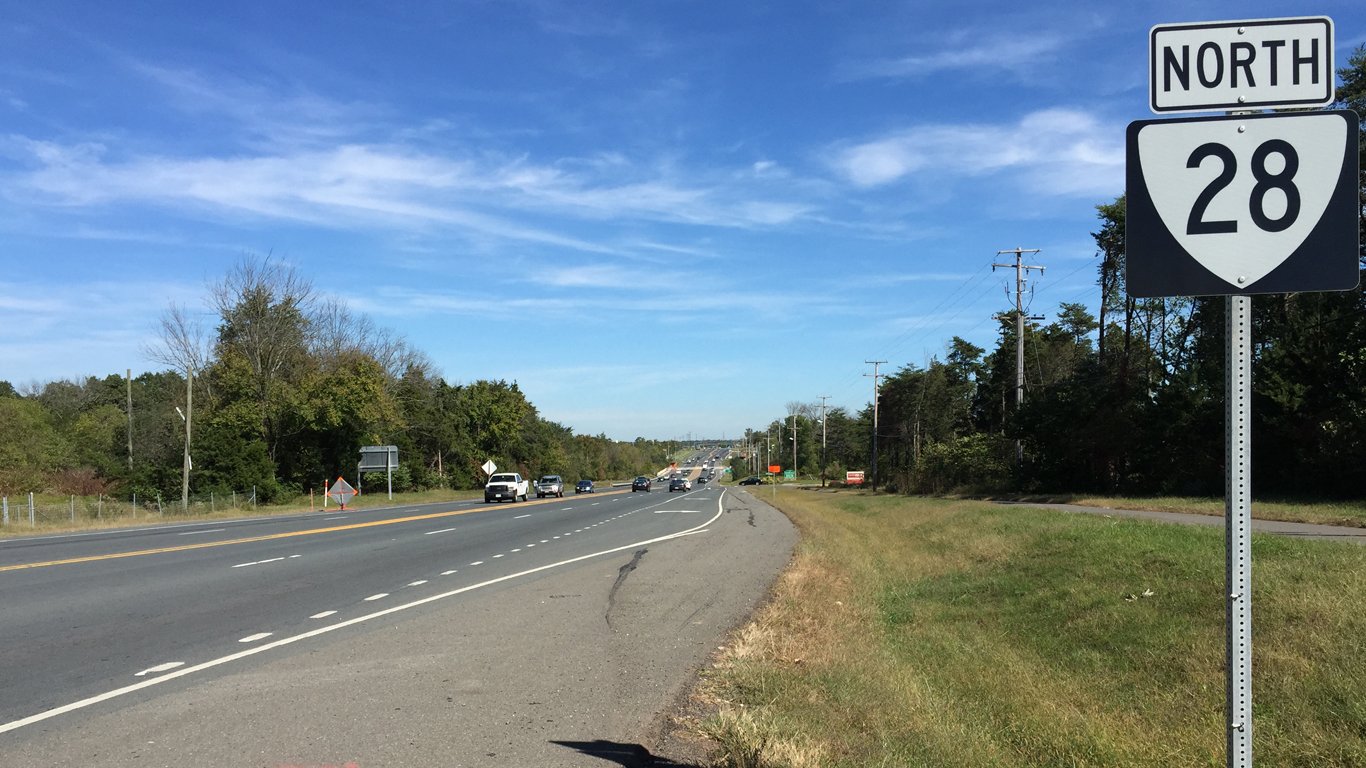
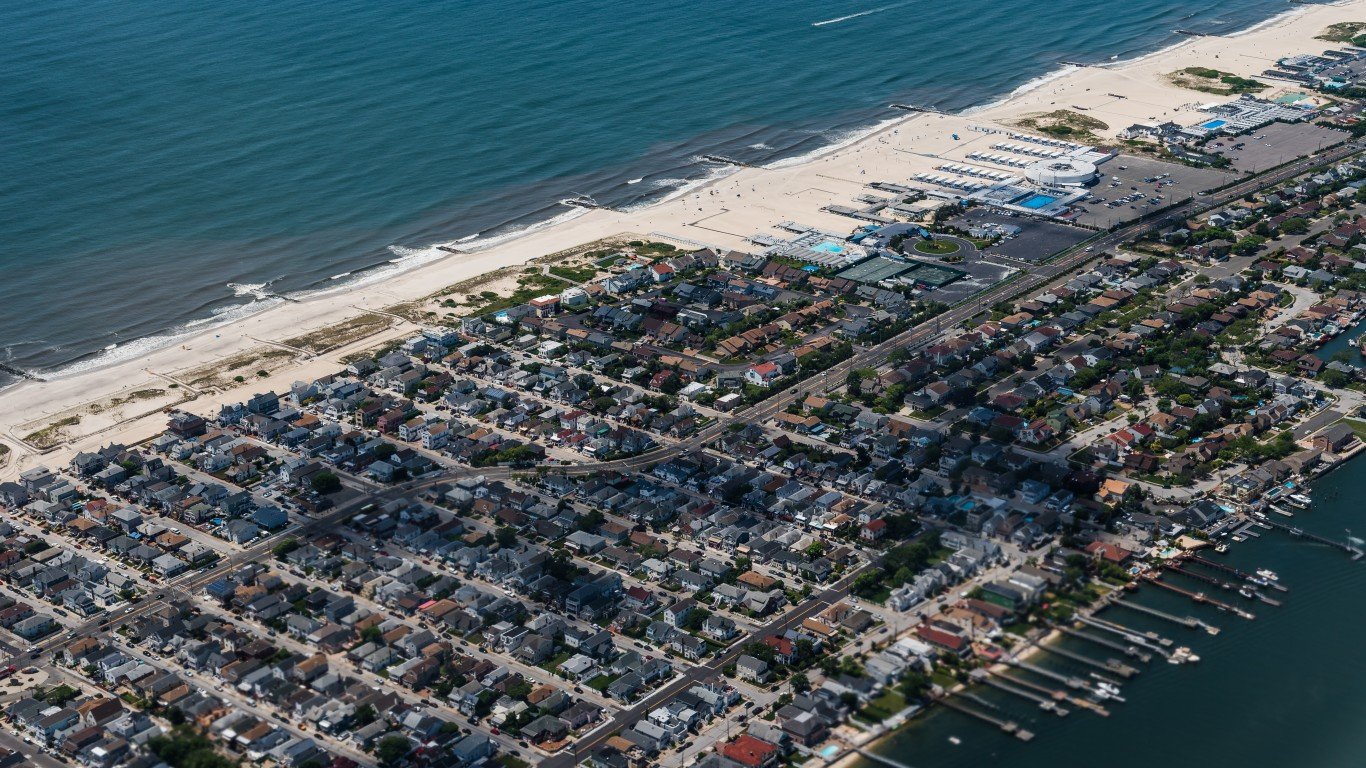
Of course, commute times vary from person to person, but in some parts of the country, workers are far more likely to have longer commutes than in others. Using census data, 24/7 Wall St. identified the 50 U.S. cities with the longest commutes.
Among the cities on this list, average commute times range from about 38 minutes up to nearly 48 minutes. Over the course of a week, these commute times add up, from over six hours up to eight – and in most cases, more than two weeks over the course of a year for those who commute every Monday through Friday.
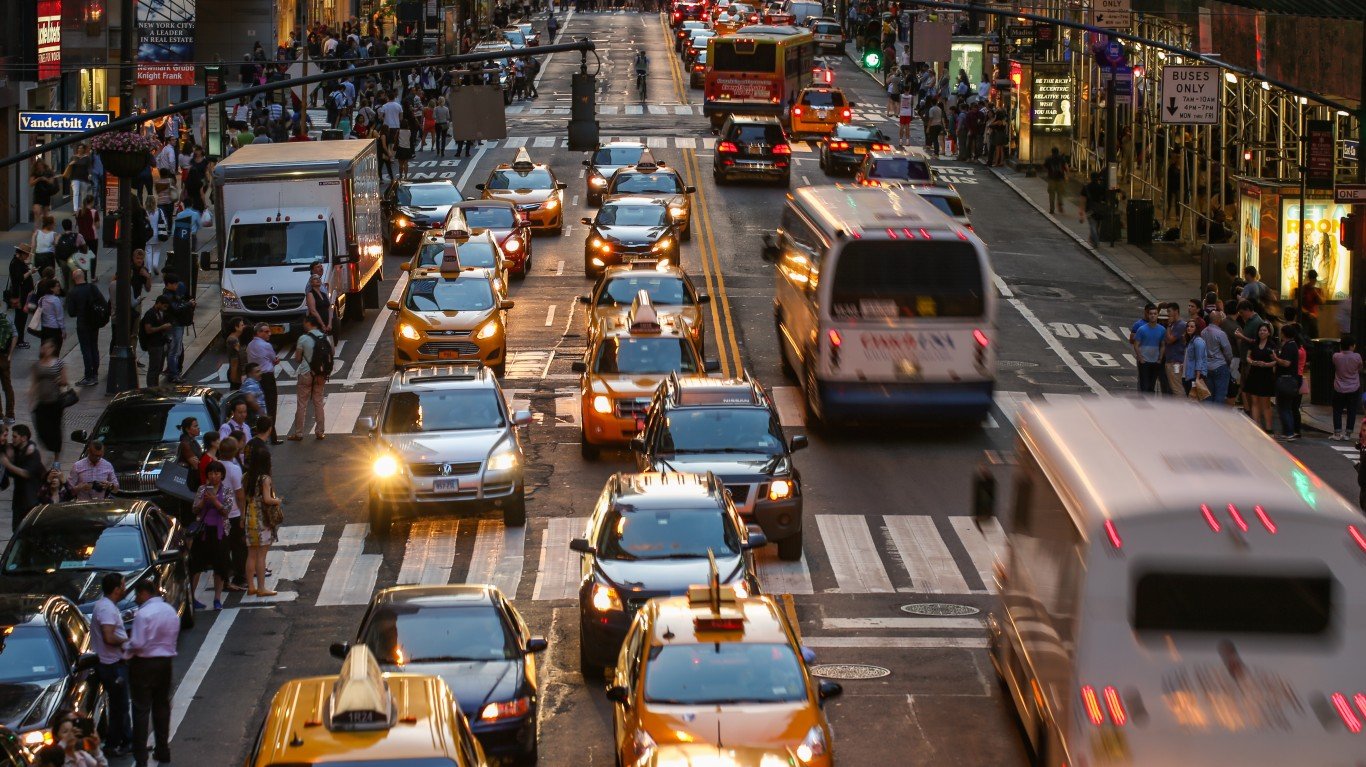
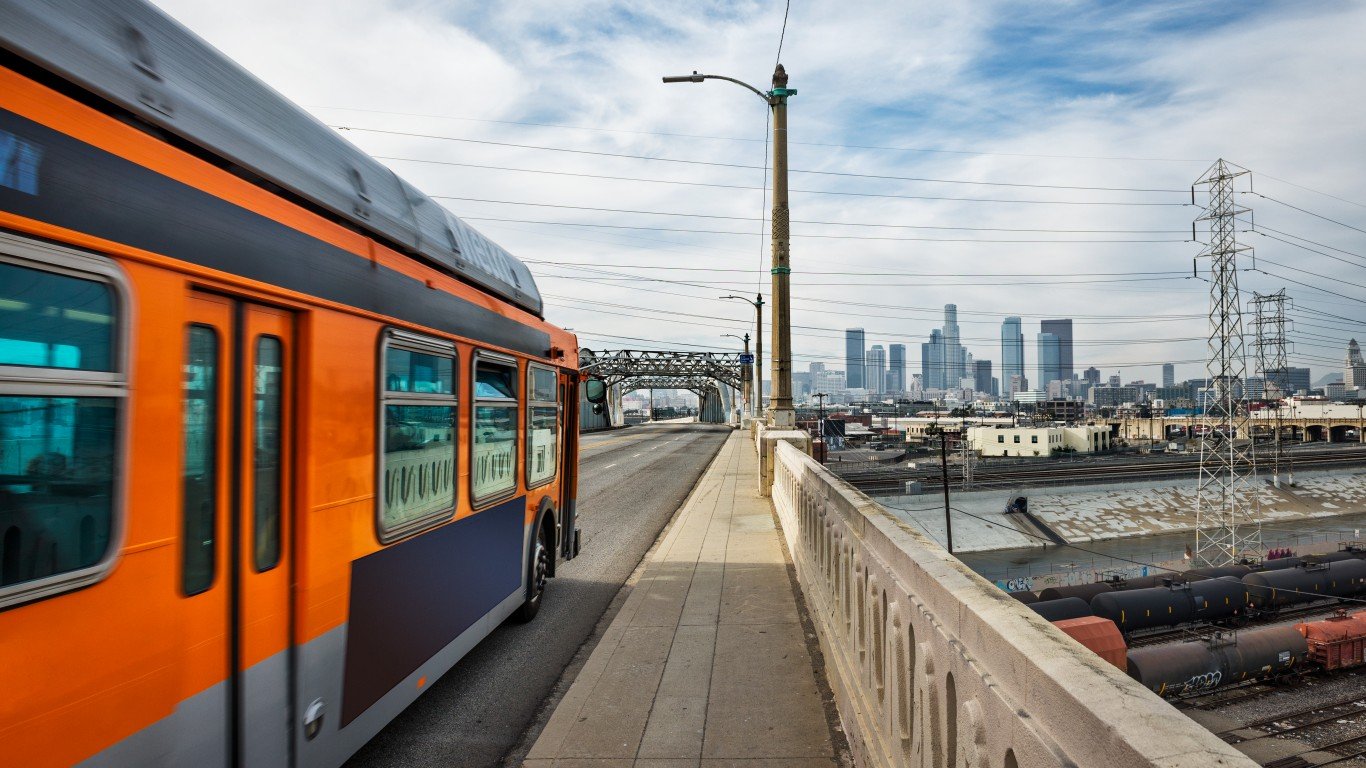
Several cities on this list, including New York and Hoboken, New Jersey, have reliable public transportation systems, and the share of workers commuting with public transit far exceeds the 4.6% national average. In most cases, public transportation is less direct than simply driving from door to door, adding to overall commute time.
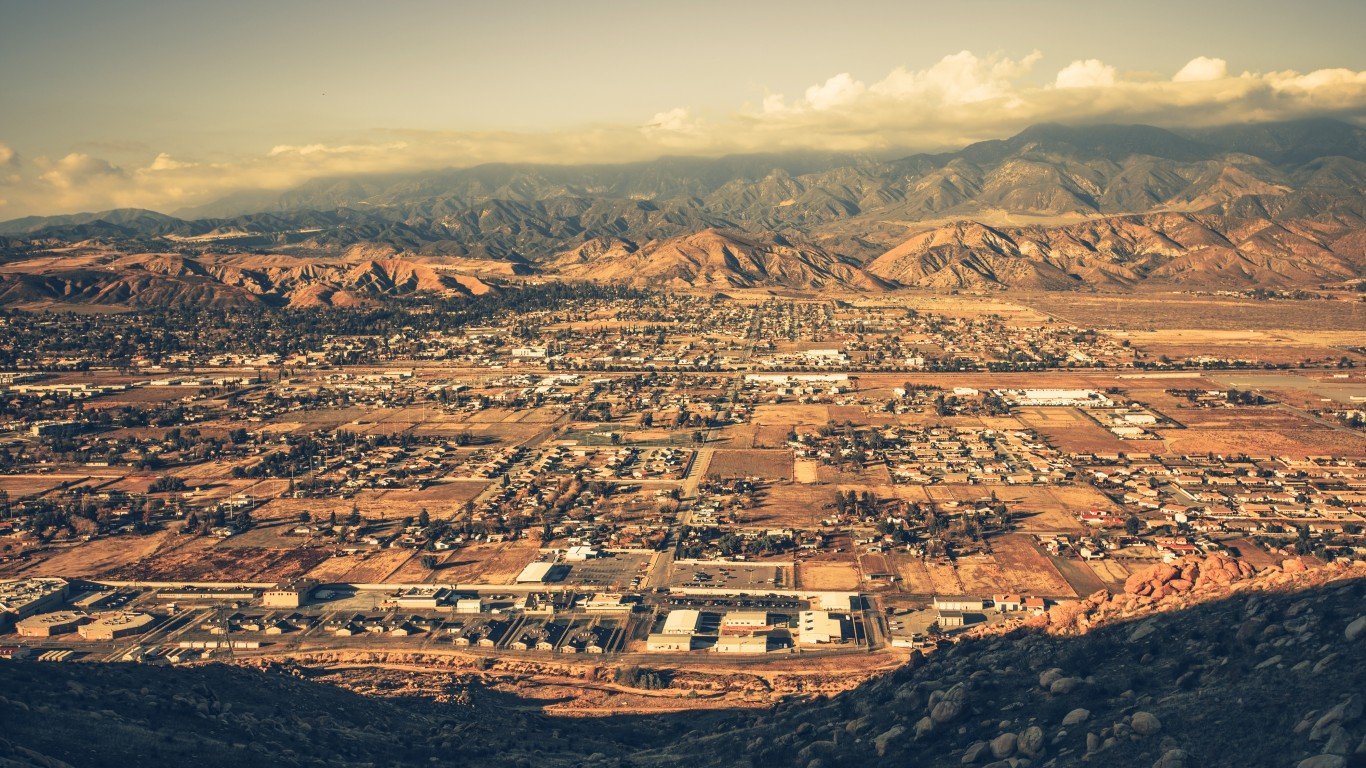
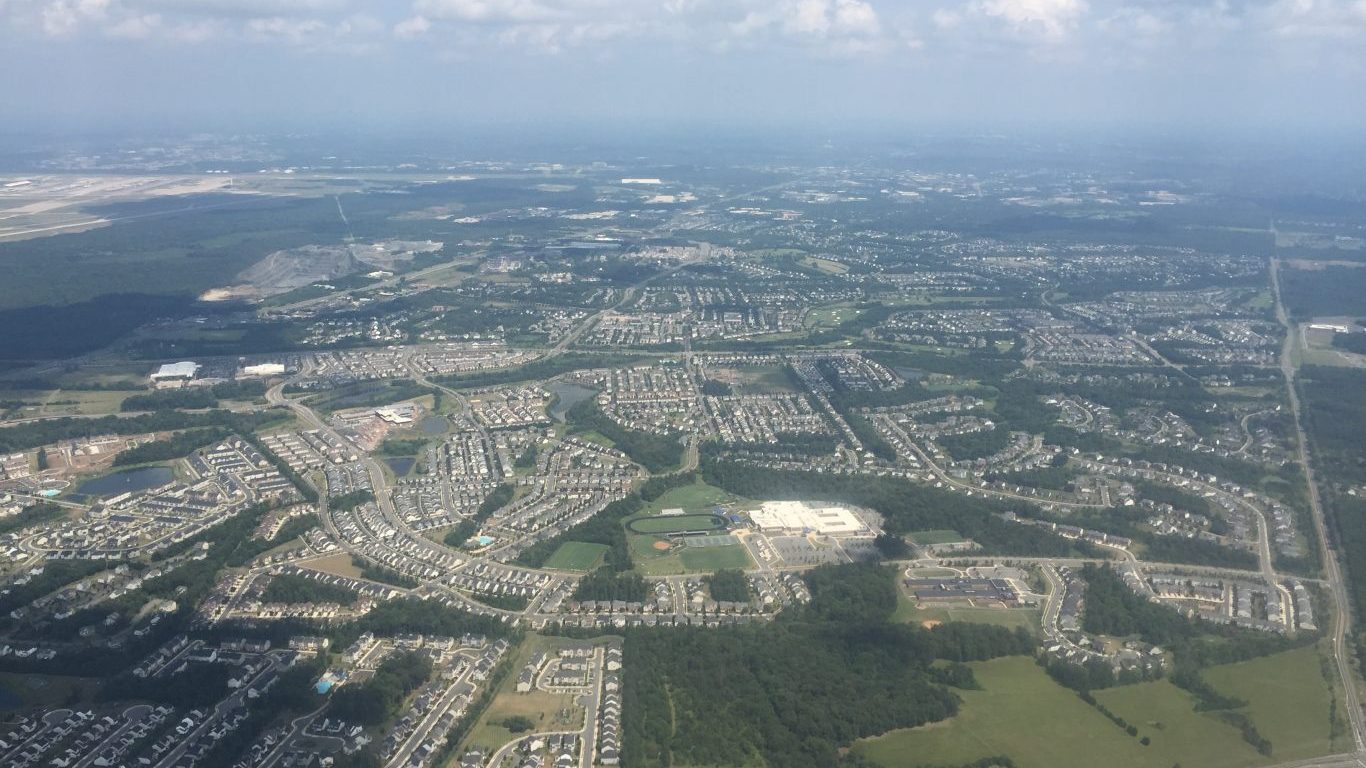
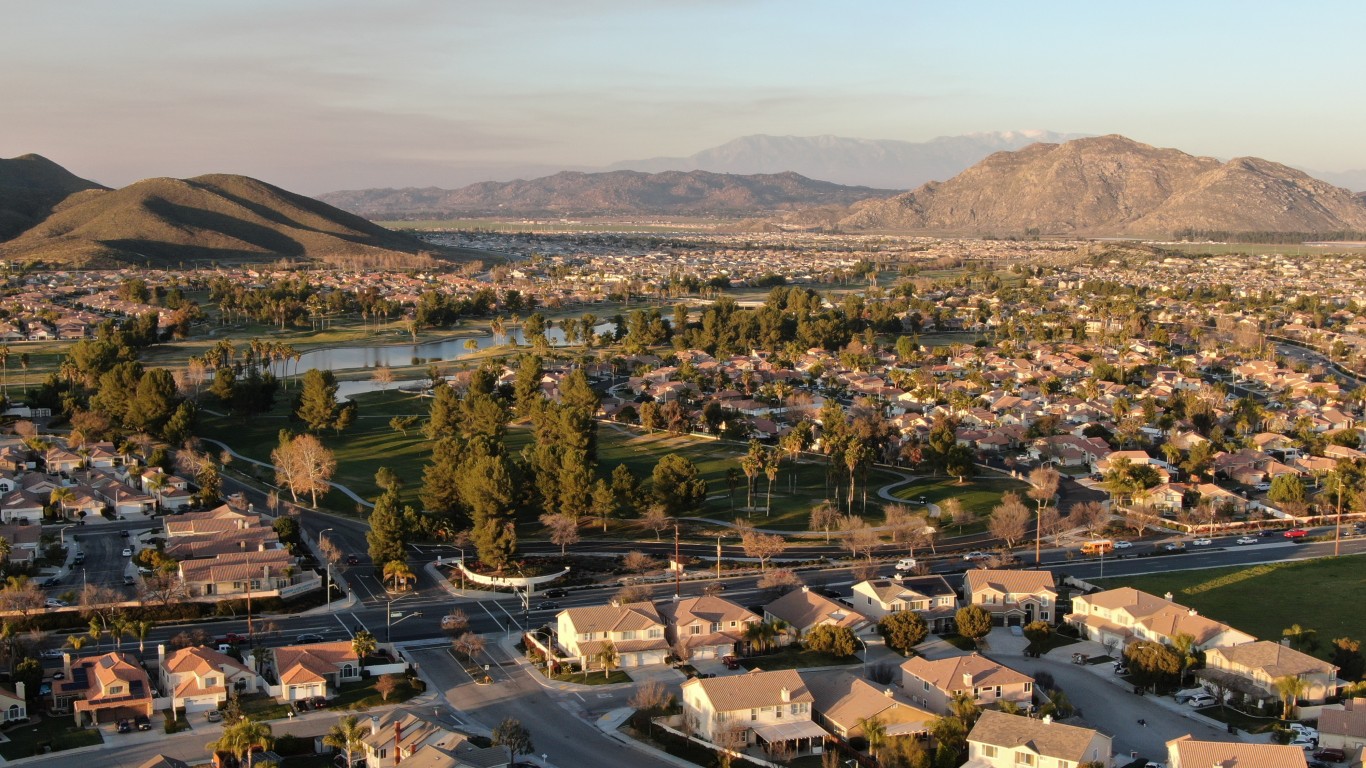
Additionally, nearly half of the cities on this list are located in California – and many of those are in relatively close proximity to Los Angeles or San Francisco, cities with notoriously bad traffic congestion. Here is a look at the cities where people lose the most time driving each year.
Click here to see the cities with the longest commutes
Click here to read our detailed methodology
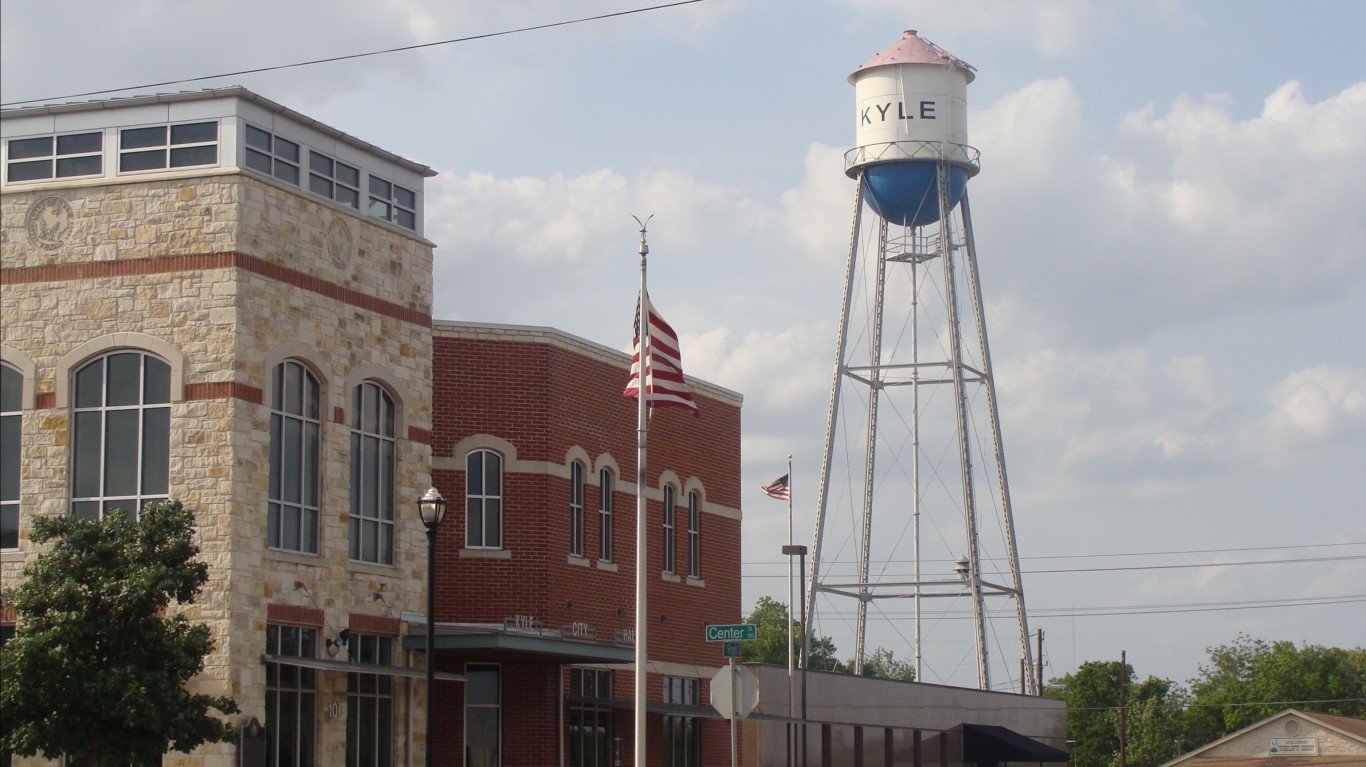
50. Kyle, Texas
> Avg. commute time (minutes): 38.1
> Share of commuters driving alone: 82.7% — 284th highest of 1,789 cities
> Share of commuters carpooling: 8.7% — 809th lowest of 1,789 cities
> Share of commuters using public transit: 0.0% reported — the lowest of 1,789 cities (tied)
[in-text-ad]

49. Bay Point, California
> Avg. commute time (minutes): 38.3
> Share of commuters driving alone: 71.3% — 346th lowest of 1,789 cities
> Share of commuters carpooling: 18.9% — 14th highest of 1,789 cities
> Share of commuters using public transit: 4.6% — 386th highest of 1,789 cities
[recirclink id=987778]
48. Wildomar, California
> Avg. commute time (minutes): 38.4
> Share of commuters driving alone: 80.3% — 539th highest of 1,789 cities
> Share of commuters carpooling: 10.9% — 428th highest of 1,789 cities
> Share of commuters using public transit: 0.9% — 639th lowest of 1,789 cities
47. San Ramon, California
> Avg. commute time (minutes): 38.4
> Share of commuters driving alone: 67.6% — 227th lowest of 1,789 cities
> Share of commuters carpooling: 7.3% — 445th lowest of 1,789 cities
> Share of commuters using public transit: 8.4% — 192nd highest of 1,789 cities
[in-text-ad-2]

46. Woodbridge, Virginia
> Avg. commute time (minutes): 38.4
> Share of commuters driving alone: 75.7% — 672nd lowest of 1,789 cities
> Share of commuters carpooling: 9.8% — 708th highest of 1,789 cities
> Share of commuters using public transit: 4.1% — 423rd highest of 1,789 cities
45. Westfield, New Jersey
> Avg. commute time (minutes): 38.5
> Share of commuters driving alone: 58.0% — 85th lowest of 1,789 cities
> Share of commuters carpooling: 2.9% — 2nd lowest of 1,789 cities
> Share of commuters using public transit: 20.1% — 41st highest of 1,789 cities
[in-text-ad]
44. Ridgewood, New Jersey
> Avg. commute time (minutes): 38.5
> Share of commuters driving alone: 55.8% — 67th lowest of 1,789 cities
> Share of commuters carpooling: 5.0% — 88th lowest of 1,789 cities
> Share of commuters using public transit: 18.1% — 53rd highest of 1,789 cities
[recirclink id=1044820]
43. South Riding, Virginia
> Avg. commute time (minutes): 38.7
> Share of commuters driving alone: 75.3% — 637th lowest of 1,789 cities
> Share of commuters carpooling: 6.9% — 359th lowest of 1,789 cities
> Share of commuters using public transit: 3.3% — 513th highest of 1,789 cities
42. Clarksburg, Maryland
> Avg. commute time (minutes): 38.8
> Share of commuters driving alone: 73.1% — 463rd lowest of 1,789 cities
> Share of commuters carpooling: 9.5% — 768th highest of 1,789 cities
> Share of commuters using public transit: 4.9% — 372nd highest of 1,789 cities
[in-text-ad-2]
41. Chino Hills, California
> Avg. commute time (minutes): 38.8
> Share of commuters driving alone: 78.6% — 775th highest of 1,789 cities
> Share of commuters carpooling: 9.6% — 745th highest of 1,789 cities
> Share of commuters using public transit: 0.9% — 656th lowest of 1,789 cities

40. Canyon Lake, Texas
> Avg. commute time (minutes): 38.9
> Share of commuters driving alone: 78.8% — 744th highest of 1,789 cities
> Share of commuters carpooling: 6.0% — 199th lowest of 1,789 cities
> Share of commuters using public transit: 0.0% reported — the lowest of 1,789 cities (tied)
[in-text-ad]
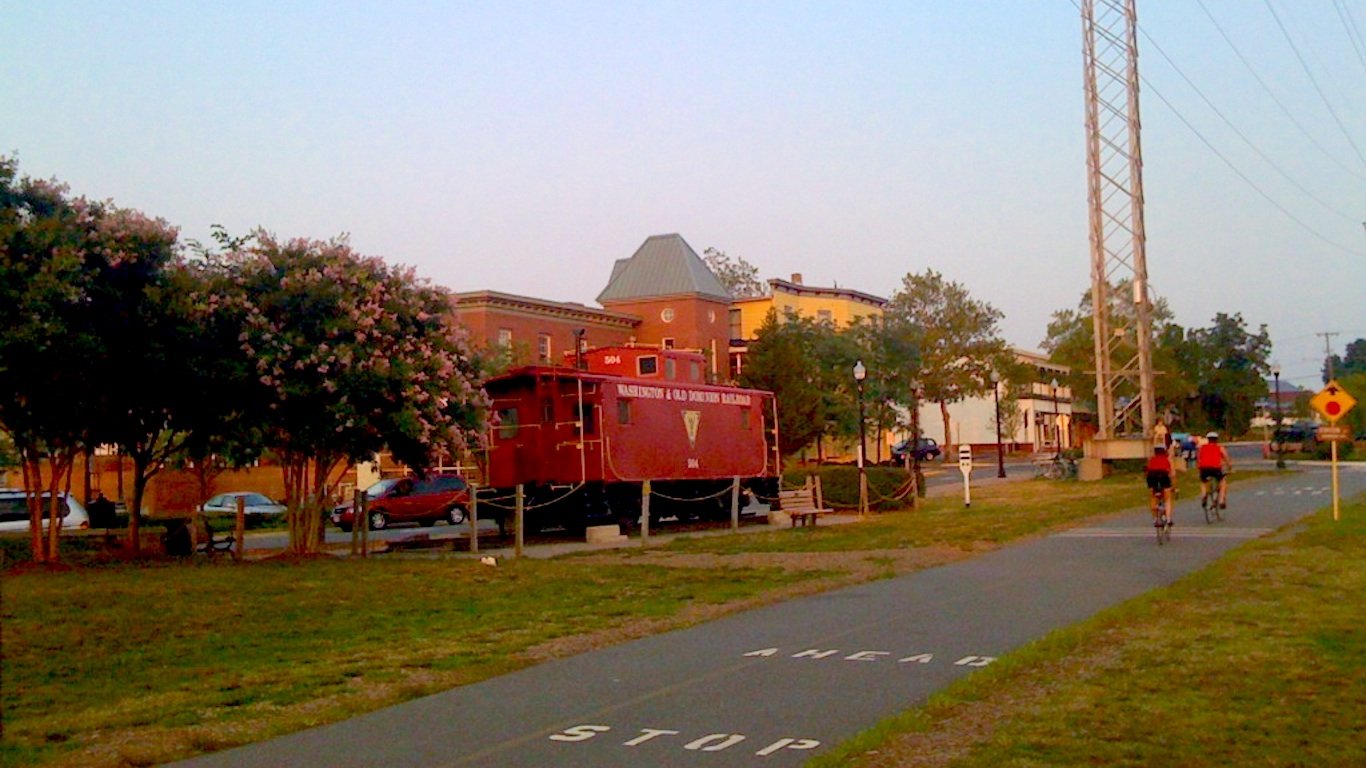
39. Hoboken, New Jersey
> Avg. commute time (minutes): 39.0
> Share of commuters driving alone: 21.7% — the lowest of 1,789 cities
> Share of commuters carpooling: 1.4% — the lowest of 1,789 cities
> Share of commuters using public transit: 52.7% — 2nd highest of 1,789 cities
[recirclink id=1054986]
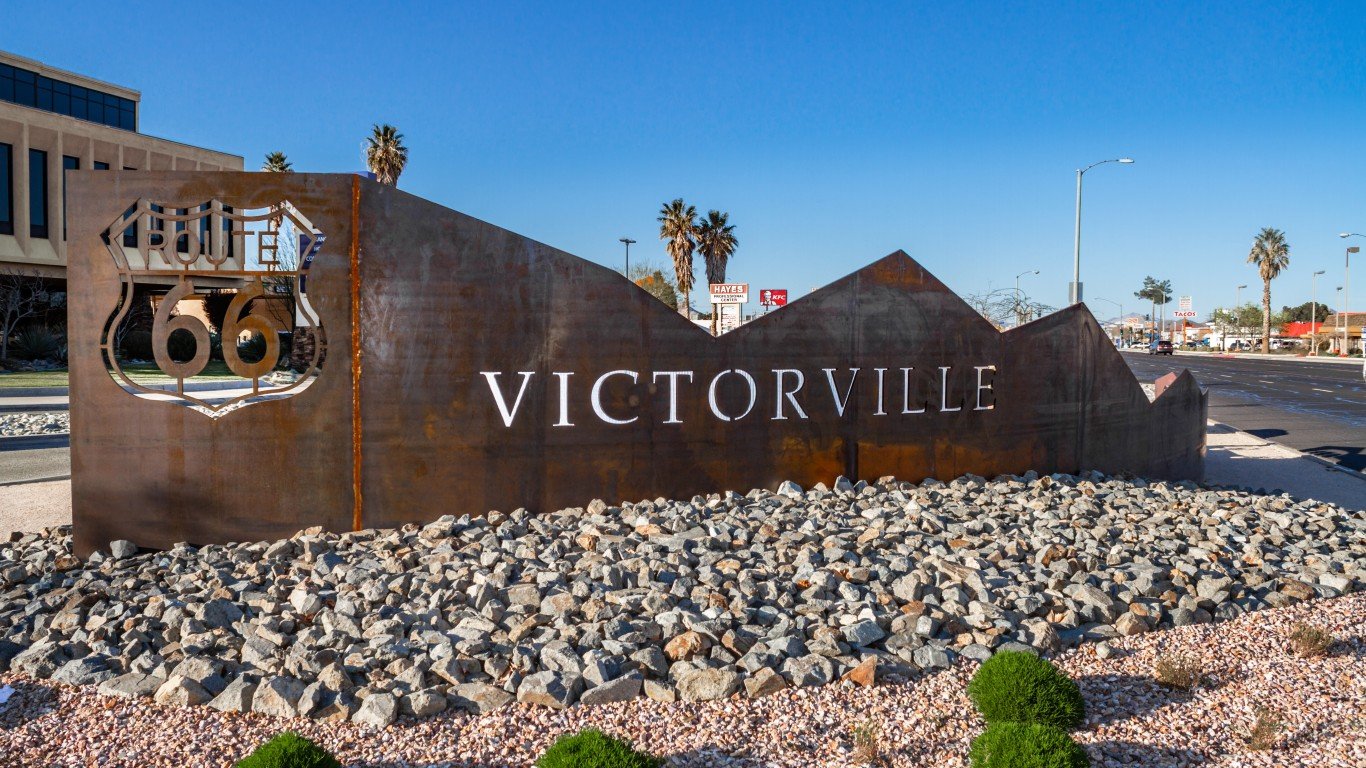
38. Victorville, California
> Avg. commute time (minutes): 39.3
> Share of commuters driving alone: 75.8% — 680th lowest of 1,789 cities
> Share of commuters carpooling: 13.0% — 185th highest of 1,789 cities
> Share of commuters using public transit: 1.2% — 758th lowest of 1,789 cities
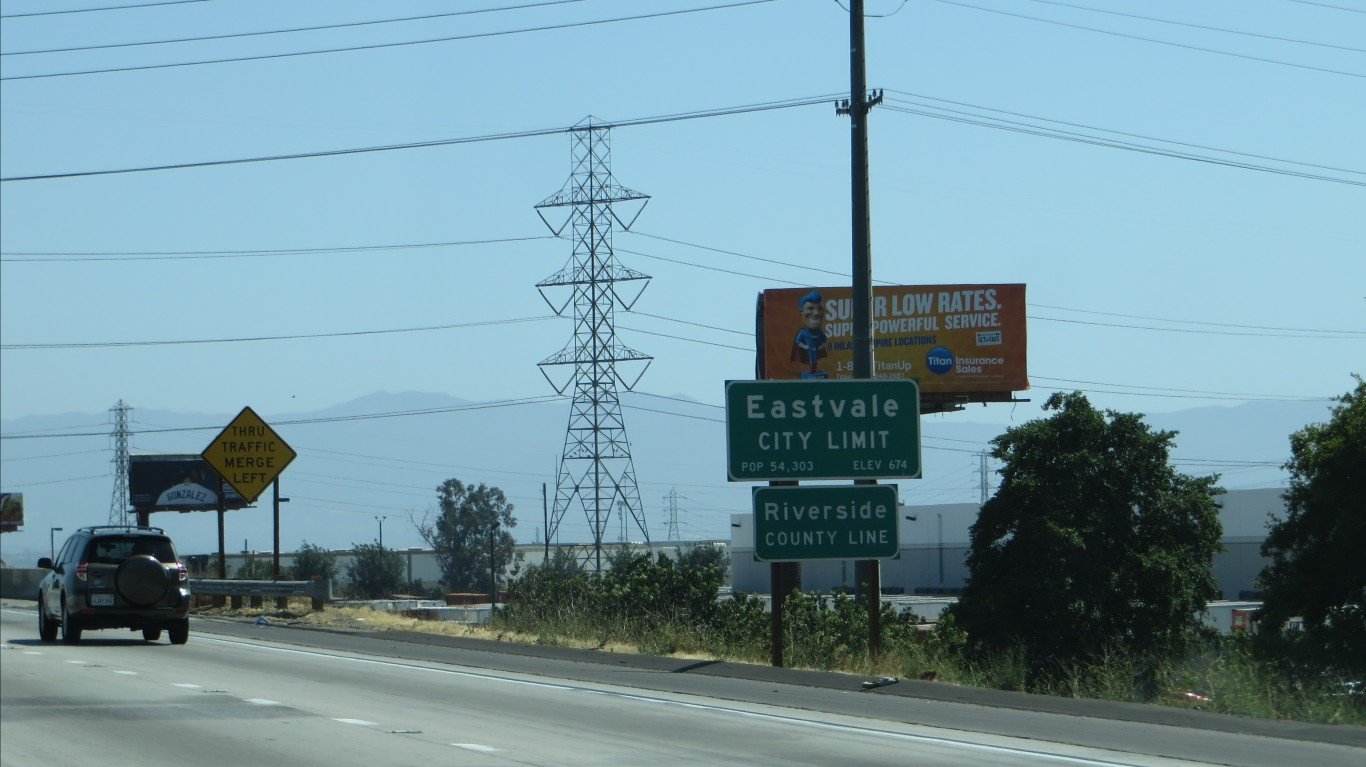
37. Eastvale, California
> Avg. commute time (minutes): 39.5
> Share of commuters driving alone: 75.6% — 654th lowest of 1,789 cities
> Share of commuters carpooling: 13.5% — 153rd highest of 1,789 cities
> Share of commuters using public transit: 1.3% — 789th lowest of 1,789 cities
[in-text-ad-2]

36. San Jacinto, California
> Avg. commute time (minutes): 39.6
> Share of commuters driving alone: 77.8% — 886th highest of 1,789 cities
> Share of commuters carpooling: 13.3% — 170th highest of 1,789 cities
> Share of commuters using public transit: 0.8% — 565th lowest of 1,789 cities
35. South Miami Heights, Florida
> Avg. commute time (minutes): 39.6
> Share of commuters driving alone: 81.4% — 409th highest of 1,789 cities
> Share of commuters carpooling: 8.5% — 750th lowest of 1,789 cities
> Share of commuters using public transit: 2.2% — 724th highest of 1,789 cities
[in-text-ad]
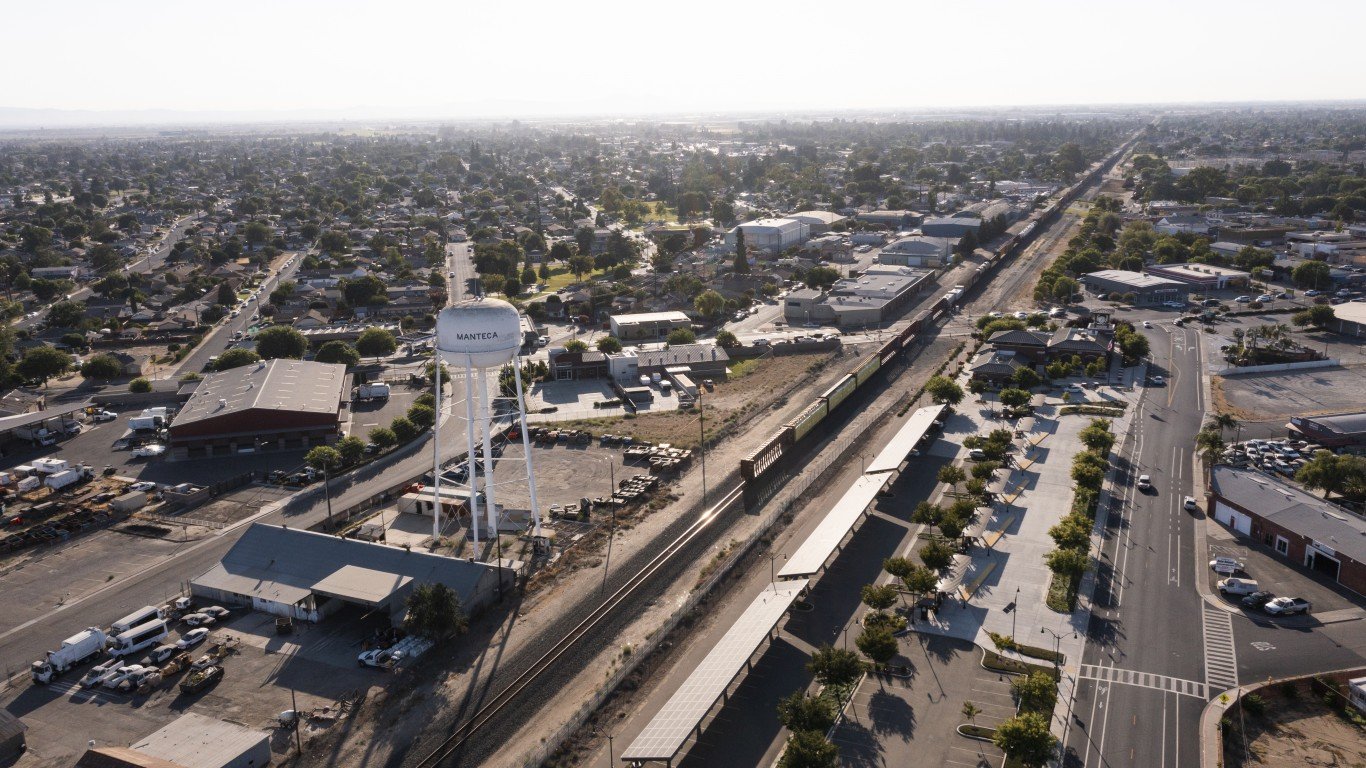
34. Manteca, California
> Avg. commute time (minutes): 39.8
> Share of commuters driving alone: 78.7% — 765th highest of 1,789 cities
> Share of commuters carpooling: 11.5% — 337th highest of 1,789 cities
> Share of commuters using public transit: 1.8% — 808th highest of 1,789 cities
[recirclink id=1060122]
33. Kendall West, Florida
> Avg. commute time (minutes): 40.0
> Share of commuters driving alone: 87.1% — 35th highest of 1,789 cities
> Share of commuters carpooling: 5.4% — 134th lowest of 1,789 cities
> Share of commuters using public transit: 1.6% — 884th highest of 1,789 cities

32. Old Bridge, New Jersey
> Avg. commute time (minutes): 40.1
> Share of commuters driving alone: 73.5% — 489th lowest of 1,789 cities
> Share of commuters carpooling: 9.0% — 875th lowest of 1,789 cities
> Share of commuters using public transit: 9.9% — 148th highest of 1,789 cities
[in-text-ad-2]
31. Homestead, Florida
> Avg. commute time (minutes): 40.1
> Share of commuters driving alone: 67.0% — 210th lowest of 1,789 cities
> Share of commuters carpooling: 21.0% — 8th highest of 1,789 cities
> Share of commuters using public transit: 4.6% — 384th highest of 1,789 cities
30. Dale City, Virginia
> Avg. commute time (minutes): 40.2
> Share of commuters driving alone: 74.7% — 573rd lowest of 1,789 cities
> Share of commuters carpooling: 11.0% — 419th highest of 1,789 cities
> Share of commuters using public transit: 4.2% — 417th highest of 1,789 cities
[in-text-ad]

29. Clinton, Maryland
> Avg. commute time (minutes): 40.3
> Share of commuters driving alone: 72.0% — 379th lowest of 1,789 cities
> Share of commuters carpooling: 7.5% — 510th lowest of 1,789 cities
> Share of commuters using public transit: 12.6% — 96th highest of 1,789 cities
[recirclink id=1024519]

28. Elmont, New York
> Avg. commute time (minutes): 40.5
> Share of commuters driving alone: 65.8% — 173rd lowest of 1,789 cities
> Share of commuters carpooling: 7.1% — 397th lowest of 1,789 cities
> Share of commuters using public transit: 21.3% — 36th highest of 1,789 cities
27. French Valley, California
> Avg. commute time (minutes): 40.9
> Share of commuters driving alone: 80.7% — 490th highest of 1,789 cities
> Share of commuters carpooling: 8.7% — 796th lowest of 1,789 cities
> Share of commuters using public transit: 0.5% — 410th lowest of 1,789 cities
[in-text-ad-2]

26. Dublin, California
> Avg. commute time (minutes): 41.0
> Share of commuters driving alone: 62.3% — 124th lowest of 1,789 cities
> Share of commuters carpooling: 8.6% — 784th lowest of 1,789 cities
> Share of commuters using public transit: 14.3% — 80th highest of 1,789 cities

25. Maple Valley, Washington
> Avg. commute time (minutes): 41.1
> Share of commuters driving alone: 76.3% — 733rd lowest of 1,789 cities
> Share of commuters carpooling: 7.6% — 517th lowest of 1,789 cities
> Share of commuters using public transit: 3.1% — 540th highest of 1,789 cities
[in-text-ad]

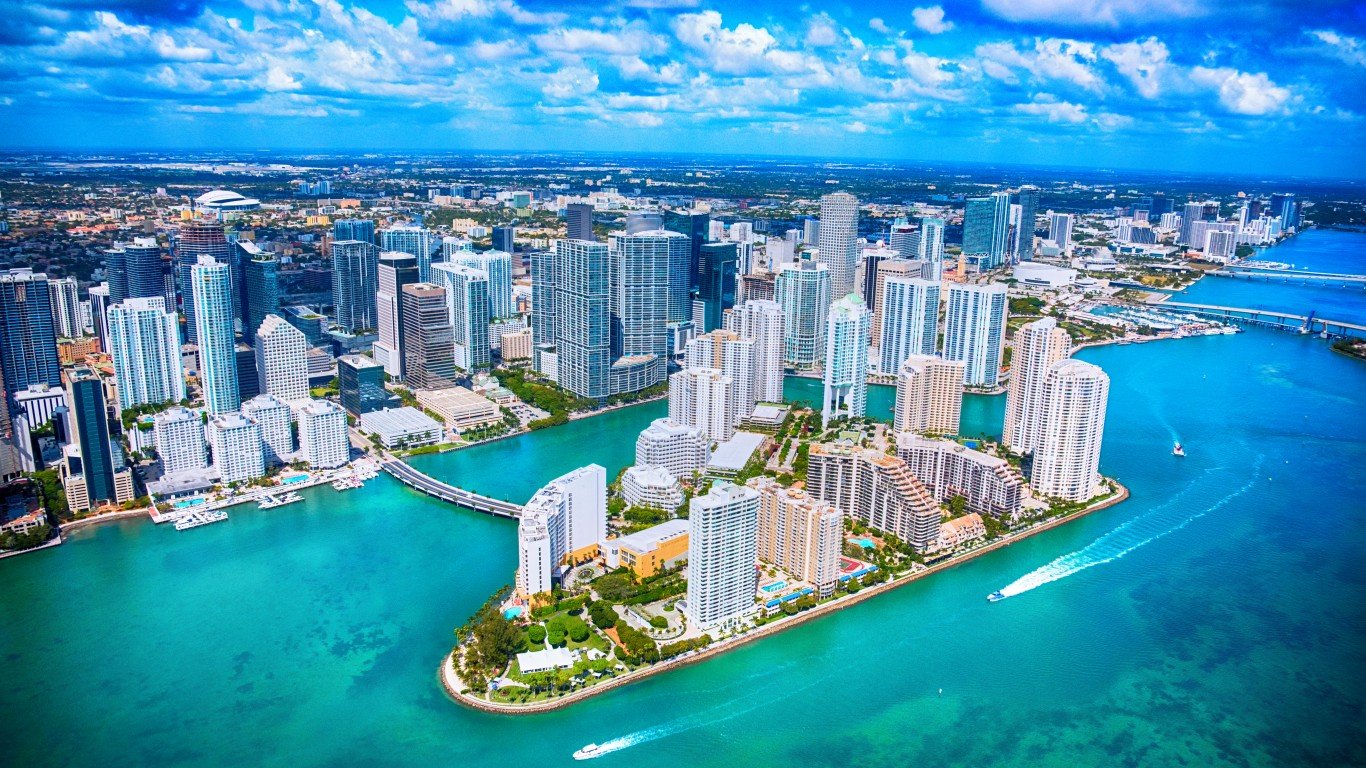
24. New York, New York
> Avg. commute time (minutes): 41.4
> Share of commuters driving alone: 22.3% — 2nd lowest of 1,789 cities
> Share of commuters carpooling: 4.5% — 42nd lowest of 1,789 cities
> Share of commuters using public transit: 52.8% — the highest of 1,789 cities
[recirclink id=987778]
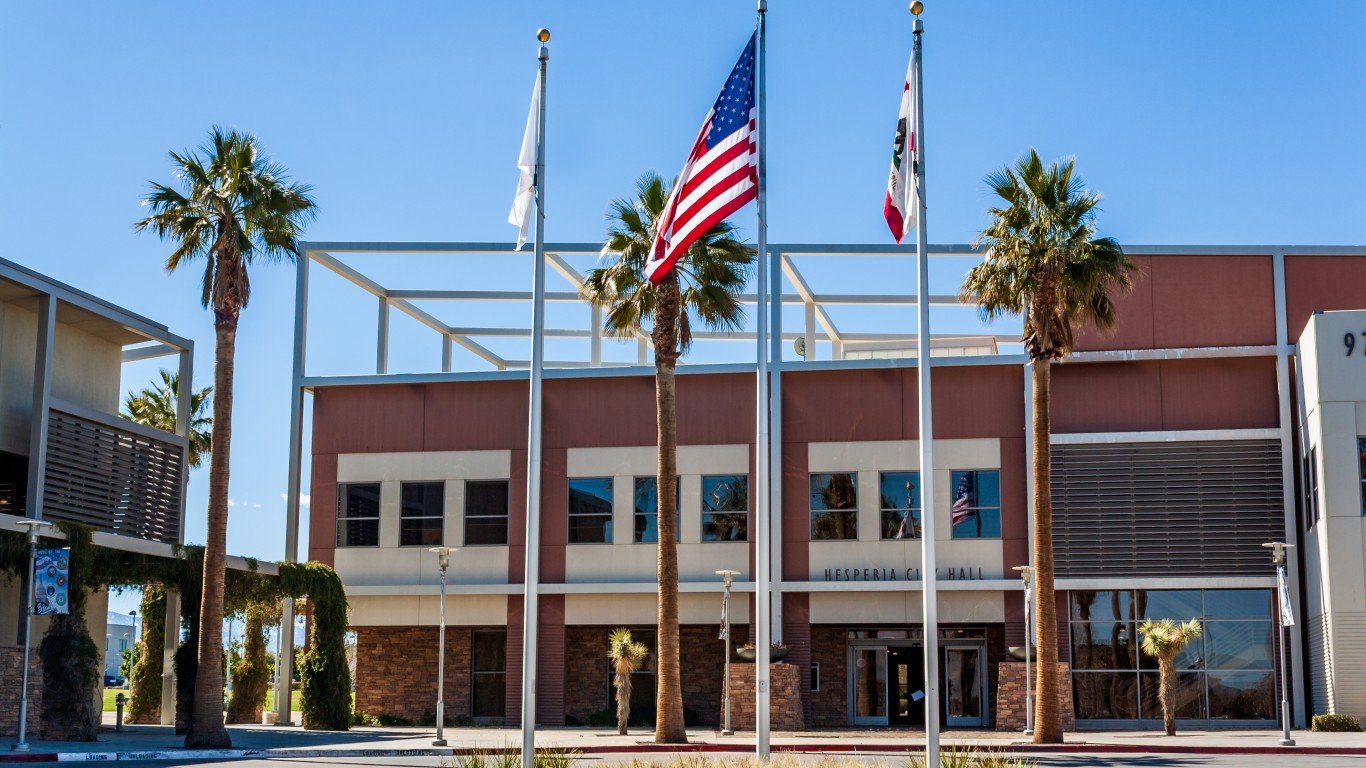
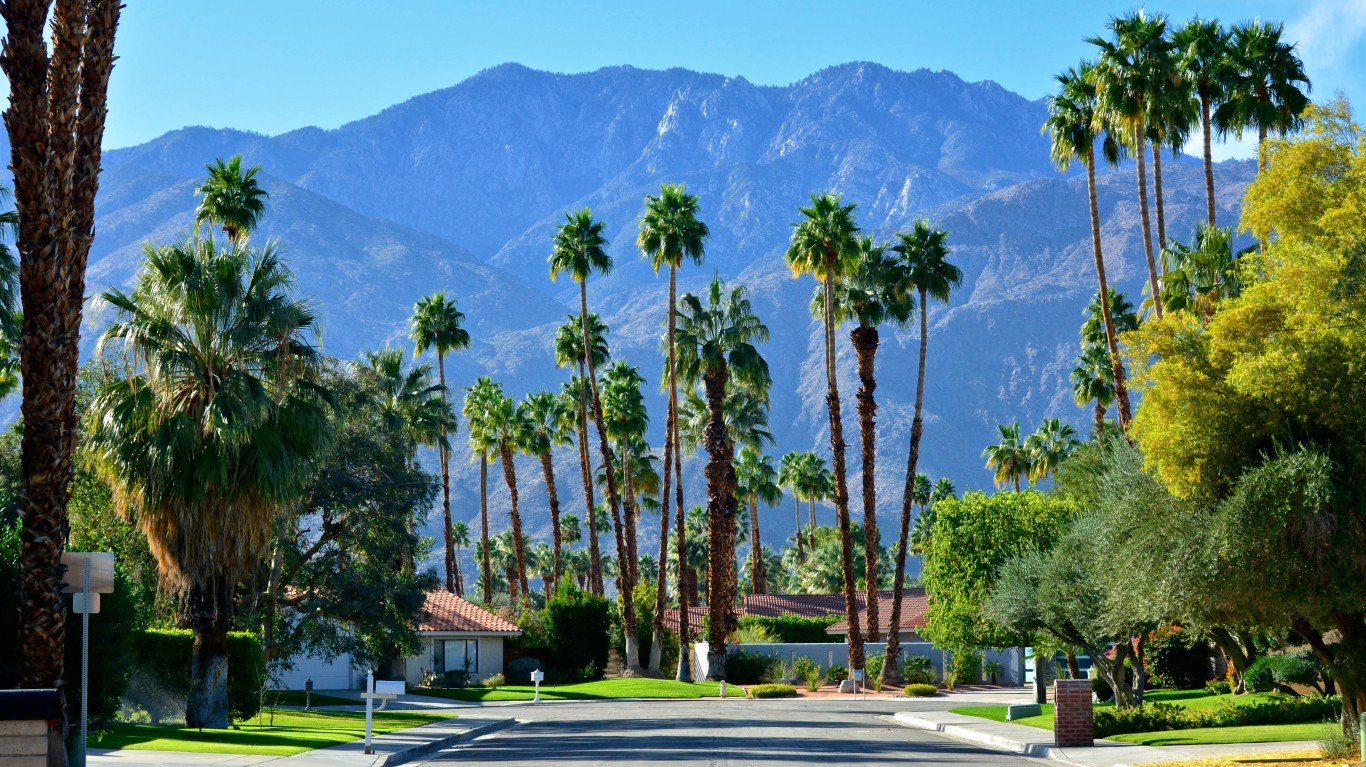
23. Hesperia, California
> Avg. commute time (minutes): 41.7
> Share of commuters driving alone: 81.4% — 403rd highest of 1,789 cities
> Share of commuters carpooling: 10.4% — 550th highest of 1,789 cities
> Share of commuters using public transit: 0.3% — 298th lowest of 1,789 cities

22. Adelanto, California
> Avg. commute time (minutes): 41.7
> Share of commuters driving alone: 79.1% — 708th highest of 1,789 cities
> Share of commuters carpooling: 13.8% — 128th highest of 1,789 cities
> Share of commuters using public transit: 0.1% — 147th lowest of 1,789 cities
[in-text-ad-2]
21. Hercules, California
> Avg. commute time (minutes): 41.7
> Share of commuters driving alone: 67.4% — 221st lowest of 1,789 cities
> Share of commuters carpooling: 13.0% — 190th highest of 1,789 cities
> Share of commuters using public transit: 10.8% — 125th highest of 1,789 cities
20. Linton Hall, Virginia
> Avg. commute time (minutes): 41.8
> Share of commuters driving alone: 76.0% — 704th lowest of 1,789 cities
> Share of commuters carpooling: 7.8% — 581st lowest of 1,789 cities
> Share of commuters using public transit: 3.3% — 514th highest of 1,789 cities
[in-text-ad]
19. Valley Stream, New York
> Avg. commute time (minutes): 41.9
> Share of commuters driving alone: 62.4% — 125th lowest of 1,789 cities
> Share of commuters carpooling: 6.7% — 340th lowest of 1,789 cities
> Share of commuters using public transit: 20.9% — 37th highest of 1,789 cities
[recirclink id=1044820]
18. Pittsburg, California
> Avg. commute time (minutes): 42.0
> Share of commuters driving alone: 68.2% — 242nd lowest of 1,789 cities
> Share of commuters carpooling: 13.9% — 123rd highest of 1,789 cities
> Share of commuters using public transit: 10.1% — 139th highest of 1,789 cities
17. Palmdale, California
> Avg. commute time (minutes): 42.0
> Share of commuters driving alone: 76.6% — 755th lowest of 1,789 cities
> Share of commuters carpooling: 12.9% — 197th highest of 1,789 cities
> Share of commuters using public transit: 1.7% — 856th highest of 1,789 cities
[in-text-ad-2]
16. Long Beach, New York
> Avg. commute time (minutes): 42.3
> Share of commuters driving alone: 61.7% — 119th lowest of 1,789 cities
> Share of commuters carpooling: 3.8% — 11th lowest of 1,789 cities
> Share of commuters using public transit: 20.3% — 40th highest of 1,789 cities

15. Lake Ridge, Virginia
> Avg. commute time (minutes): 42.5
> Share of commuters driving alone: 71.1% — 342nd lowest of 1,789 cities
> Share of commuters carpooling: 12.7% — 214th highest of 1,789 cities
> Share of commuters using public transit: 6.2% — 291st highest of 1,789 cities
[in-text-ad]
14. Menifee, California
> Avg. commute time (minutes): 42.9
> Share of commuters driving alone: 80.0% — 587th highest of 1,789 cities
> Share of commuters carpooling: 10.2% — 588th highest of 1,789 cities
> Share of commuters using public transit: 0.4% — 340th lowest of 1,789 cities
[recirclink id=1054986]
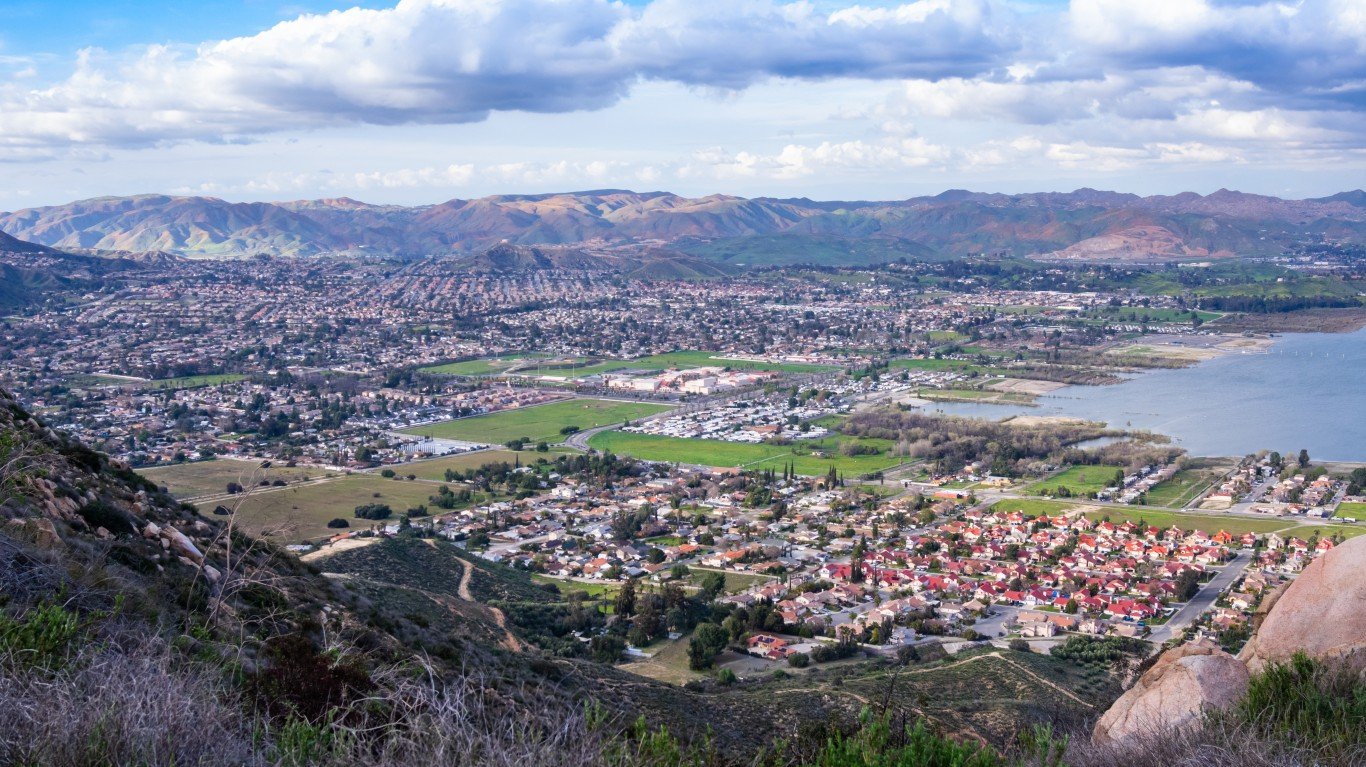
13. Lake Elsinore, California
> Avg. commute time (minutes): 42.9
> Share of commuters driving alone: 79.4% — 665th highest of 1,789 cities
> Share of commuters carpooling: 12.4% — 237th highest of 1,789 cities
> Share of commuters using public transit: 0.3% — 275th lowest of 1,789 cities
12. Princeton, Florida
> Avg. commute time (minutes): 43.0
> Share of commuters driving alone: 76.4% — 739th lowest of 1,789 cities
> Share of commuters carpooling: 14.8% — 86th highest of 1,789 cities
> Share of commuters using public transit: 1.6% — 877th highest of 1,789 cities
[in-text-ad-2]

11. Oakley, California
> Avg. commute time (minutes): 43.2
> Share of commuters driving alone: 76.7% — 760th lowest of 1,789 cities
> Share of commuters carpooling: 12.4% — 245th highest of 1,789 cities
> Share of commuters using public transit: 3.1% — 537th highest of 1,789 cities

10. Cutler Bay, Florida
> Avg. commute time (minutes): 43.3
> Share of commuters driving alone: 75.8% — 681st lowest of 1,789 cities
> Share of commuters carpooling: 11.0% — 417th highest of 1,789 cities
> Share of commuters using public transit: 2.6% — 627th highest of 1,789 cities
[in-text-ad]
9. Richmond West, Florida
> Avg. commute time (minutes): 43.5
> Share of commuters driving alone: 79.9% — 601st highest of 1,789 cities
> Share of commuters carpooling: 10.9% — 427th highest of 1,789 cities
> Share of commuters using public transit: 1.4% — 852nd lowest of 1,789 cities
[recirclink id=1060122]
8. Graham, Washington
> Avg. commute time (minutes): 43.6
> Share of commuters driving alone: 79.5% — 651st highest of 1,789 cities
> Share of commuters carpooling: 10.6% — 505th highest of 1,789 cities
> Share of commuters using public transit: 1.5% — 868th lowest of 1,789 cities

7. Los Banos, California
> Avg. commute time (minutes): 44.5
> Share of commuters driving alone: 79.5% — 657th highest of 1,789 cities
> Share of commuters carpooling: 13.6% — 148th highest of 1,789 cities
> Share of commuters using public transit: 1.4% — 831st lowest of 1,789 cities
[in-text-ad-2]
6. Tracy, California
> Avg. commute time (minutes): 44.5
> Share of commuters driving alone: 75.5% — 646th lowest of 1,789 cities
> Share of commuters carpooling: 14.1% — 110th highest of 1,789 cities
> Share of commuters using public transit: 2.2% — 732nd highest of 1,789 cities
5. Brentwood, California
> Avg. commute time (minutes): 45.1
> Share of commuters driving alone: 75.1% — 611th lowest of 1,789 cities
> Share of commuters carpooling: 10.4% — 537th highest of 1,789 cities
> Share of commuters using public transit: 3.1% — 548th highest of 1,789 cities
[in-text-ad]
4. Poinciana, Florida
> Avg. commute time (minutes): 45.7
> Share of commuters driving alone: 79.2% — 694th highest of 1,789 cities
> Share of commuters carpooling: 15.2% — 74th highest of 1,789 cities
> Share of commuters using public transit: 0.9% — 646th lowest of 1,789 cities
[recirclink id=1024519]
3. Waldorf, Maryland
> Avg. commute time (minutes): 46.1
> Share of commuters driving alone: 80.3% — 547th highest of 1,789 cities
> Share of commuters carpooling: 6.2% — 231st lowest of 1,789 cities
> Share of commuters using public transit: 6.8% — 256th highest of 1,789 cities
2. Antioch, California
> Avg. commute time (minutes): 46.4
> Share of commuters driving alone: 65.8% — 174th lowest of 1,789 cities
> Share of commuters carpooling: 16.9% — 43rd highest of 1,789 cities
> Share of commuters using public transit: 7.8% — 217th highest of 1,789 cities
[in-text-ad-2]

1. Temescal Valley, California
> Avg. commute time (minutes): 47.7
> Share of commuters driving alone: 79.2% — 688th highest of 1,789 cities
> Share of commuters carpooling: 8.9% — 847th lowest of 1,789 cities
> Share of commuters using public transit: 0.6% — 456th lowest of 1,789 cities
Methodology
To determine the cities with the longest commutes, 24/7 Wall St. reviewed five-year estimates of average commute times from the U.S. Census Bureau’s 2020 American Community Survey.
We used census “place” geographies — a category that includes incorporated legal entities and census-designated statistical entities. We defined cities based on a population threshold — census places needed to have a population of at least 25,000 to be considered.
Cities were excluded if average commute time estimates were not available in the 2020 ACS, if there were fewer than 1,000 workers 16 years and over who did not work from home, or if the sampling error associated with a city’s data was deemed too high.
The sampling error was defined as too high if the coefficient of variation — a statistical assessment of how reliable an estimate is — for a city’s average commute time was above 15% and greater than two standard deviations above the mean CV for all cities’ average commute times. We similarly excluded cities that had a sampling error too high for their population, using the same definition.
Cities were ranked based on their average commute time. To break ties, we used the share of workers with a commute of 45 minutes or longer.
Additional information on the share of commuters driving alone, carpooling, and using public transit are also five-year estimates from the 2020 ACS.
Contact [email protected] for any questions or corrections.