The number of American workers working from home – particularly those in white collar jobs – skyrocketed during the pandemic. The shift has proved to be a positive development in some ways. A recent Gallup study found that over 90% of remote workers hope that the trend continues after the pandemic, citing the lack of commute time as the chief benefit.
Still, for a large share of the workforce, remote work is not an option. Gallup reports that 55% full-time employees in the United States do not work remotely – and commute time still makes up a significant portion of their day. (Here is a look at the state where the most people are working from home.)
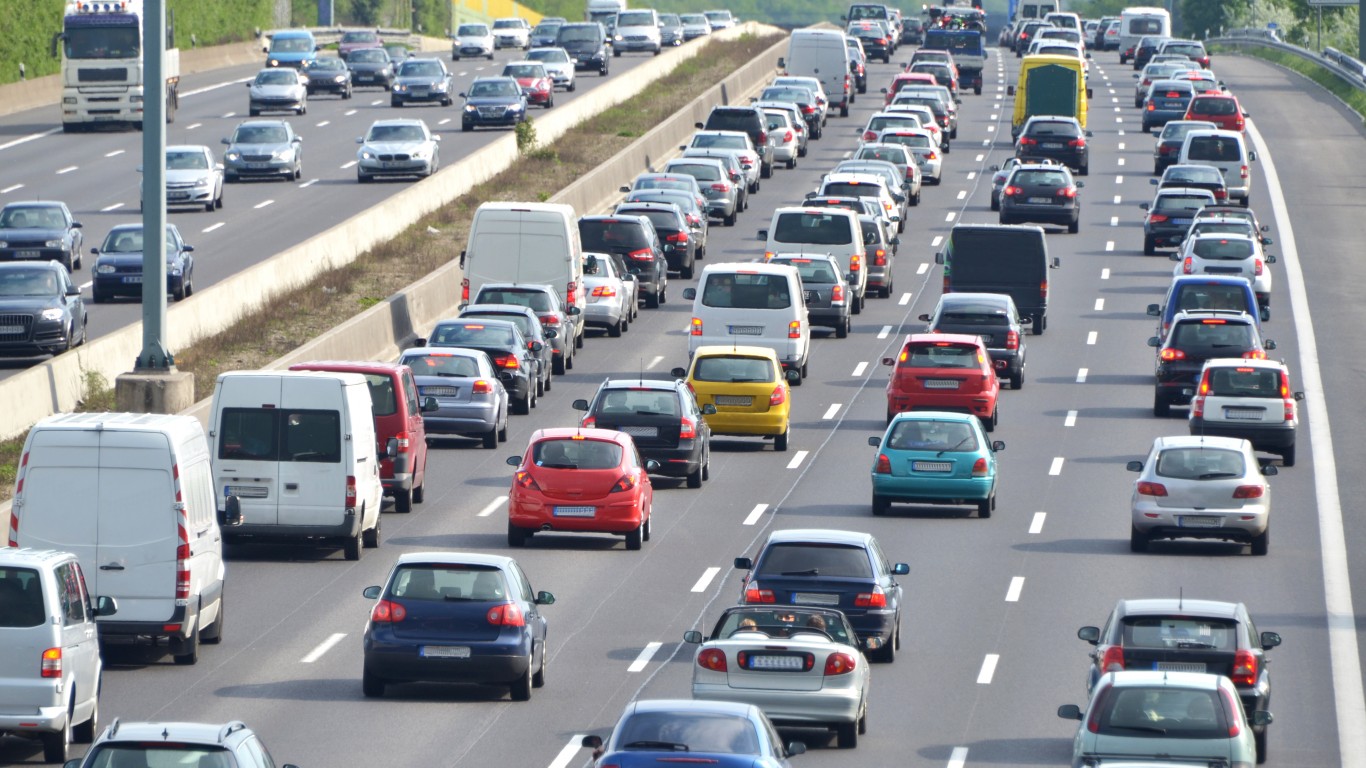
According to the U.S. Census Bureau, the average commute time in the United States is 26.9 minutes. For those who travel to and from work every Monday through Friday, this translates to about 4.5 hours per week, or nearly 10 days a year.
Of course, commute times vary from person to person, but in some parts of the country, workers who are still commuting tend to have far less travel time than others. Using census data, 24/7 Wall St. identified the 50 metropolitan areas with the shortest commutes.
In every metro area on this list, average commute times are less than 20 minutes. This adds up to only about three hours per week, and in most cases less than seven days per year.
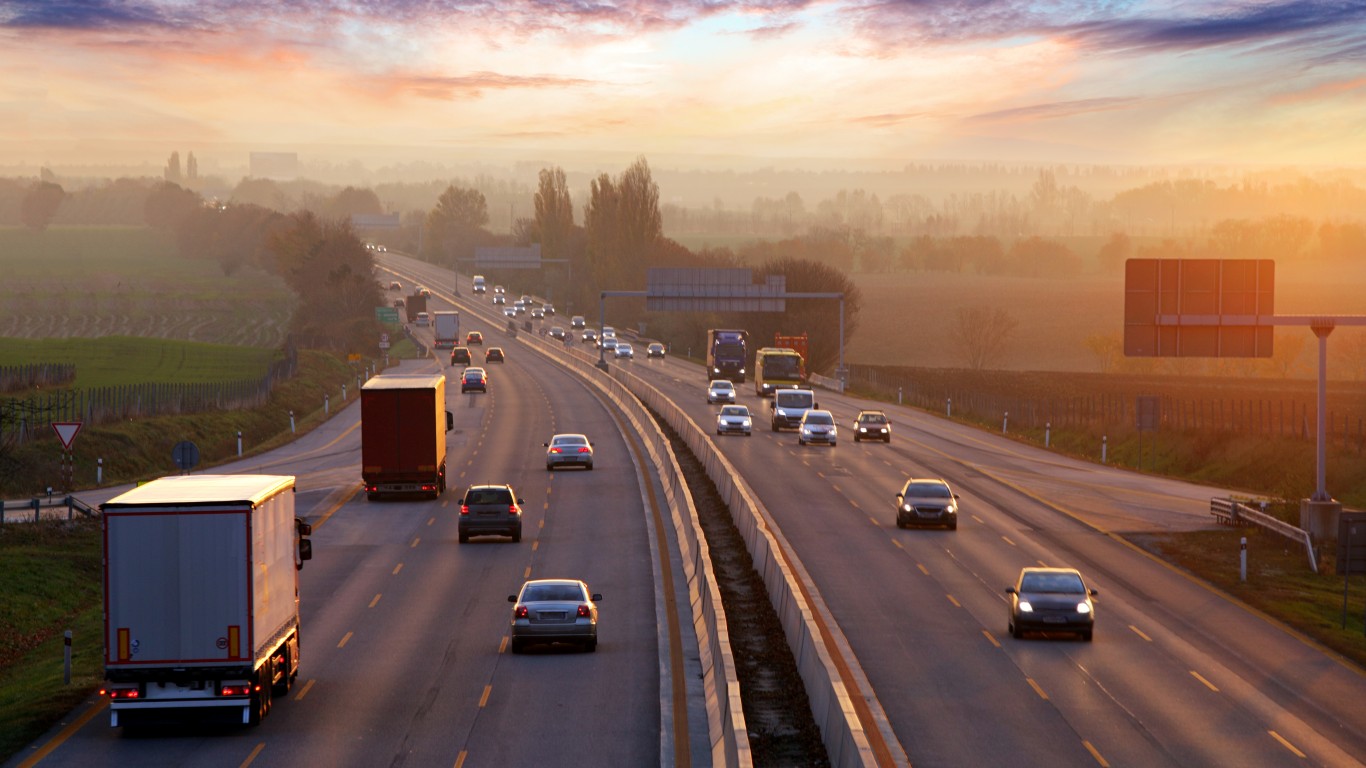
The largest share of metro areas on this list are in the Midwest, and only one is in the Northeast. In most of these metro areas the share of commuters driving themselves to and from work is higher than the 74.9% national average, and the share of commuters using public transit is below the 4.6% national average. In most cases, public transportation is less direct than simply driving from door to door, adding to overall commute time. Here is a look at the cities where people lose the most time driving each year.
Click here to see the metros with the shortest commutes
Click here to see our detailed methodology
50. Midland, TX
> Avg. commute time (minutes): 19.4
> Share of commuters driving alone: 83.1% — 66th highest of 384 metros
> Share of commuters carpooling: 10.1% — 100th highest of 384 metros
> Share of commuters using public transit: 0.2% — 15th lowest of 384 metros
[in-text-ad]
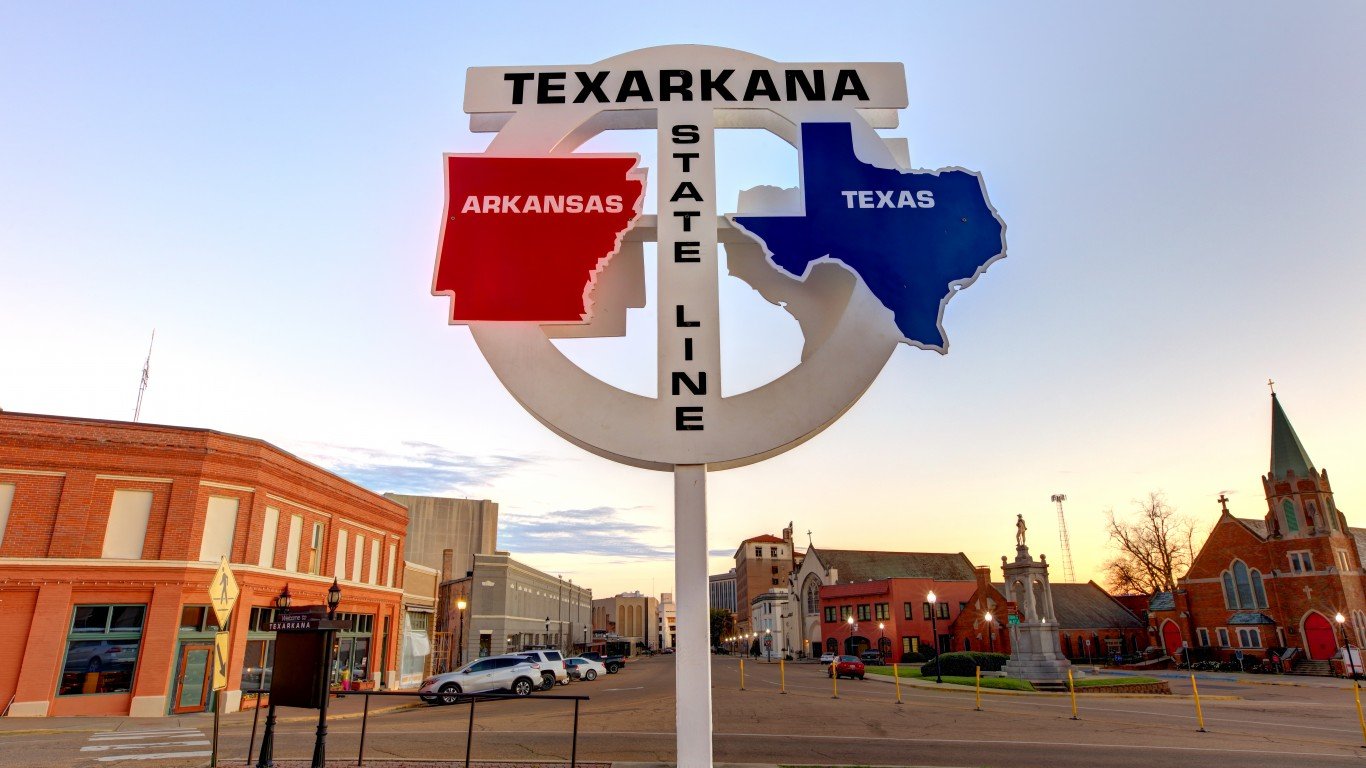
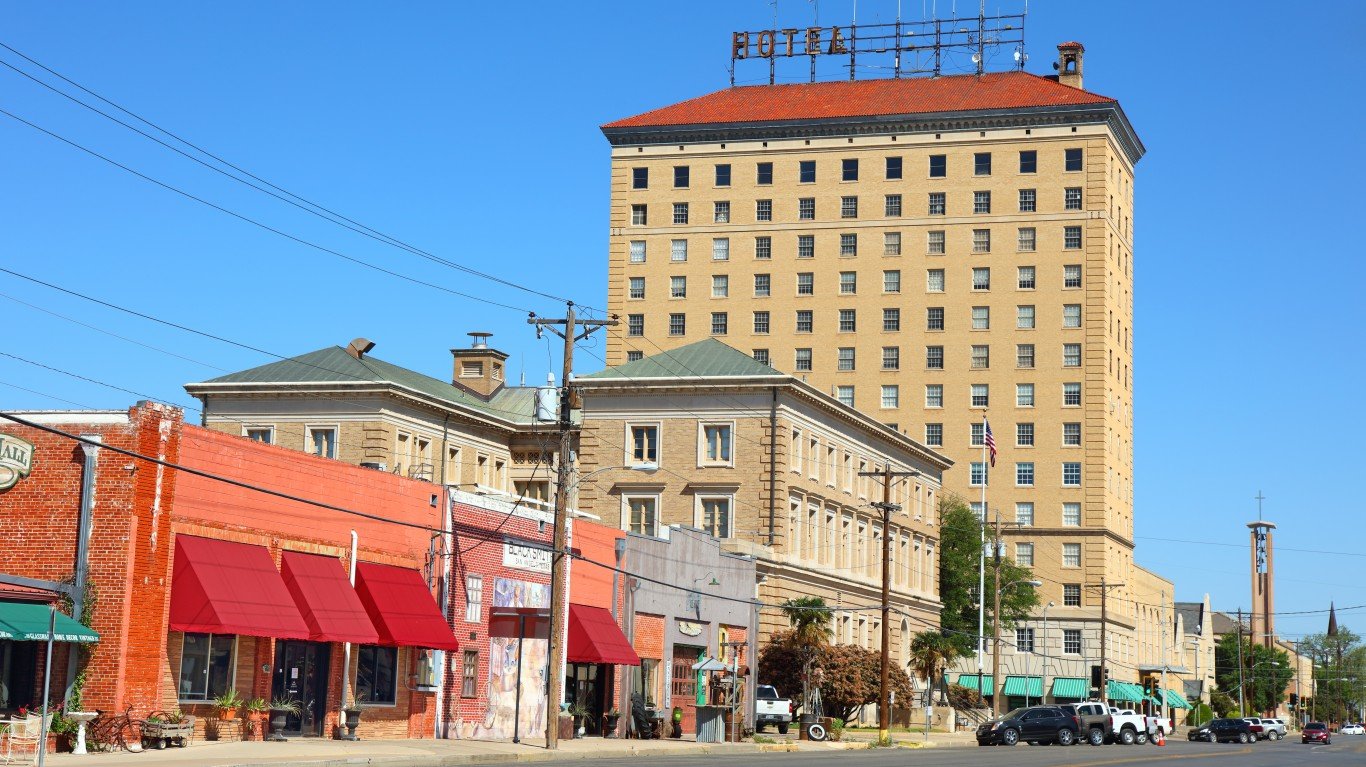
49. Texarkana, TX-AR
> Avg. commute time (minutes): 19.4
> Share of commuters driving alone: 87.5% — 5th highest of 384 metros
> Share of commuters carpooling: 7.7% — 69th lowest of 384 metros
> Share of commuters using public transit: 0.4% — 68th lowest of 384 metros
[recirclink id=987778]
48. Elkhart-Goshen, IN
> Avg. commute time (minutes): 19.3
> Share of commuters driving alone: 76.4% — 82nd lowest of 384 metros
> Share of commuters carpooling: 15.3% — the highest of 384 metros
> Share of commuters using public transit: 0.3% — 48th lowest of 384 metros
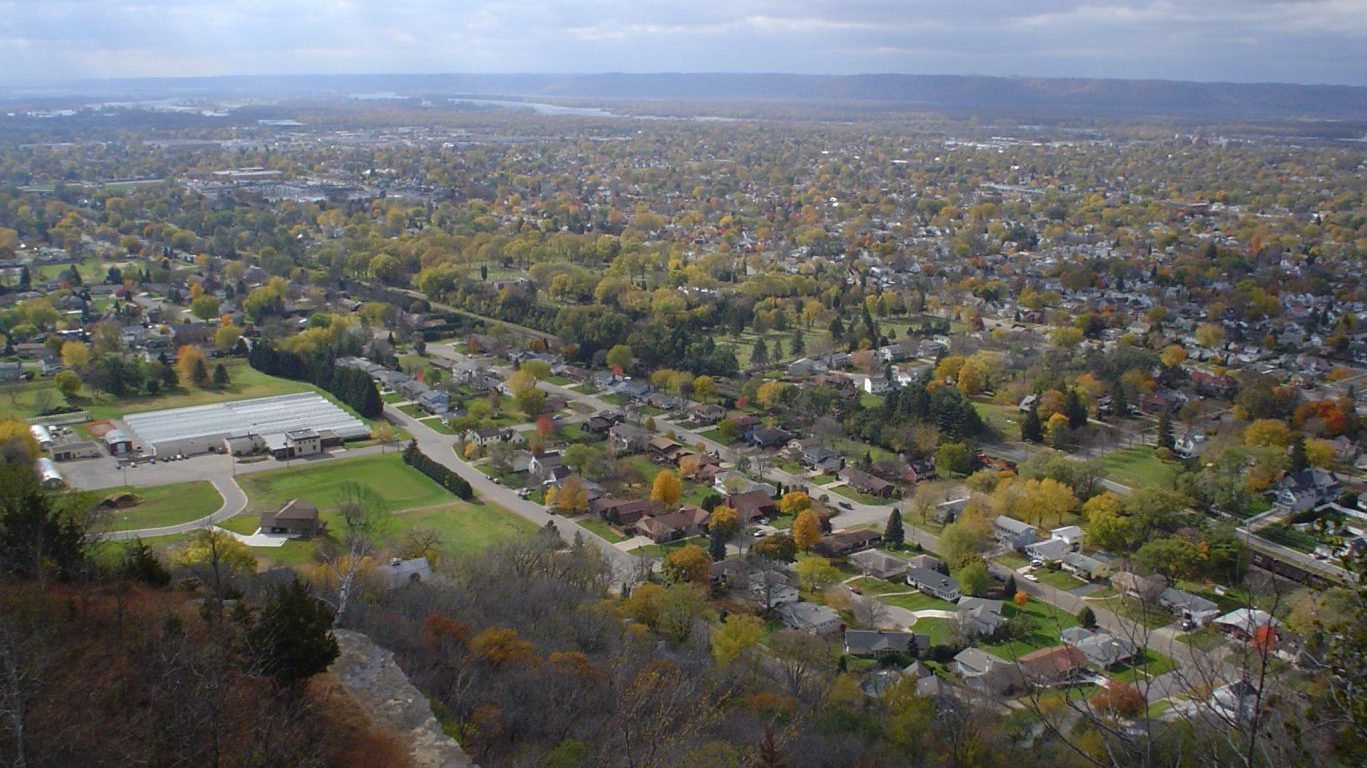
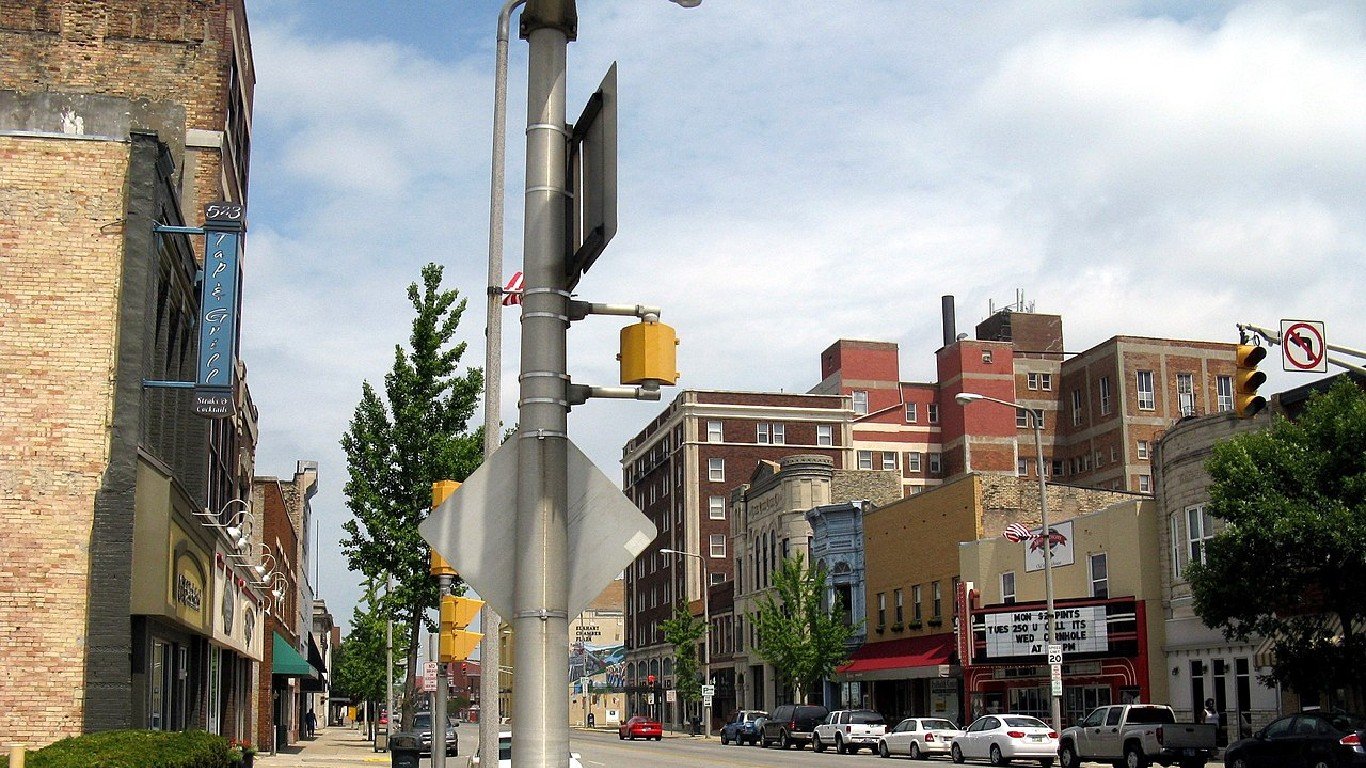
47. La Crosse-Onalaska, WI-MN
> Avg. commute time (minutes): 19.3
> Share of commuters driving alone: 80.0% — 189th lowest of 384 metros
> Share of commuters carpooling: 7.7% — 62nd lowest of 384 metros
> Share of commuters using public transit: 0.7% — 177th lowest of 384 metros
[in-text-ad-2]
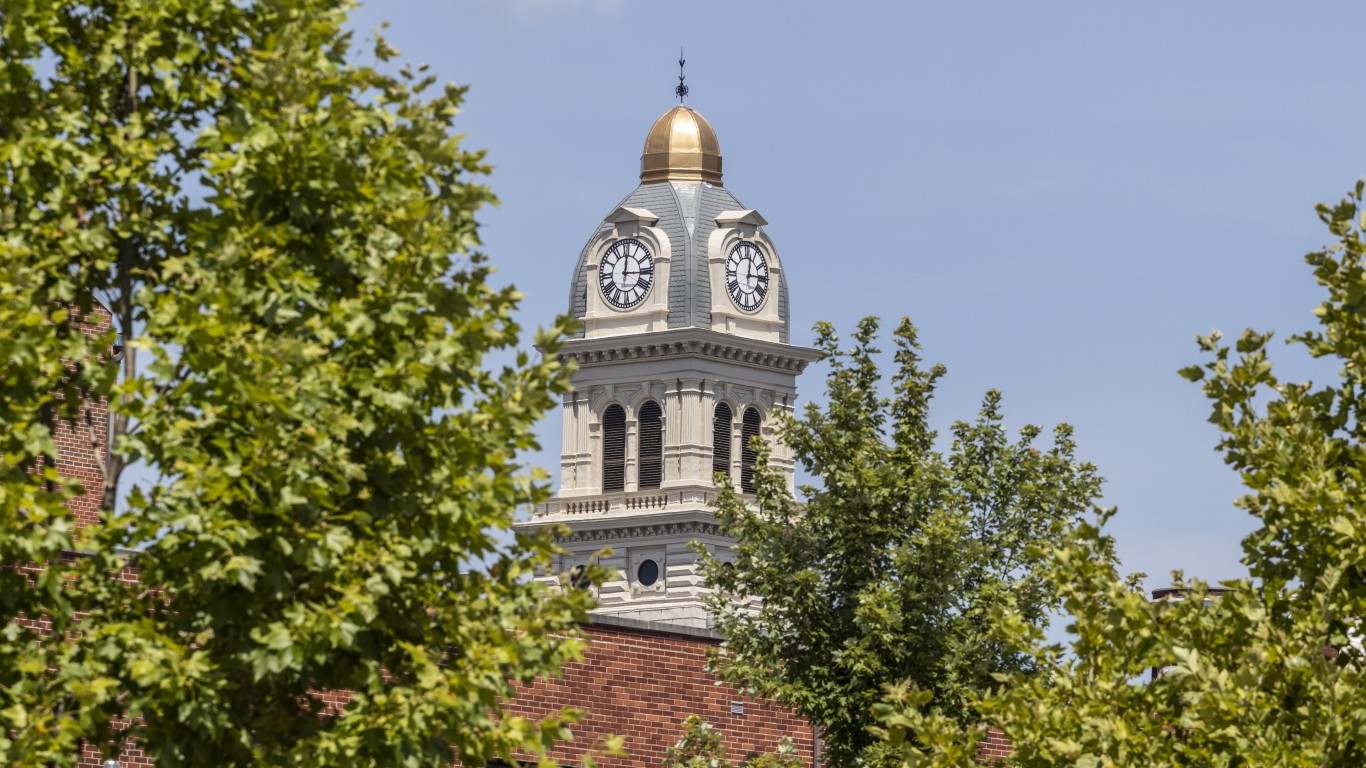
46. Lima, OH
> Avg. commute time (minutes): 19.3
> Share of commuters driving alone: 84.9% — 22nd highest of 384 metros
> Share of commuters carpooling: 7.3% — 37th lowest of 384 metros
> Share of commuters using public transit: 0.7% — 171st lowest of 384 metros
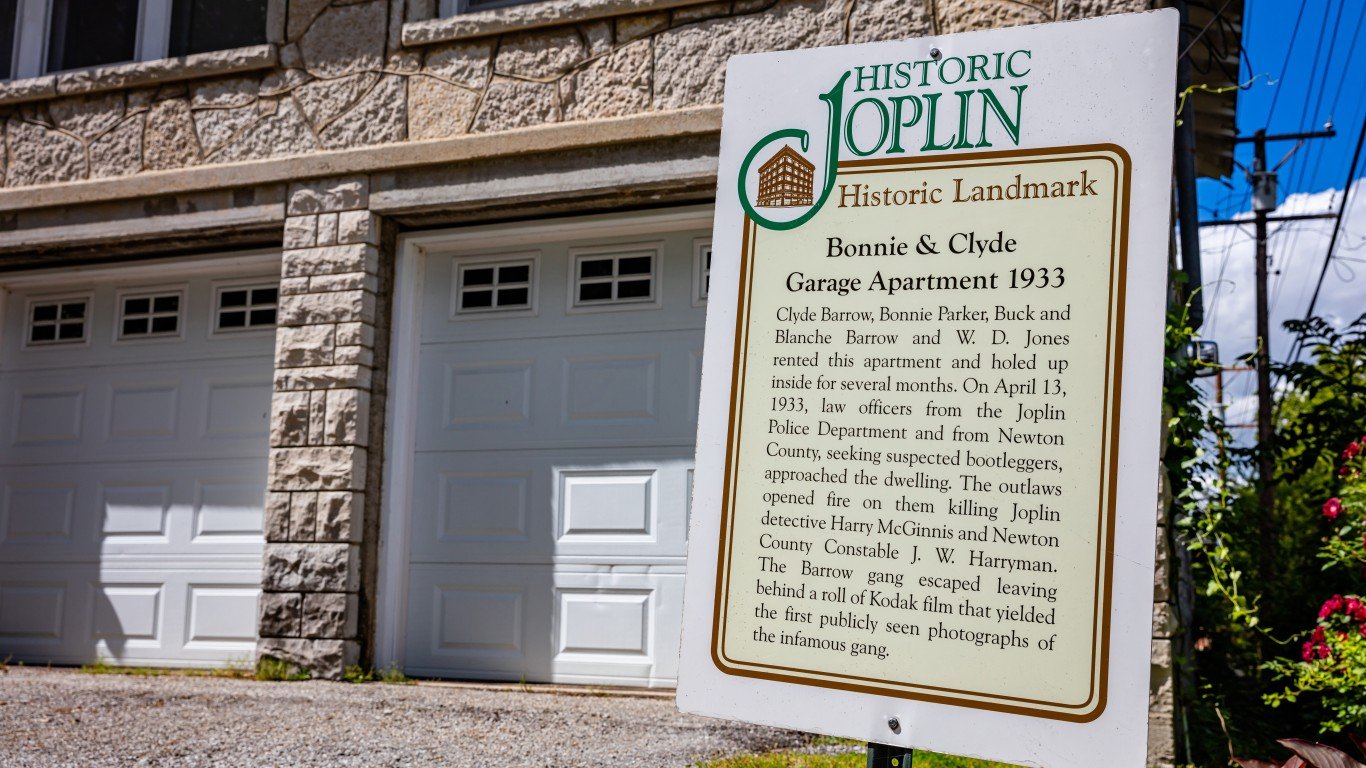
45. Joplin, MO
> Avg. commute time (minutes): 19.2
> Share of commuters driving alone: 82.3% — 99th highest of 384 metros
> Share of commuters carpooling: 9.8% — 115th highest of 384 metros
> Share of commuters using public transit: 0.2% — 25th lowest of 384 metros
[in-text-ad]
44. Yakima, WA
> Avg. commute time (minutes): 19.2
> Share of commuters driving alone: 80.9% — 160th highest of 384 metros
> Share of commuters carpooling: 12.0% — 22nd highest of 384 metros
> Share of commuters using public transit: 0.3% — 37th lowest of 384 metros
[recirclink id=1044820]
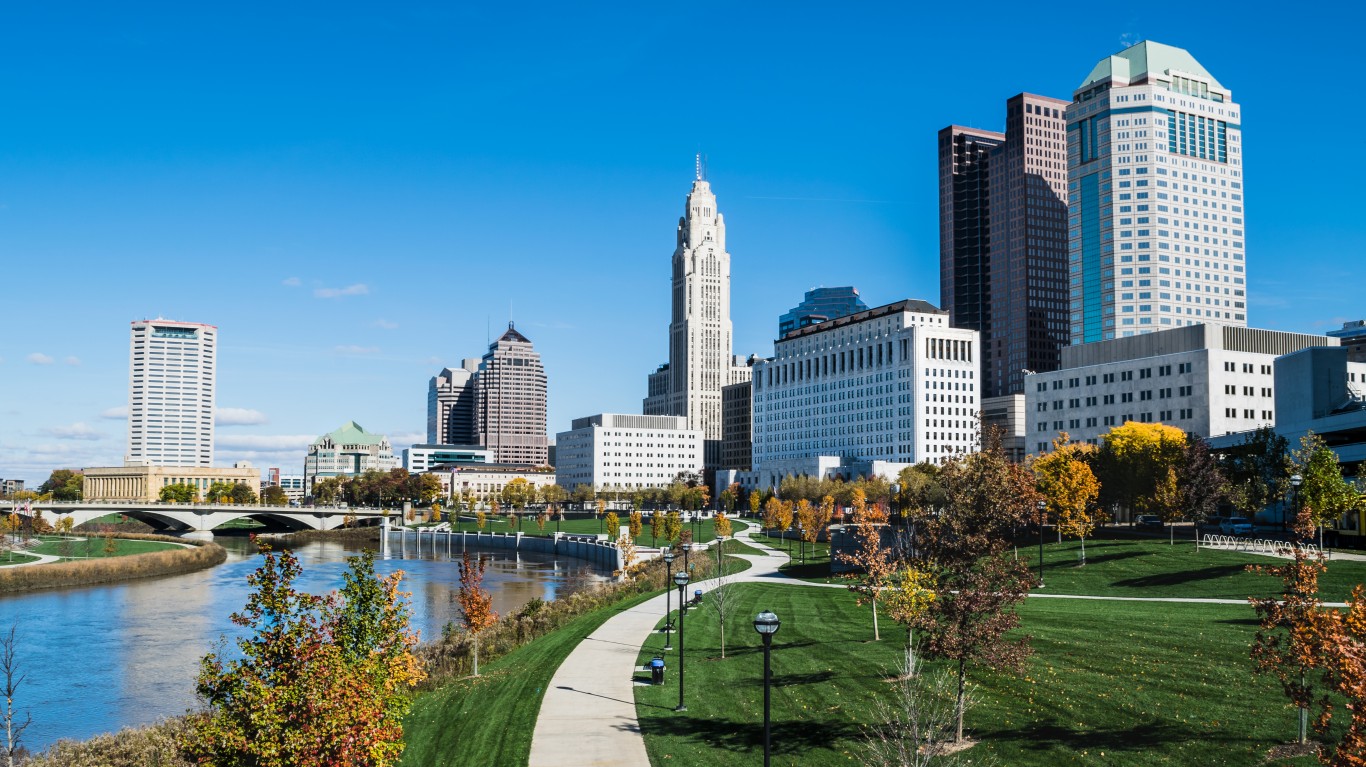
43. Columbus, IN
> Avg. commute time (minutes): 19.2
> Share of commuters driving alone: 81.7% — 121st highest of 384 metros
> Share of commuters carpooling: 9.7% — 131st highest of 384 metros
> Share of commuters using public transit: 0.3% — 51st lowest of 384 metros
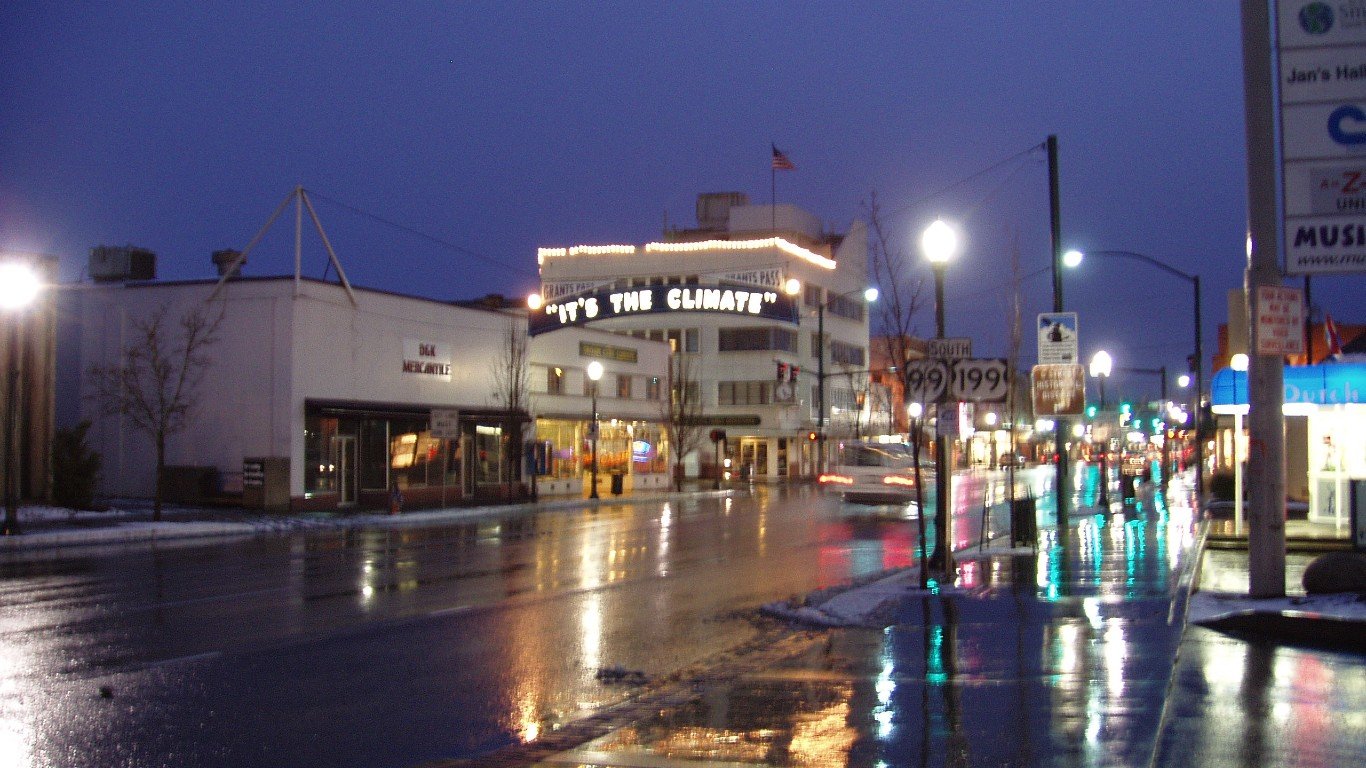
42. Grants Pass, OR
> Avg. commute time (minutes): 19.2
> Share of commuters driving alone: 75.5% — 70th lowest of 384 metros
> Share of commuters carpooling: 10.6% — 64th highest of 384 metros
> Share of commuters using public transit: 0.4% — 74th lowest of 384 metros
[in-text-ad-2]
41. Rapid City, SD
> Avg. commute time (minutes): 19.1
> Share of commuters driving alone: 80.7% — 167th highest of 384 metros
> Share of commuters carpooling: 8.2% — 124th lowest of 384 metros
> Share of commuters using public transit: 0.7% — 168th lowest of 384 metros

40. Fairbanks, AK
> Avg. commute time (minutes): 19.1
> Share of commuters driving alone: 74.1% — 48th lowest of 384 metros
> Share of commuters carpooling: 14.2% — 2nd highest of 384 metros
> Share of commuters using public transit: 0.8% — 191st lowest of 384 metros
[in-text-ad]

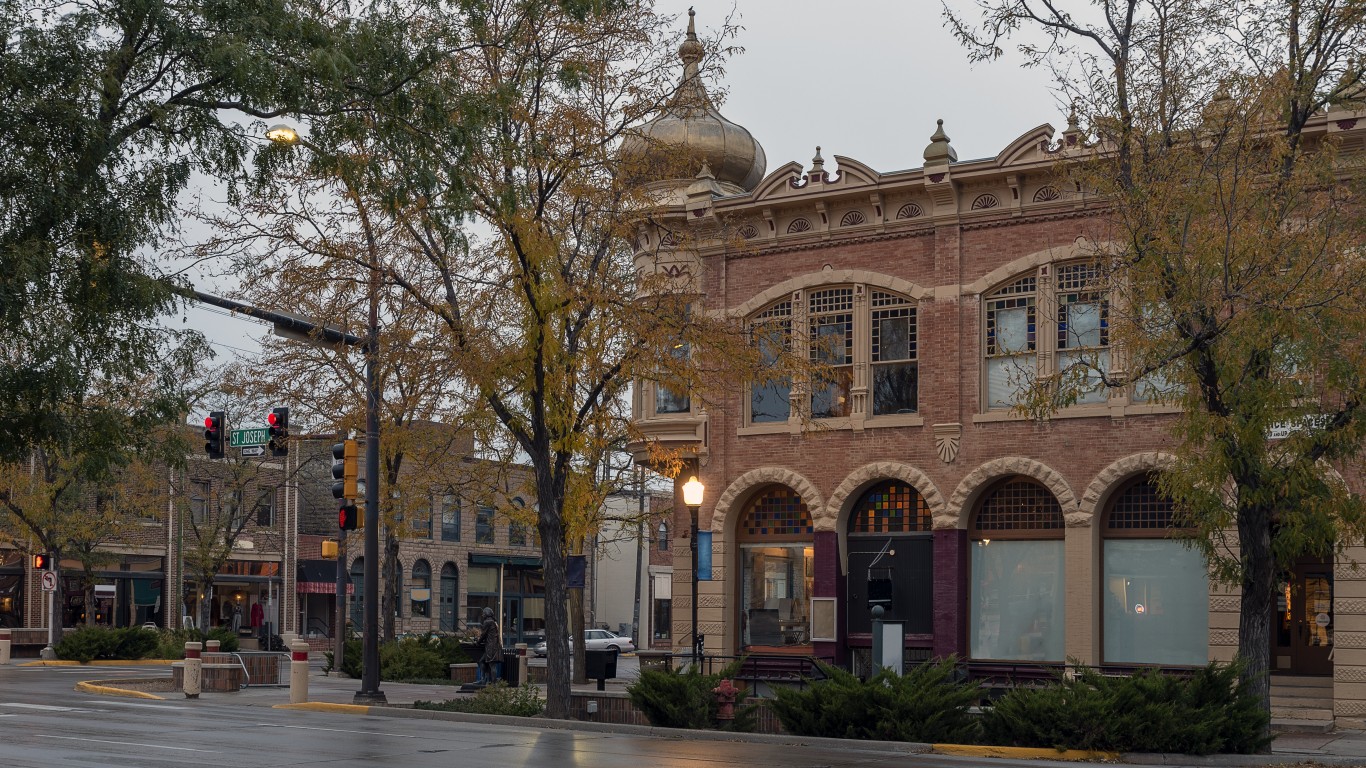
39. St. Joseph, MO-KS
> Avg. commute time (minutes): 19.1
> Share of commuters driving alone: 83.4% — 58th highest of 384 metros
> Share of commuters carpooling: 9.1% — 177th highest of 384 metros
> Share of commuters using public transit: 0.5% — 118th lowest of 384 metros
[recirclink id=1024519]
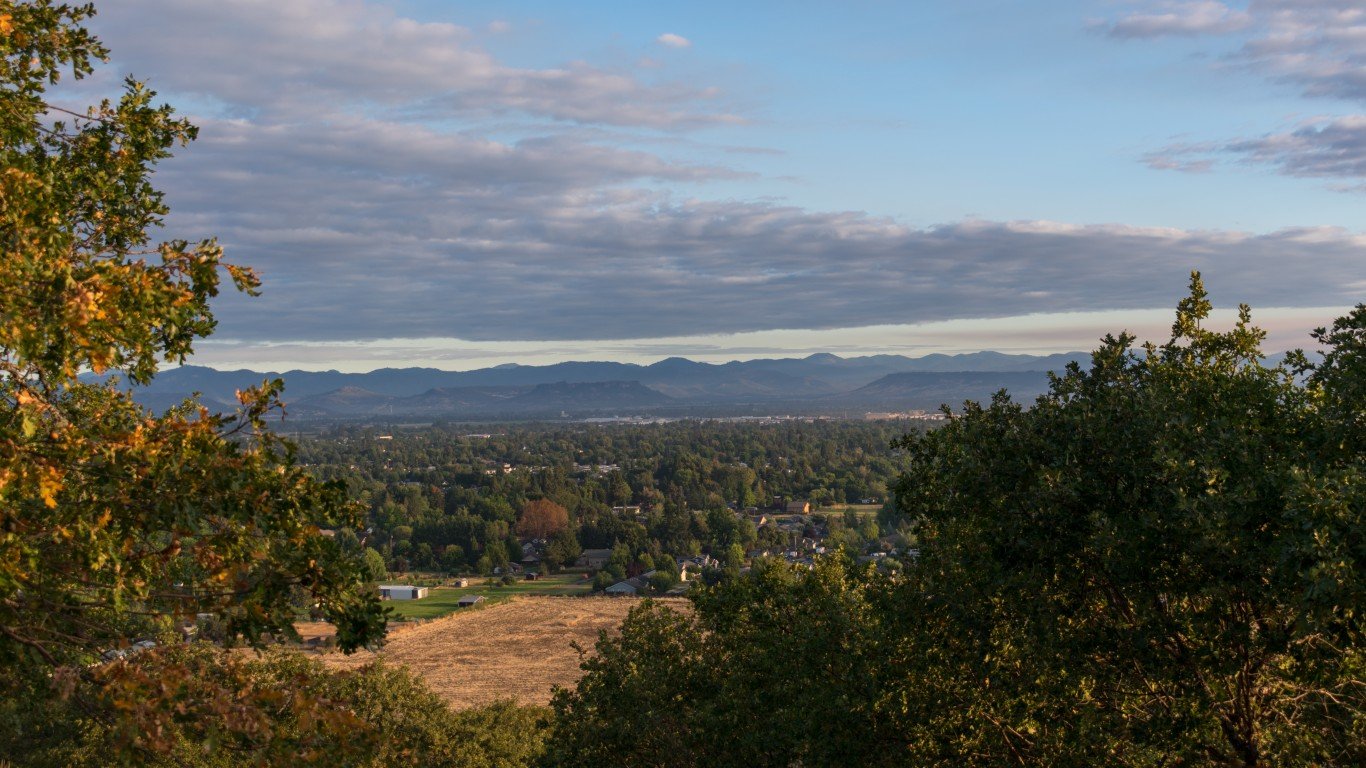
38. Medford, OR
> Avg. commute time (minutes): 19.0
> Share of commuters driving alone: 76.8% — 85th lowest of 384 metros
> Share of commuters carpooling: 8.8% — 182nd lowest of 384 metros
> Share of commuters using public transit: 0.7% — 169th lowest of 384 metros

37. Ames, IA
> Avg. commute time (minutes): 19.0
> Share of commuters driving alone: 73.8% — 43rd lowest of 384 metros
> Share of commuters carpooling: 7.4% — 40th lowest of 384 metros
> Share of commuters using public transit: 4.4% — 23rd highest of 384 metros
[in-text-ad-2]
36. Oshkosh-Neenah, WI
> Avg. commute time (minutes): 18.9
> Share of commuters driving alone: 82.6% — 92nd highest of 384 metros
> Share of commuters carpooling: 7.4% — 42nd lowest of 384 metros
> Share of commuters using public transit: 0.5% — 126th lowest of 384 metros
35. Grand Junction, CO
> Avg. commute time (minutes): 18.9
> Share of commuters driving alone: 77.0% — 88th lowest of 384 metros
> Share of commuters carpooling: 8.3% — 133rd lowest of 384 metros
> Share of commuters using public transit: 0.5% — 109th lowest of 384 metros
[in-text-ad]
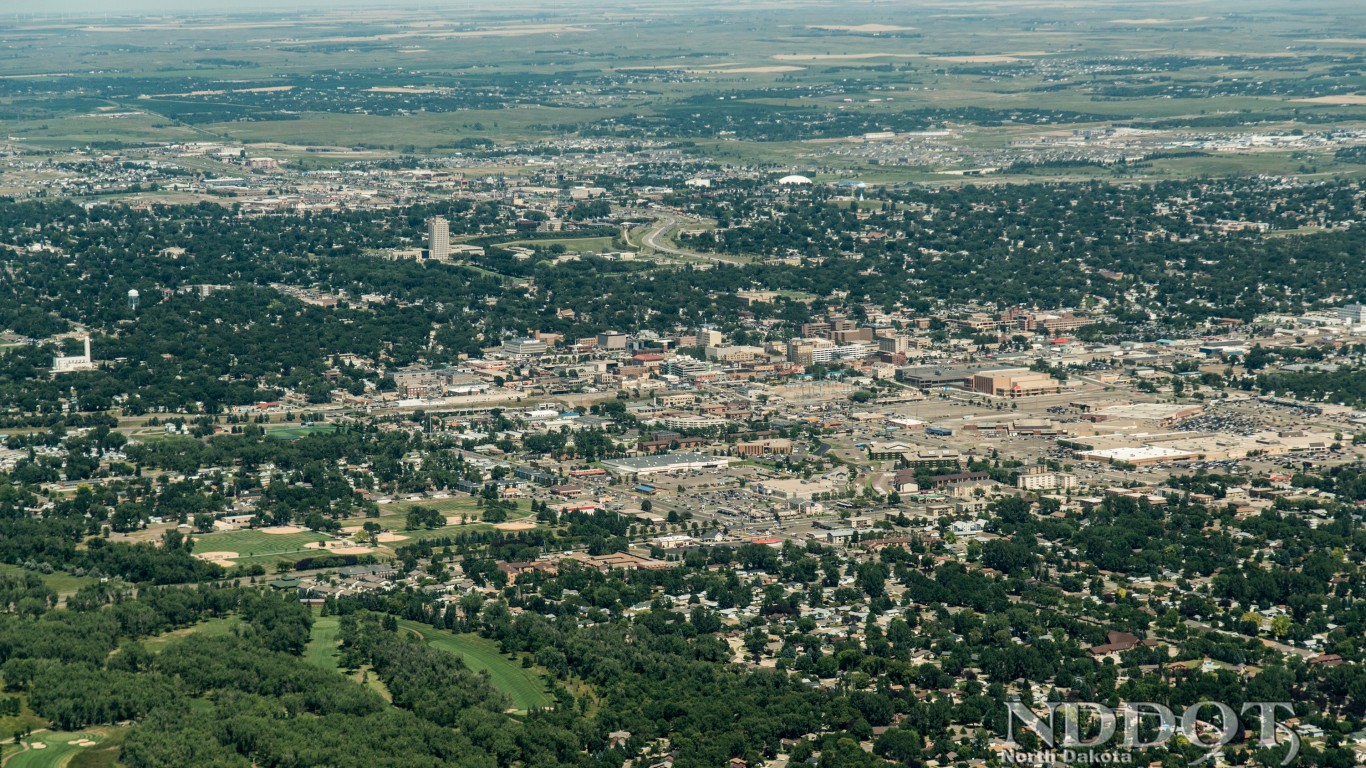
34. Bismarck, ND
> Avg. commute time (minutes): 18.9
> Share of commuters driving alone: 83.7% — 51st highest of 384 metros
> Share of commuters carpooling: 8.8% — 187th lowest of 384 metros
> Share of commuters using public transit: 0.2% — 20th lowest of 384 metros
[recirclink id=1054986]
33. Twin Falls, ID
> Avg. commute time (minutes): 18.9
> Share of commuters driving alone: 82.0% — 110th highest of 384 metros
> Share of commuters carpooling: 9.8% — 121st highest of 384 metros
> Share of commuters using public transit: 0.3% — 45th lowest of 384 metros
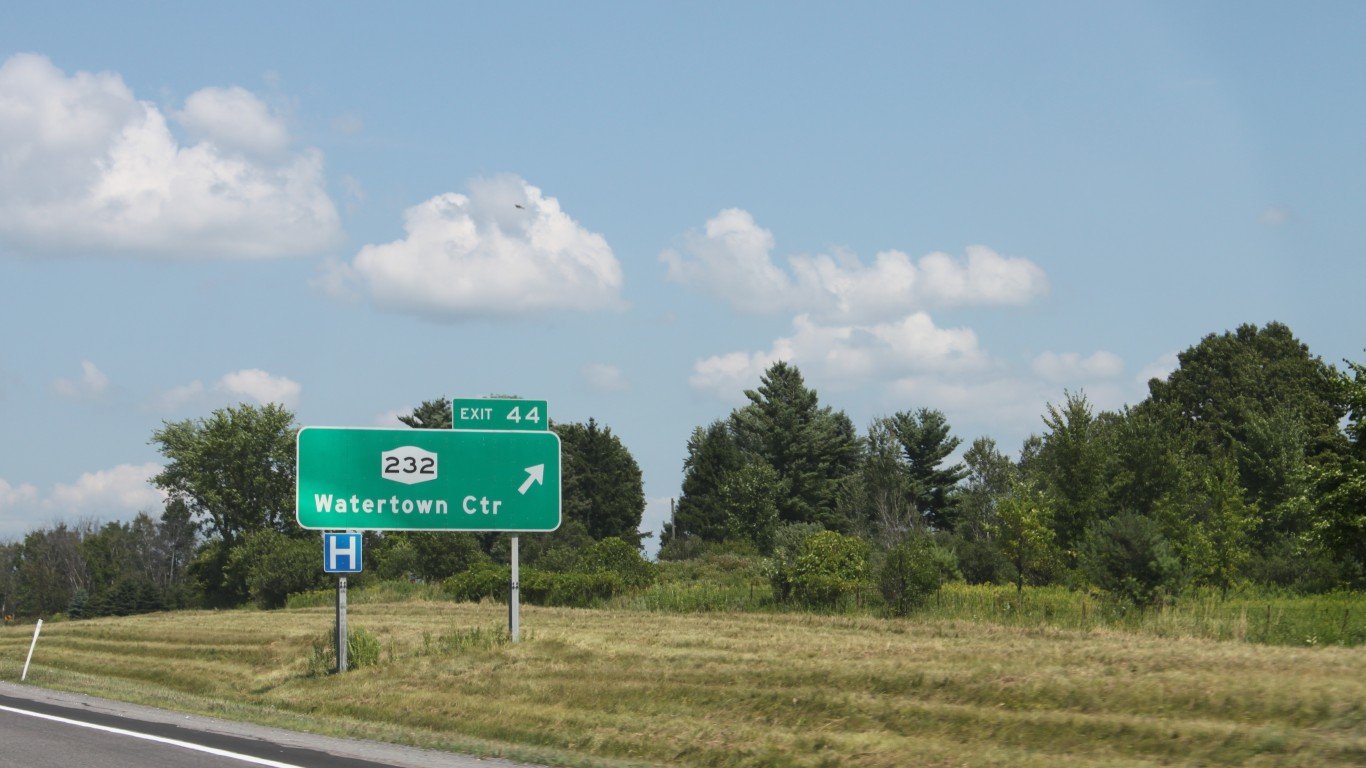
32. Watertown-Fort Drum, NY
> Avg. commute time (minutes): 18.8
> Share of commuters driving alone: 77.7% — 108th lowest of 384 metros
> Share of commuters carpooling: 8.3% — 134th lowest of 384 metros
> Share of commuters using public transit: 0.6% — 129th lowest of 384 metros
[in-text-ad-2]
31. Kokomo, IN
> Avg. commute time (minutes): 18.8
> Share of commuters driving alone: 83.3% — 61st highest of 384 metros
> Share of commuters carpooling: 9.2% — 169th highest of 384 metros
> Share of commuters using public transit: 0.2% — 17th lowest of 384 metros
30. San Angelo, TX
> Avg. commute time (minutes): 18.8
> Share of commuters driving alone: 78.3% — 124th lowest of 384 metros
> Share of commuters carpooling: 10.0% — 105th highest of 384 metros
> Share of commuters using public transit: 0.3% — 36th lowest of 384 metros
[in-text-ad]
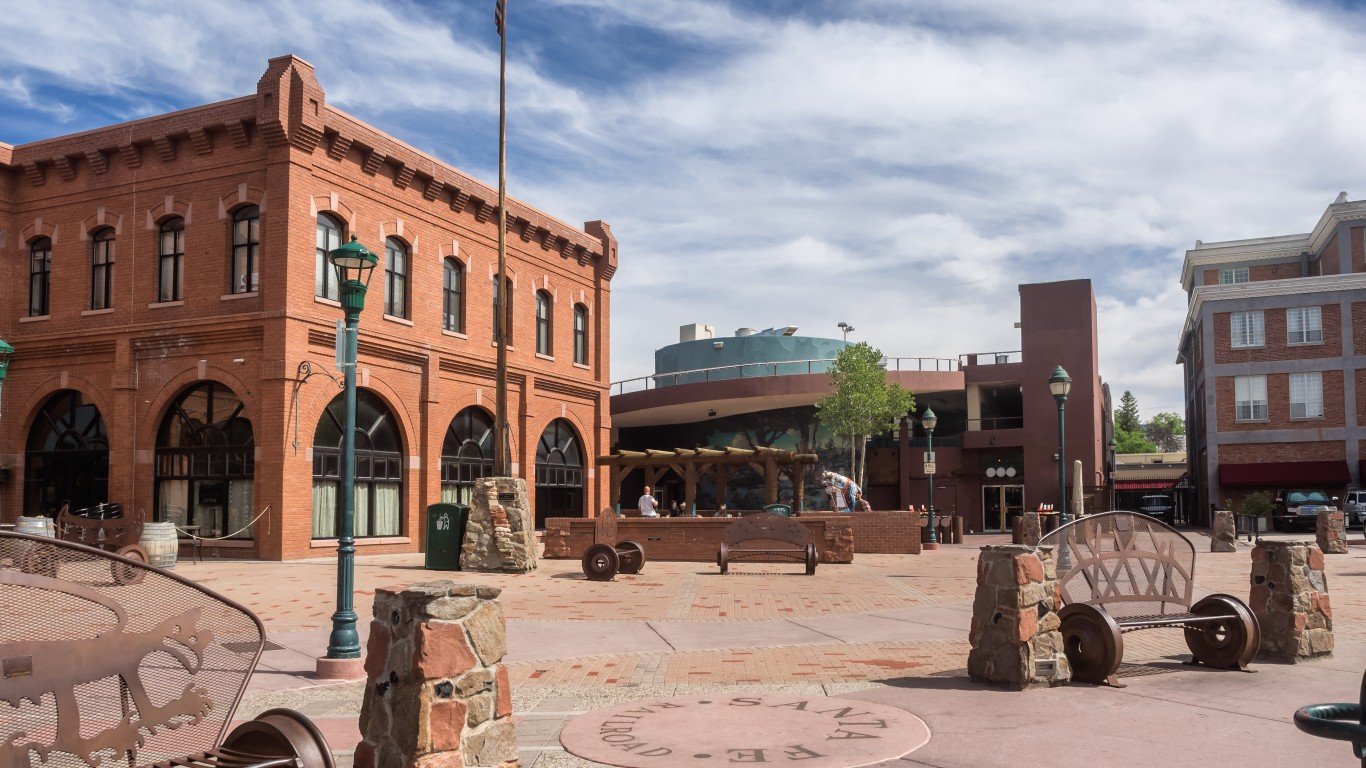
29. Flagstaff, AZ
> Avg. commute time (minutes): 18.6
> Share of commuters driving alone: 69.9% — 20th lowest of 384 metros
> Share of commuters carpooling: 10.6% — 57th highest of 384 metros
> Share of commuters using public transit: 1.6% — 88th highest of 384 metros
[recirclink id=1060122]

28. College Station-Bryan, TX
> Avg. commute time (minutes): 18.5
> Share of commuters driving alone: 79.1% — 150th lowest of 384 metros
> Share of commuters carpooling: 9.7% — 130th highest of 384 metros
> Share of commuters using public transit: 1.4% — 116th highest of 384 metros

27. Sioux Falls, SD
> Avg. commute time (minutes): 18.4
> Share of commuters driving alone: 83.3% — 63rd highest of 384 metros
> Share of commuters carpooling: 7.7% — 64th lowest of 384 metros
> Share of commuters using public transit: 0.4% — 104th lowest of 384 metros
[in-text-ad-2]
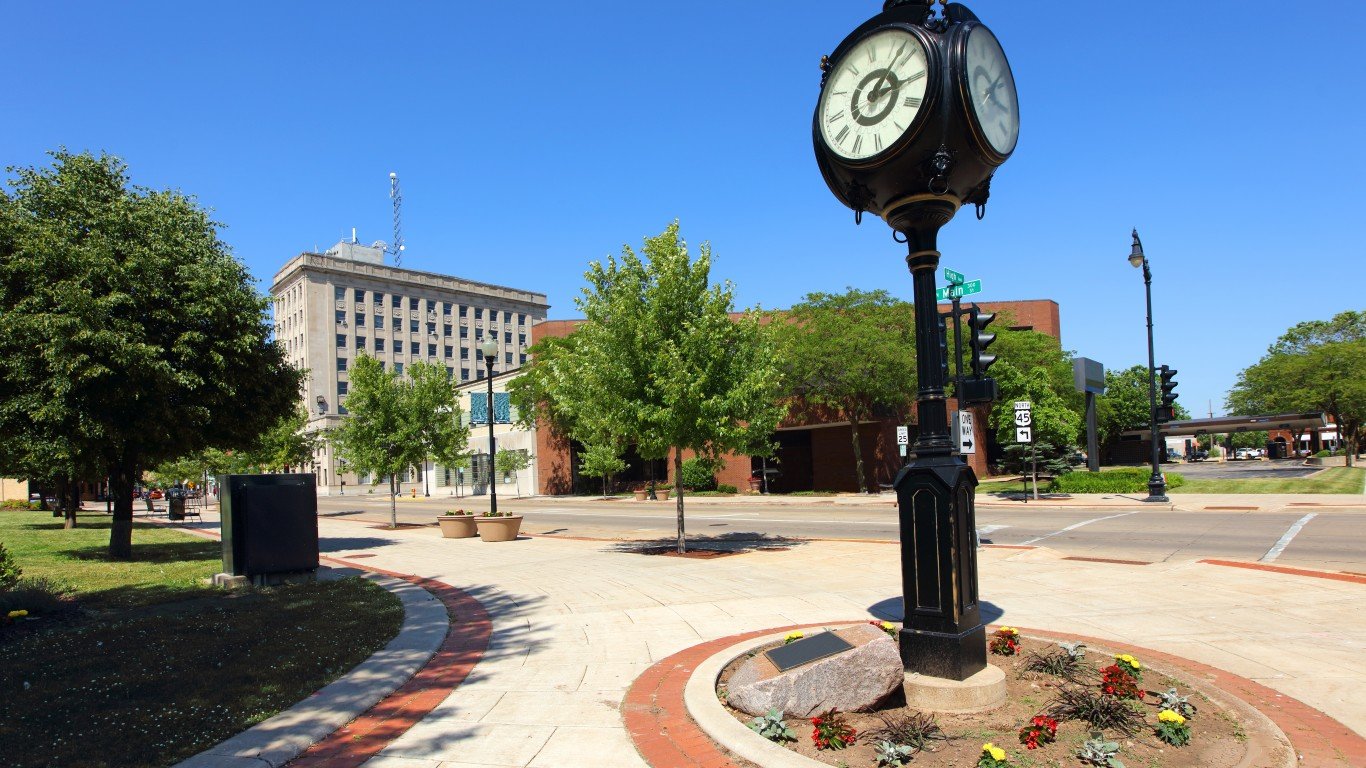
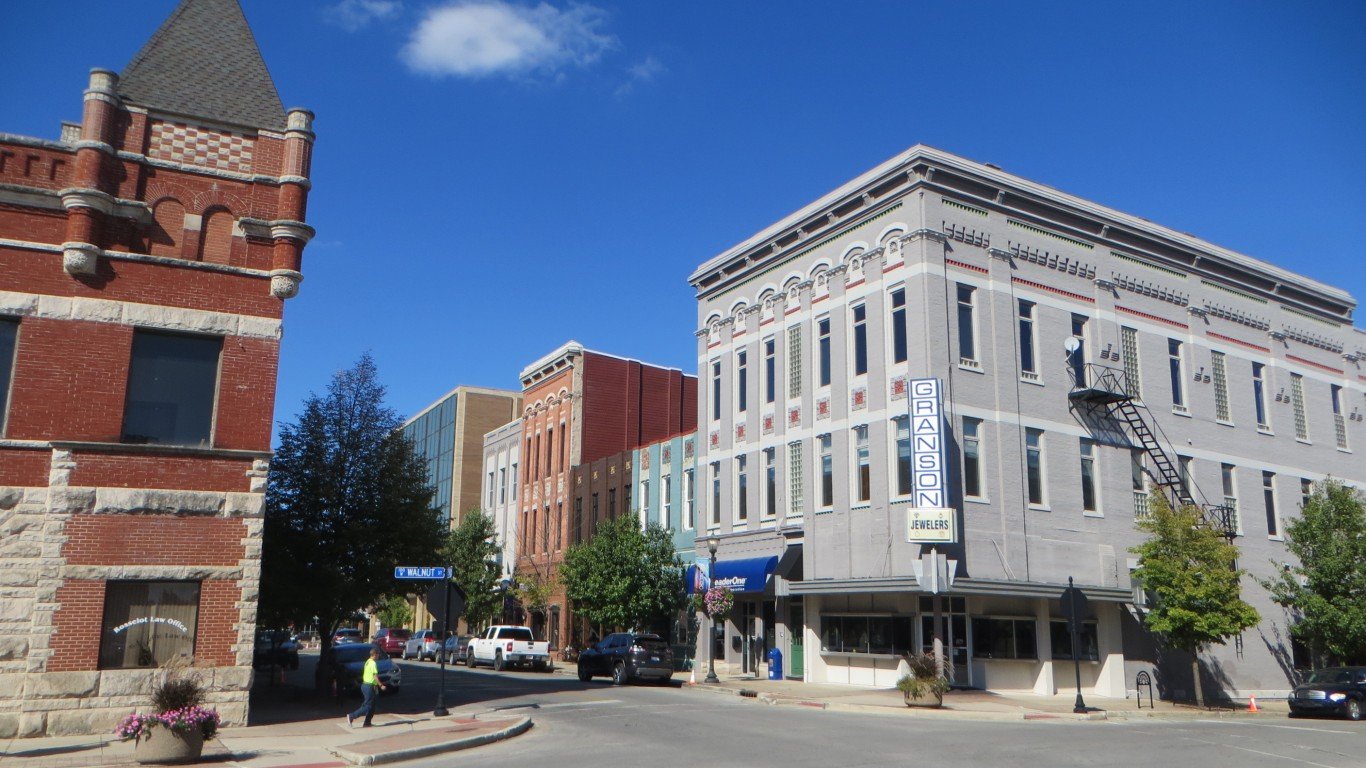
26. Decatur, IL
> Avg. commute time (minutes): 18.3
> Share of commuters driving alone: 85.3% — 16th highest of 384 metros
> Share of commuters carpooling: 6.9% — 12th lowest of 384 metros
> Share of commuters using public transit: 1.1% — 135th highest of 384 metros
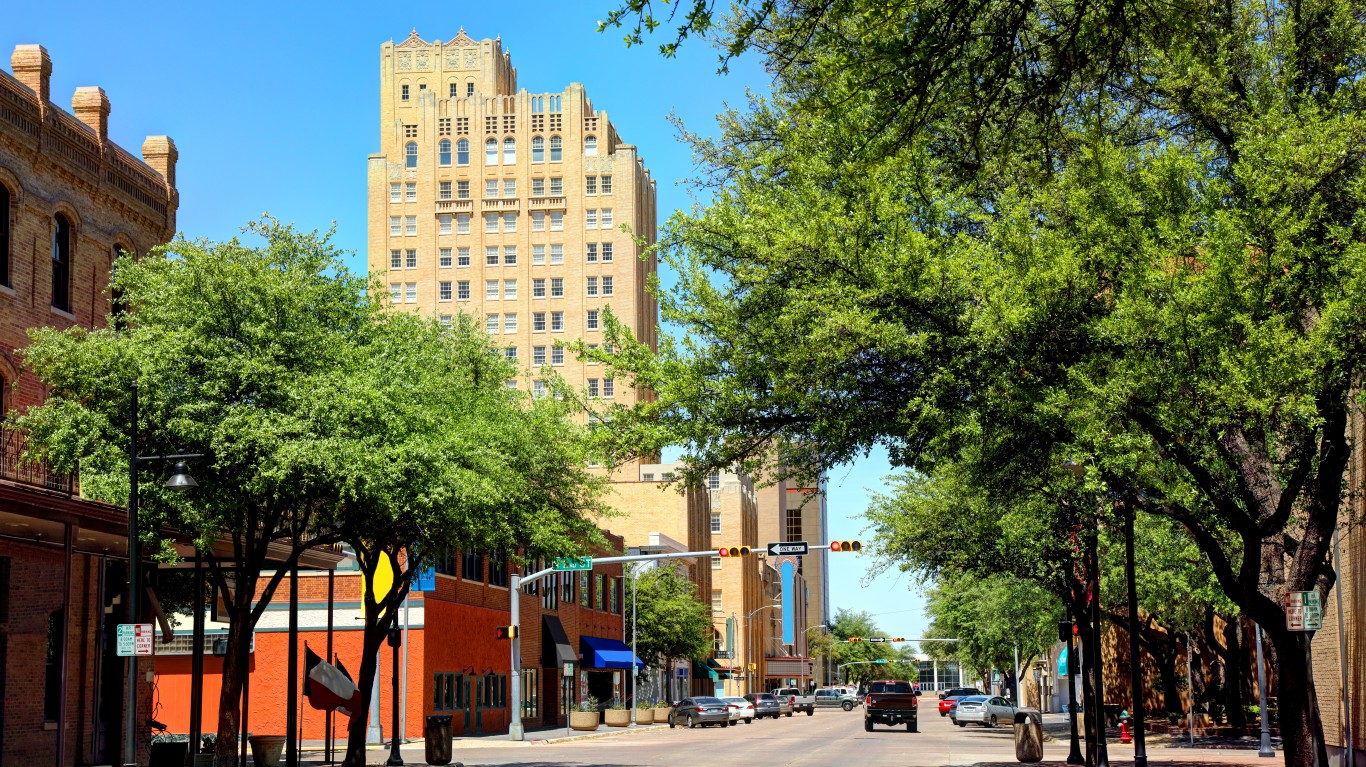
25. Abilene, TX
> Avg. commute time (minutes): 18.3
> Share of commuters driving alone: 79.1% — 147th lowest of 384 metros
> Share of commuters carpooling: 10.8% — 52nd highest of 384 metros
> Share of commuters using public transit: 0.6% — 138th lowest of 384 metros
[in-text-ad]
24. Grand Island, NE
> Avg. commute time (minutes): 18.3
> Share of commuters driving alone: 83.5% — 55th highest of 384 metros
> Share of commuters carpooling: 10.8% — 50th highest of 384 metros
> Share of commuters using public transit: 0.3% — 43rd lowest of 384 metros
[recirclink id=1024519]
23. Bloomington, IL
> Avg. commute time (minutes): 18.1
> Share of commuters driving alone: 79.3% — 158th lowest of 384 metros
> Share of commuters carpooling: 7.4% — 43rd lowest of 384 metros
> Share of commuters using public transit: 1.1% — 136th highest of 384 metros
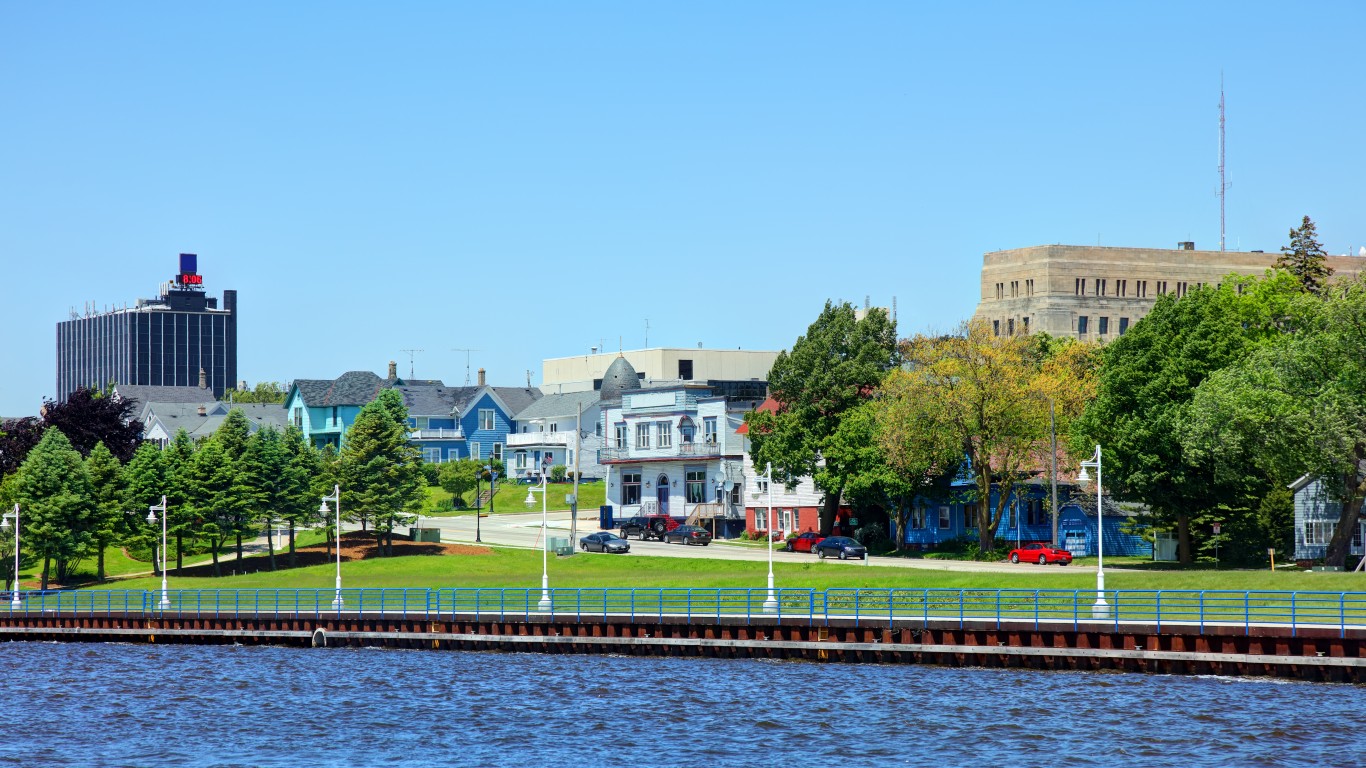
22. Sheboygan, WI
> Avg. commute time (minutes): 18.1
> Share of commuters driving alone: 83.1% — 67th highest of 384 metros
> Share of commuters carpooling: 7.8% — 78th lowest of 384 metros
> Share of commuters using public transit: 0.4% — 80th lowest of 384 metros
[in-text-ad-2]
21. Mankato, MN
> Avg. commute time (minutes): 18.1
> Share of commuters driving alone: 77.9% — 113th lowest of 384 metros
> Share of commuters carpooling: 7.9% — 91st lowest of 384 metros
> Share of commuters using public transit: 1.3% — 121st highest of 384 metros
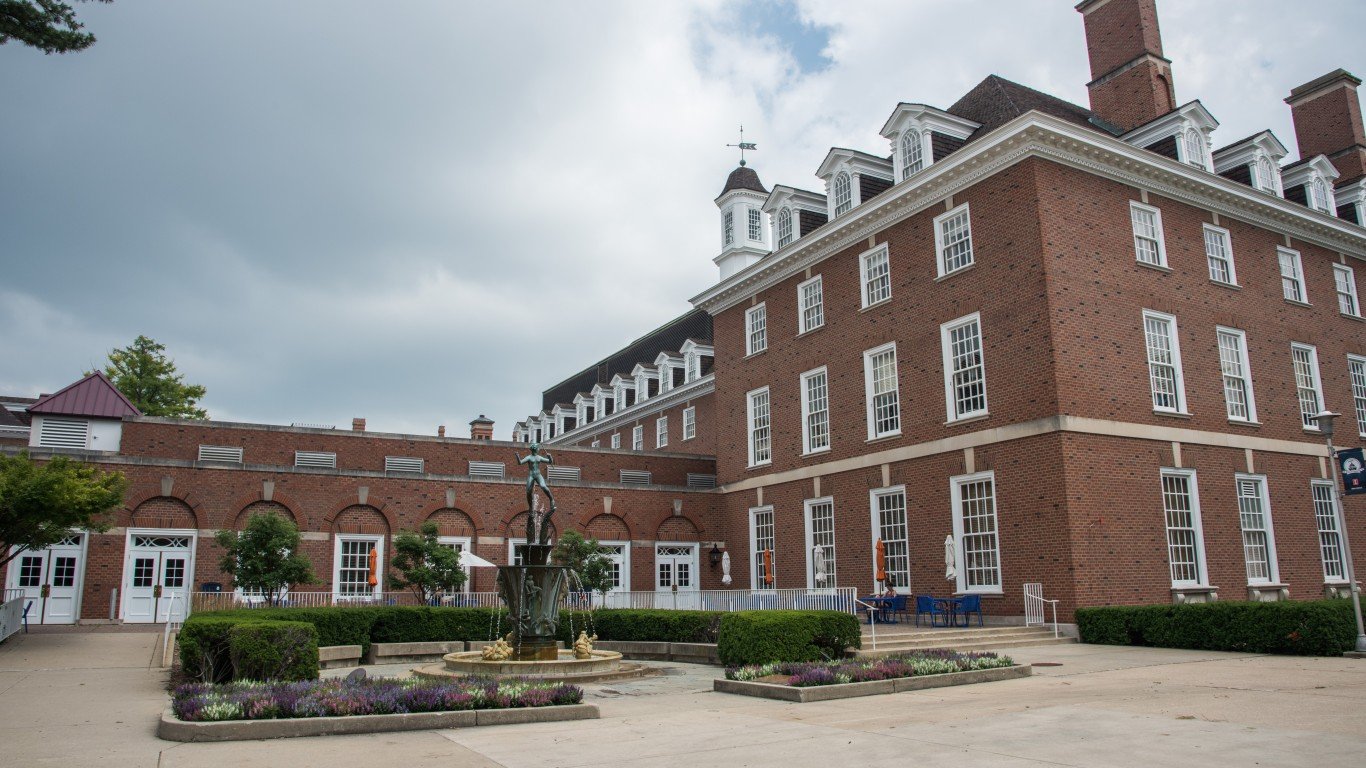
20. Champaign-Urbana, IL
> Avg. commute time (minutes): 18.0
> Share of commuters driving alone: 71.2% — 24th lowest of 384 metros
> Share of commuters carpooling: 7.8% — 83rd lowest of 384 metros
> Share of commuters using public transit: 5.0% — 18th highest of 384 metros
[in-text-ad]
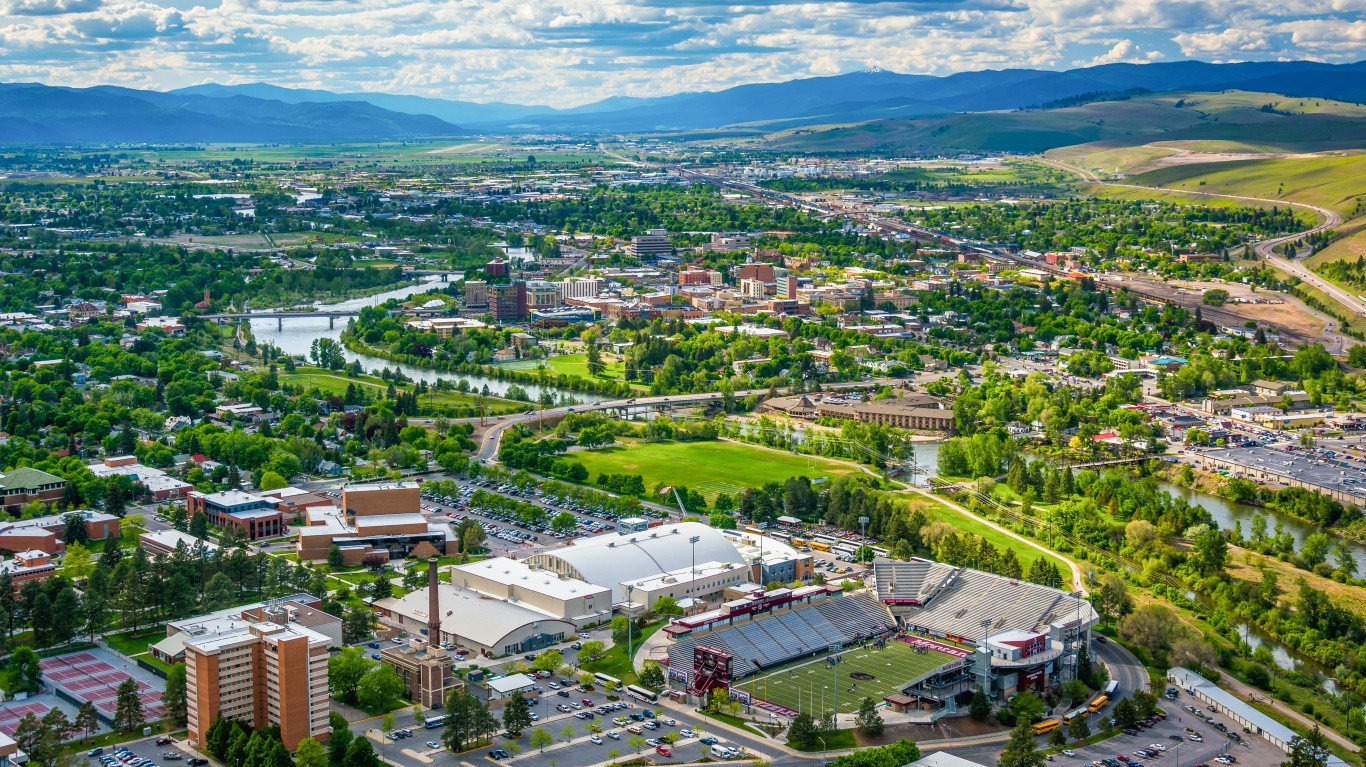
19. Missoula, MT
> Avg. commute time (minutes): 18.0
> Share of commuters driving alone: 73.6% — 42nd lowest of 384 metros
> Share of commuters carpooling: 8.3% — 138th lowest of 384 metros
> Share of commuters using public transit: 1.9% — 74th highest of 384 metros
[recirclink id=987778]
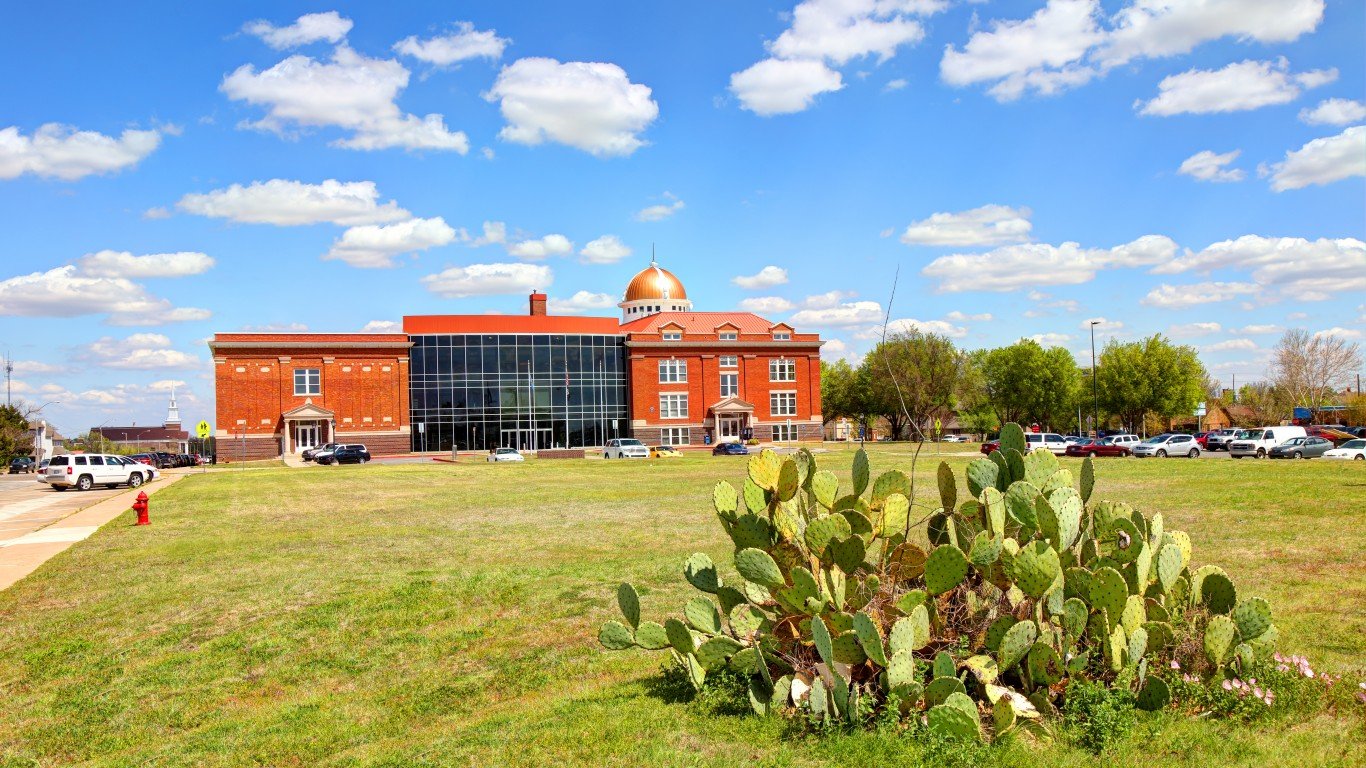
18. Lawton, OK
> Avg. commute time (minutes): 18.0
> Share of commuters driving alone: 73.9% — 45th lowest of 384 metros
> Share of commuters carpooling: 10.5% — 66th highest of 384 metros
> Share of commuters using public transit: 1.2% — 126th highest of 384 metros

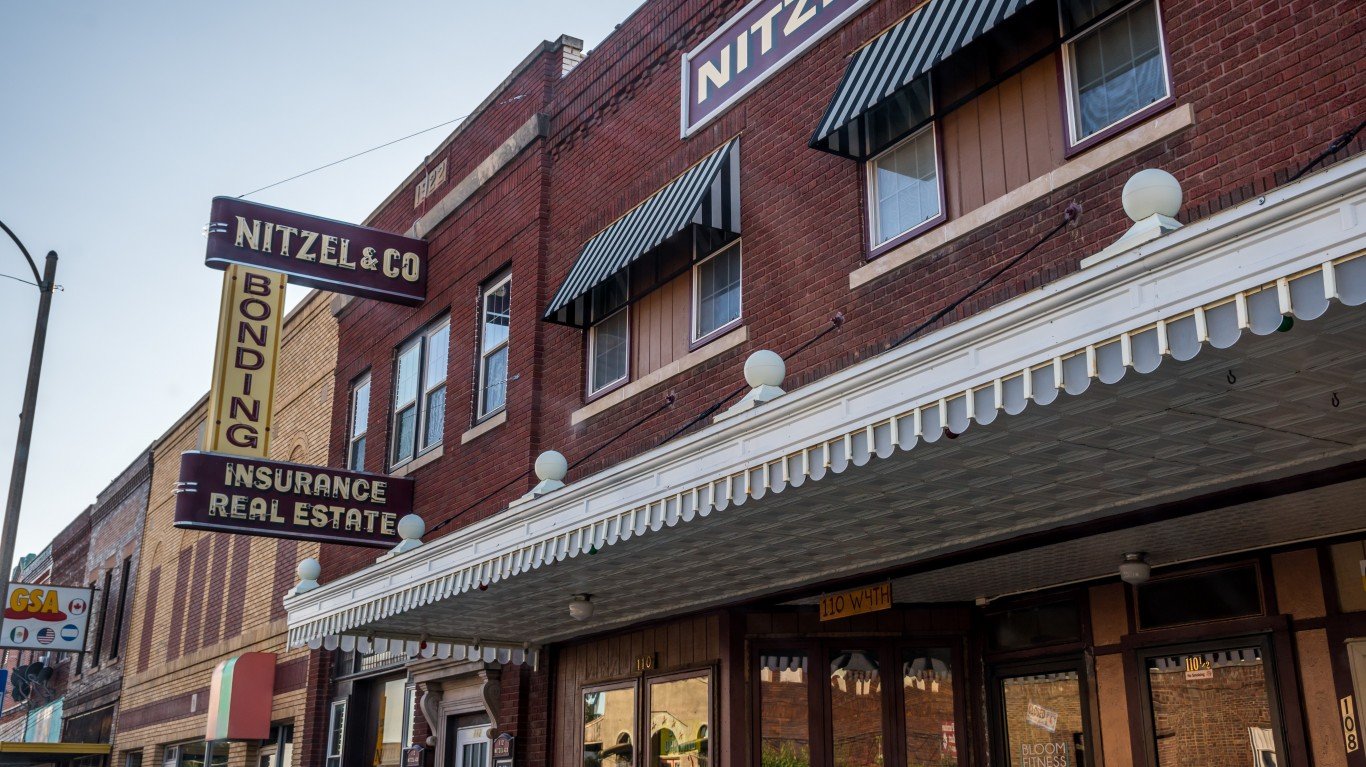
17. Enid, OK
> Avg. commute time (minutes): 17.9
> Share of commuters driving alone: 79.4% — 162nd lowest of 384 metros
> Share of commuters carpooling: 13.0% — 9th highest of 384 metros
> Share of commuters using public transit: 0.4% — 70th lowest of 384 metros
[in-text-ad-2]
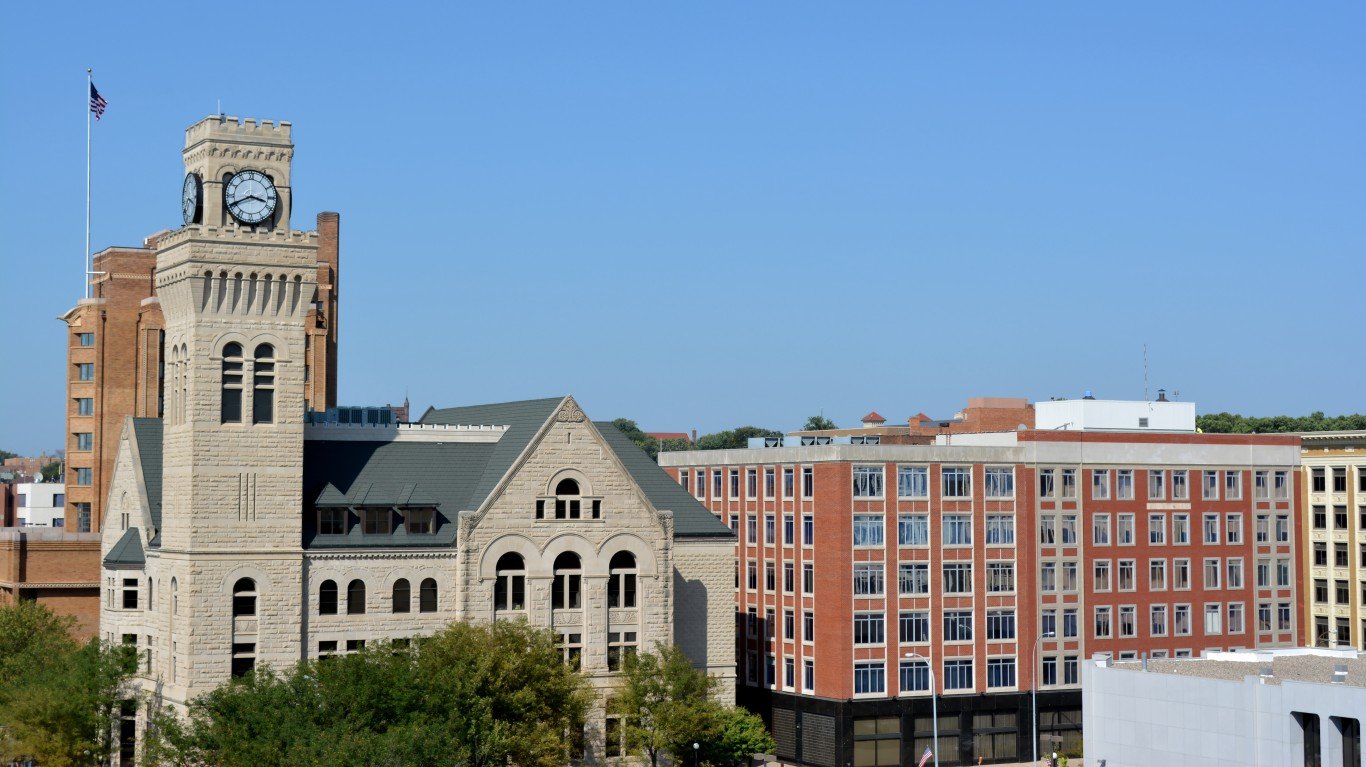
16. Sioux City, IA-NE-SD
> Avg. commute time (minutes): 17.8
> Share of commuters driving alone: 81.9% — 112th highest of 384 metros
> Share of commuters carpooling: 10.0% — 102nd highest of 384 metros
> Share of commuters using public transit: 0.9% — 182nd highest of 384 metros
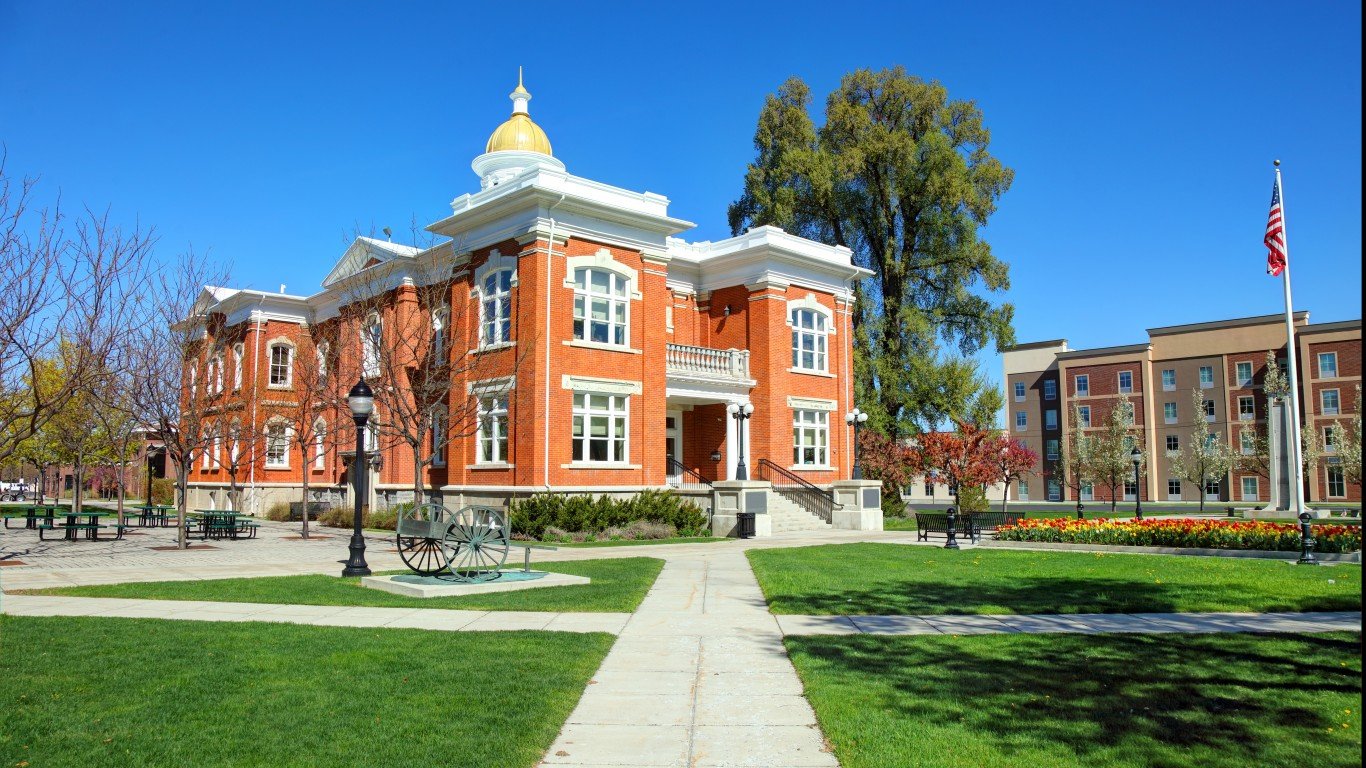
15. Logan, UT-ID
> Avg. commute time (minutes): 17.8
> Share of commuters driving alone: 74.4% — 51st lowest of 384 metros
> Share of commuters carpooling: 10.9% — 43rd highest of 384 metros
> Share of commuters using public transit: 1.6% — 89th highest of 384 metros
[in-text-ad]
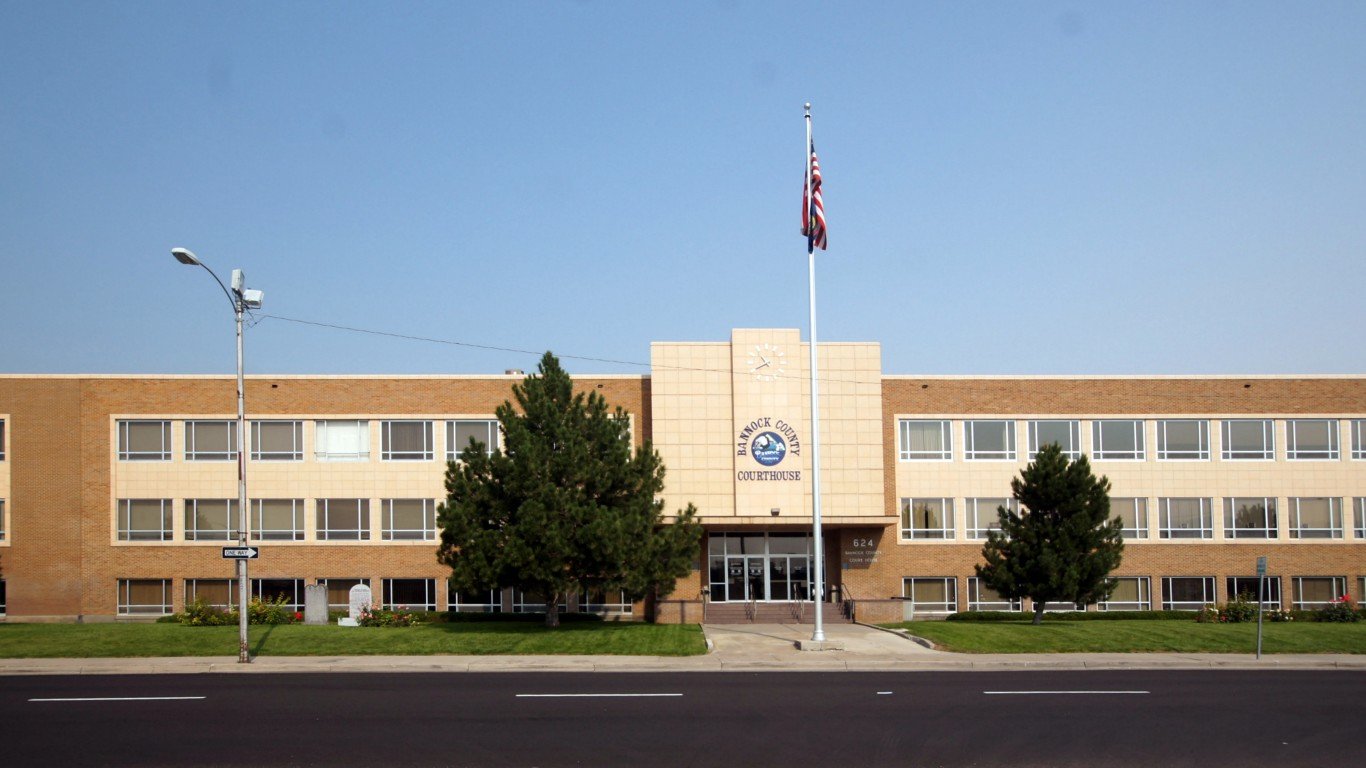
14. Pocatello, ID
> Avg. commute time (minutes): 17.8
> Share of commuters driving alone: 77.0% — 90th lowest of 384 metros
> Share of commuters carpooling: 10.6% — 59th highest of 384 metros
> Share of commuters using public transit: 0.9% — 181st highest of 384 metros
[recirclink id=1044820]

13. St. George, UT
> Avg. commute time (minutes): 17.7
> Share of commuters driving alone: 77.1% — 96th lowest of 384 metros
> Share of commuters carpooling: 9.7% — 127th highest of 384 metros
> Share of commuters using public transit: 0.3% — 60th lowest of 384 metros
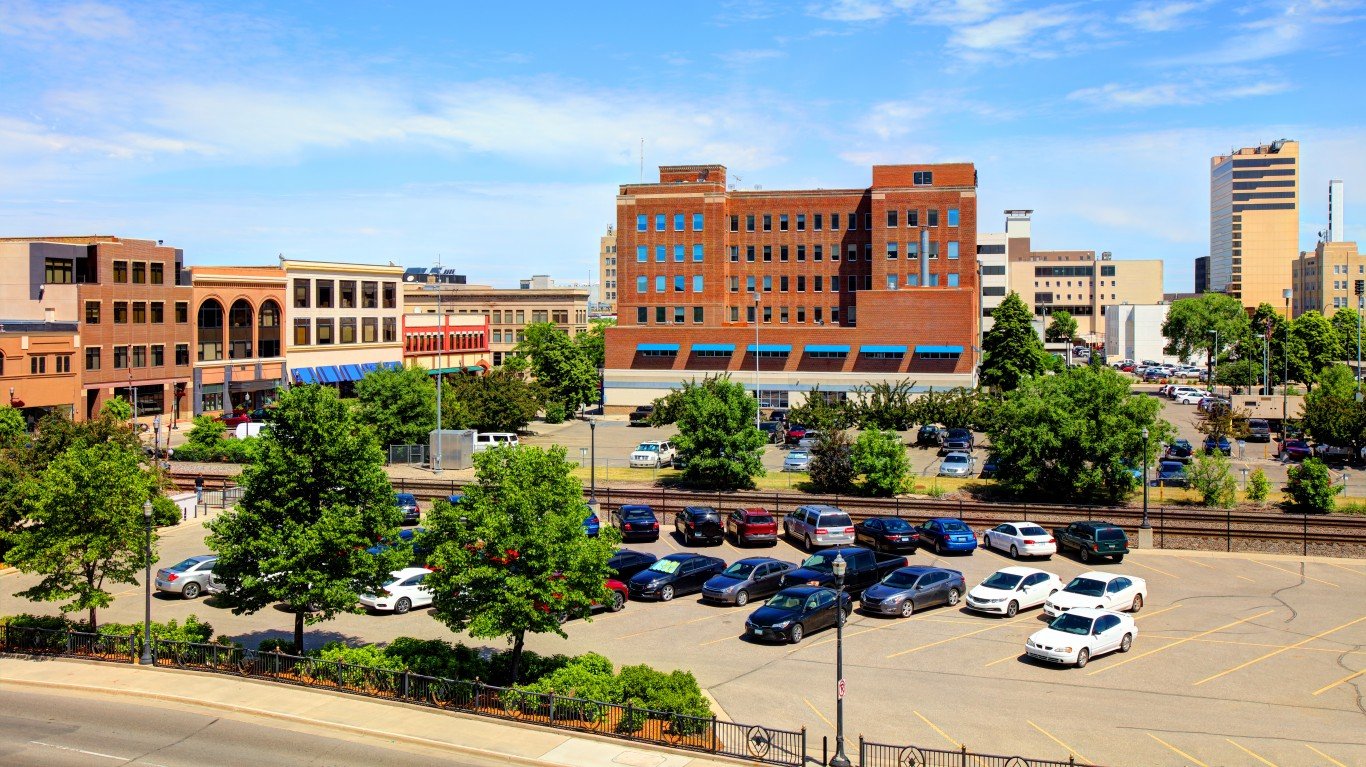
12. Fargo, ND-MN
> Avg. commute time (minutes): 17.5
> Share of commuters driving alone: 81.0% — 147th highest of 384 metros
> Share of commuters carpooling: 8.4% — 145th lowest of 384 metros
> Share of commuters using public transit: 0.9% — 169th highest of 384 metros
[in-text-ad-2]
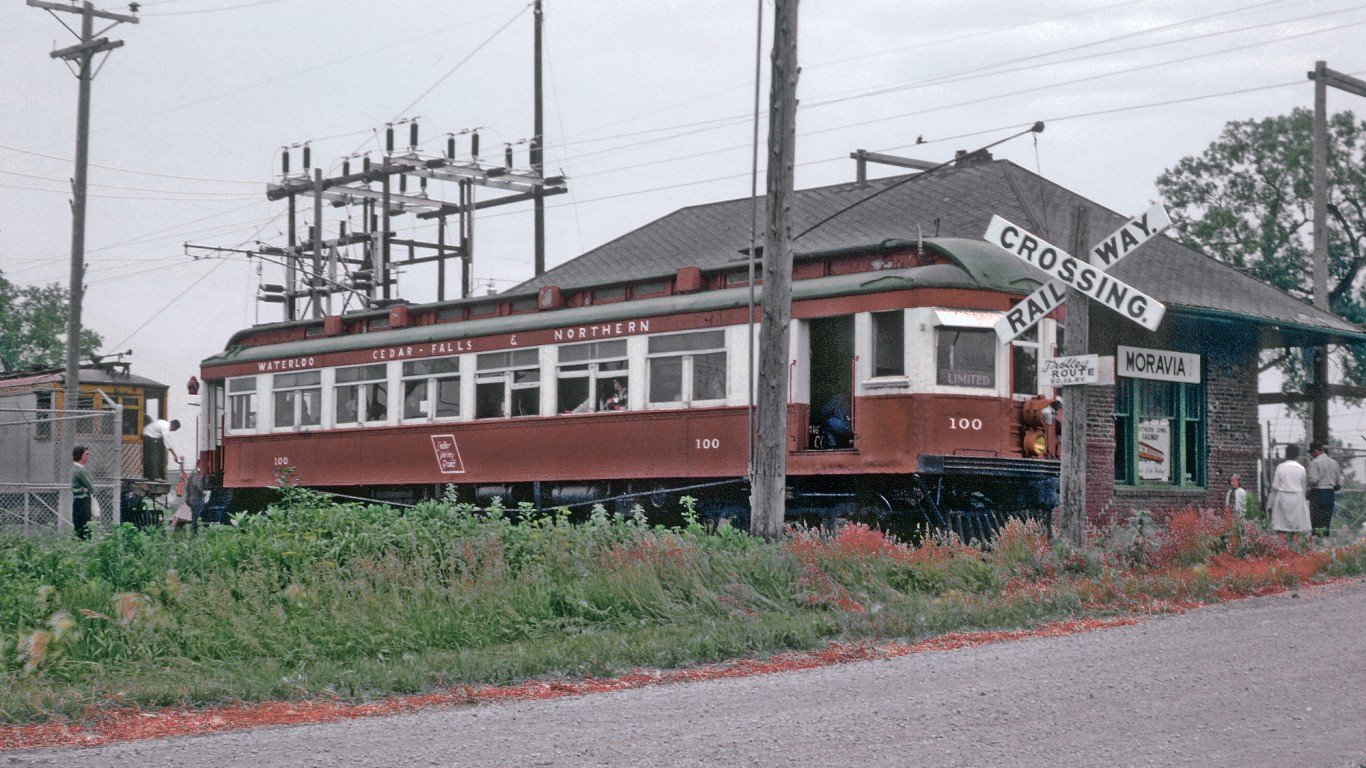
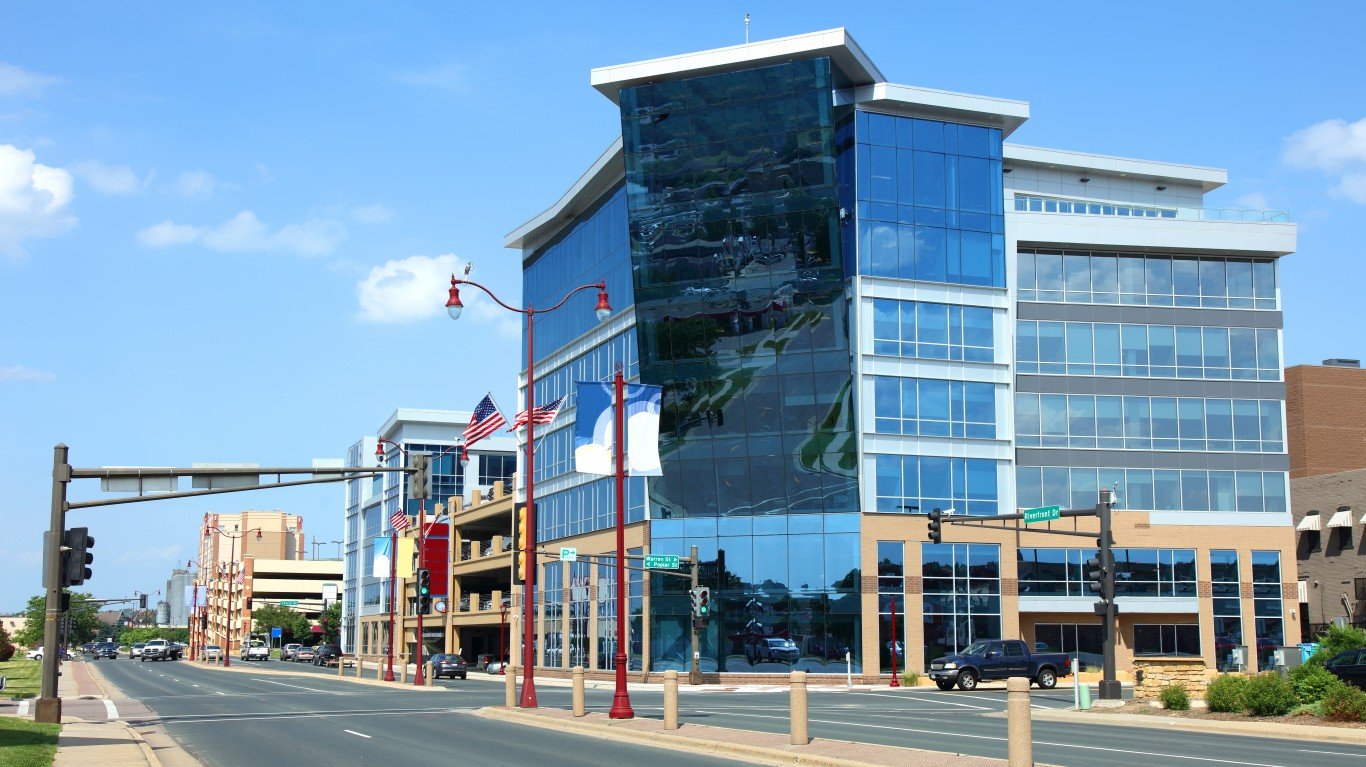
11. Waterloo-Cedar Falls, IA
> Avg. commute time (minutes): 17.5
> Share of commuters driving alone: 80.2% — 189th highest of 384 metros
> Share of commuters carpooling: 8.4% — 141st lowest of 384 metros
> Share of commuters using public transit: 0.4% — 93rd lowest of 384 metros
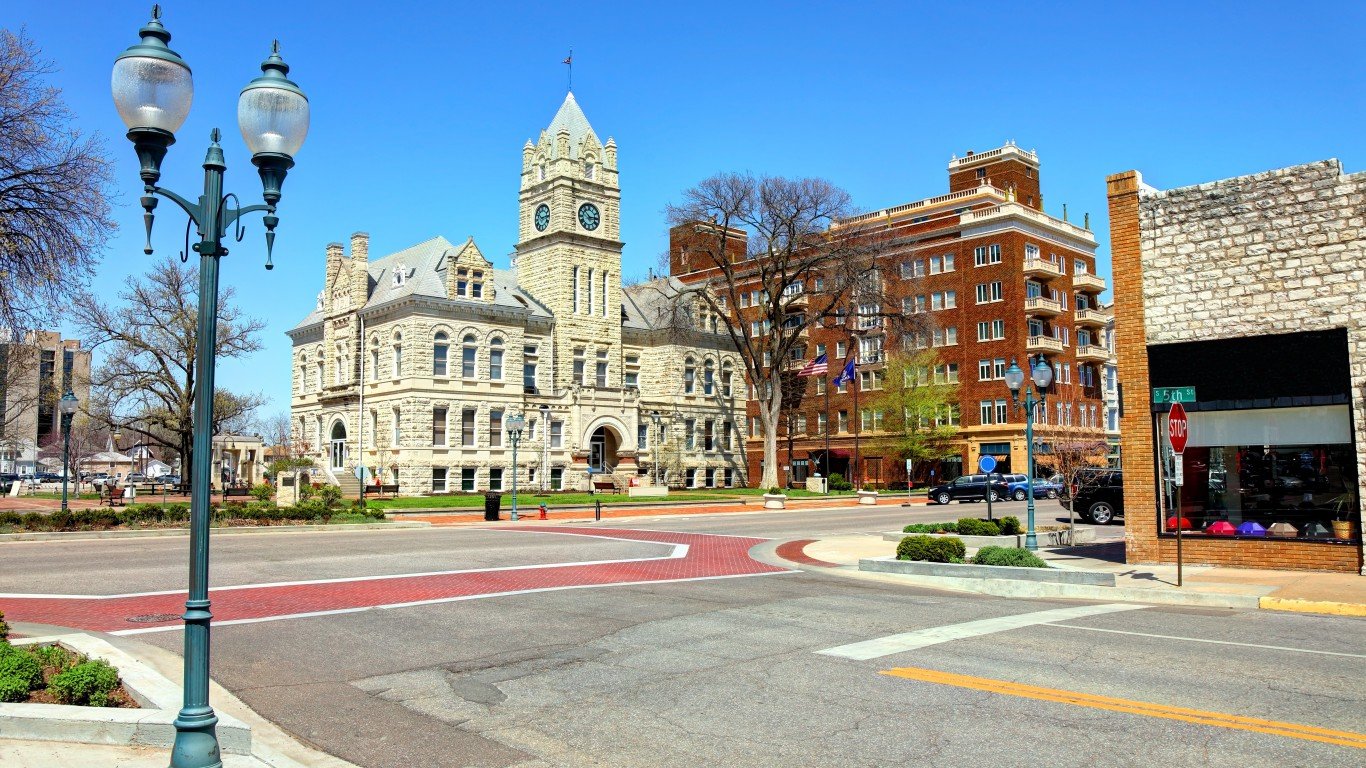
10. Manhattan, KS
> Avg. commute time (minutes): 17.4
> Share of commuters driving alone: 74.9% — 60th lowest of 384 metros
> Share of commuters carpooling: 10.2% — 90th highest of 384 metros
> Share of commuters using public transit: 0.2% — 26th lowest of 384 metros
[in-text-ad]
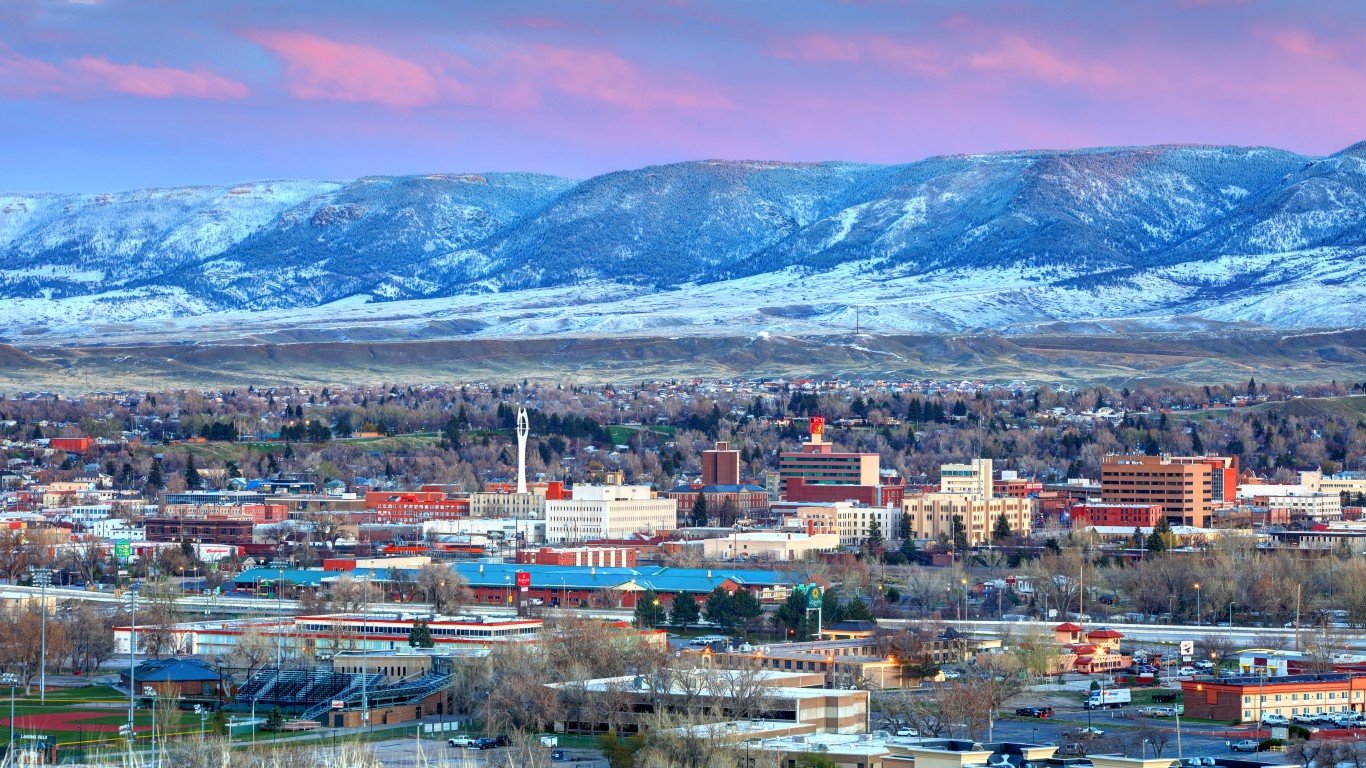
9. Casper, WY
> Avg. commute time (minutes): 17.3
> Share of commuters driving alone: 83.0% — 75th highest of 384 metros
> Share of commuters carpooling: 8.4% — 142nd lowest of 384 metros
> Share of commuters using public transit: 0.4% — 79th lowest of 384 metros
[recirclink id=1054986]
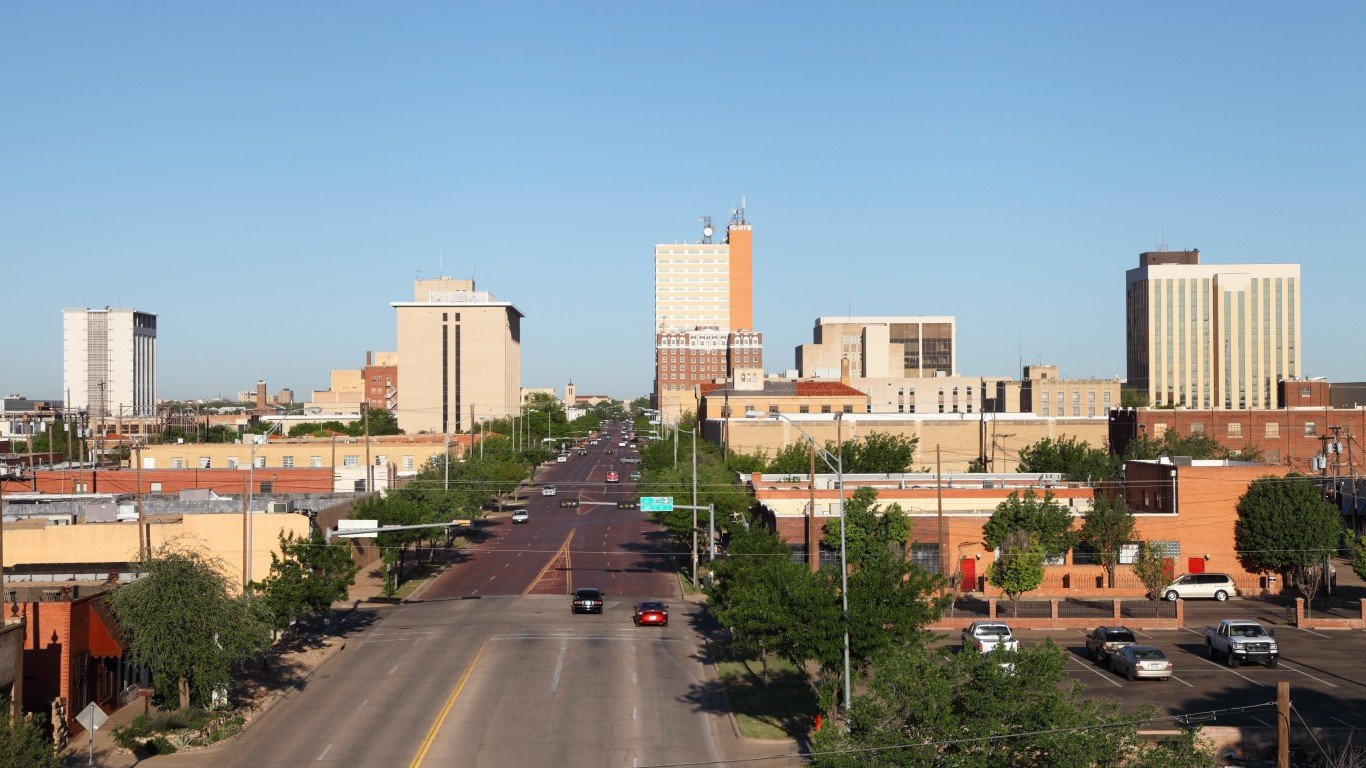
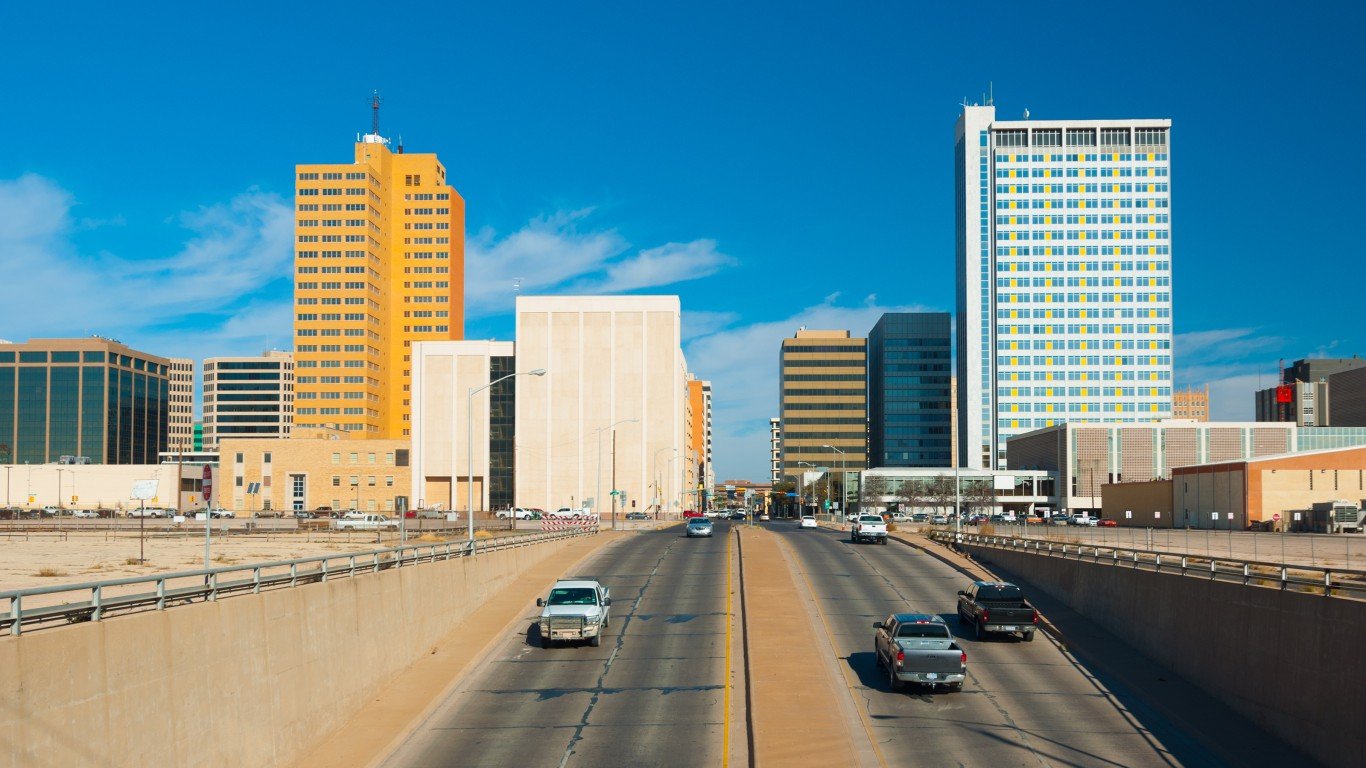
8. Lubbock, TX
> Avg. commute time (minutes): 17.0
> Share of commuters driving alone: 79.9% — 186th lowest of 384 metros
> Share of commuters carpooling: 12.0% — 23rd highest of 384 metros
> Share of commuters using public transit: 0.7% — 163rd lowest of 384 metros
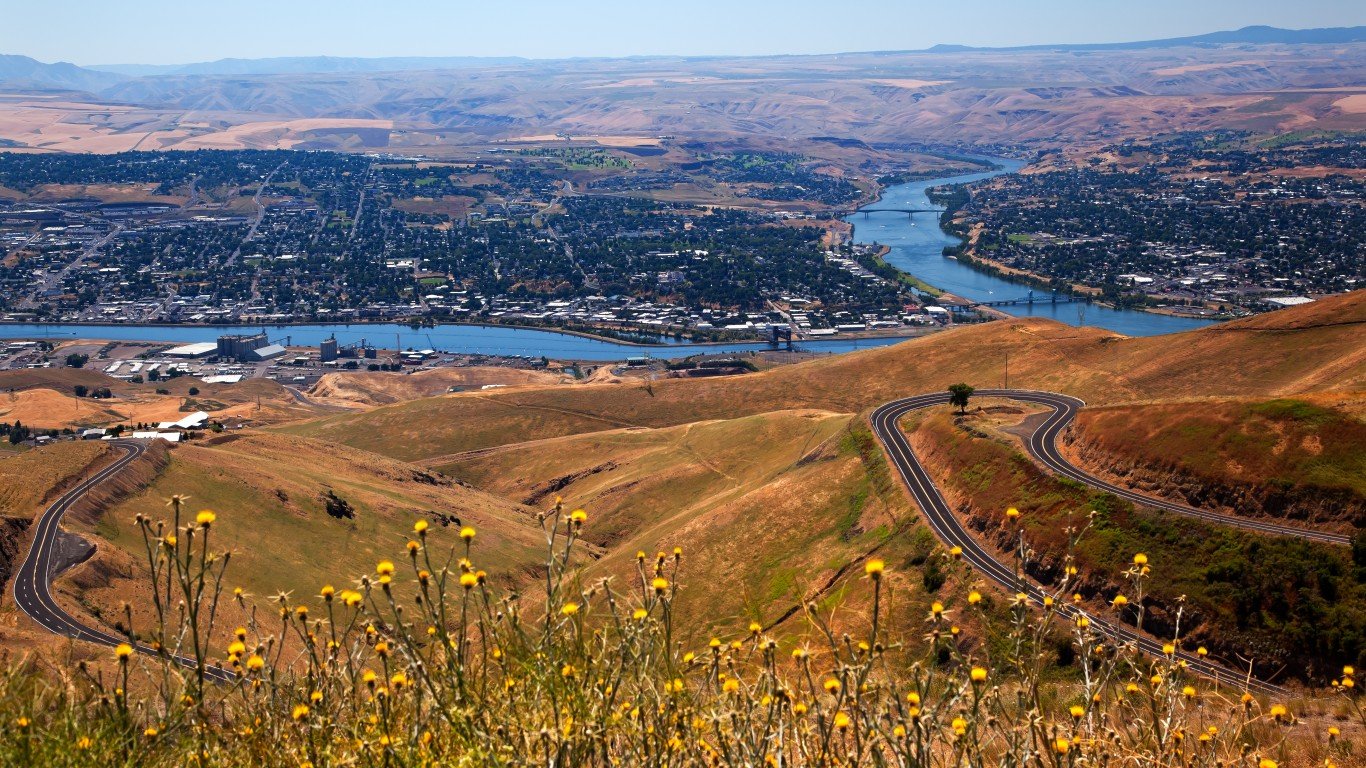
7. Lewiston, ID-WA
> Avg. commute time (minutes): 17.0
> Share of commuters driving alone: 80.5% — 176th highest of 384 metros
> Share of commuters carpooling: 8.1% — 111th lowest of 384 metros
> Share of commuters using public transit: 0.5% — 123rd lowest of 384 metros
[in-text-ad-2]

6. Great Falls, MT
> Avg. commute time (minutes): 16.5
> Share of commuters driving alone: 81.0% — 149th highest of 384 metros
> Share of commuters carpooling: 9.5% — 145th highest of 384 metros
> Share of commuters using public transit: 0.8% — 186th lowest of 384 metros
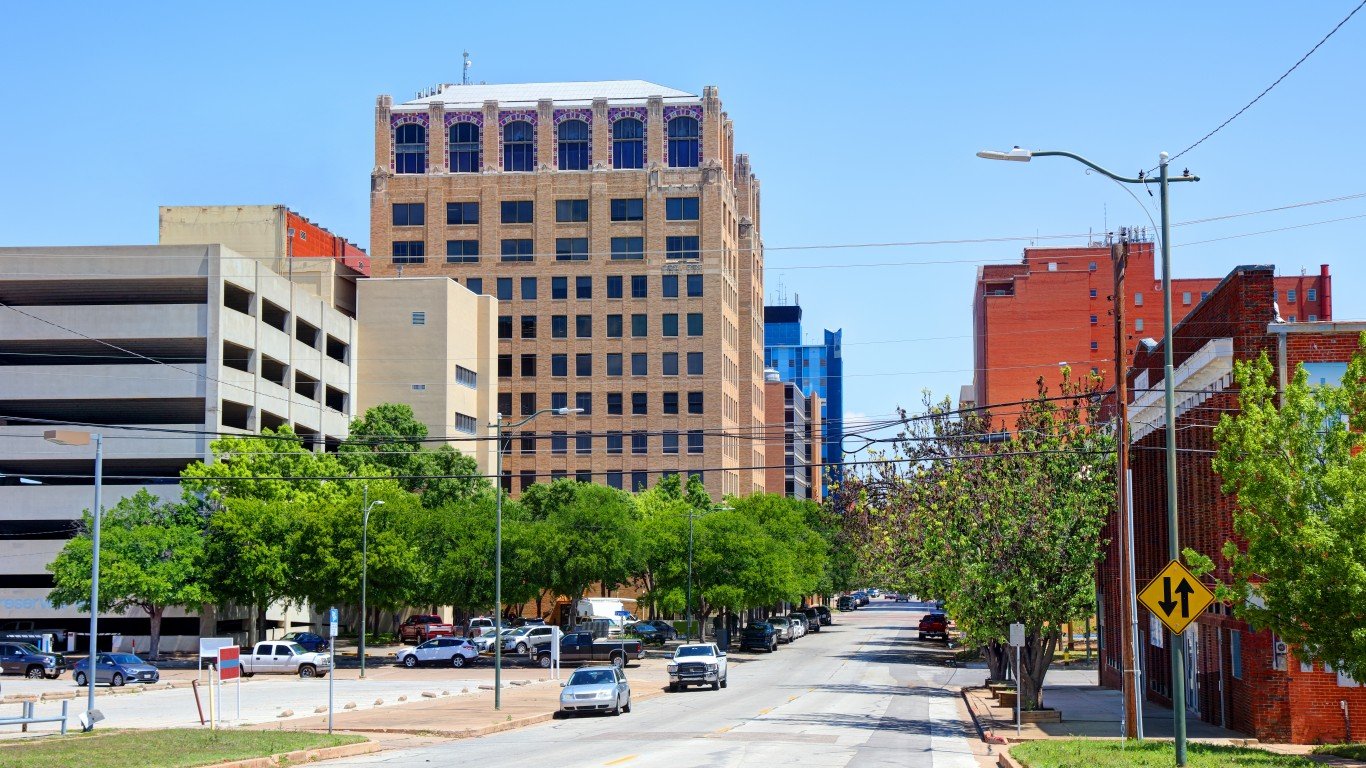
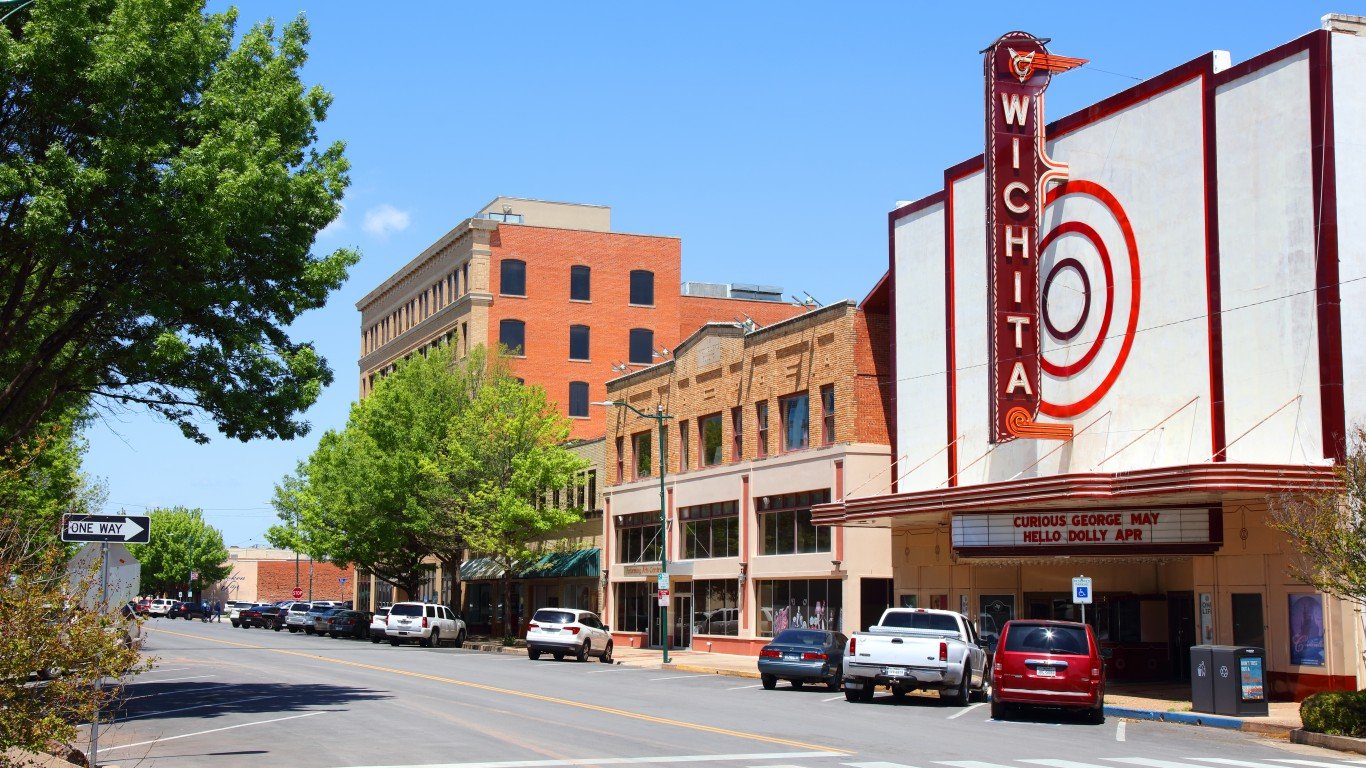
5. Wichita Falls, TX
> Avg. commute time (minutes): 16.5
> Share of commuters driving alone: 76.3% — 80th lowest of 384 metros
> Share of commuters carpooling: 9.6% — 139th highest of 384 metros
> Share of commuters using public transit: 0.4% — 96th lowest of 384 metros
[in-text-ad]

4. Dubuque, IA
> Avg. commute time (minutes): 16.4
> Share of commuters driving alone: 81.6% — 125th highest of 384 metros
> Share of commuters carpooling: 7.3% — 35th lowest of 384 metros
> Share of commuters using public transit: 0.9% — 179th highest of 384 metros
[recirclink id=1060122]
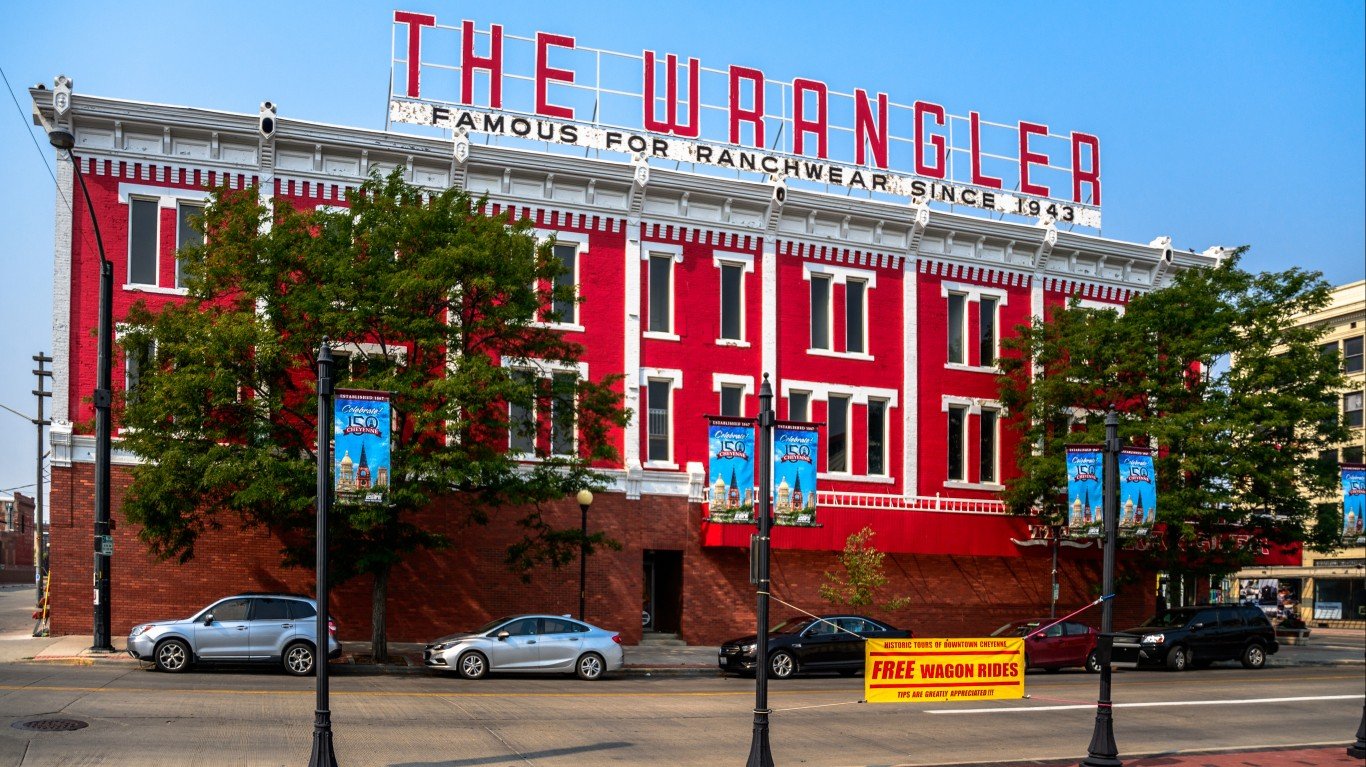
3. Cheyenne, WY
> Avg. commute time (minutes): 16.4
> Share of commuters driving alone: 81.2% — 143rd highest of 384 metros
> Share of commuters carpooling: 10.6% — 63rd highest of 384 metros
> Share of commuters using public transit: 0.2% — 24th lowest of 384 metros
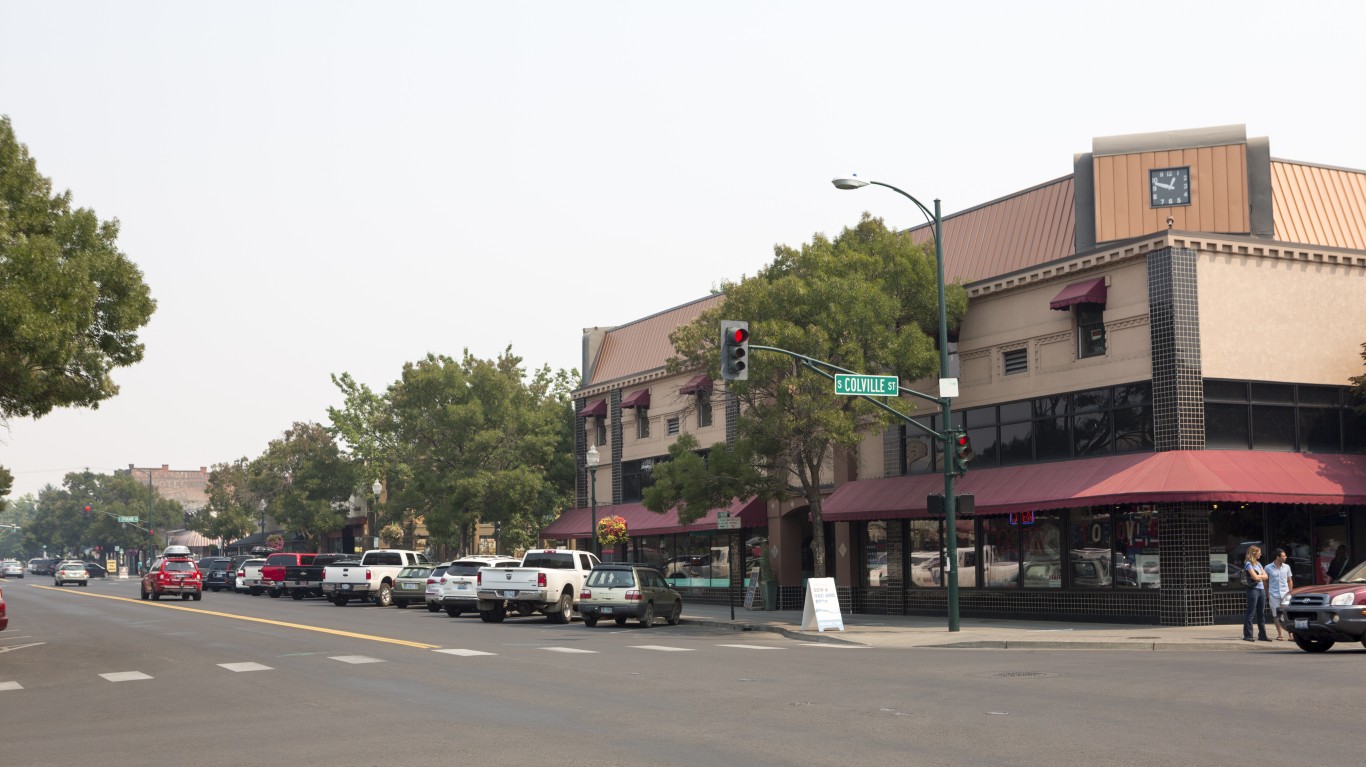
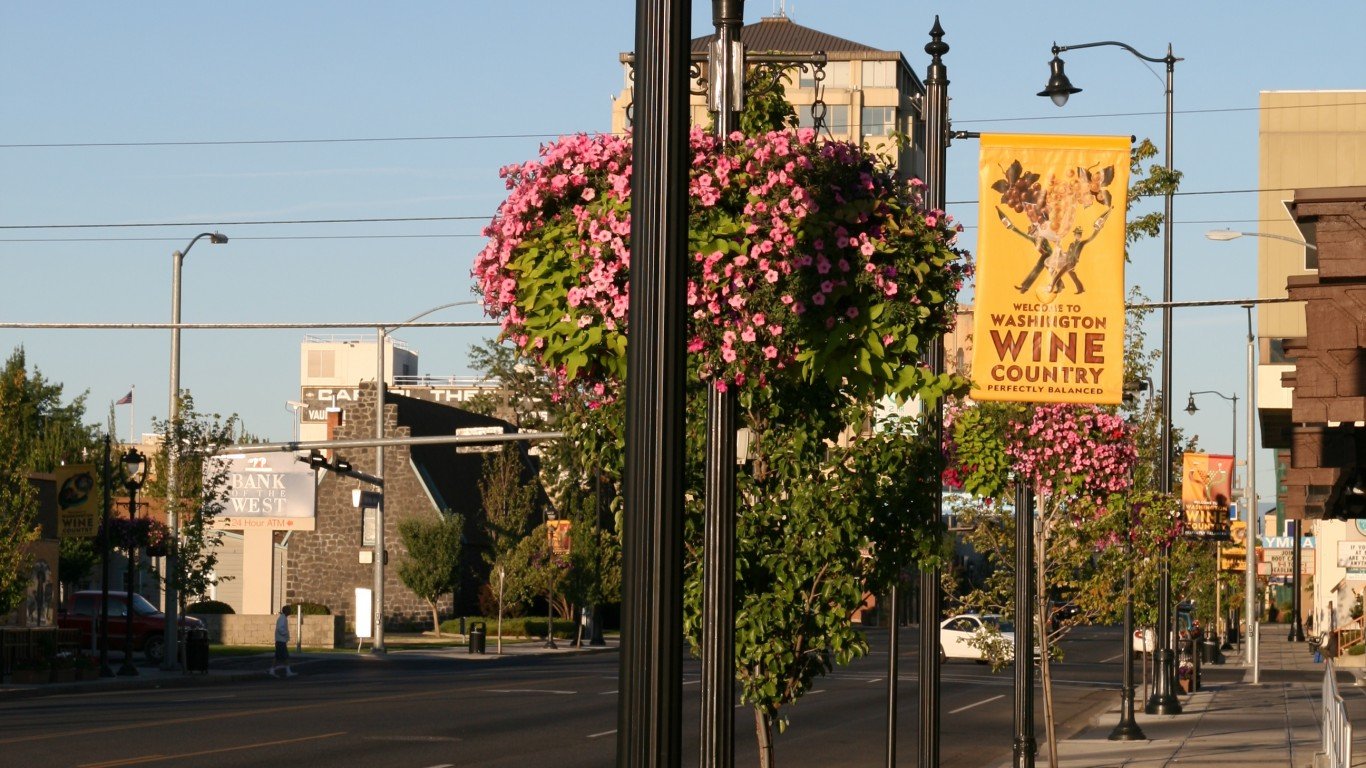
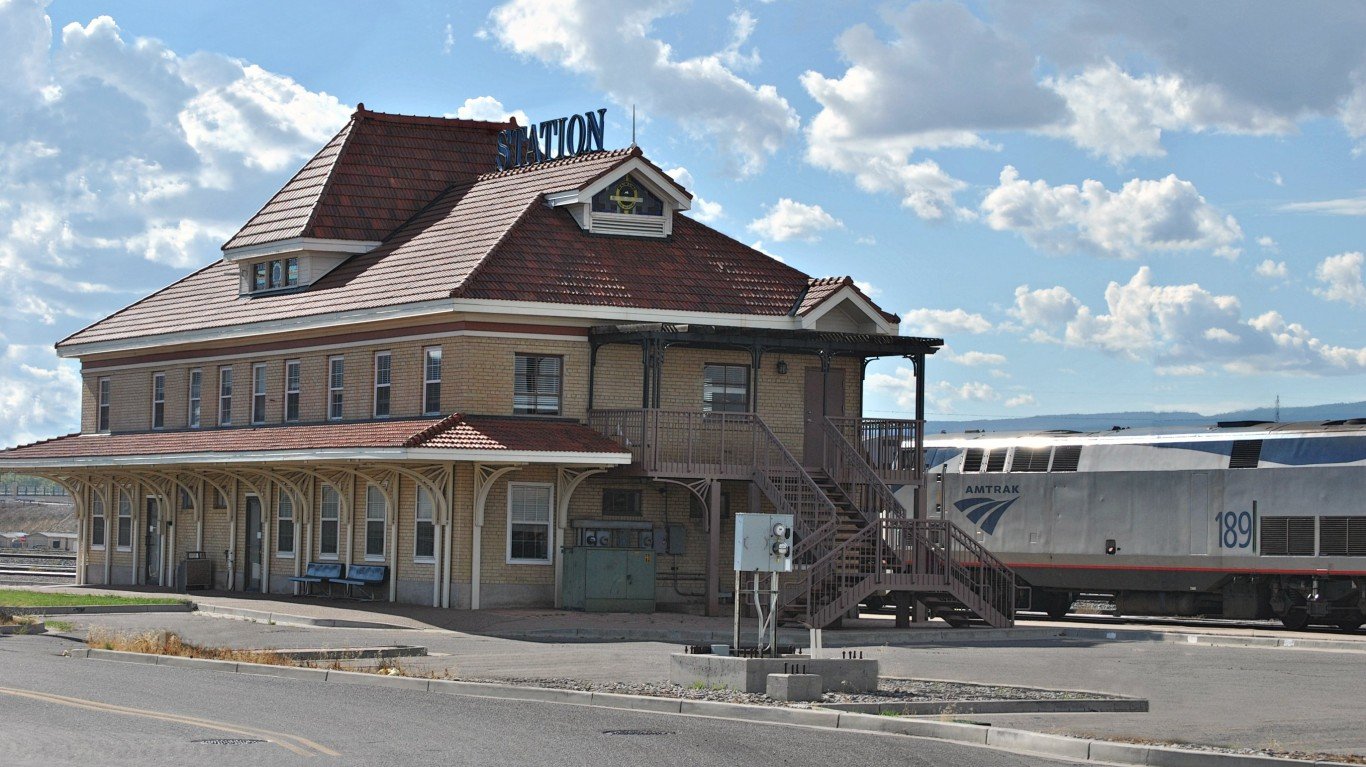
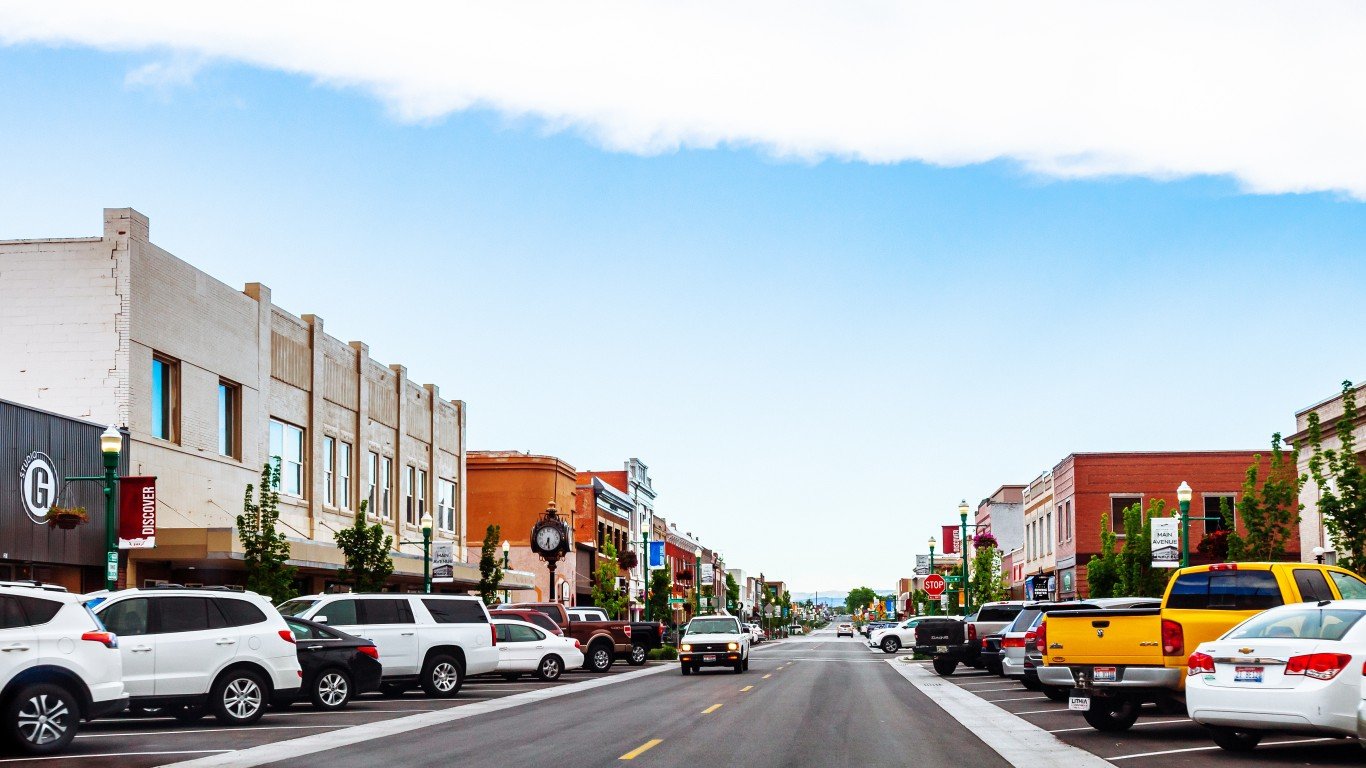
2. Walla Walla, WA
> Avg. commute time (minutes): 15.8
> Share of commuters driving alone: 71.8% — 28th lowest of 384 metros
> Share of commuters carpooling: 9.8% — 120th highest of 384 metros
> Share of commuters using public transit: 1.0% — 155th highest of 384 metros
[in-text-ad-2]
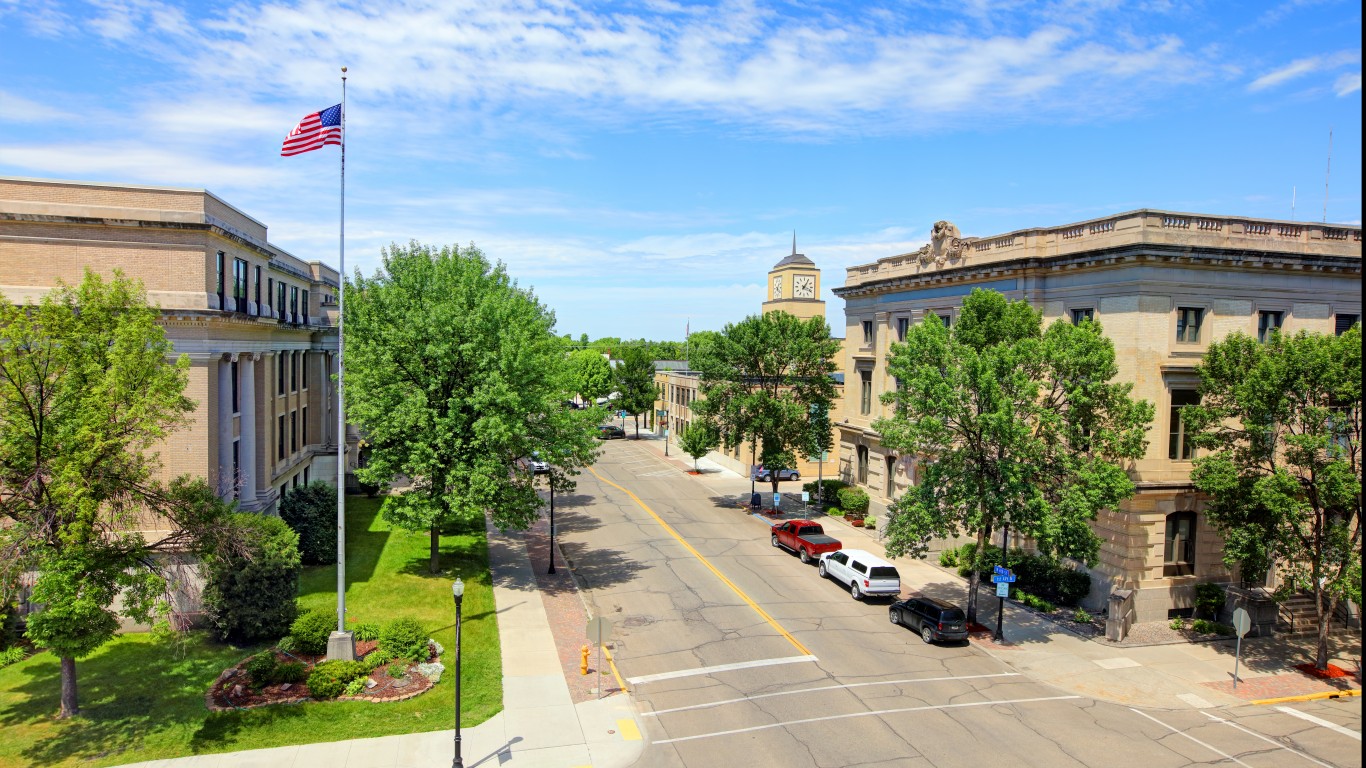
1. Grand Forks, ND-MN
> Avg. commute time (minutes): 15.7
> Share of commuters driving alone: 81.0% — 155th highest of 384 metros
> Share of commuters carpooling: 8.2% — 117th lowest of 384 metros
> Share of commuters using public transit: 0.9% — 165th highest of 384 metros
Methodology
To determine the metro areas with the shortest commutes, 24/7 Wall St. reviewed five-year estimates of average commute times from the U.S. Census Bureau’s 2020 American Community Survey.
We used the 384 metropolitan statistical areas as delineated by the United States Office of Management and Budget and used by the Census Bureau as our definition of metros.
Metro areas were ranked based on their average commute time. To break ties, we used the share of workers with a commute of 15 minutes or less.
Additional information on the share of commuters driving alone, carpooling, and using public transit are also five-year estimates from the 2020 ACS. Because the Census Bureau didn’t release one-year estimates for 2020 due to data collection issues caused by the COVID-19 pandemic, all ACS data are five-year estimates.
Contact [email protected] for any questions or corrections.