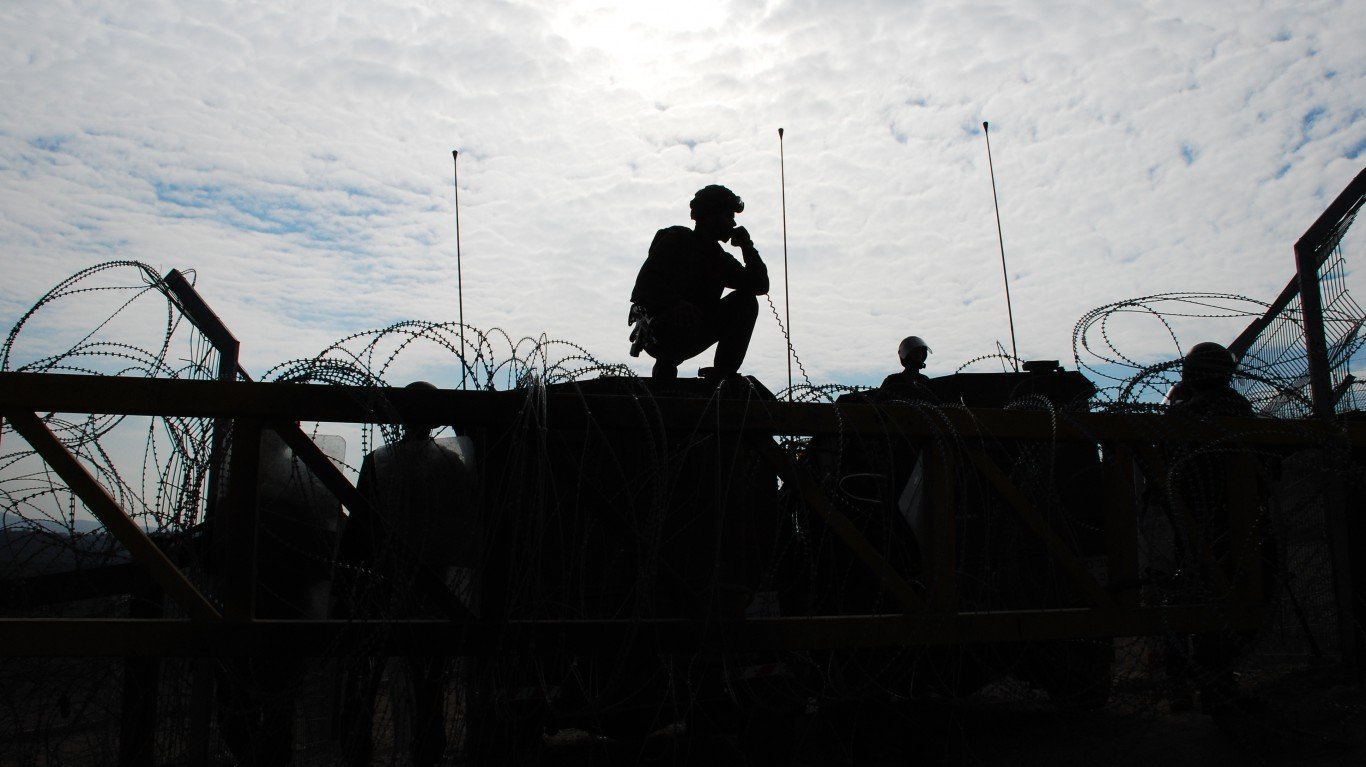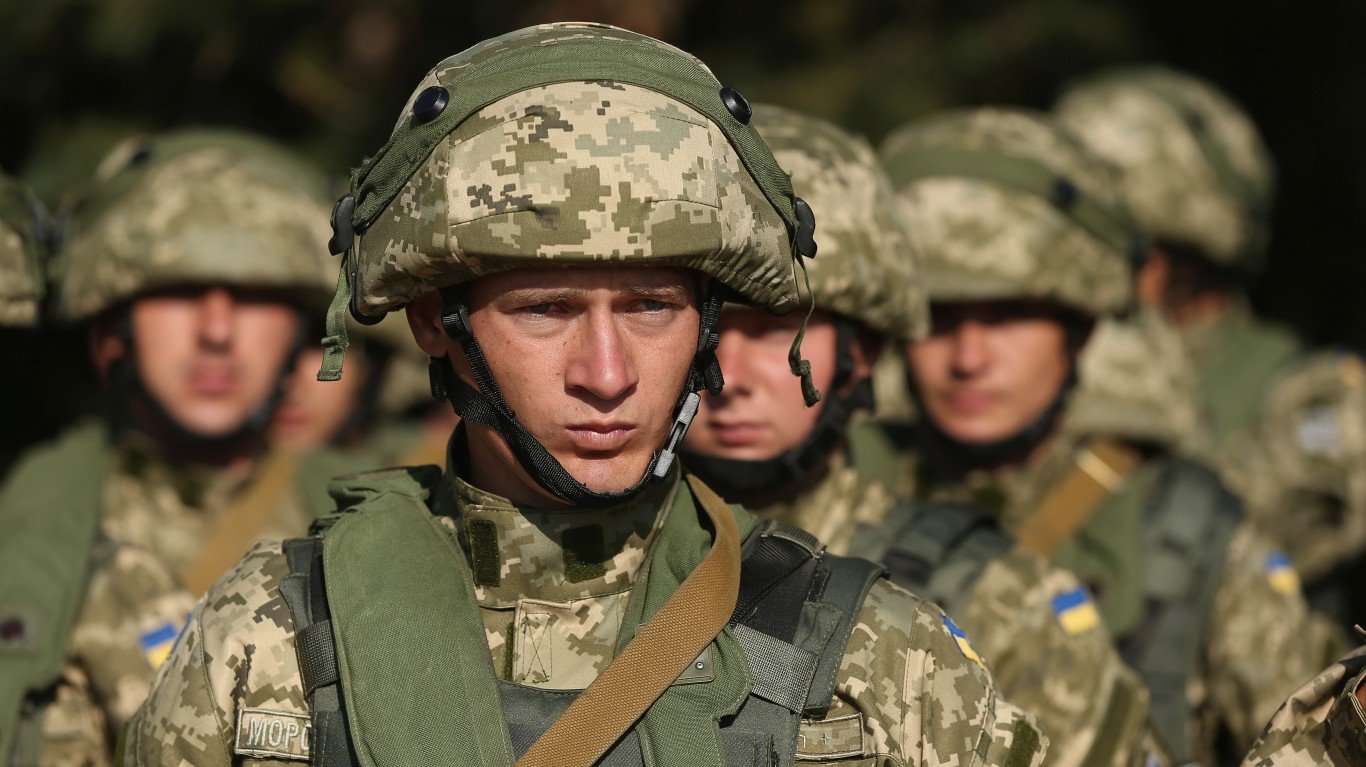
The United States has engaged militarily in Iraq, Afghanistan, Pakistan, Yemen, Syria, Libya, Somalia, South Sudan, Uganda, DR Congo, and the Central African Republic since the Sept. 11, 2001, terrorist attacks.
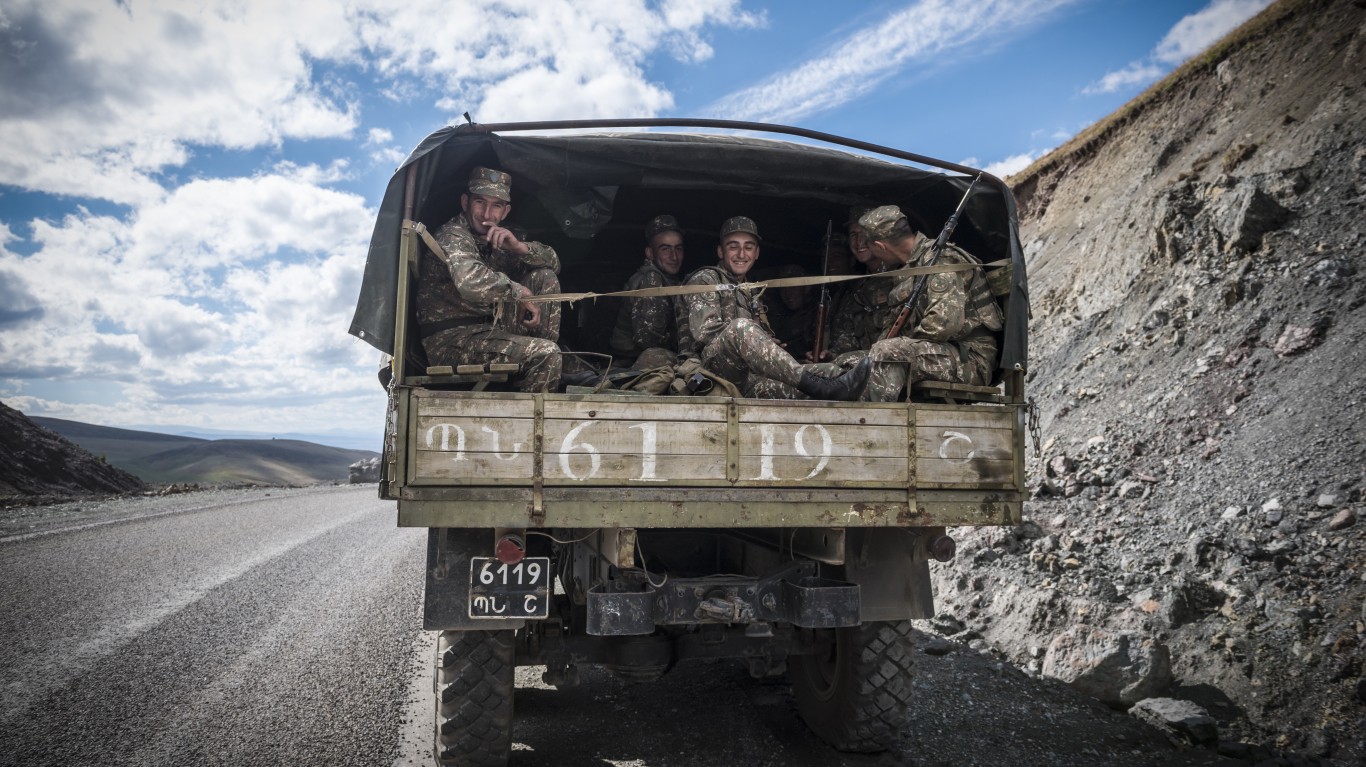
These eleven countries are where the U.S. has committed boots on the ground. But this list does not include other U.S. military operations, like the ones in the central African country of Chad, or the proxy war waged in Ukraine with the $40 billion U.S. military and humanitarian package for that country authorized by 86 members of the Senate. (This is how the U.S. is arming Ukraine.)
The number and length of U.S. military engagements seems to be getting longer and more frequent since the U.S. began its ongoing U.S. global war on terror following the 9/11 terrorist attacks. As one of the world’s few superpowers, the U.S. spends hundreds of billions of dollars funding these operations, providing military support to allied governments, purchasing hardware from the private sector, and keeping ahead of China and Russia. The U.S. committed $782 billion to these efforts in 2022, not including the Ukraine package.
To identify what the U.S. spent on the military the year you were born, 24/7 Wall St. reviewed the data on U.S. military spending from the World Bank, listing the years 1970-2019. Figures are in current U.S. dollars. We also calculated the percentage change in military spending from the previous year.
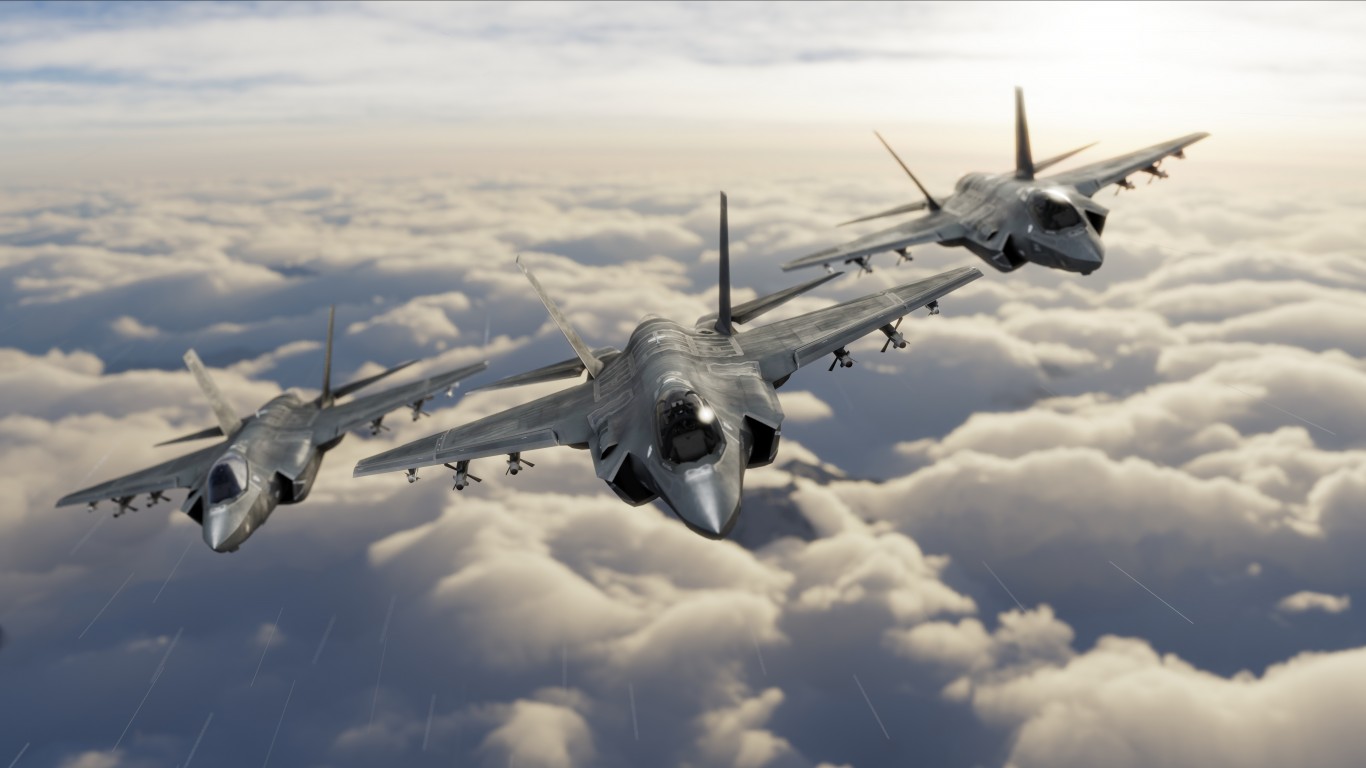
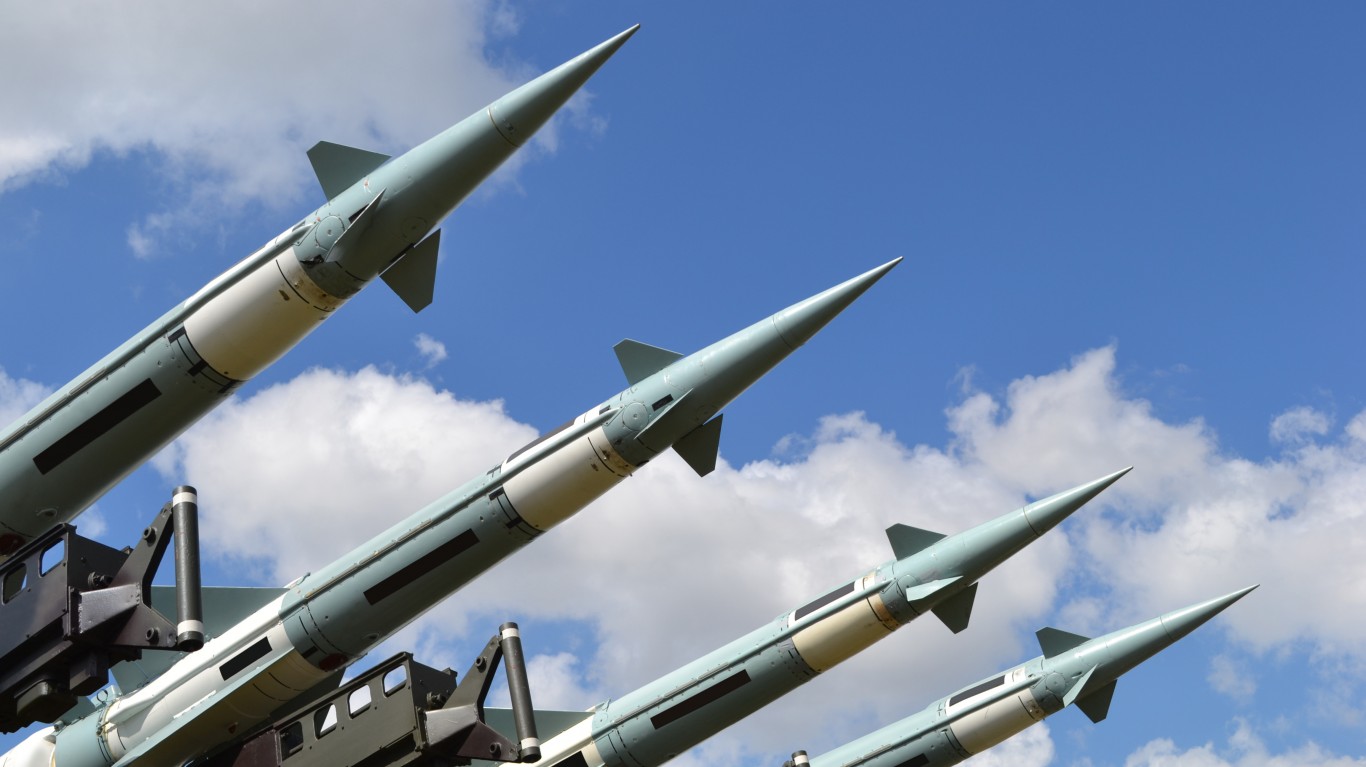
U.S. military spending topped $200 billion for the first time in 1982 and, by the end of the 20th century, that sum was well over $300 billion. Then the military budget took off like a Javelin missile after the start of the U.S. global war on terror. (The U.S. is also among the countries spending the most defending their borders.)
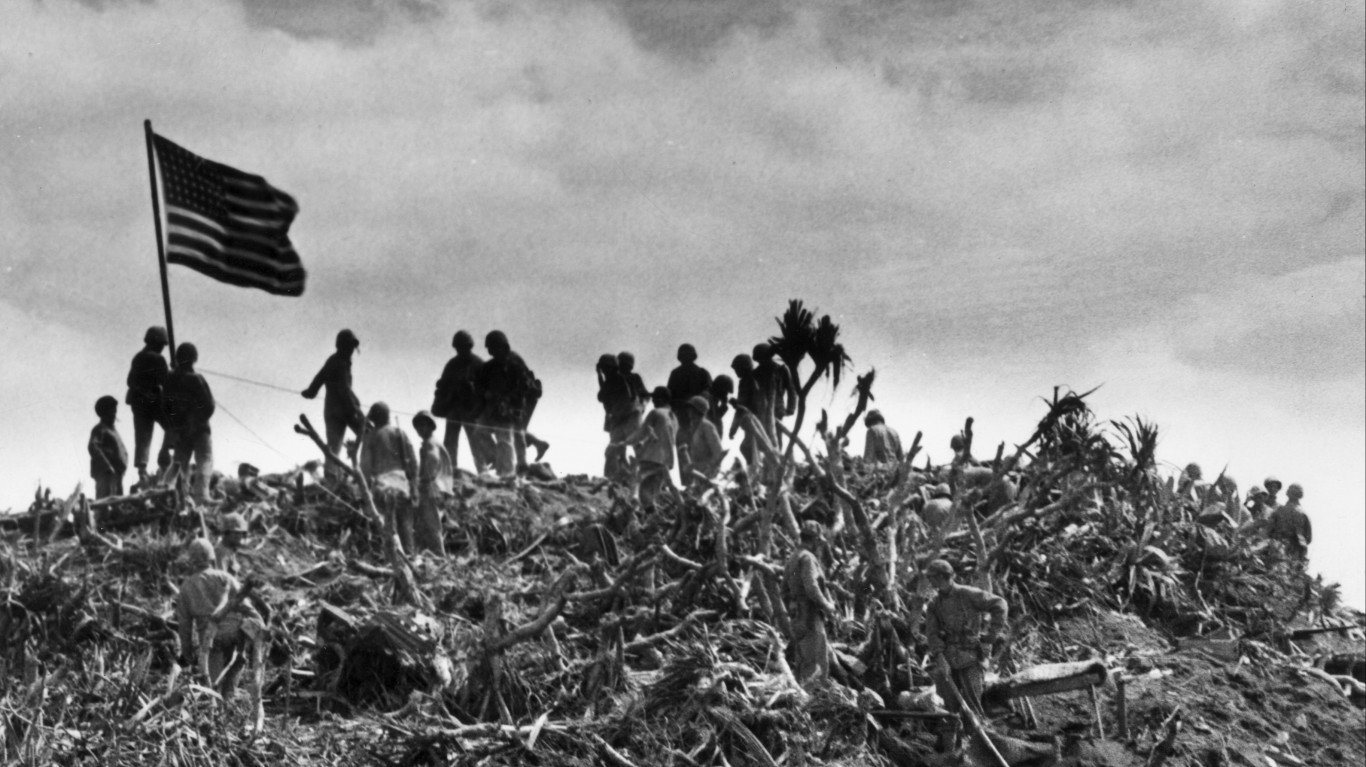
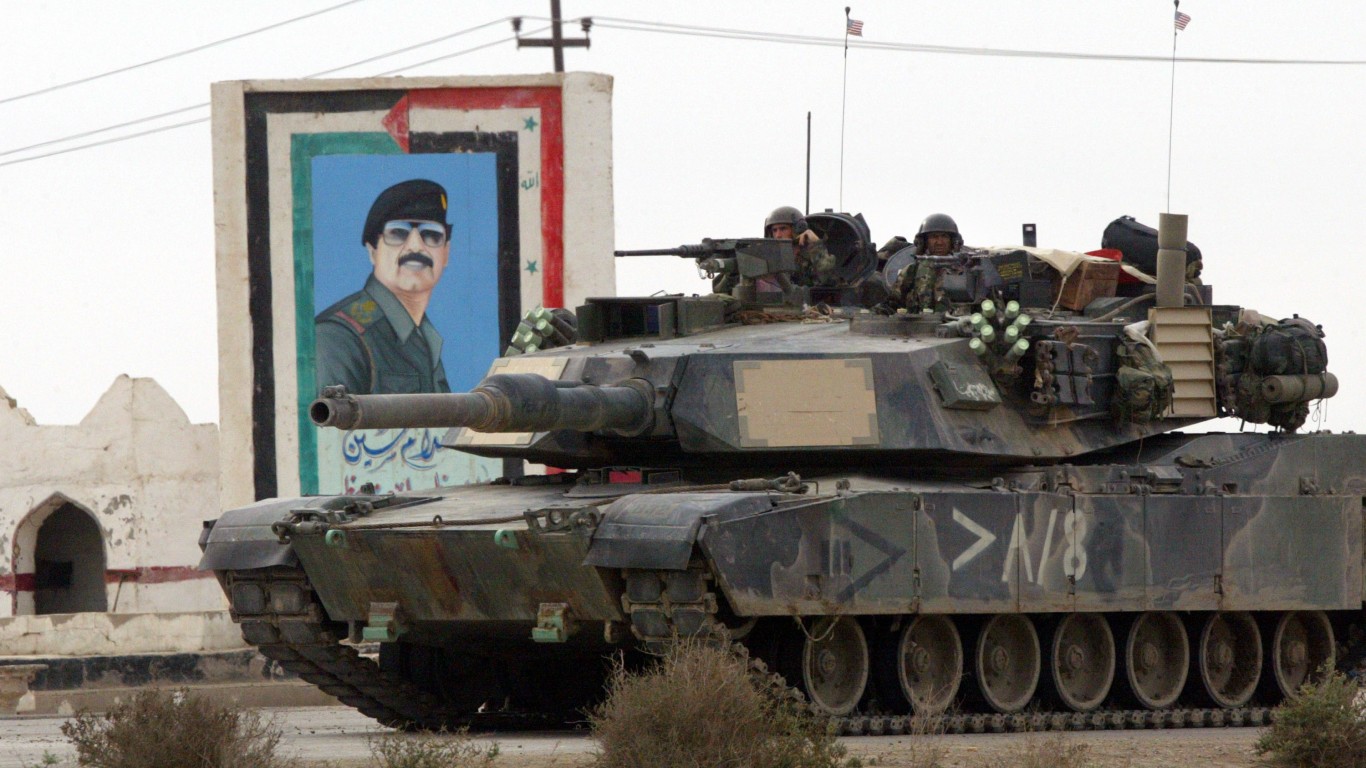
Since 2000, year-to-year U.S. military spending decreased only in the last four years of the Obama administration after the end of the Second Gulf War. In 2003, the military budget jumped by 16% compared to the previous year, the highest annual increase since 1982, which was during the Cold War between the U.S. and the Soviet Union.
Here is U.S. military spending every year since 1970
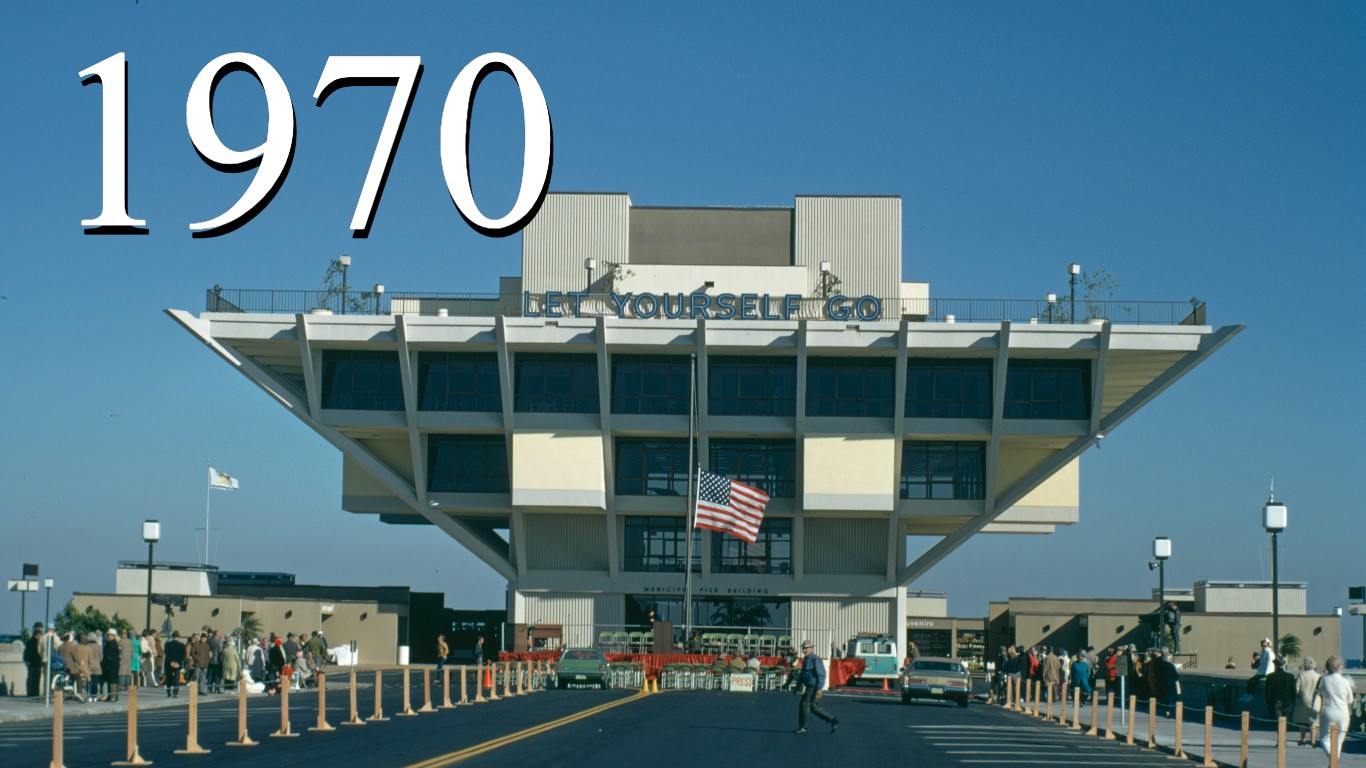
1970: $83.41 billion
> Increase from previous year: -1.86% — #40 largest Increase on list
[in-text-ad]
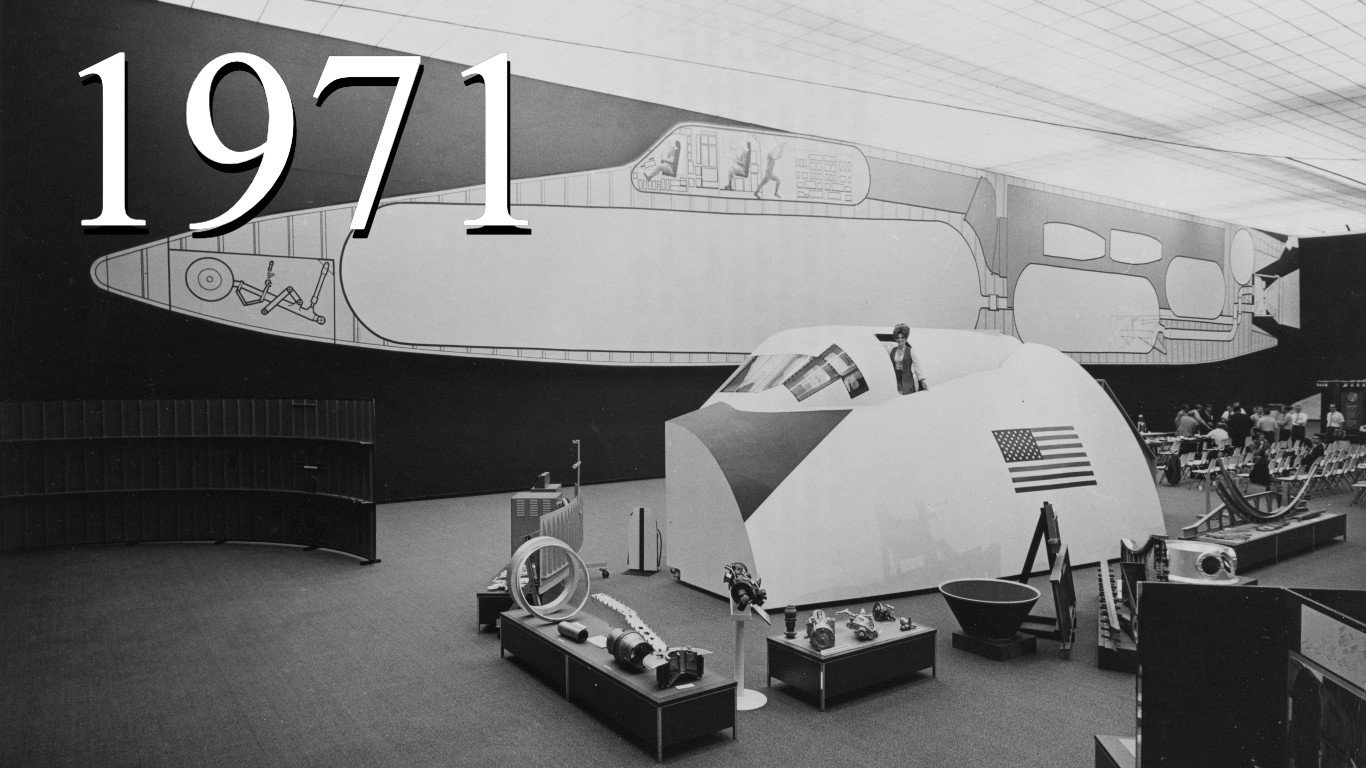
1971: $78.24 billion
> Increase from previous year: -6.20% — #48 largest Increase on list
[recirclink id=1119208]
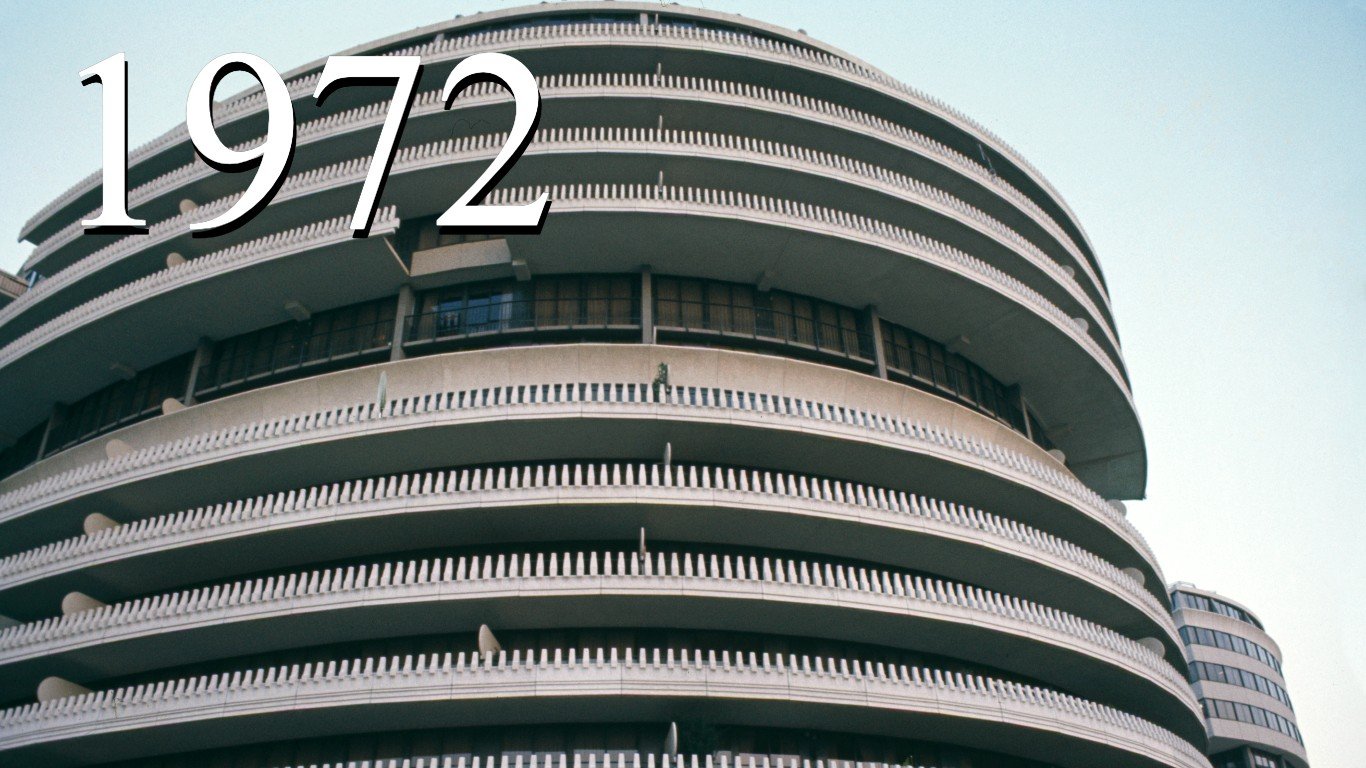
1972: $80.71 billion
> Increase from previous year: 3.16% — #26 largest Increase on list
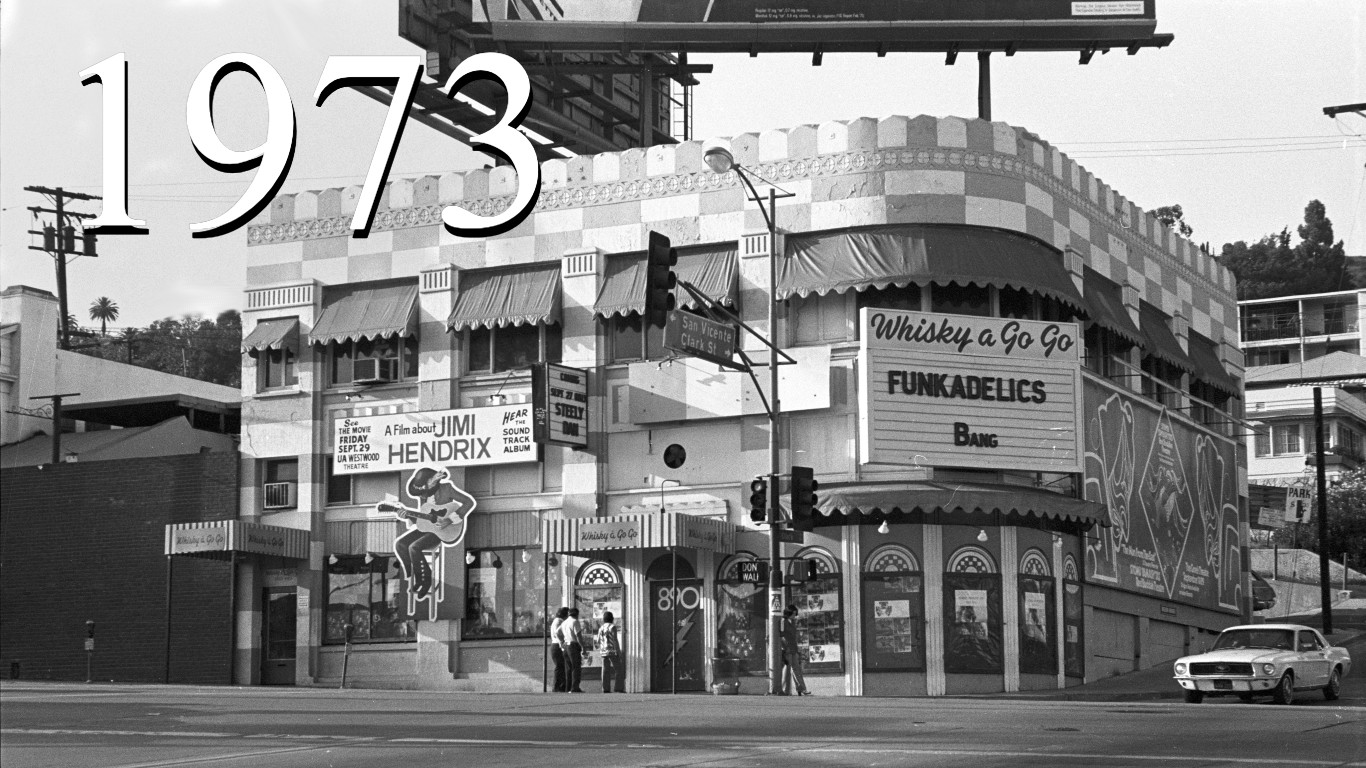
1973: $81.47 billion
> Increase from previous year: 0.94% — #37 largest Increase on list
[in-text-ad-2]
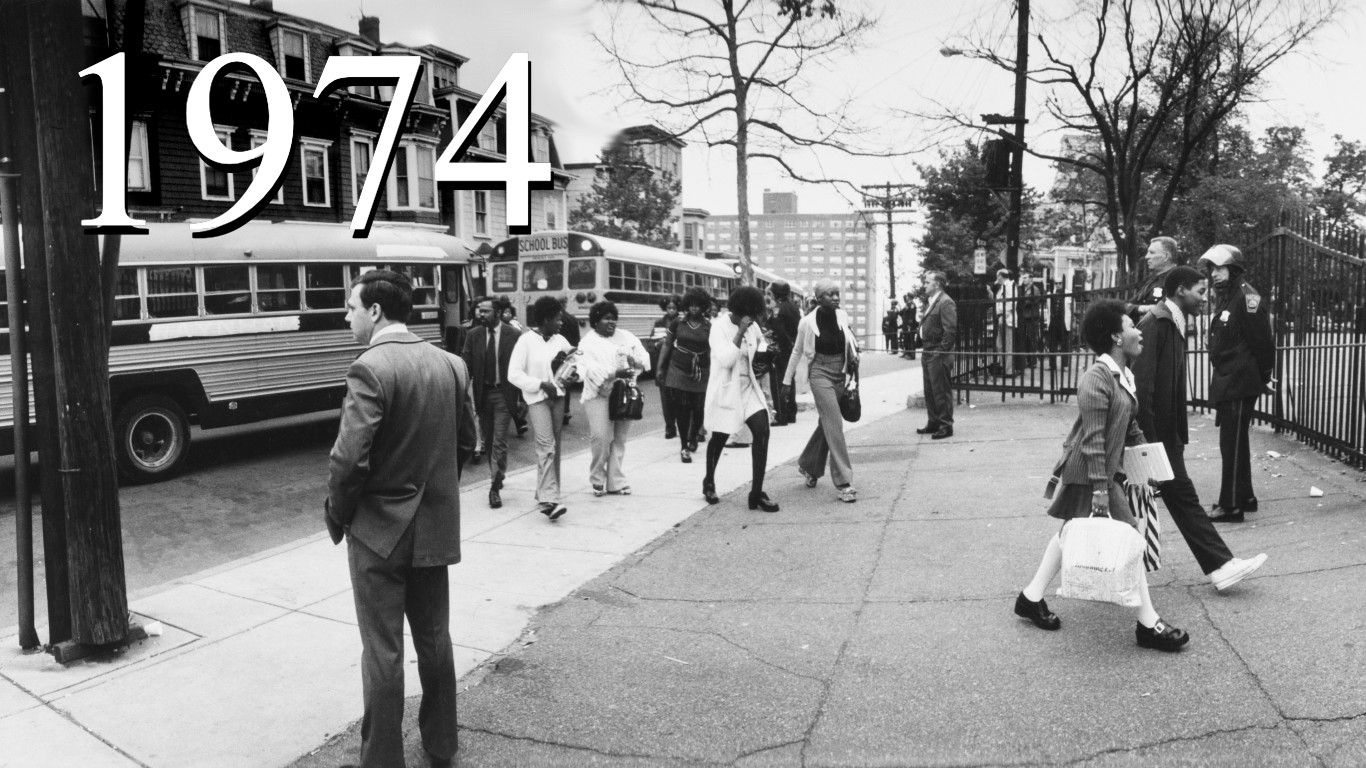
1974: $89.28 billion
> Increase from previous year: 9.59% — #12 largest Increase on list
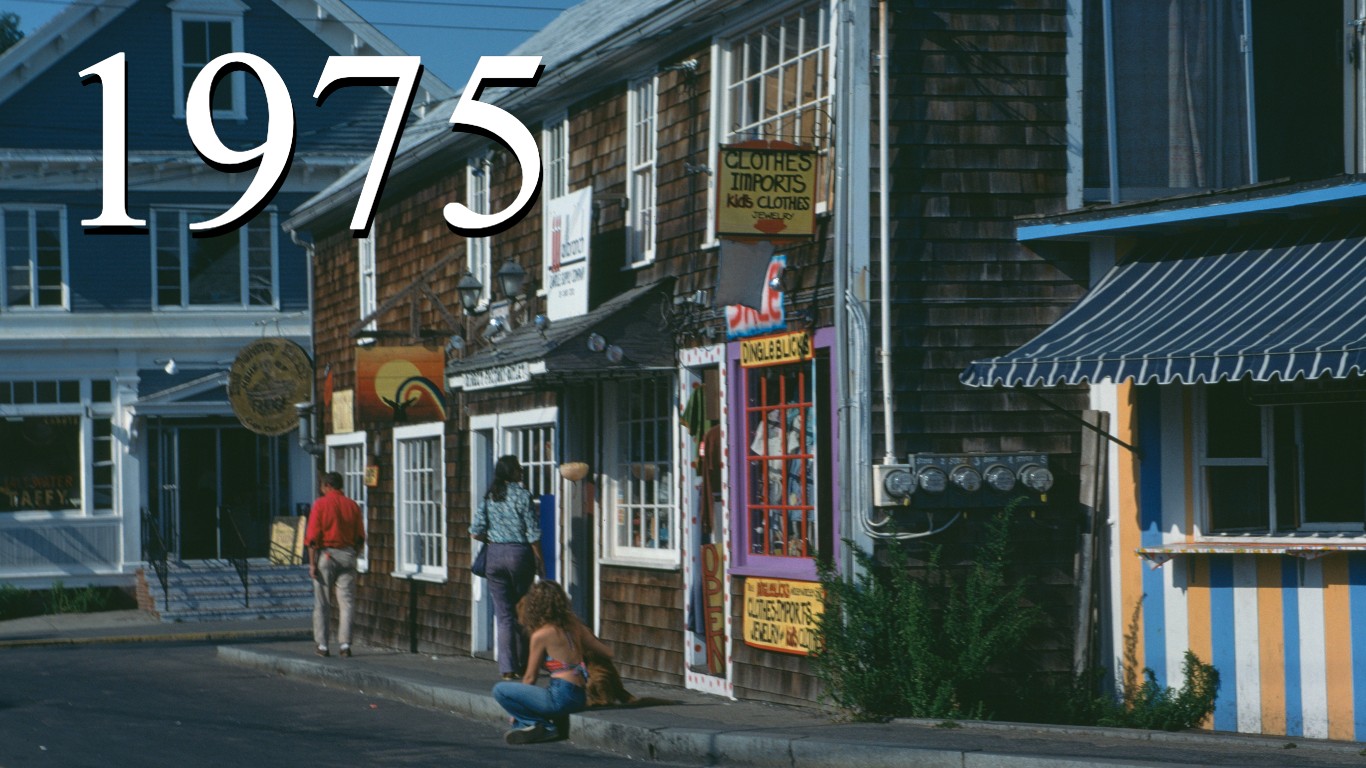
1975: $92.08 billion
> Increase from previous year: 3.14% — #27 largest Increase on list
[in-text-ad]
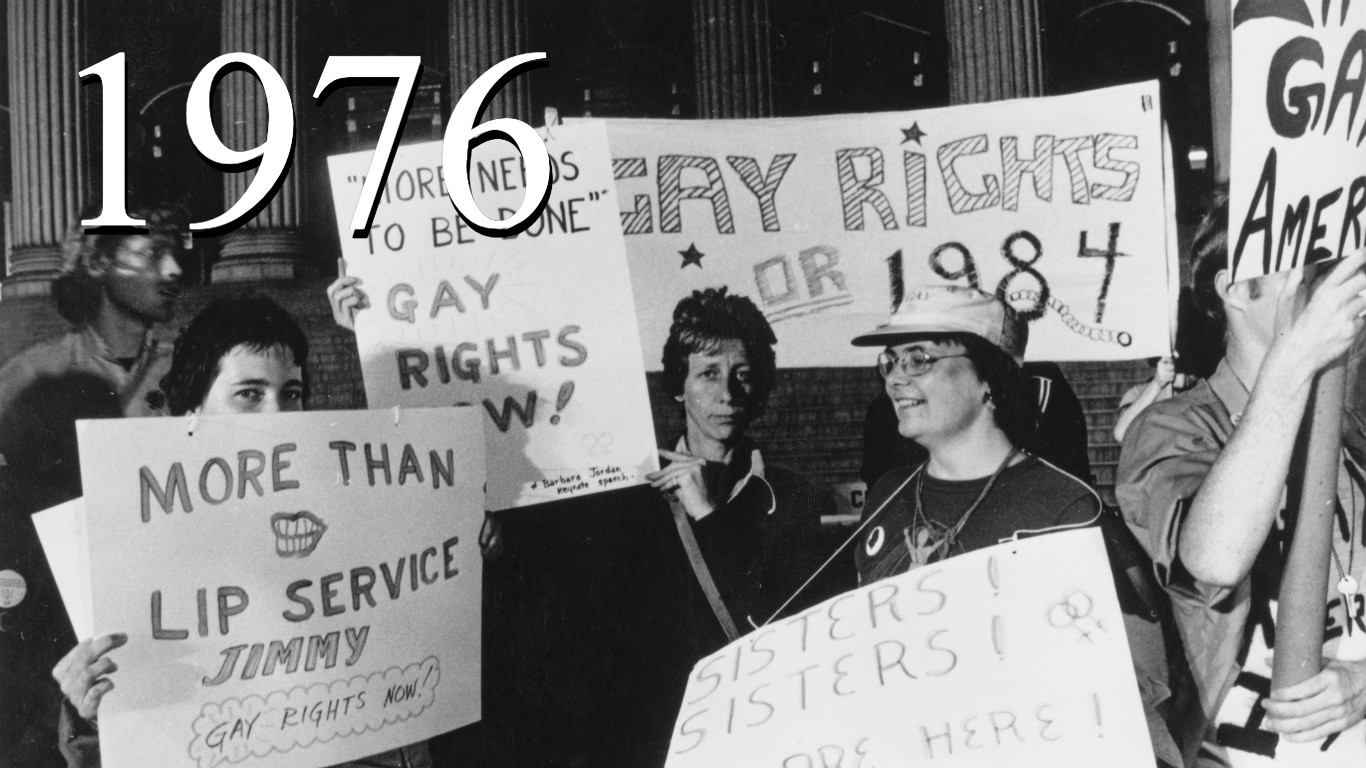
1976: $94.72 billion
> Increase from previous year: 2.87% — #29 largest Increase on list
[recirclink id=1108564]
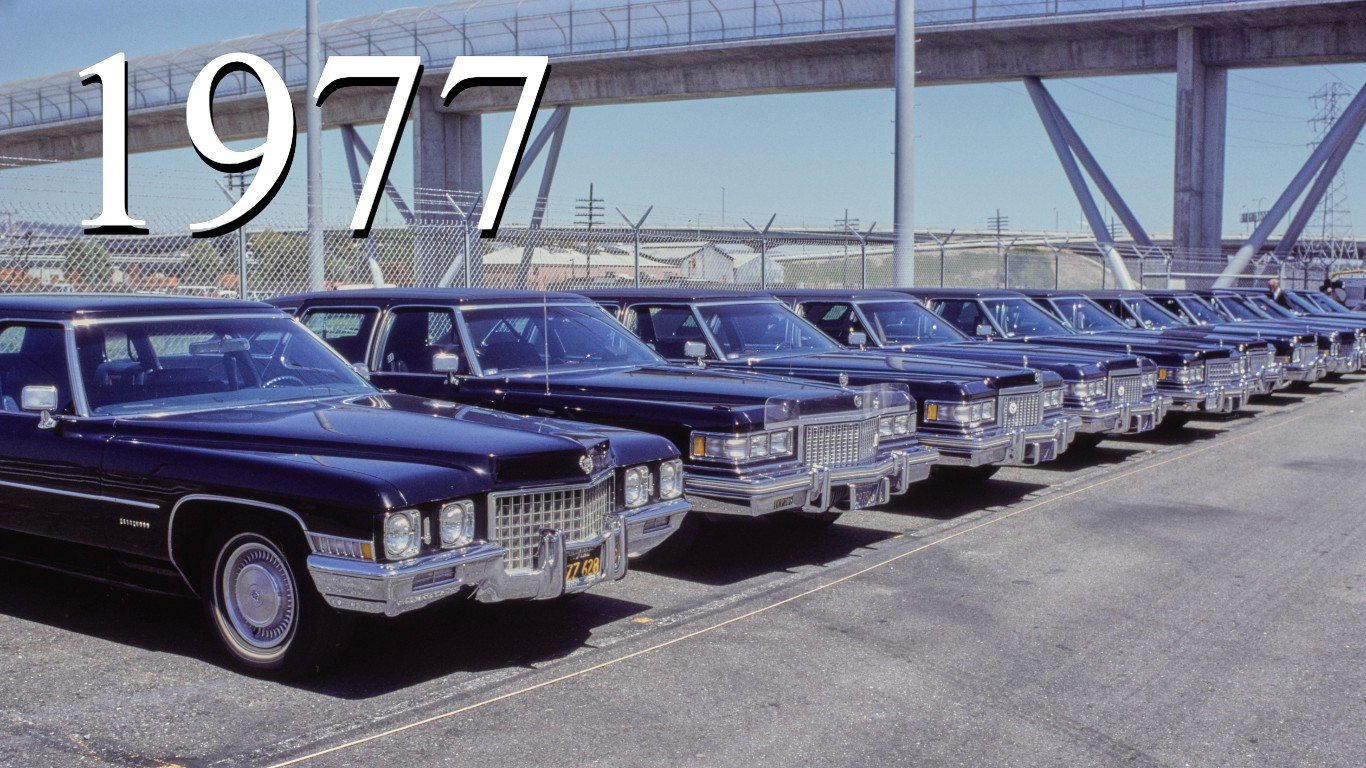
1977: $104.67 billion
> Increase from previous year: 10.50% — #10 largest Increase on list
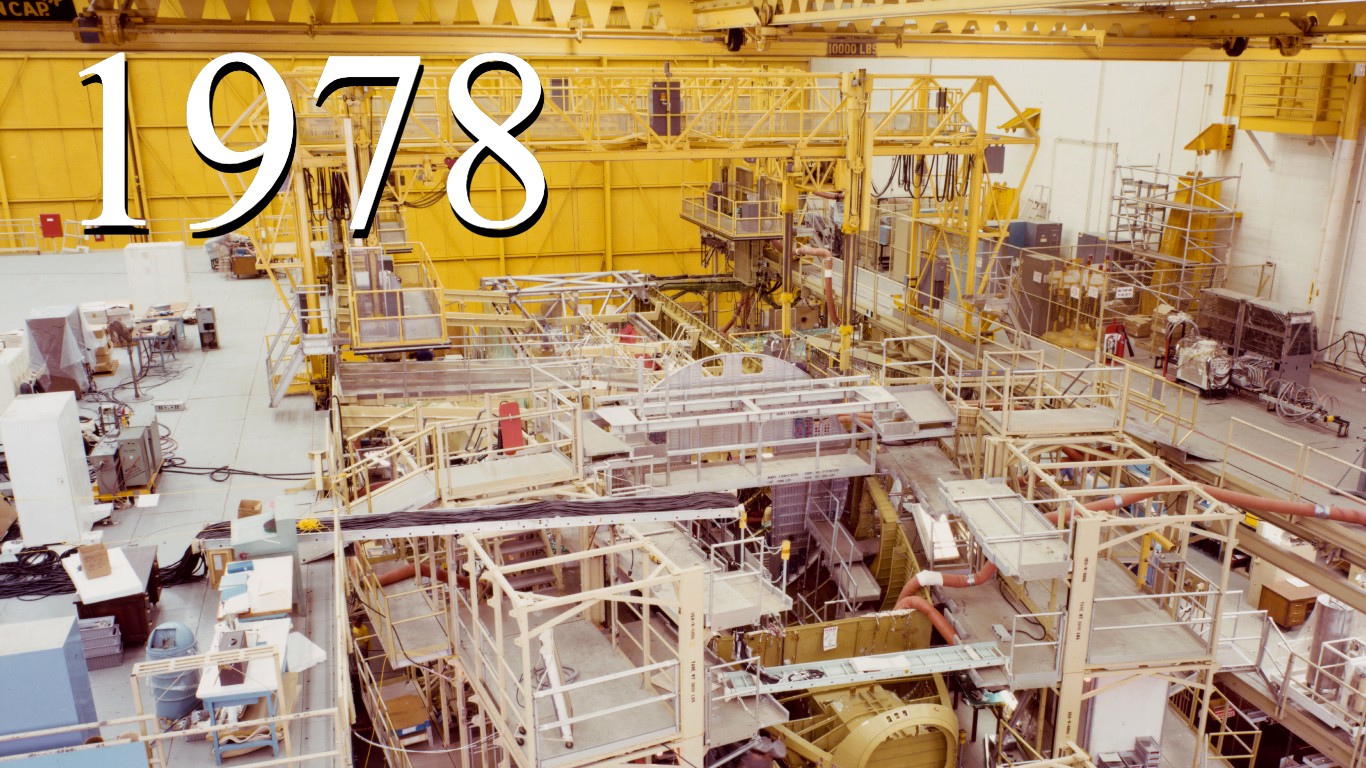
1978: $113.38 billion
> Increase from previous year: 8.32% — #15 largest Increase on list
[in-text-ad-2]

1979: $126.88 billion
> Increase from previous year: 11.91% — #7 largest Increase on list
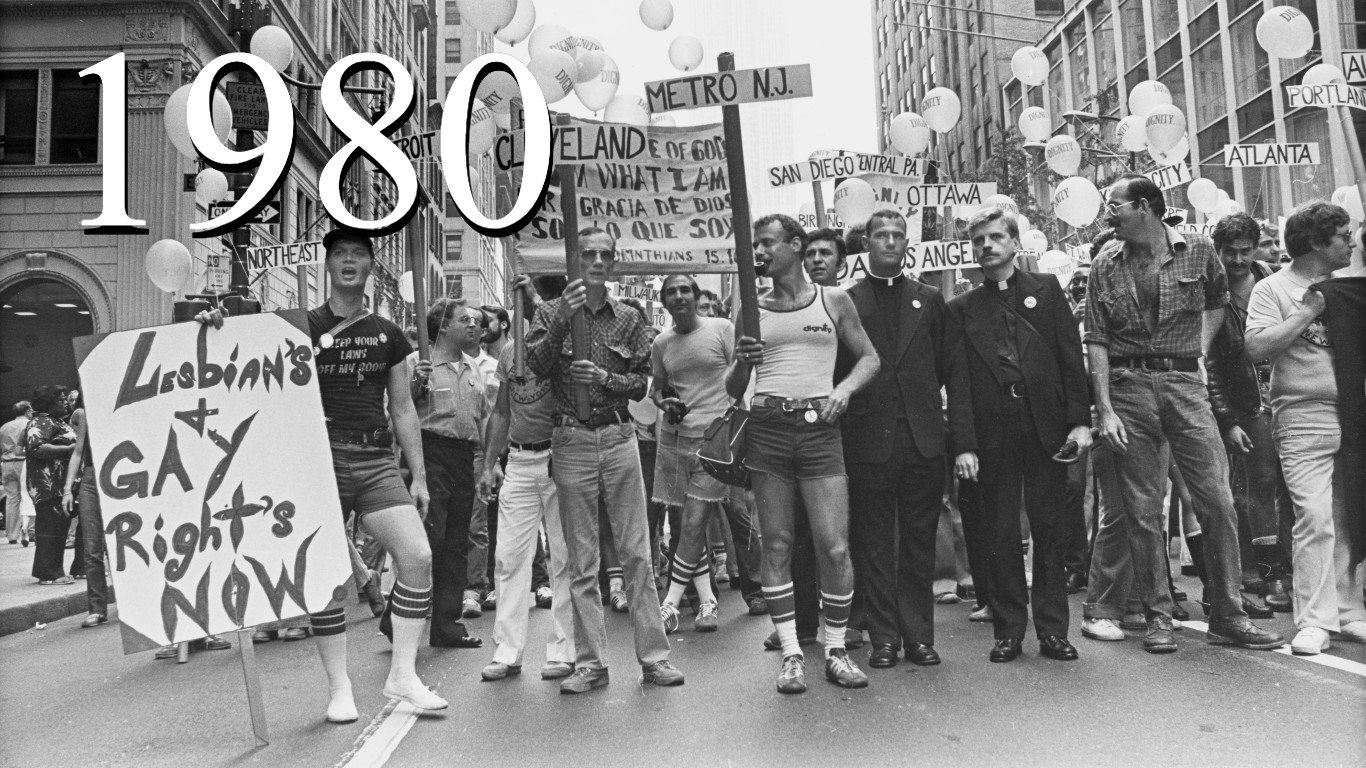
1980: $143.69 billion
> Increase from previous year: 13.25% — #5 largest Increase on list
[in-text-ad]
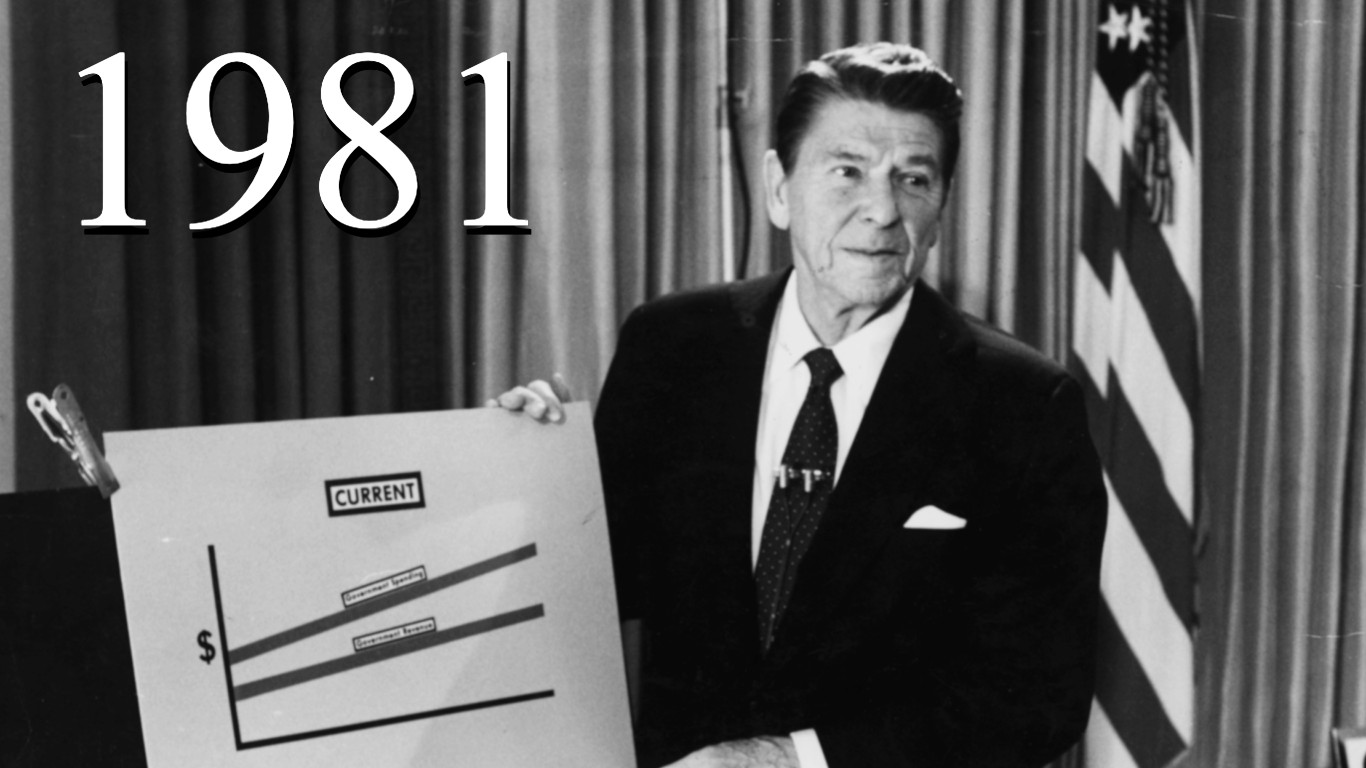
1981: $176.56 billion
> Increase from previous year: 22.88% — #2 largest Increase on list
[recirclink id=1105650]
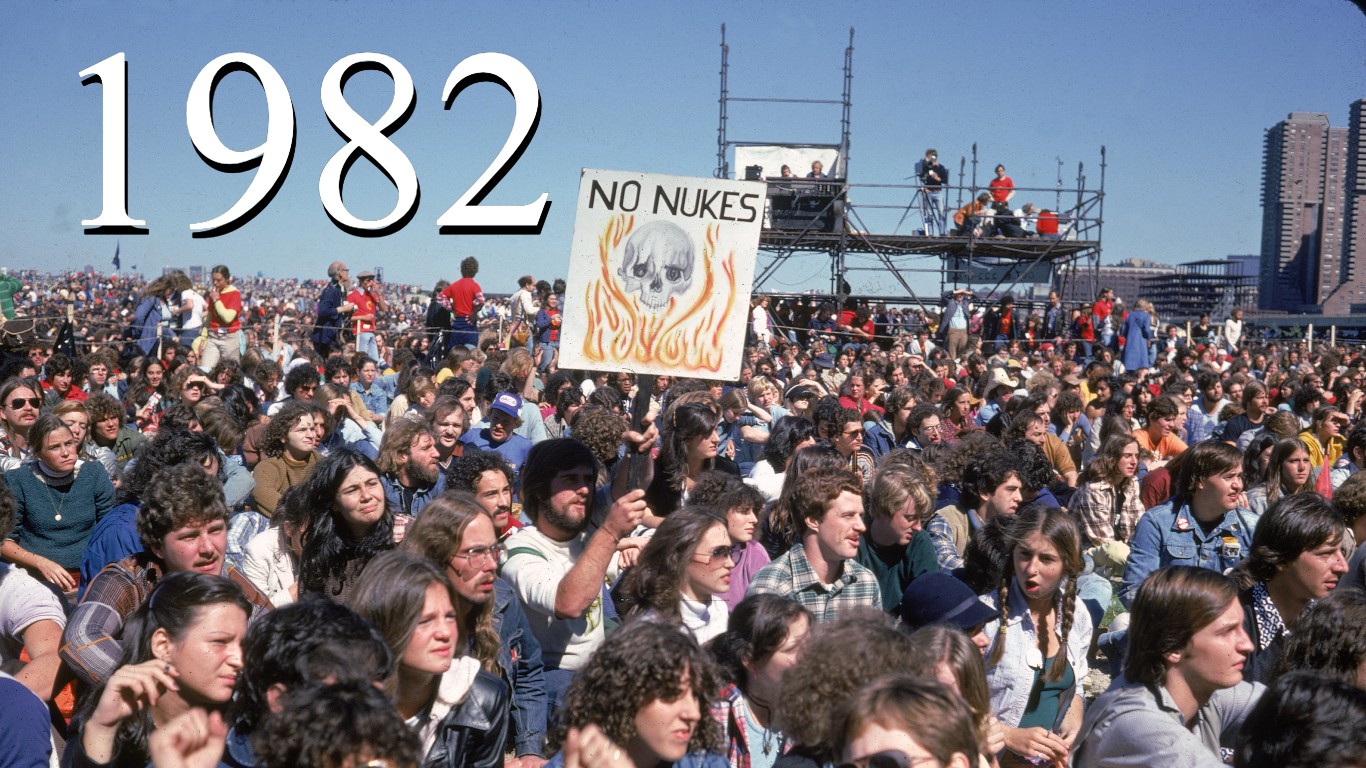
1982: $221.67 billion
> Increase from previous year: 25.55% — #1 largest Increase on list
1983: $223.43 billion
> Increase from previous year: 0.79% — #38 largest Increase on list
[in-text-ad-2]
1984: $245.15 billion
> Increase from previous year: 9.72% — #11 largest Increase on list
1985: $272.16 billion
> Increase from previous year: 11.02% — #9 largest Increase on list
[in-text-ad]
1986: $295.55 billion
> Increase from previous year: 8.59% — #13 largest Increase on list
[recirclink id=1097843]
1987: $304.09 billion
> Increase from previous year: 2.89% — #28 largest Increase on list
1988: $309.66 billion
> Increase from previous year: 1.83% — #32 largest Increase on list
[in-text-ad-2]
1989: $321.87 billion
> Increase from previous year: 3.94% — #24 largest Increase on list
1990: $325.13 billion
> Increase from previous year: 1.01% — #35 largest Increase on list
[in-text-ad]
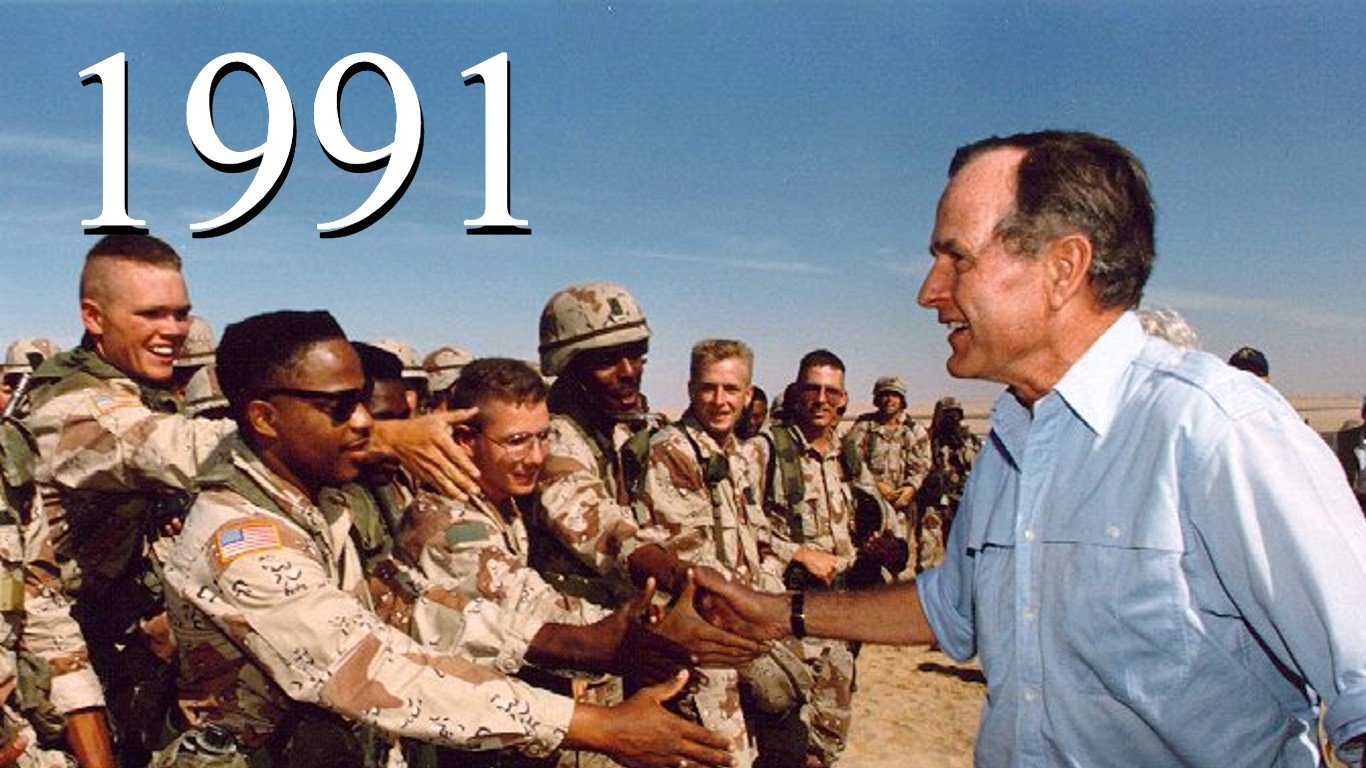
1991: $299.37 billion
> Increase from previous year: -7.92% — #50 largest Increase on list
[recirclink id=1097406]
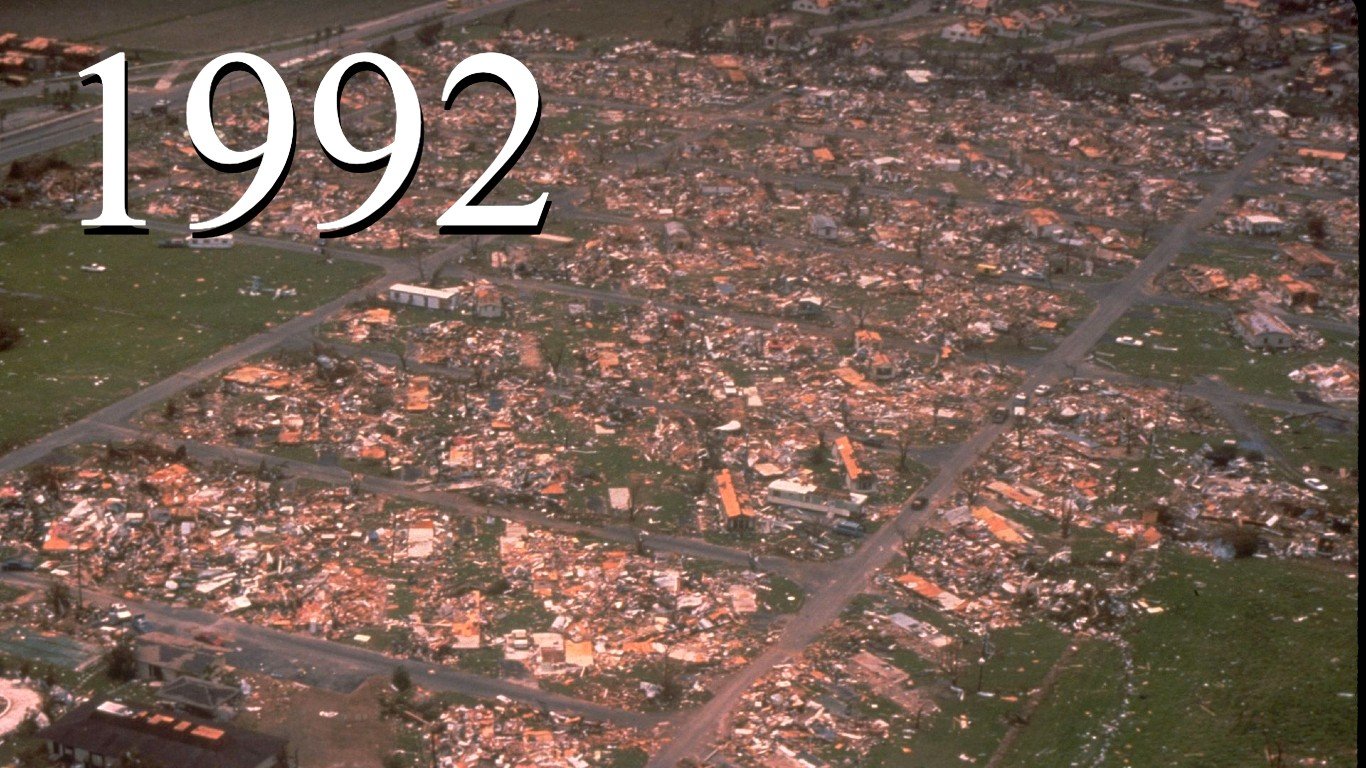
1992: $325.03 billion
> Increase from previous year: 8.57% — #14 largest Increase on list
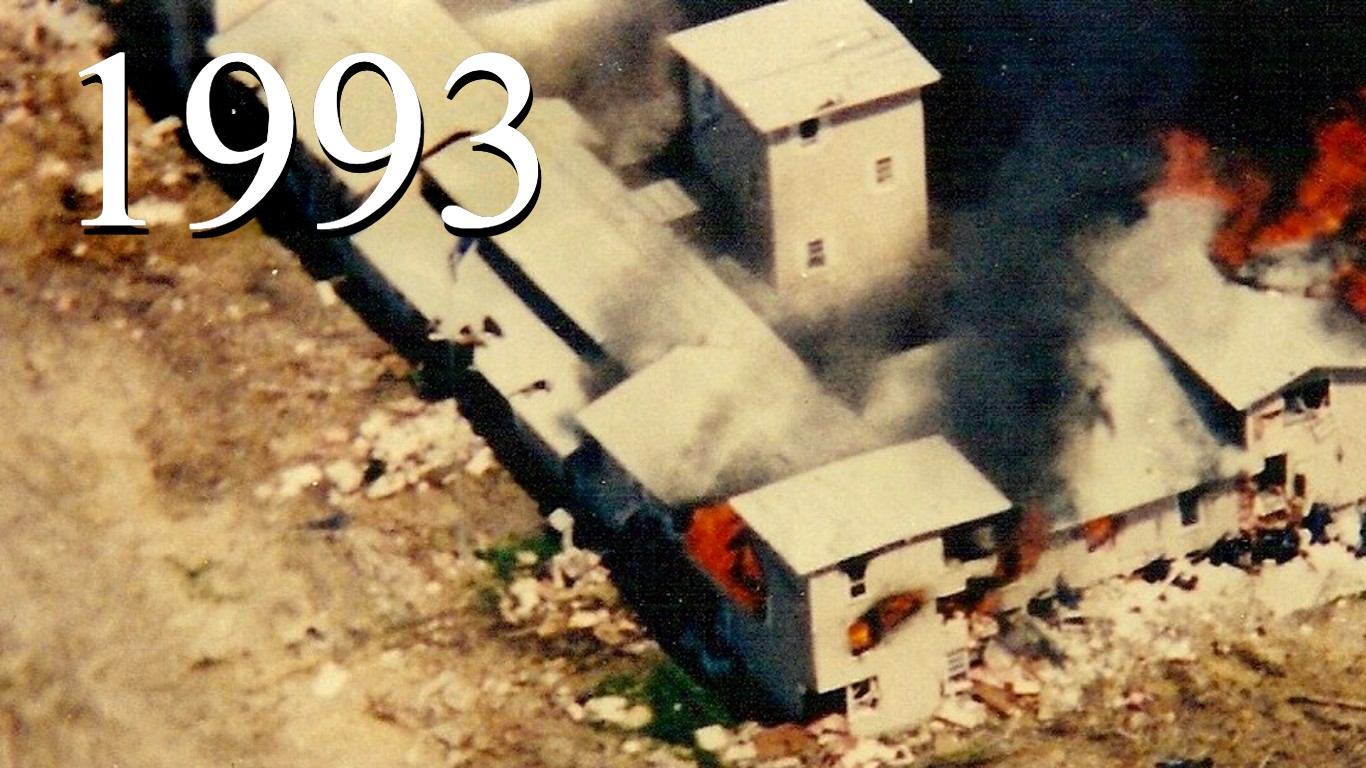
1993: $316.72 billion
> Increase from previous year: -2.56% — #42 largest Increase on list
[in-text-ad-2]

1994: $308.08 billion
> Increase from previous year: -2.73% — #44 largest Increase on list
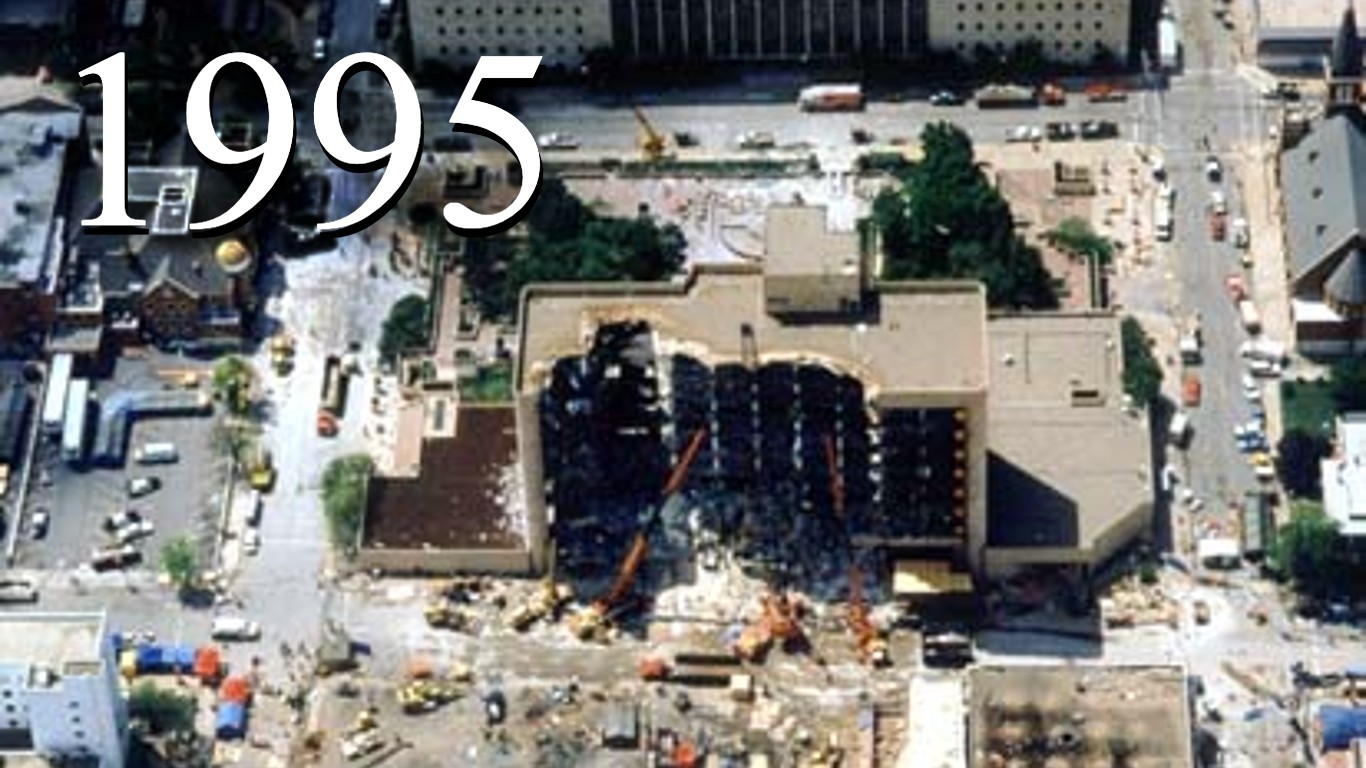
1995: $295.85 billion
> Increase from previous year: -3.97% — #46 largest Increase on list
[in-text-ad]
1996: $287.96 billion
> Increase from previous year: -2.67% — #43 largest Increase on list
[recirclink id=1119208]
1997: $293.17 billion
> Increase from previous year: 1.81% — #33 largest Increase on list
1998: $291.00 billion
> Increase from previous year: -0.74% — #39 largest Increase on list
[in-text-ad-2]
1999: $298.09 billion
> Increase from previous year: 2.44% — #30 largest Increase on list
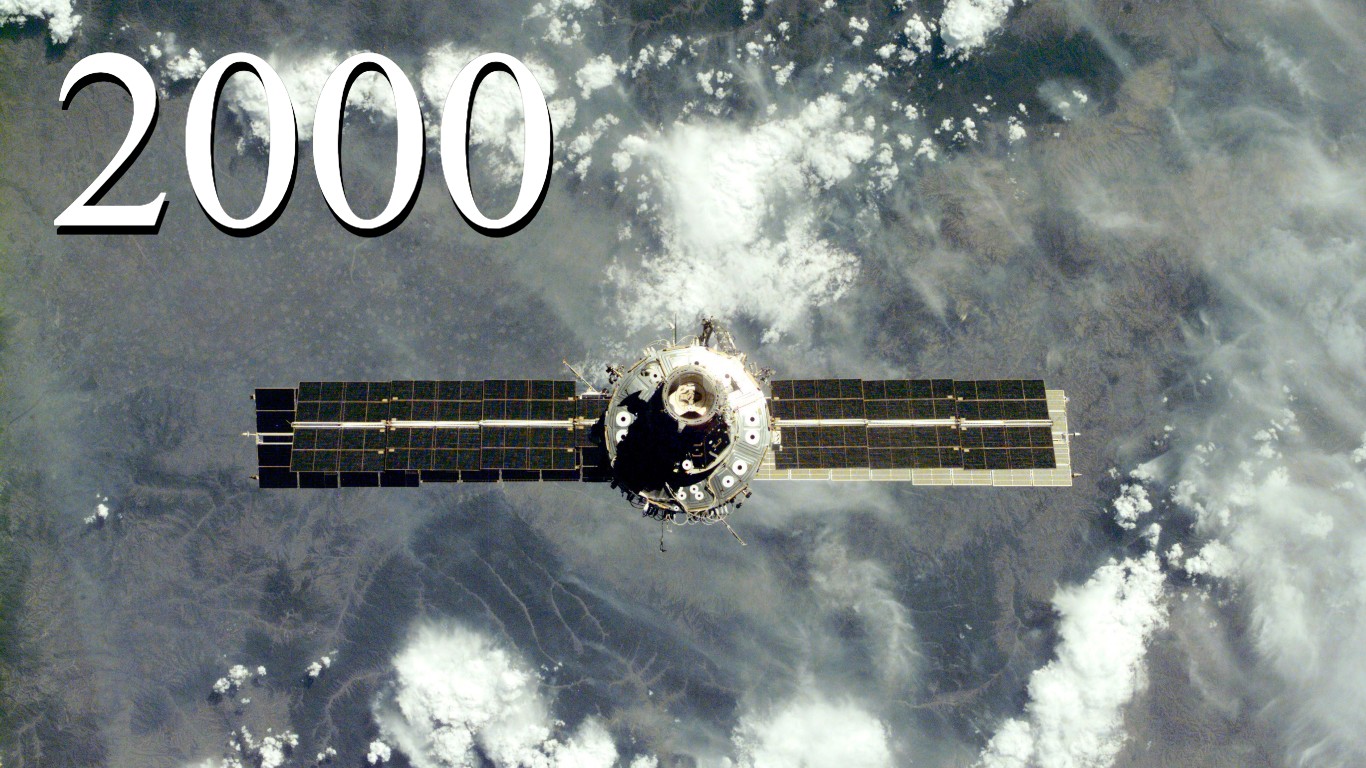
2000: $320.09 billion
> Increase from previous year: 7.38% — #18 largest Increase on list
[in-text-ad]
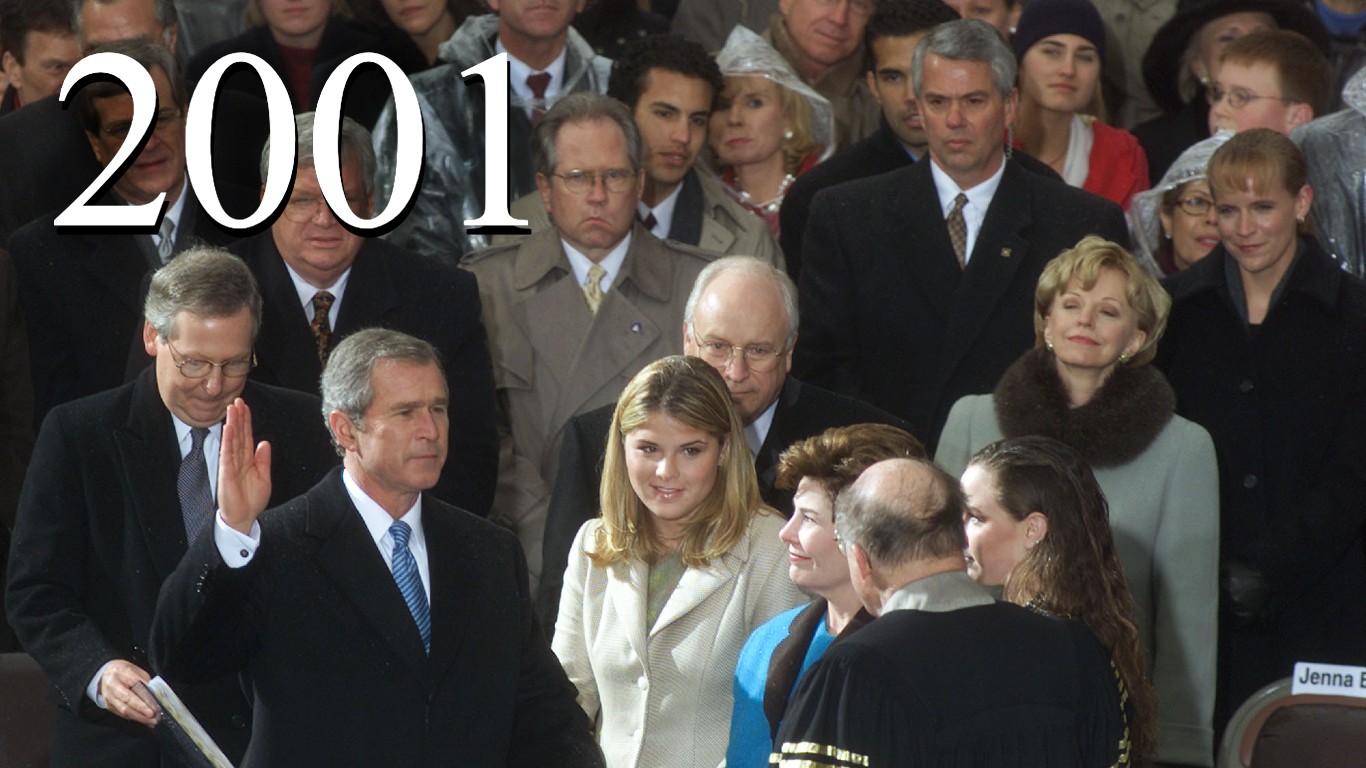
2001: $331.81 billion
> Increase from previous year: 3.66% — #25 largest Increase on list
[recirclink id=1108564]
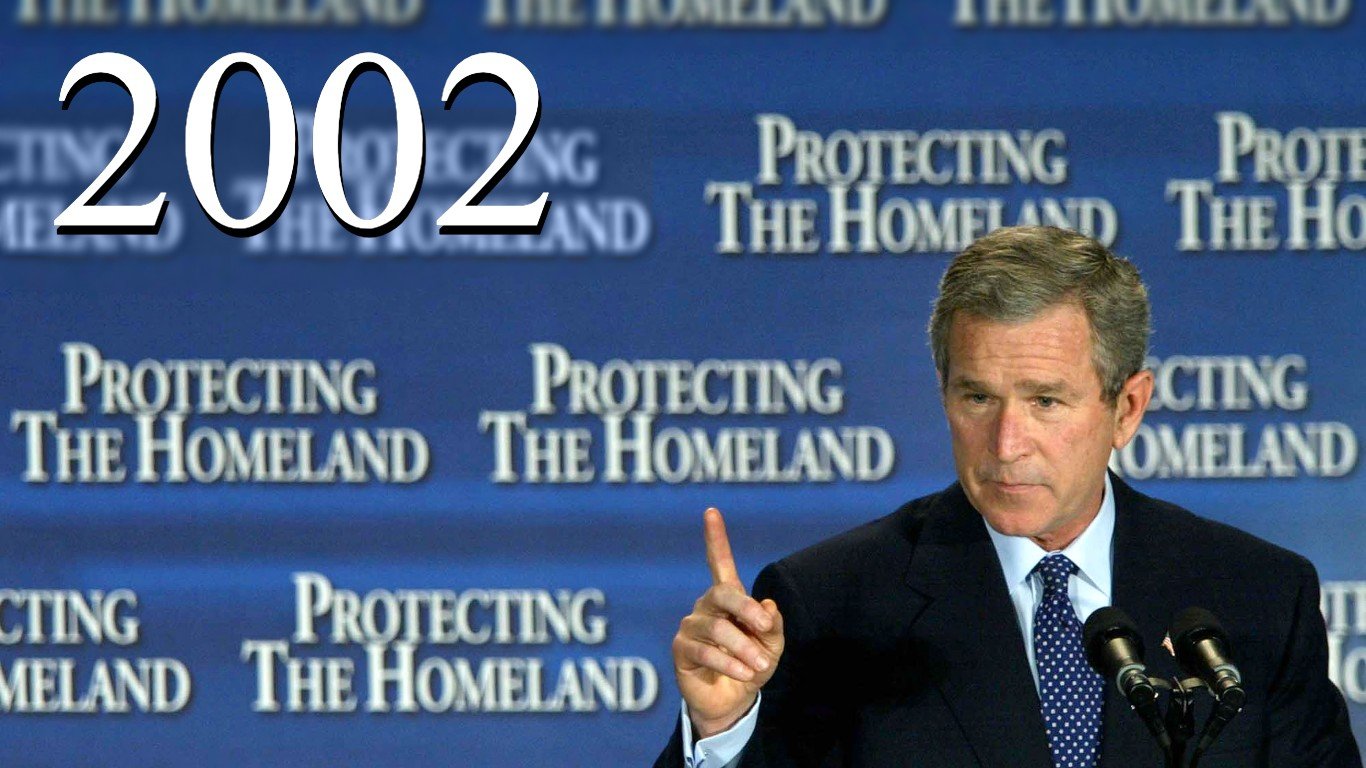
2002: $378.46 billion
> Increase from previous year: 14.06% — #4 largest Increase on list
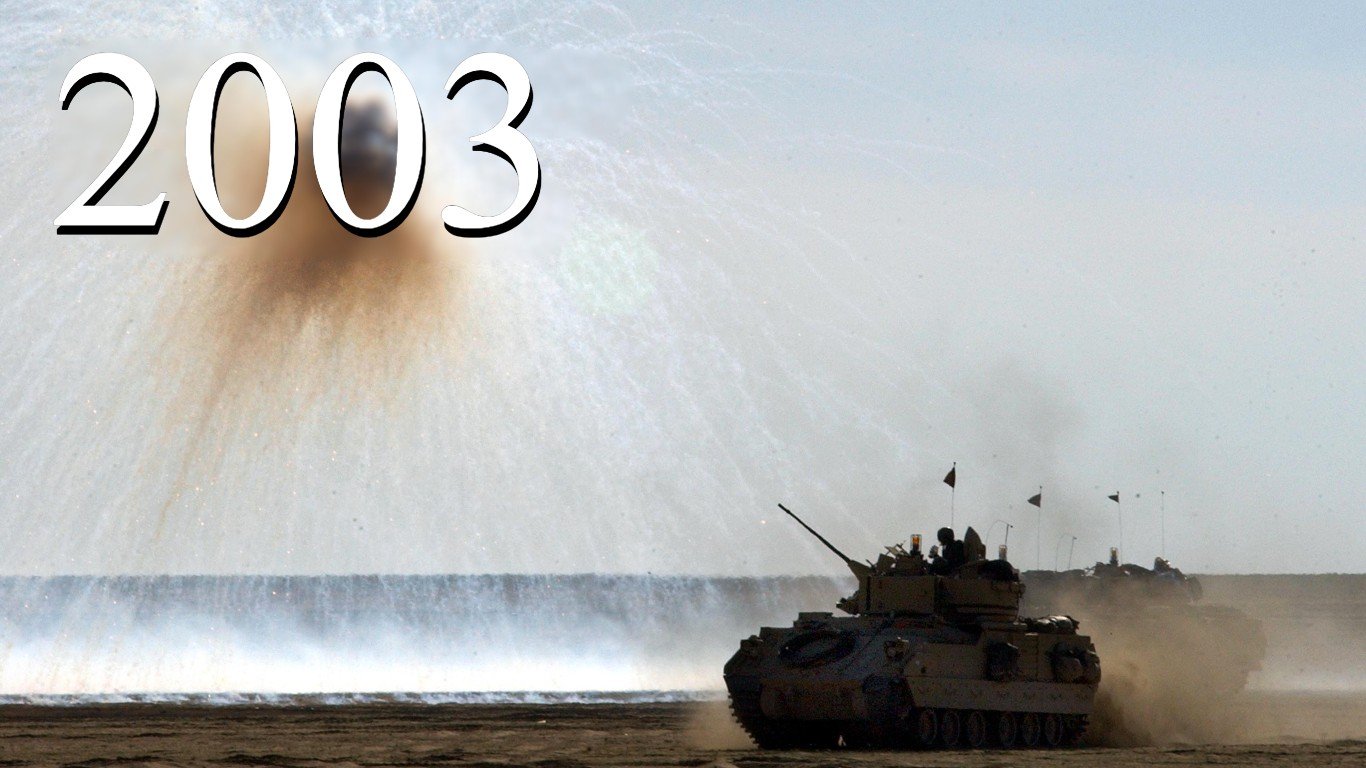
2003: $440.53 billion
> Increase from previous year: 16.40% — #3 largest Increase on list
[in-text-ad-2]
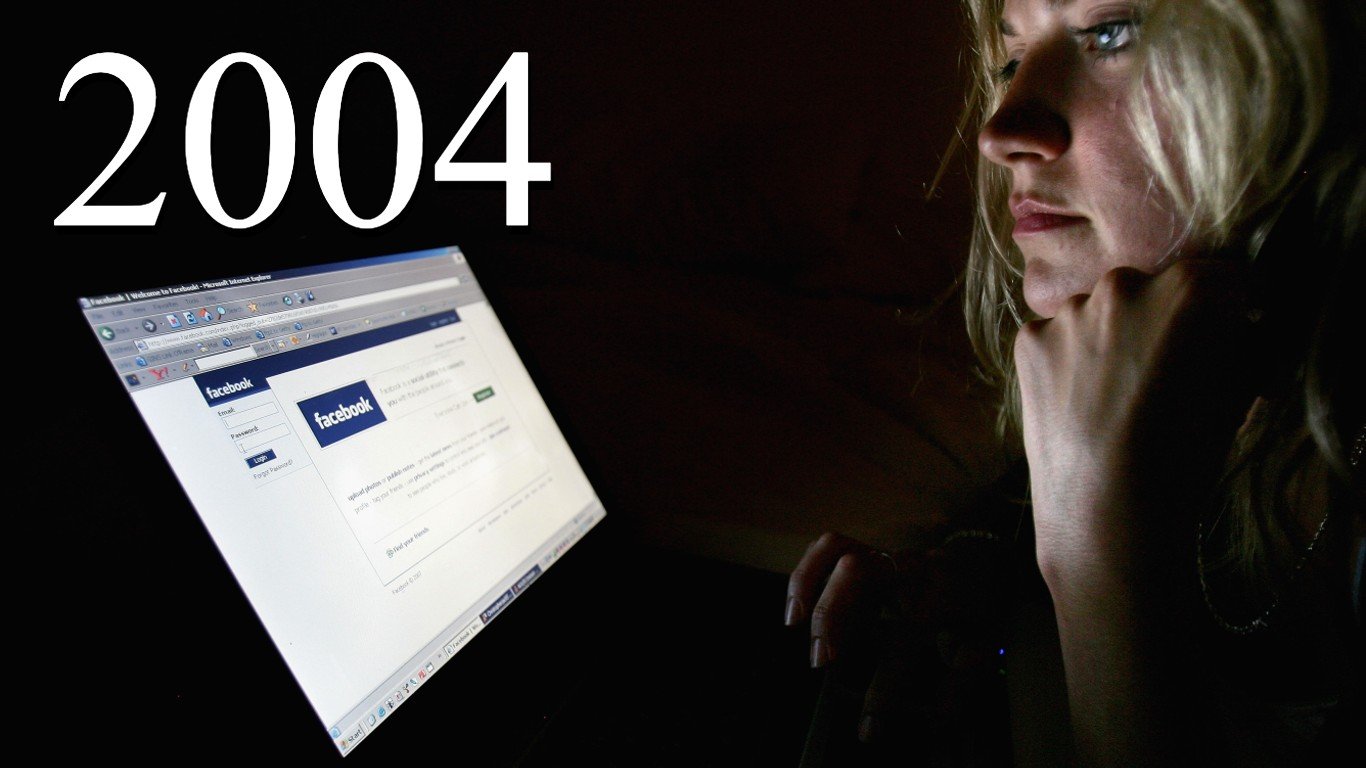
2004: $493.00 billion
> Increase from previous year: 11.91% — #6 largest Increase on list
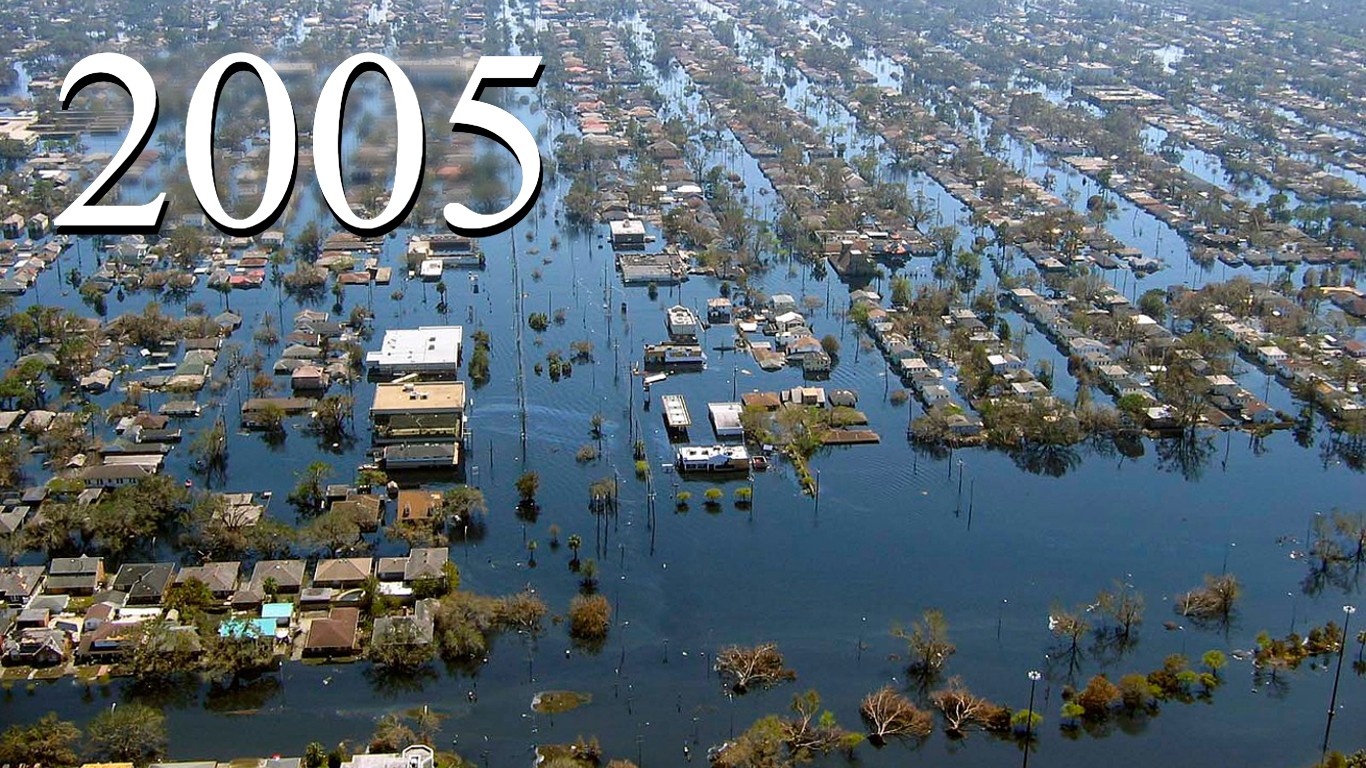
2005: $533.20 billion
> Increase from previous year: 8.15% — #16 largest Increase on list
[in-text-ad]
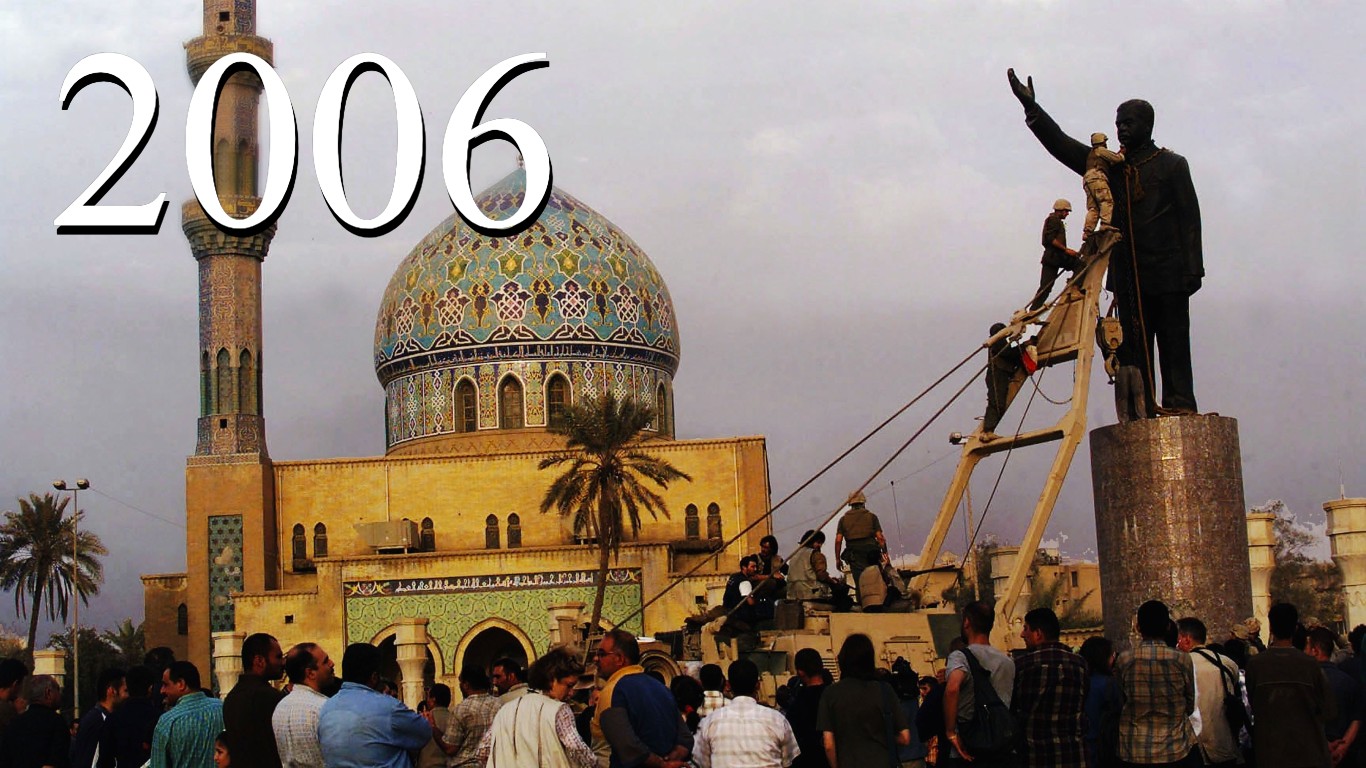
2006: $558.34 billion
> Increase from previous year: 4.71% — #22 largest Increase on list
[recirclink id=1105650]
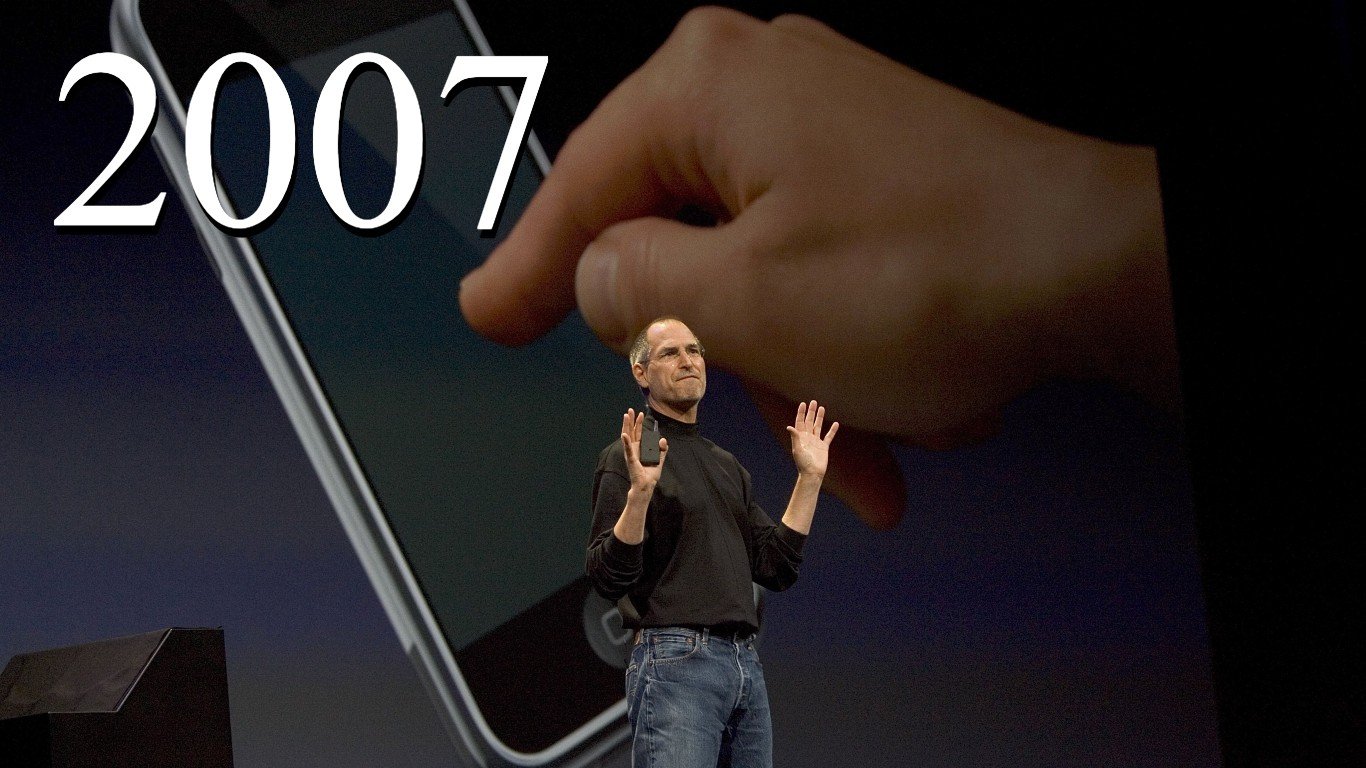
2007: $589.59 billion
> Increase from previous year: 5.60% — #20 largest Increase on list
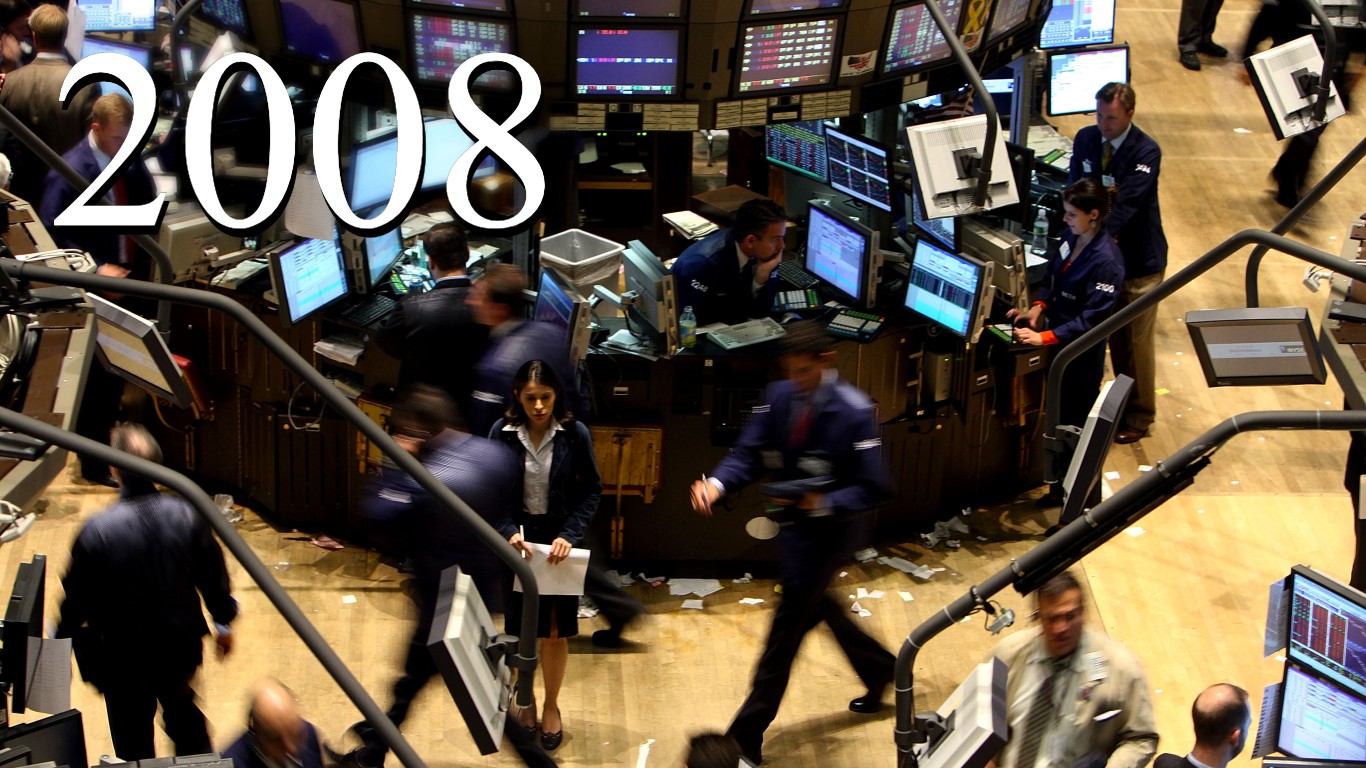
2008: $656.76 billion
> Increase from previous year: 11.39% — #8 largest Increase on list
[in-text-ad-2]
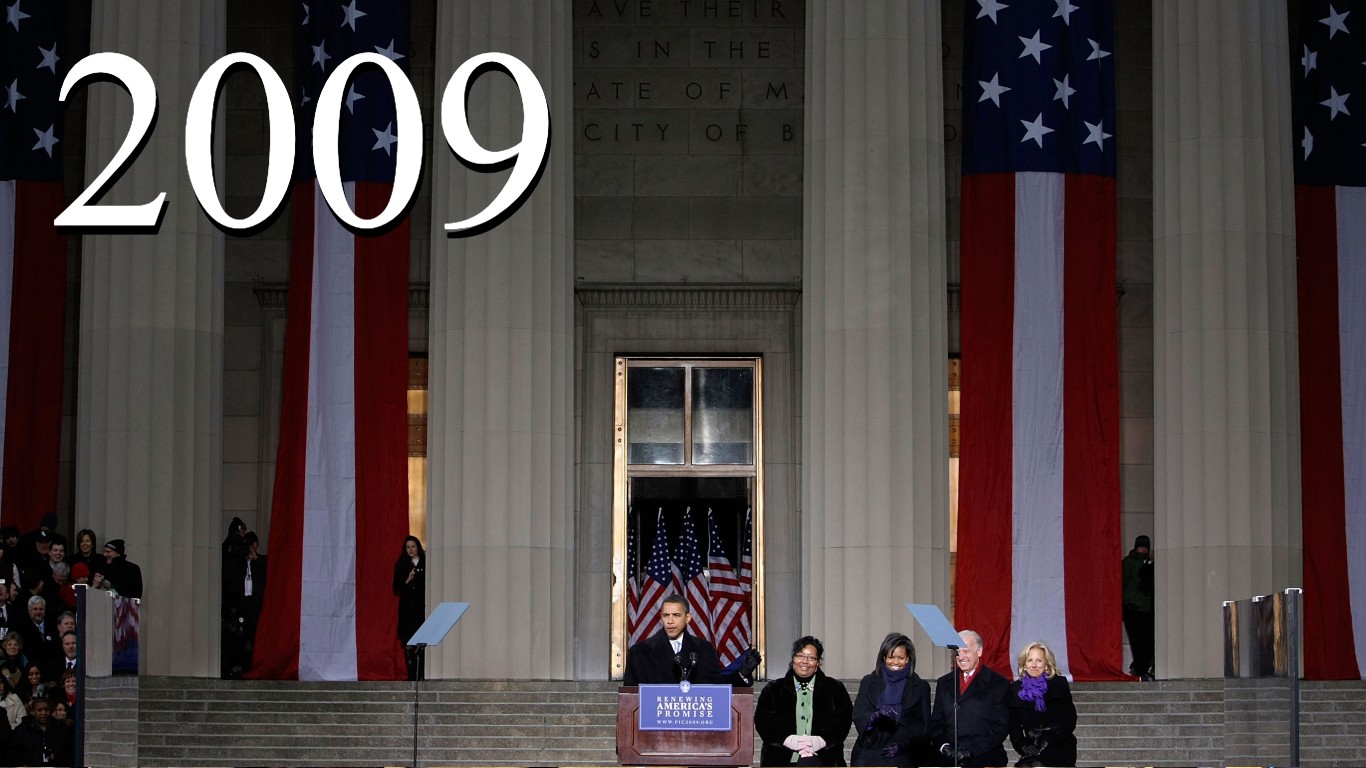
2009: $705.92 billion
> Increase from previous year: 7.49% — #17 largest Increase on list
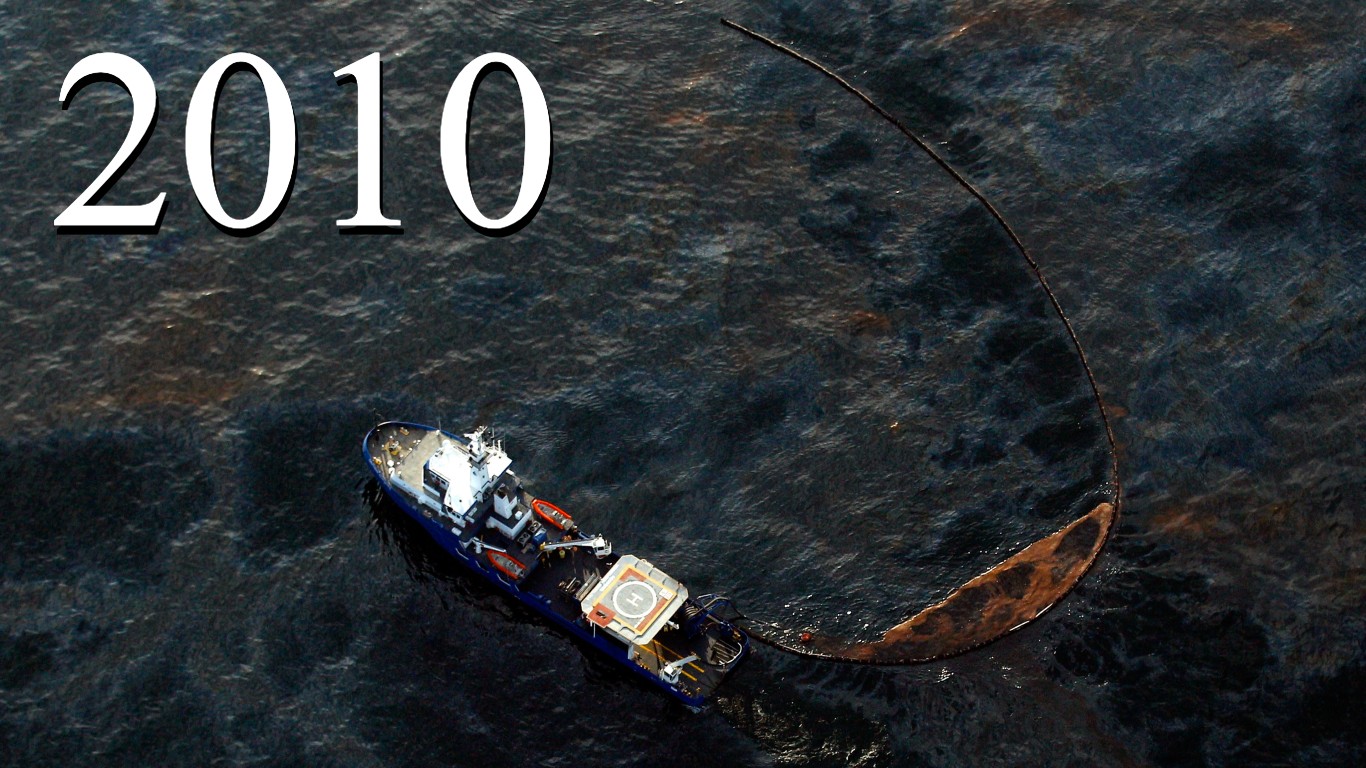
2010: $738.01 billion
> Increase from previous year: 4.55% — #23 largest Increase on list
[in-text-ad]

2011: $752.29 billion
> Increase from previous year: 1.93% — #31 largest Increase on list
[recirclink id=1097843]
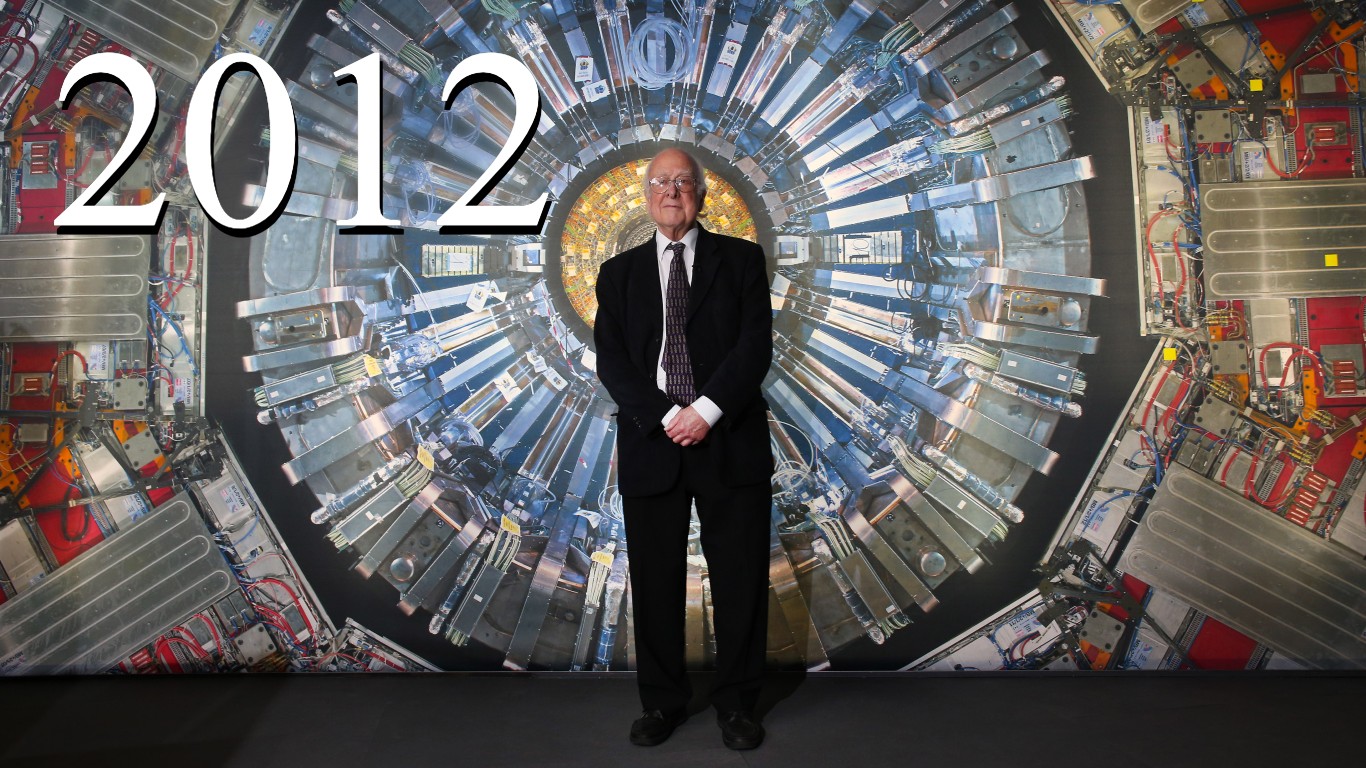
2012: $725.21 billion
> Increase from previous year: -3.60% — #45 largest Increase on list

2013: $679.23 billion
> Increase from previous year: -6.34% — #49 largest Increase on list
[in-text-ad-2]
2014: $647.79 billion
> Increase from previous year: -4.63% — #47 largest Increase on list
2015: $633.83 billion
> Increase from previous year: -2.16% — #41 largest Increase on list
[in-text-ad]
2016: $639.86 billion
> Increase from previous year: 0.95% — #36 largest Increase on list
[recirclink id=1097406]
2017: $646.75 billion
> Increase from previous year: 1.08% — #34 largest Increase on list

2018: $682.49 billion
> Increase from previous year: 5.53% — #21 largest Increase on list
[in-text-ad-2]
2019: $731.75 billion
> Increase from previous year: 7.22% — #19 largest Increase on list
Contact [email protected] for any questions or corrections.