The share of Americans working from home skyrocketed during the pandemic. A recent Gallup study found that 45% of full-time workers in the United States – and two-thirds of white-collar workers – were doing their job remotely at least some of the time.
The shift is proving to be a positive development for millions of Americans. Gallup reports that over 90% of remote workers hope that the trend continues after the pandemic, citing the lack of commute time as the chief benefit. (Here is a look at the state where the most people are working from home.)
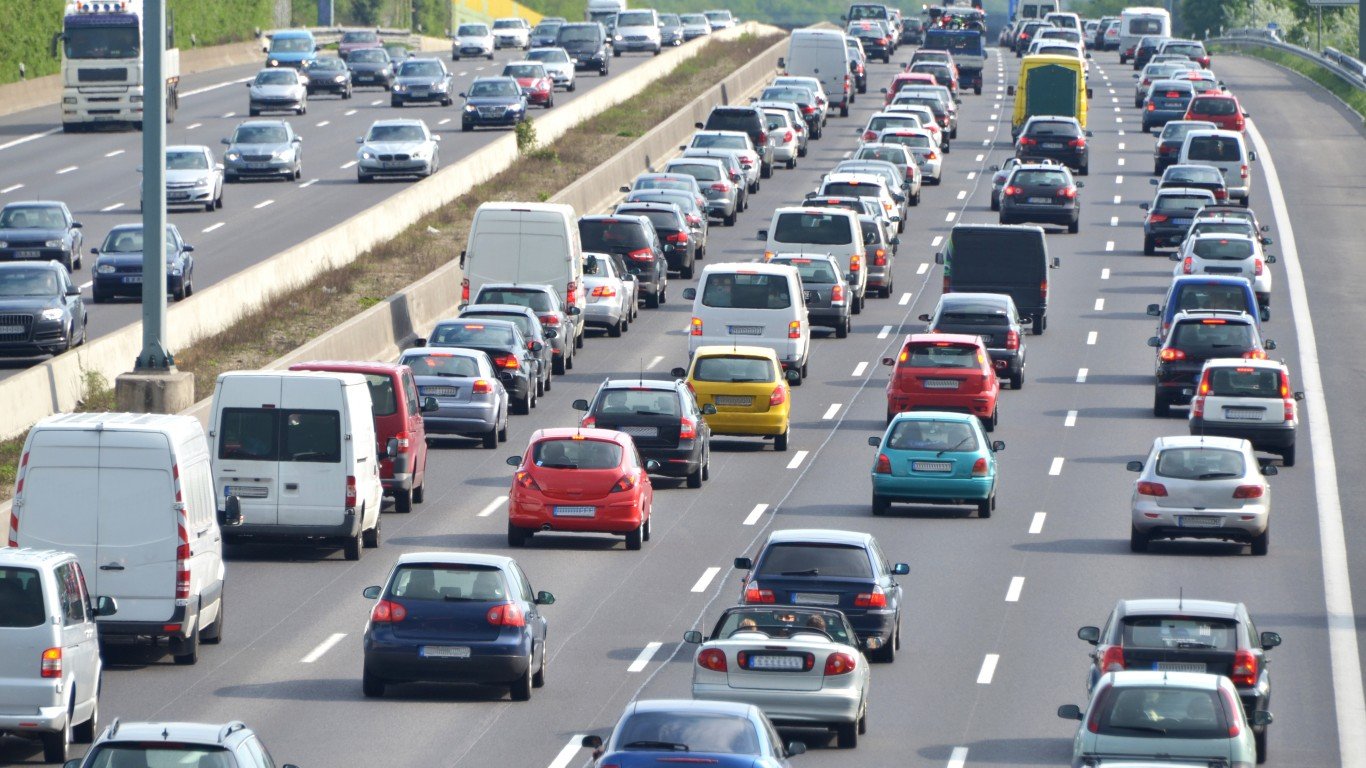
According to the U.S. Census Bureau, the average commute time in the United States is 26.9 minutes. For those who travel to and from work every Monday through Friday, this translates to about 4.5 hours per week, or nearly 10 days a year.
Of course, commute times vary from person to person, but in some parts of the country, workers who are still commuting tend to have far less travel time than others. Using census data, 24/7 Wall St. identified the town – defined as a place with a population between 1,000 and 25,000 – with the shortest commute in every state.
Among the places on this list, average commute times range from as little as six minutes to 17 minutes. In most towns on this list, the average commuter spends at least five days less time commuting annually than the average commuter across the state as a whole.
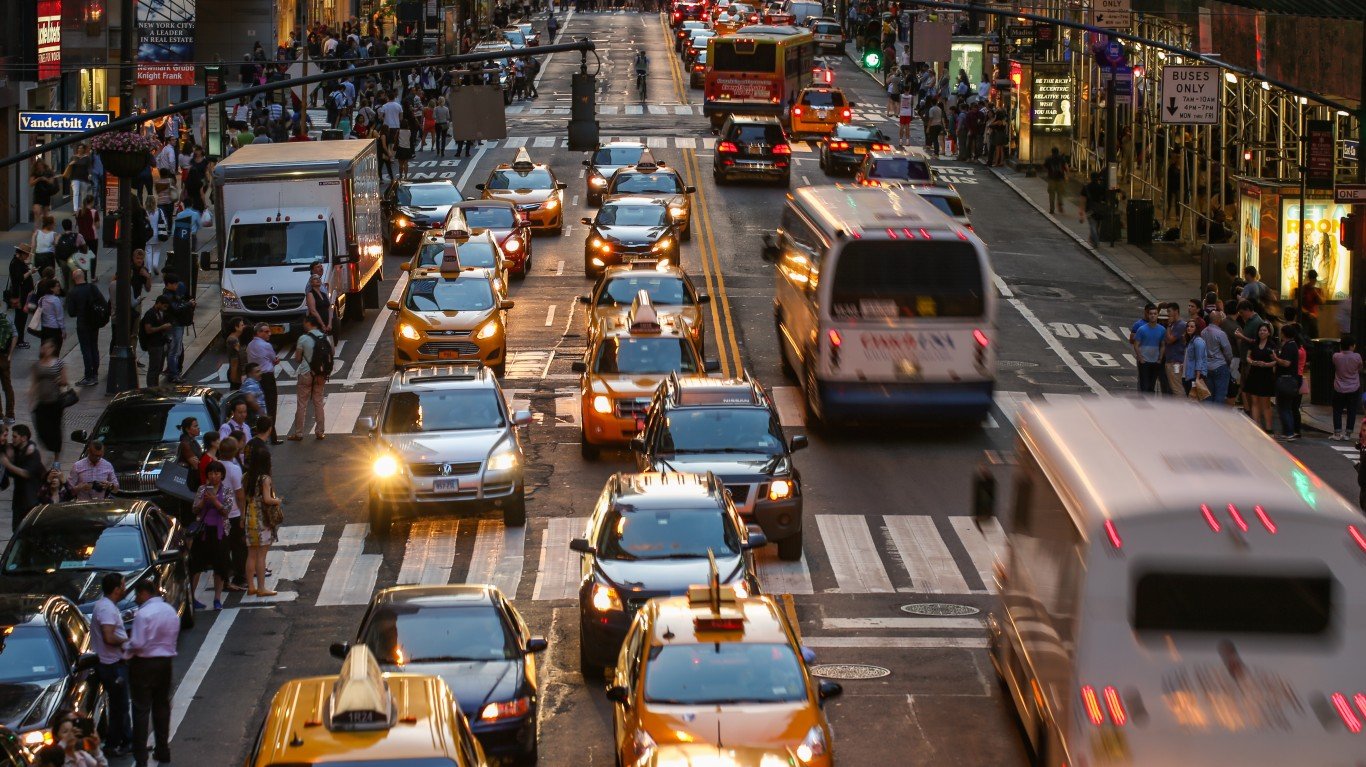
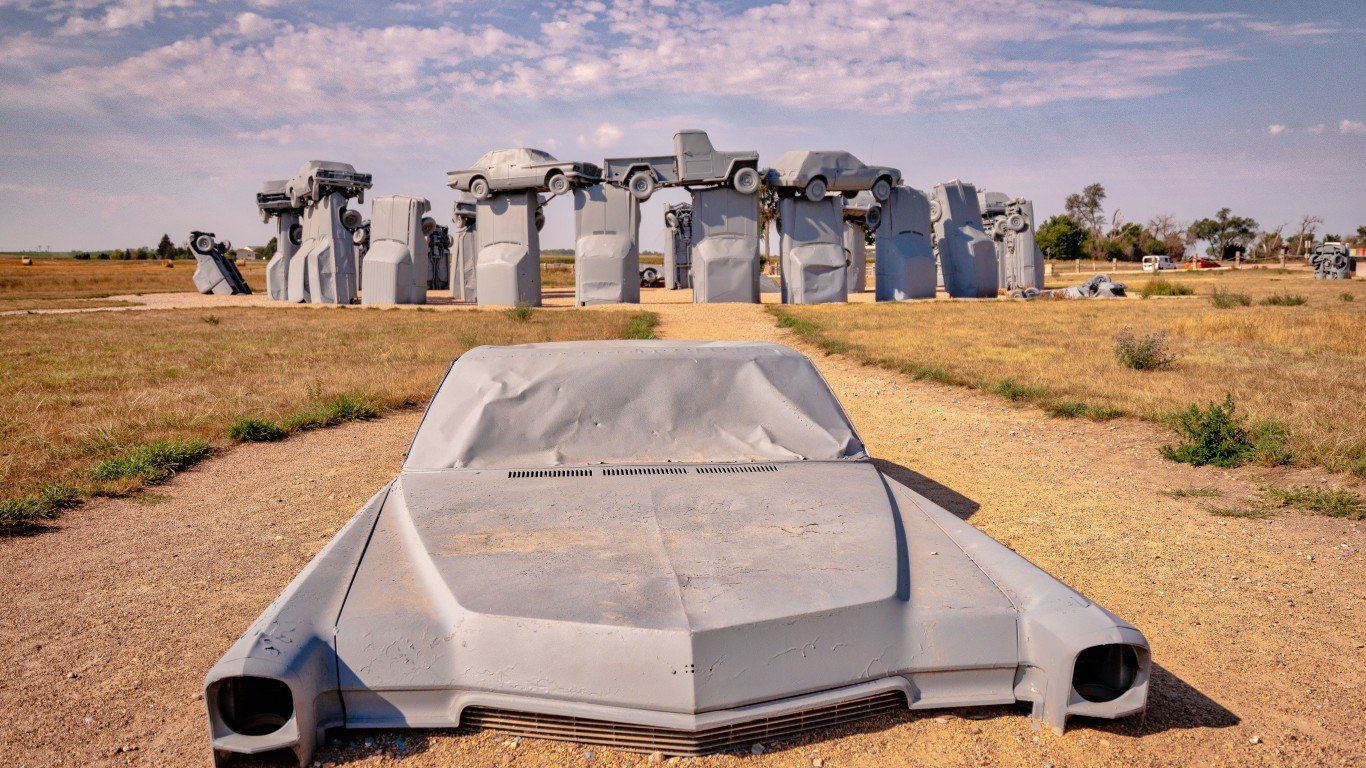
Many of the towns on this list, including Warren Airforce Base in Wyoming and Fort Irwin in California, are military installations, where many residents live and work in the same small community. Additionally, in most towns on this list, the share of commuters using public transit is below the state average. In most cases, public transportation is less direct than simply driving from door to door, adding to overall commute time. Here is a look at the cities where people lose the most time driving each year.
Click here to see the town with the shortest commute in every state
Click here to read our detailed methodology
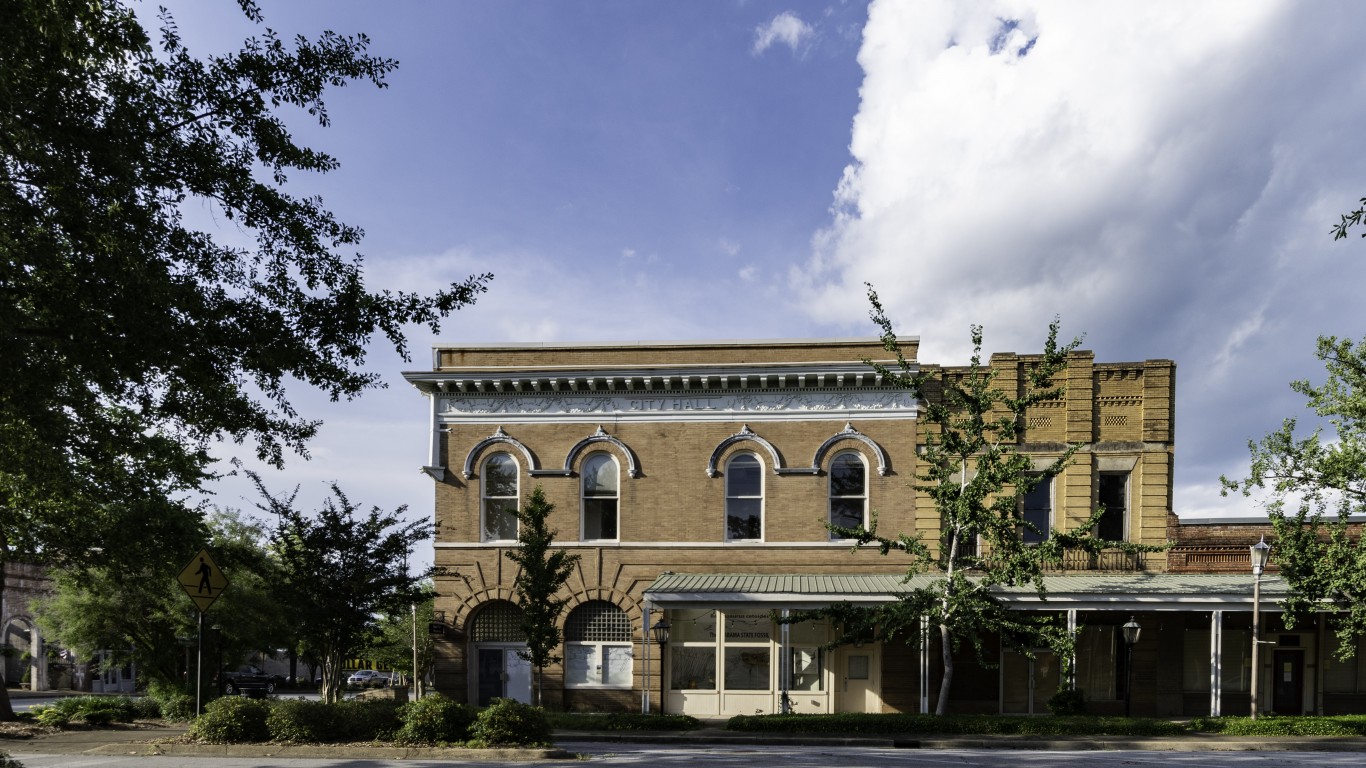
Alabama: Livingston
> Avg. commute time (minutes): 10.8 (Alabama: 25.2)
> Share of commuters driving alone: 70.0% (Alabama: 84.9%)
> Share of commuters carpooling: 17.8% (Alabama: 8.3%)
> Share of commuters using public transit: 0.0% reported (Alabama: 0.3%)
> No. of towns considered in ranking: 161
[in-text-ad]
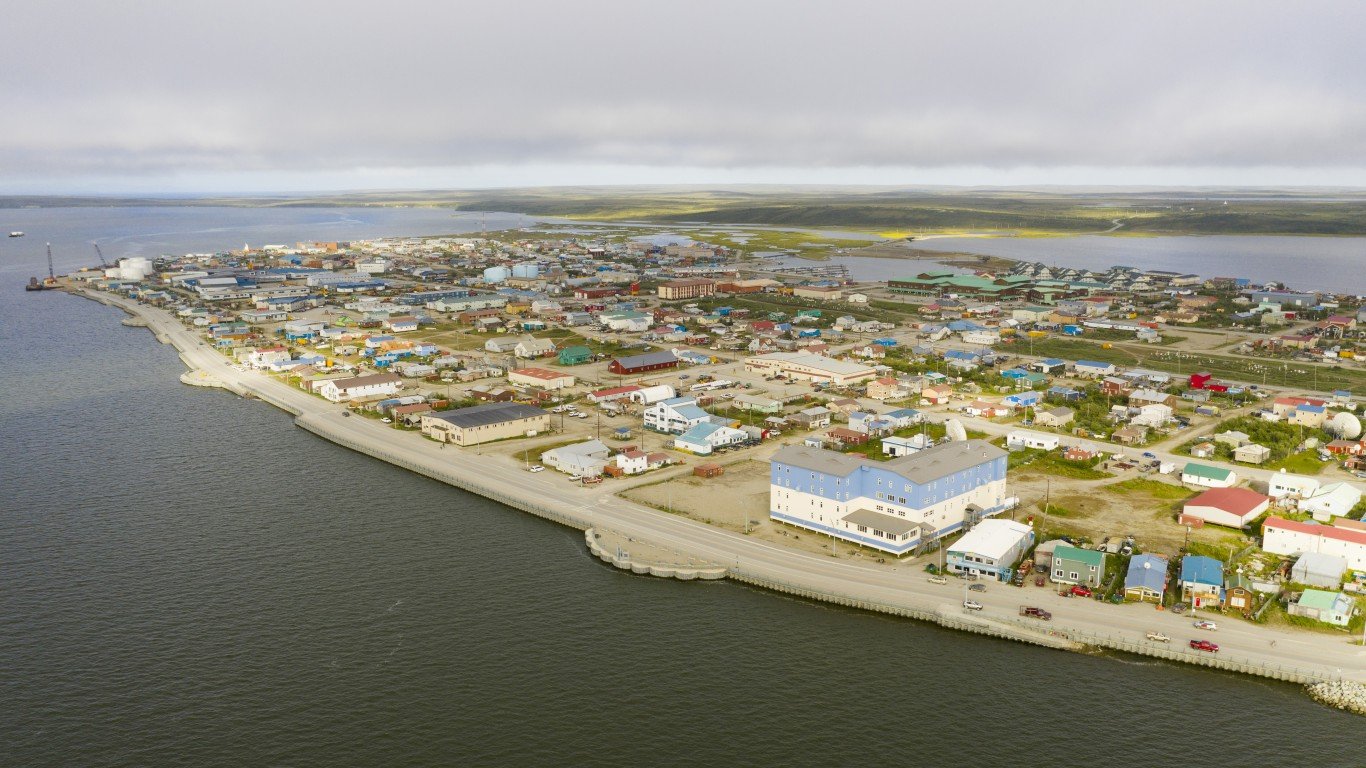
Alaska: Kotzebue
> Avg. commute time (minutes): 6.3 (Alaska: 18.9)
> Share of commuters driving alone: 27.3% (Alaska: 68.1%)
> Share of commuters carpooling: 16.5% (Alaska: 12.1%)
> Share of commuters using public transit: 1.5% (Alaska: 1.2%)
> No. of towns considered in ranking: 39
[recirclink id=987778]

Arizona: Parker
> Avg. commute time (minutes): 10.7 (Arizona: 25.8)
> Share of commuters driving alone: 83.7% (Arizona: 74.5%)
> Share of commuters carpooling: 11.2% (Arizona: 10.7%)
> Share of commuters using public transit: 0.0% reported (Arizona: 1.6%)
> No. of towns considered in ranking: 82

Arkansas: Mountain Home
> Avg. commute time (minutes): 10.4 (Arkansas: 21.8)
> Share of commuters driving alone: 79.1% (Arkansas: 82.3%)
> Share of commuters carpooling: 11.8% (Arkansas: 10.2%)
> Share of commuters using public transit: 0.0% (Arkansas: 0.3%)
> No. of towns considered in ranking: 97
[in-text-ad-2]
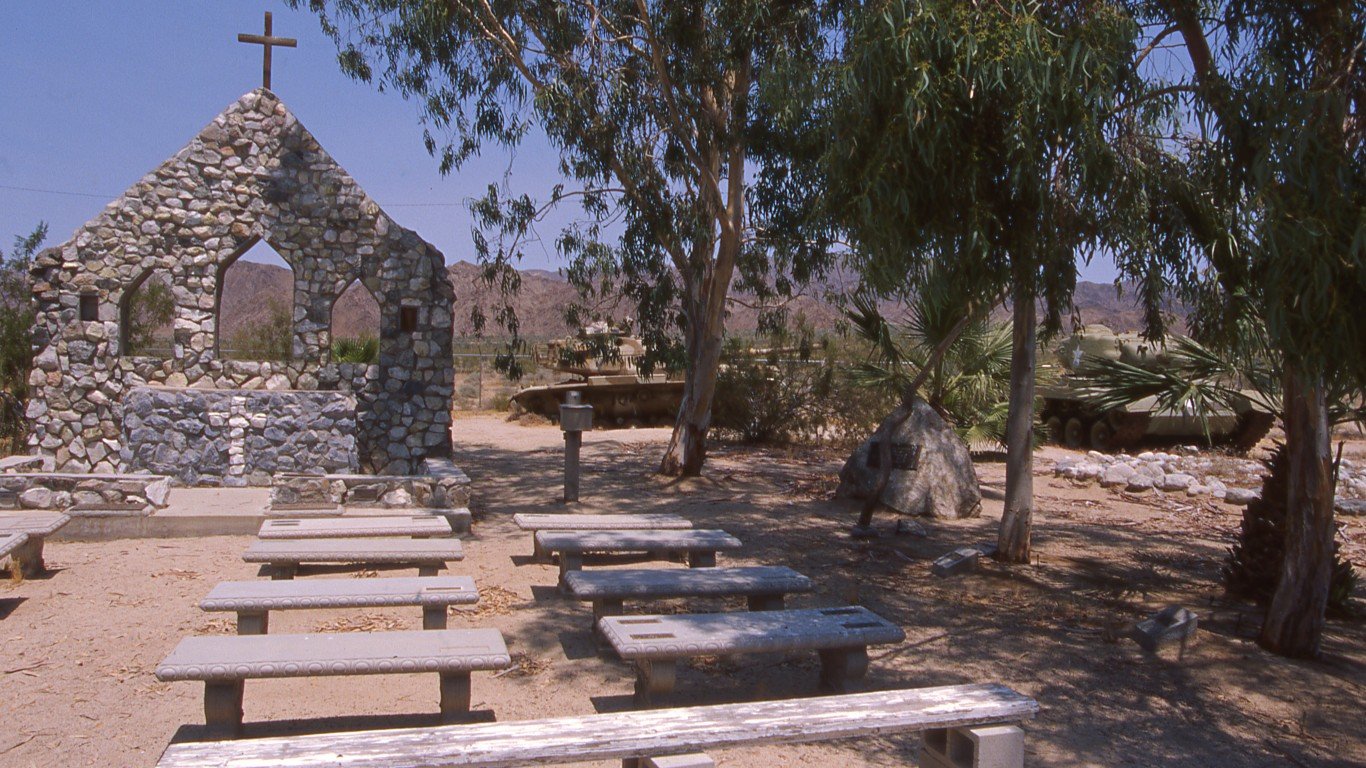
California: Fort Irwin
> Avg. commute time (minutes): 7.7 (California: 29.8)
> Share of commuters driving alone: 63.7% (California: 72.1%)
> Share of commuters carpooling: 12.6% (California: 10.0%)
> Share of commuters using public transit: 0.0% reported (California: 4.6%)
> No. of towns considered in ranking: 502

Colorado: Fort Carson
> Avg. commute time (minutes): 10.4 (Colorado: 25.8)
> Share of commuters driving alone: 54.5% (Colorado: 72.9%)
> Share of commuters carpooling: 19.9% (Colorado: 8.6%)
> Share of commuters using public transit: 0.0% (Colorado: 2.8%)
> No. of towns considered in ranking: 127
[in-text-ad]

Connecticut: Storrs
> Avg. commute time (minutes): 13.5 (Connecticut: 26.7)
> Share of commuters driving alone: 19.3% (Connecticut: 76.3%)
> Share of commuters carpooling: 3.4% (Connecticut: 7.8%)
> Share of commuters using public transit: 2.1% (Connecticut: 4.4%)
> No. of towns considered in ranking: 90
[recirclink id=1044820]
Delaware: Dover Base Housing
> Avg. commute time (minutes): 11.2 (Delaware: 26.2)
> Share of commuters driving alone: 87.6% (Delaware: 78.8%)
> Share of commuters carpooling: 7.9% (Delaware: 8.6%)
> Share of commuters using public transit: 0.0% reported (Delaware: 2.2%)
> No. of towns considered in ranking: 30
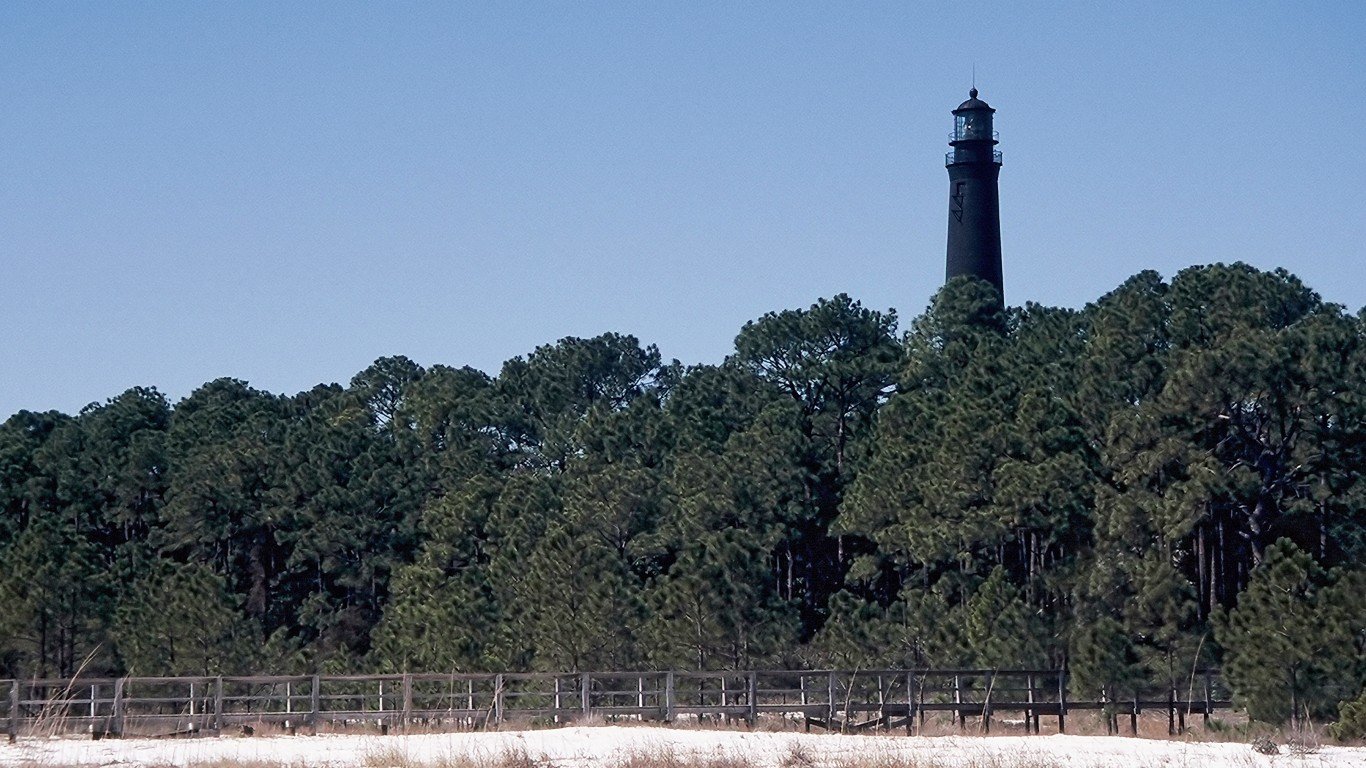
Florida: Pensacola Station
> Avg. commute time (minutes): 9.5 (Florida: 27.9)
> Share of commuters driving alone: 15.6% (Florida: 77.7%)
> Share of commuters carpooling: 3.1% (Florida: 9.2%)
> Share of commuters using public transit: 0.0% reported (Florida: 1.6%)
> No. of towns considered in ranking: 432
[in-text-ad-2]

Georgia: Berry College
> Avg. commute time (minutes): 8.4 (Georgia: 28.7)
> Share of commuters driving alone: 28.6% (Georgia: 77.7%)
> Share of commuters carpooling: 8.7% (Georgia: 9.3%)
> Share of commuters using public transit: 0.7% (Georgia: 1.9%)
> No. of towns considered in ranking: 201

Hawaii: Kaunakakai
> Avg. commute time (minutes): 9.6 (Hawaii: 27.1)
> Share of commuters driving alone: 71.2% (Hawaii: 67.6%)
> Share of commuters carpooling: 18.2% (Hawaii: 13.4%)
> Share of commuters using public transit: 0.3% (Hawaii: 5.5%)
> No. of towns considered in ranking: 82
[in-text-ad]

Idaho: Salmon
> Avg. commute time (minutes): 7.8 (Idaho: 21.2)
> Share of commuters driving alone: 76.5% (Idaho: 77.8%)
> Share of commuters carpooling: 13.4% (Idaho: 9.3%)
> Share of commuters using public transit: 0.0% reported (Idaho: 0.6%)
> No. of towns considered in ranking: 47
[recirclink id=1054986]

Illinois: Scott AFB
> Avg. commute time (minutes): 10.9 (Illinois: 29.0)
> Share of commuters driving alone: 80.2% (Illinois: 71.5%)
> Share of commuters carpooling: 11.0% (Illinois: 7.8%)
> Share of commuters using public transit: 0.3% (Illinois: 8.8%)
> No. of towns considered in ranking: 391

Indiana: Notre Dame
> Avg. commute time (minutes): 11.5 (Indiana: 23.9)
> Share of commuters driving alone: 14.2% (Indiana: 81.3%)
> Share of commuters carpooling: 1.4% (Indiana: 9.0%)
> Share of commuters using public transit: 0.9% (Indiana: 0.9%)
> No. of towns considered in ranking: 163
[in-text-ad-2]
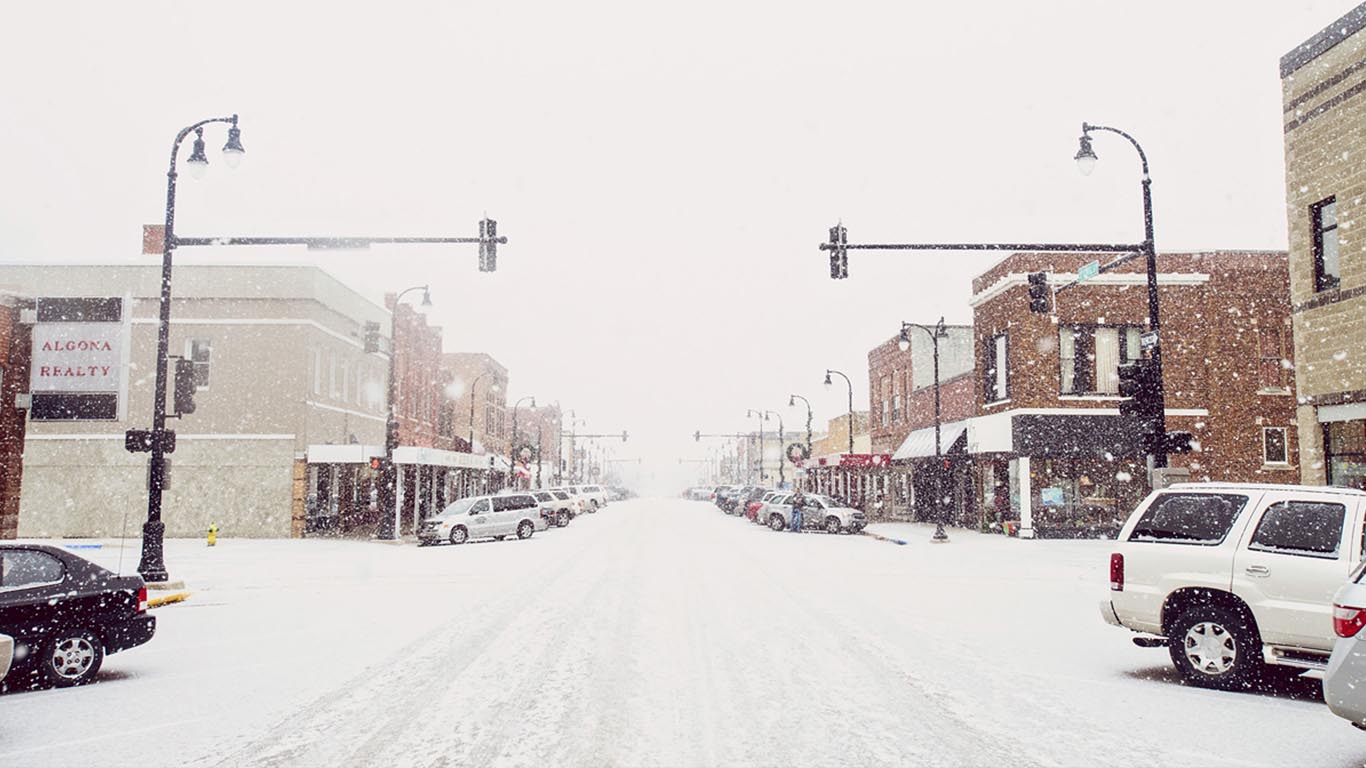
Iowa: Algona
> Avg. commute time (minutes): 9.9 (Iowa: 19.5)
> Share of commuters driving alone: 79.6% (Iowa: 80.2%)
> Share of commuters carpooling: 9.9% (Iowa: 8.0%)
> Share of commuters using public transit: 0.1% (Iowa: 0.9%)
> No. of towns considered in ranking: 133
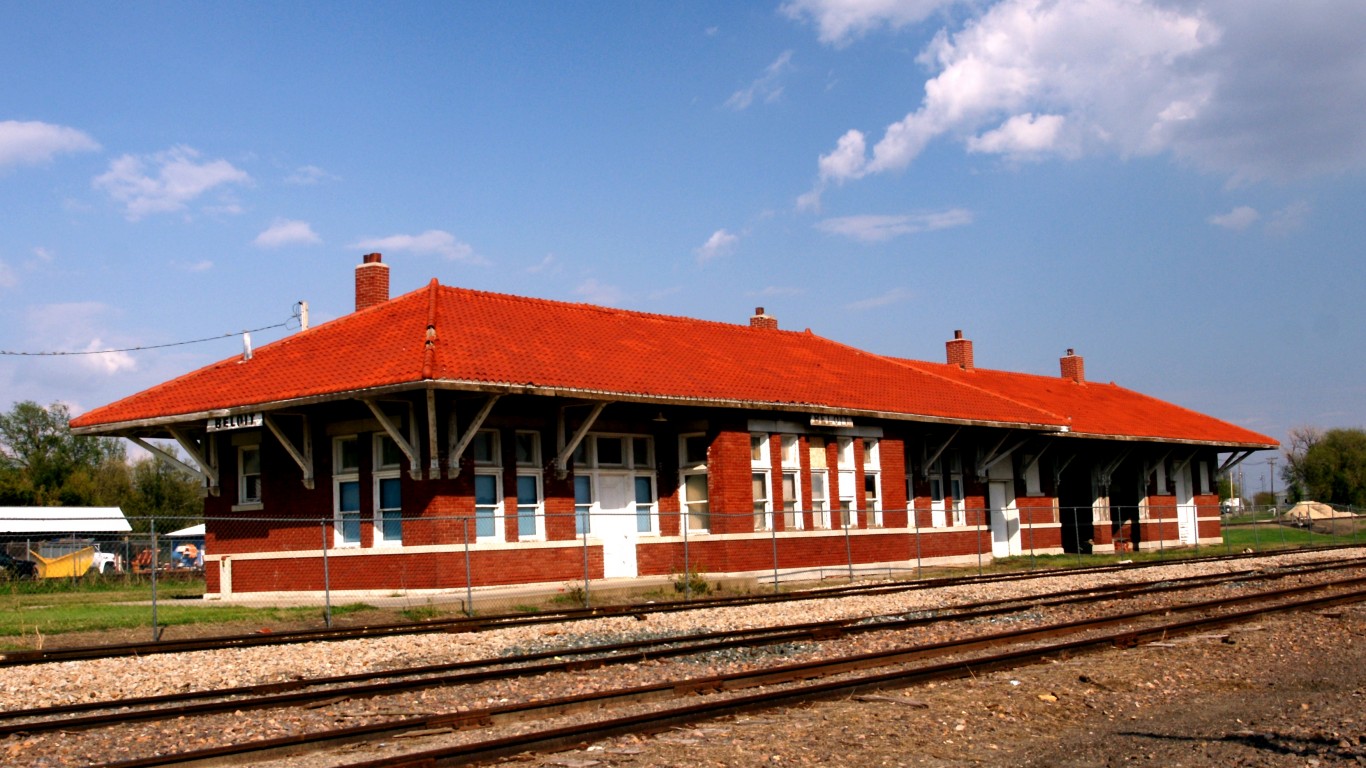
Kansas: Beloit
> Avg. commute time (minutes): 8.2 (Kansas: 19.6)
> Share of commuters driving alone: 82.8% (Kansas: 80.7%)
> Share of commuters carpooling: 8.4% (Kansas: 8.9%)
> Share of commuters using public transit: 0.0% reported (Kansas: 0.4%)
> No. of towns considered in ranking: 92
[in-text-ad]
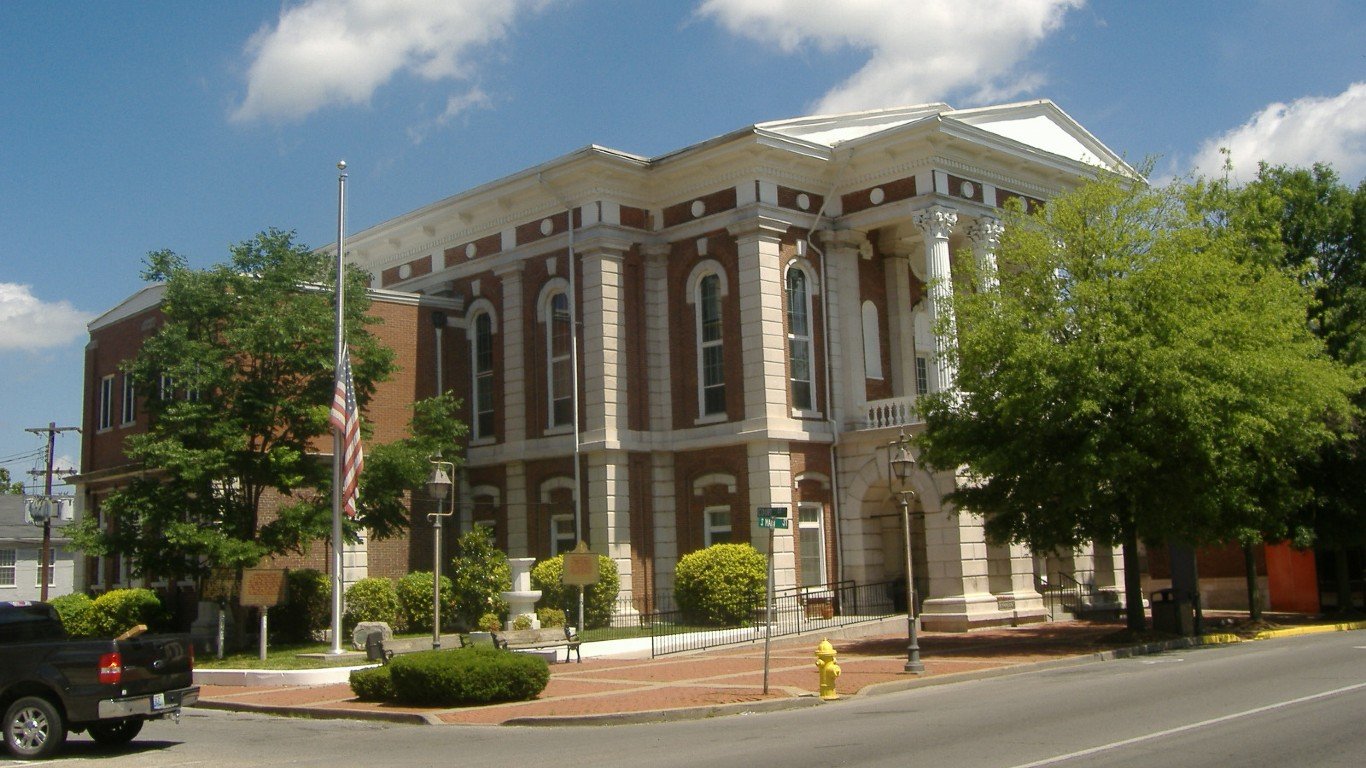
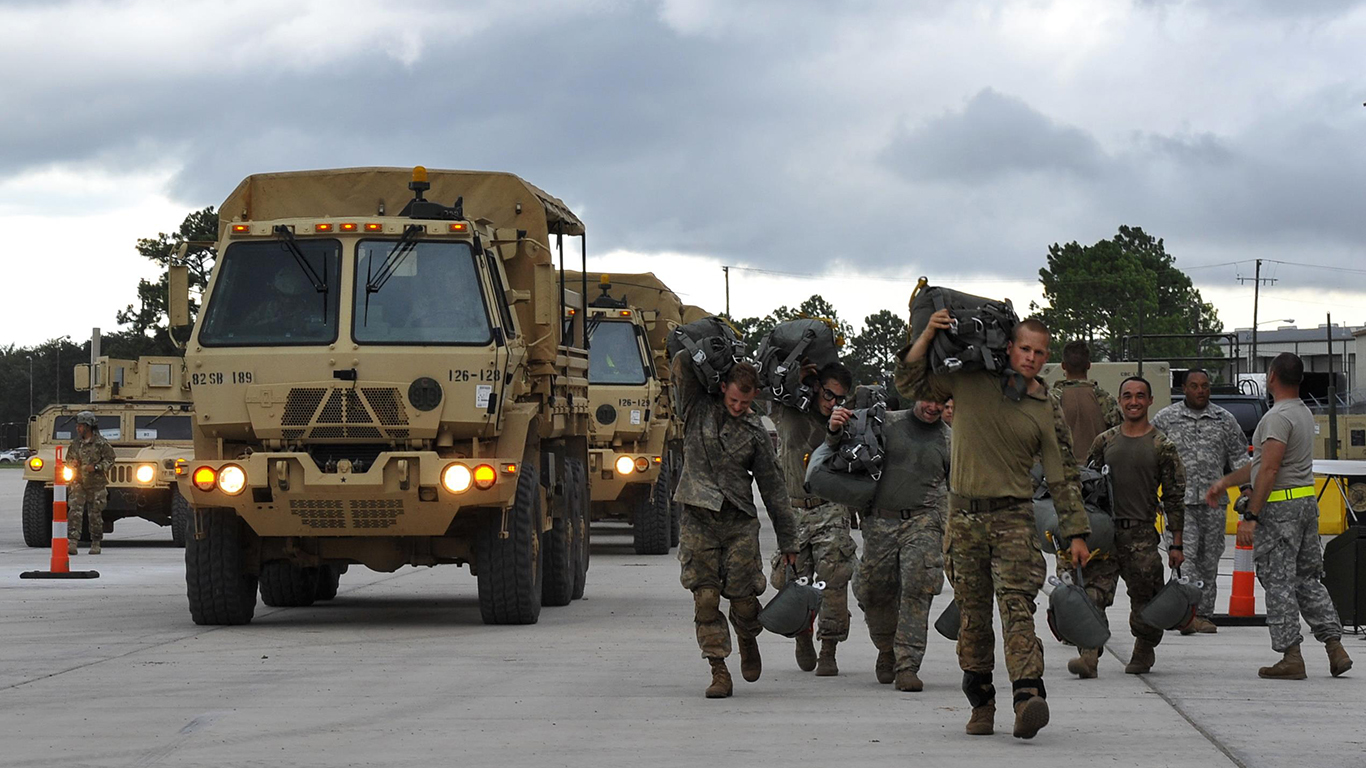
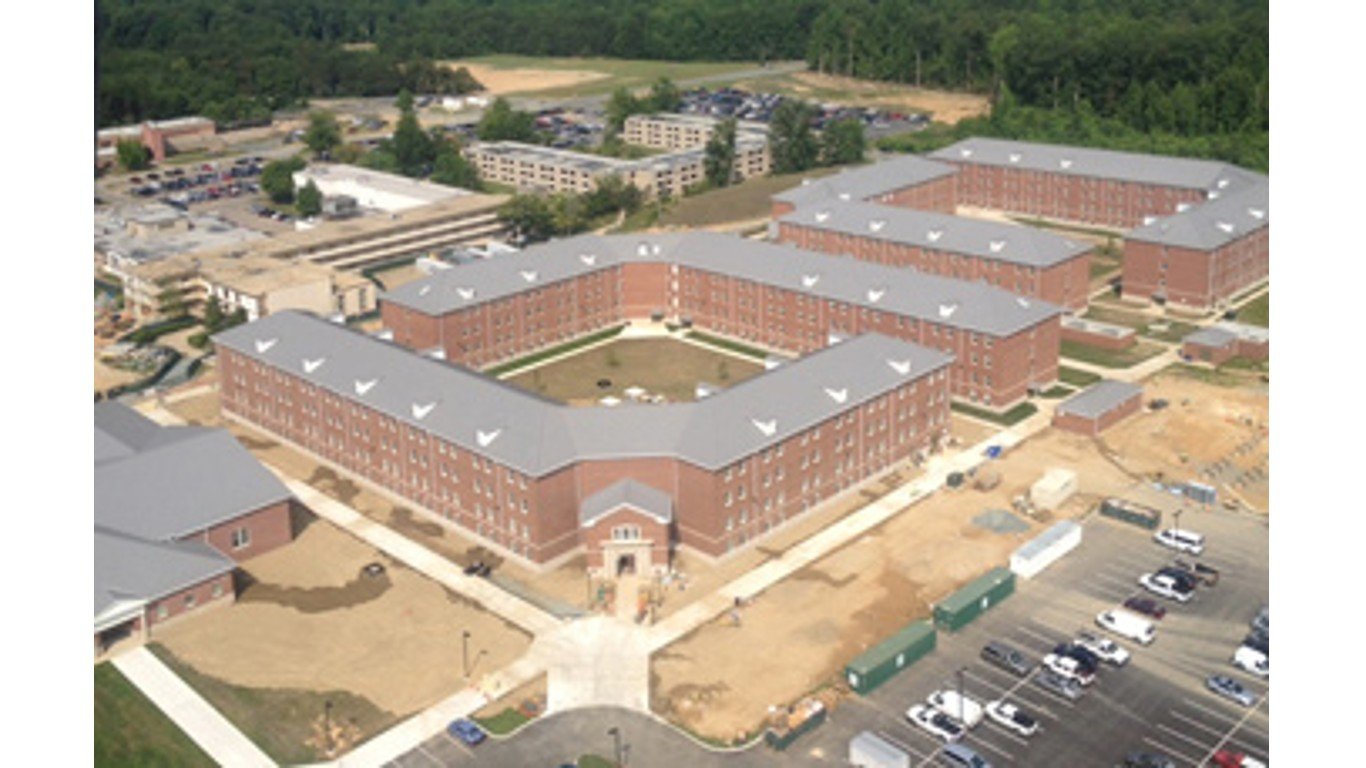
Kentucky: Fort Campbell North
> Avg. commute time (minutes): 8.0 (Kentucky: 23.7)
> Share of commuters driving alone: 57.3% (Kentucky: 81.2%)
> Share of commuters carpooling: 7.0% (Kentucky: 9.2%)
> Share of commuters using public transit: 0.5% (Kentucky: 0.9%)
> No. of towns considered in ranking: 118
[recirclink id=1060122]
Louisiana: Fort Polk South
> Avg. commute time (minutes): 10.2 (Louisiana: 25.8)
> Share of commuters driving alone: 70.2% (Louisiana: 81.9%)
> Share of commuters carpooling: 6.9% (Louisiana: 9.0%)
> Share of commuters using public transit: 0.0% reported (Louisiana: 1.1%)
> No. of towns considered in ranking: 138

Maine: Bar Harbor
> Avg. commute time (minutes): 13.2 (Maine: 24.3)
> Share of commuters driving alone: 60.6% (Maine: 77.2%)
> Share of commuters carpooling: 16.3% (Maine: 9.2%)
> Share of commuters using public transit: 1.0% (Maine: 0.5%)
> No. of towns considered in ranking: 51
[in-text-ad-2]
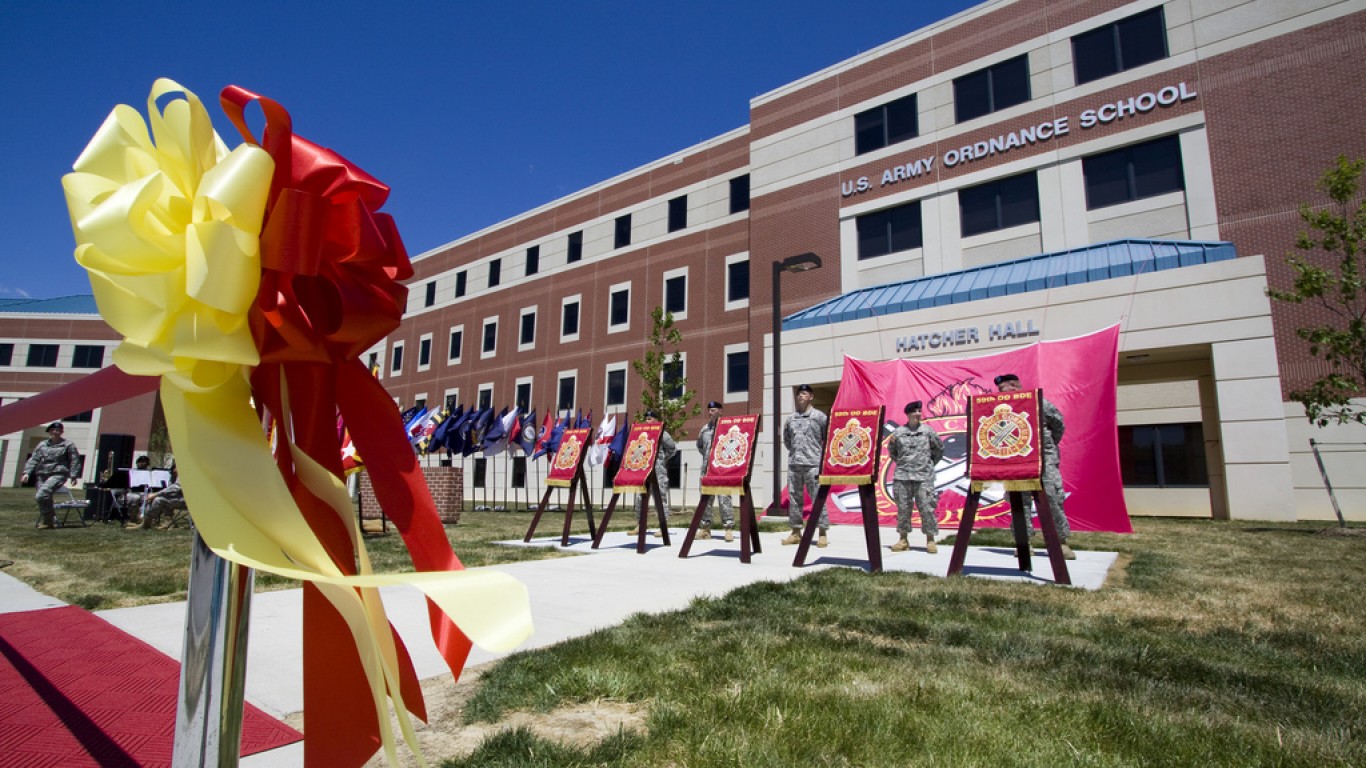
Maryland: Aberdeen Proving Ground
> Avg. commute time (minutes): 15.3 (Maryland: 33.0)
> Share of commuters driving alone: 72.4% (Maryland: 72.1%)
> Share of commuters carpooling: 3.6% (Maryland: 8.6%)
> Share of commuters using public transit: 0.0% reported (Maryland: 7.4%)
> No. of towns considered in ranking: 207

Massachusetts: Williamstown
> Avg. commute time (minutes): 11.9 (Massachusetts: 30.0)
> Share of commuters driving alone: 28.5% (Massachusetts: 68.0%)
> Share of commuters carpooling: 2.9% (Massachusetts: 7.3%)
> Share of commuters using public transit: 0.5% (Massachusetts: 9.5%)
> No. of towns considered in ranking: 111
[in-text-ad]

Michigan: Trowbridge Park
> Avg. commute time (minutes): 8.6 (Michigan: 24.6)
> Share of commuters driving alone: 82.8% (Michigan: 80.7%)
> Share of commuters carpooling: 12.0% (Michigan: 8.6%)
> Share of commuters using public transit: 0.4% (Michigan: 1.3%)
> No. of towns considered in ranking: 225
[recirclink id=1024519]

Minnesota: International Falls
> Avg. commute time (minutes): 8.3 (Minnesota: 23.8)
> Share of commuters driving alone: 68.2% (Minnesota: 76.0%)
> Share of commuters carpooling: 11.7% (Minnesota: 8.1%)
> Share of commuters using public transit: 0.5% (Minnesota: 3.2%)
> No. of towns considered in ranking: 203

Mississippi: Pearl River
> Avg. commute time (minutes): 12.2 (Mississippi: 25.2)
> Share of commuters driving alone: 66.9% (Mississippi: 84.6%)
> Share of commuters carpooling: 21.3% (Mississippi: 9.2%)
> Share of commuters using public transit: 1.0% (Mississippi: 0.3%)
> No. of towns considered in ranking: 88
[in-text-ad-2]
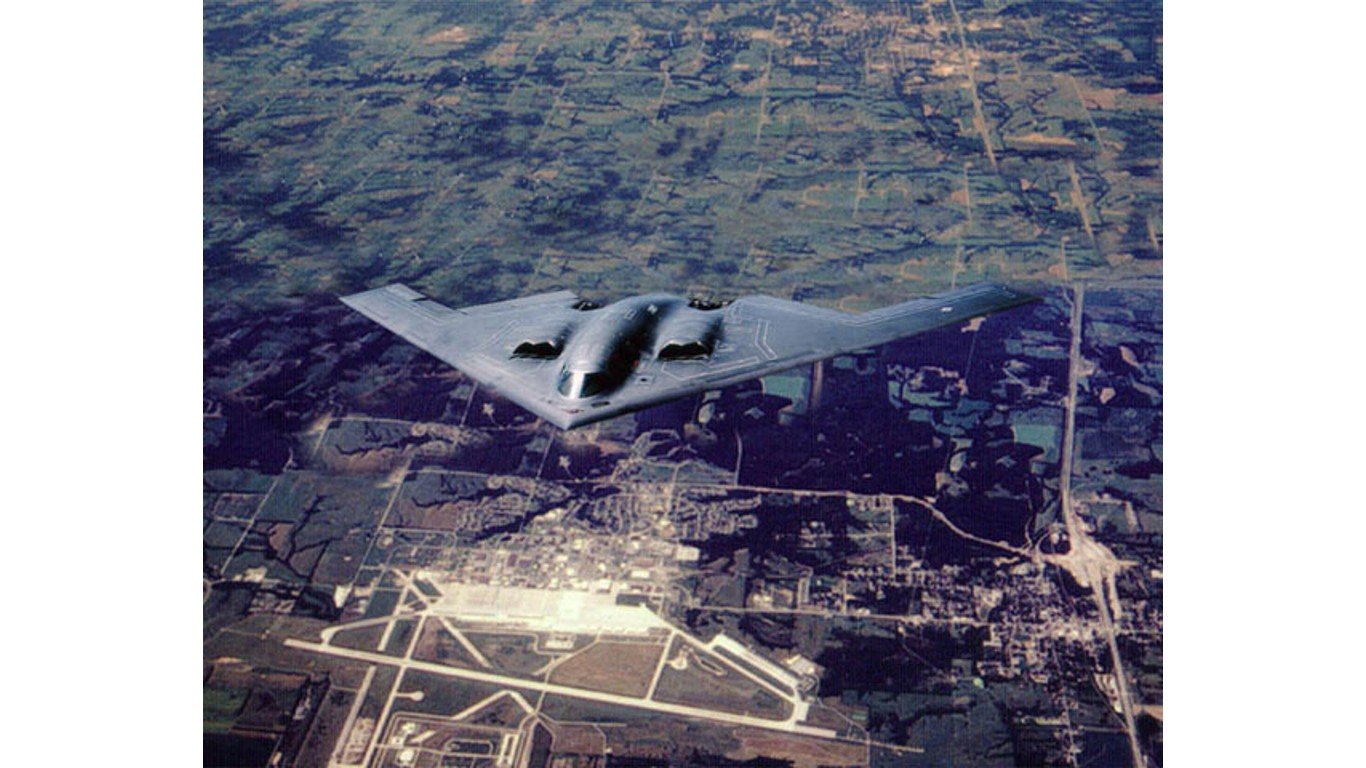
Missouri: Whiteman AFB
> Avg. commute time (minutes): 9.9 (Missouri: 23.9)
> Share of commuters driving alone: 75.0% (Missouri: 80.8%)
> Share of commuters carpooling: 7.9% (Missouri: 8.4%)
> Share of commuters using public transit: 0.0% reported (Missouri: 1.2%)
> No. of towns considered in ranking: 208

Montana: Cut Bank
> Avg. commute time (minutes): 9.7 (Montana: 18.4)
> Share of commuters driving alone: 73.2% (Montana: 75.2%)
> Share of commuters carpooling: 14.5% (Montana: 9.2%)
> Share of commuters using public transit: 0.0% reported (Montana: 0.7%)
> No. of towns considered in ranking: 37
[in-text-ad]
Nebraska: Alliance
> Avg. commute time (minutes): 7.9 (Nebraska: 18.9)
> Share of commuters driving alone: 80.7% (Nebraska: 80.7%)
> Share of commuters carpooling: 16.5% (Nebraska: 9.0%)
> Share of commuters using public transit: 0.2% (Nebraska: 0.6%)
> No. of towns considered in ranking: 52
[recirclink id=987778]

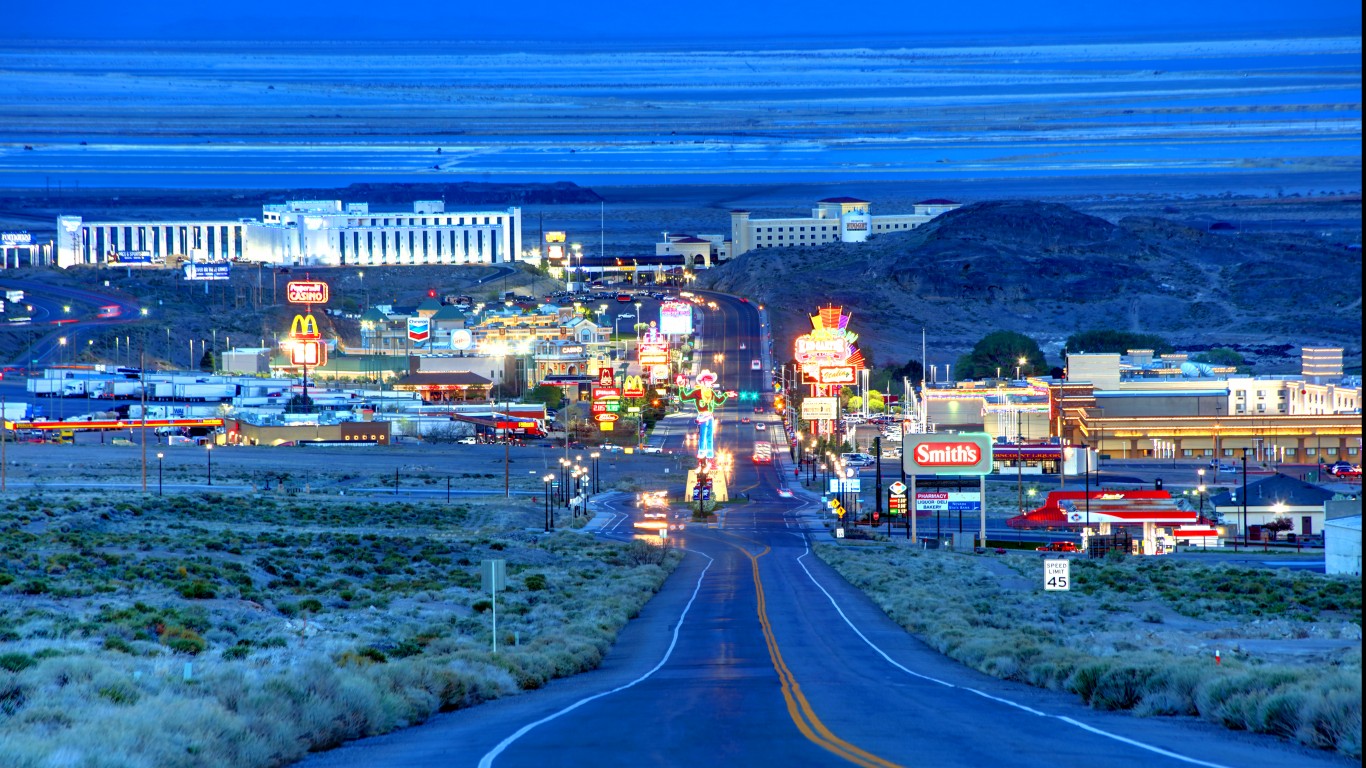
Nevada: Ely
> Avg. commute time (minutes): 12.8 (Nevada: 24.6)
> Share of commuters driving alone: 81.5% (Nevada: 76.8%)
> Share of commuters carpooling: 6.7% (Nevada: 10.6%)
> Share of commuters using public transit: 0.8% (Nevada: 2.9%)
> No. of towns considered in ranking: 26
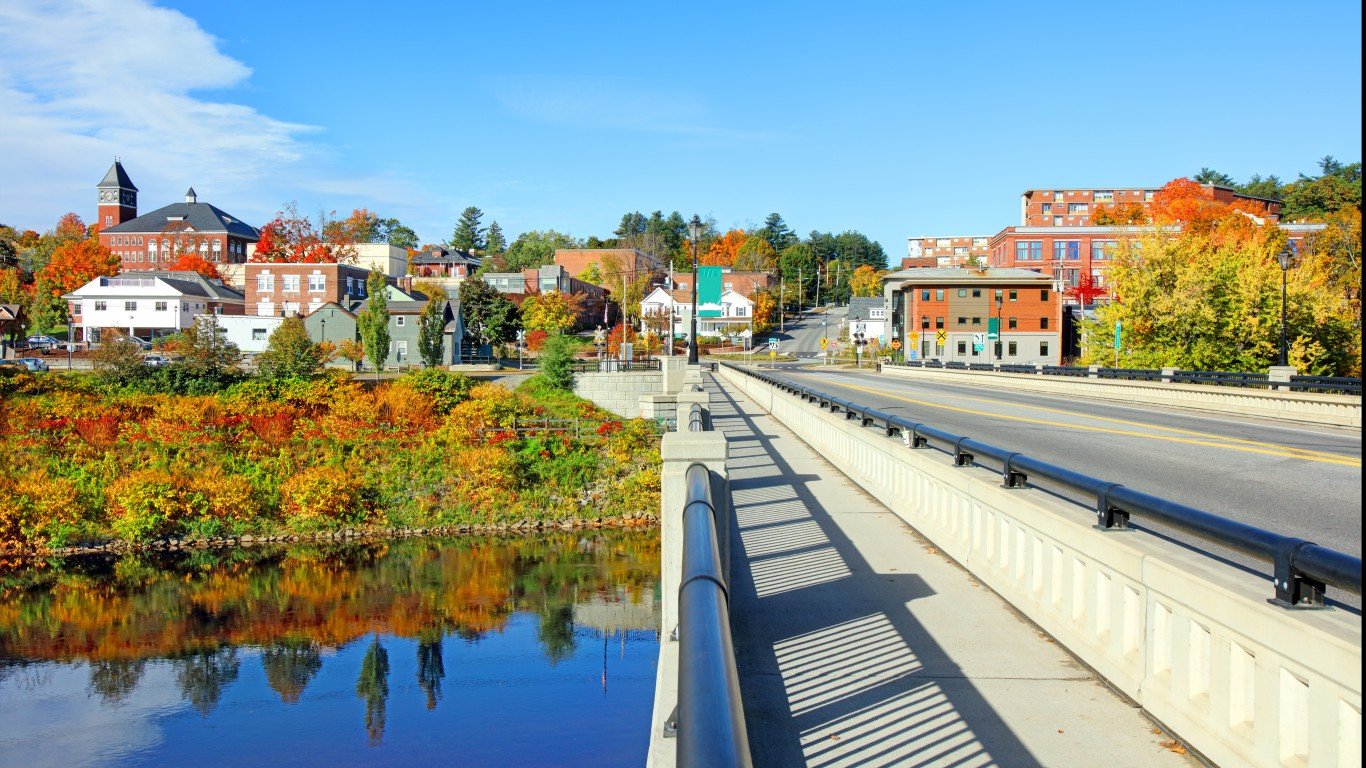
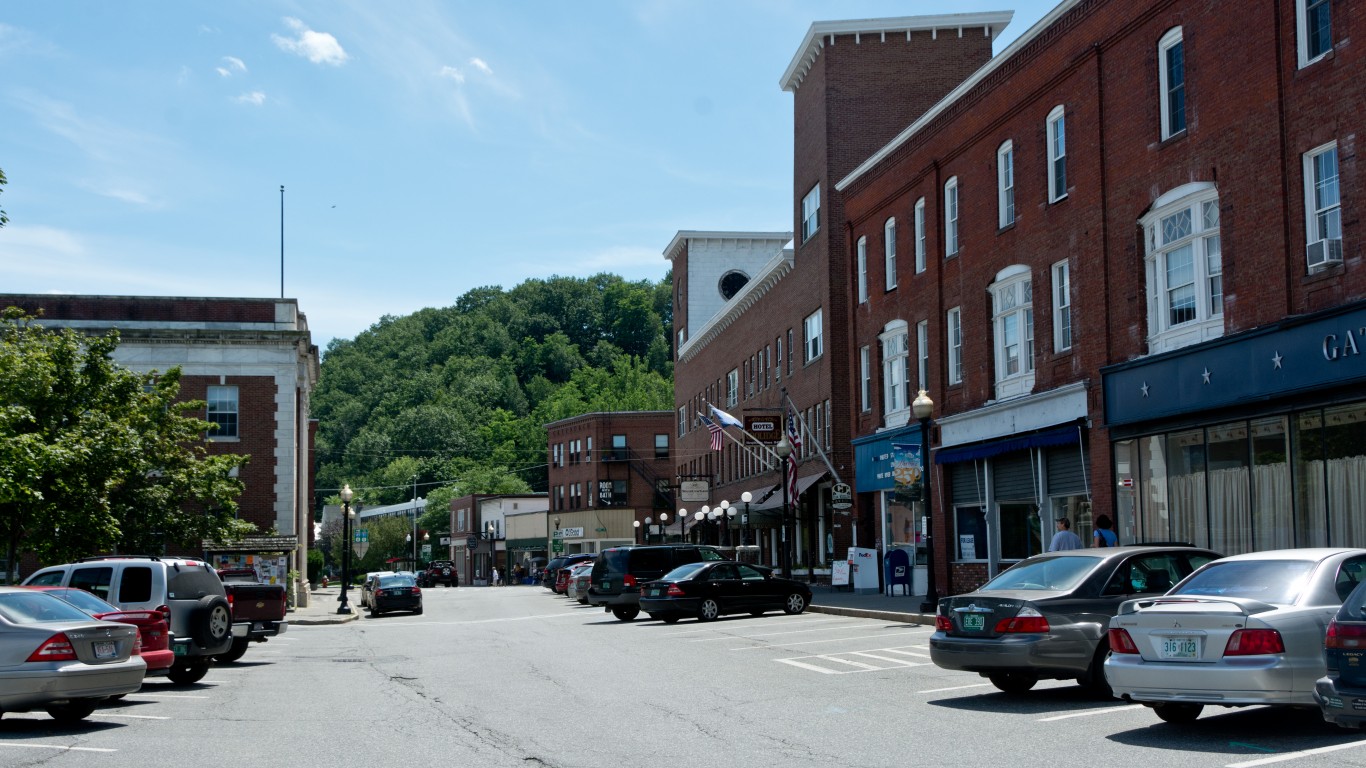
New Hampshire: Plymouth
> Avg. commute time (minutes): 14.3 (New Hampshire: 27.4)
> Share of commuters driving alone: 40.3% (New Hampshire: 79.5%)
> Share of commuters carpooling: 11.8% (New Hampshire: 7.7%)
> Share of commuters using public transit: 0.0% reported (New Hampshire: 0.8%)
> No. of towns considered in ranking: 37
[in-text-ad-2]

New Jersey: The College of New Jersey
> Avg. commute time (minutes): 12.9 (New Jersey: 32.0)
> Share of commuters driving alone: 34.4% (New Jersey: 69.6%)
> Share of commuters carpooling: 4.1% (New Jersey: 7.8%)
> Share of commuters using public transit: 1.4% (New Jersey: 10.8%)
> No. of towns considered in ranking: 385
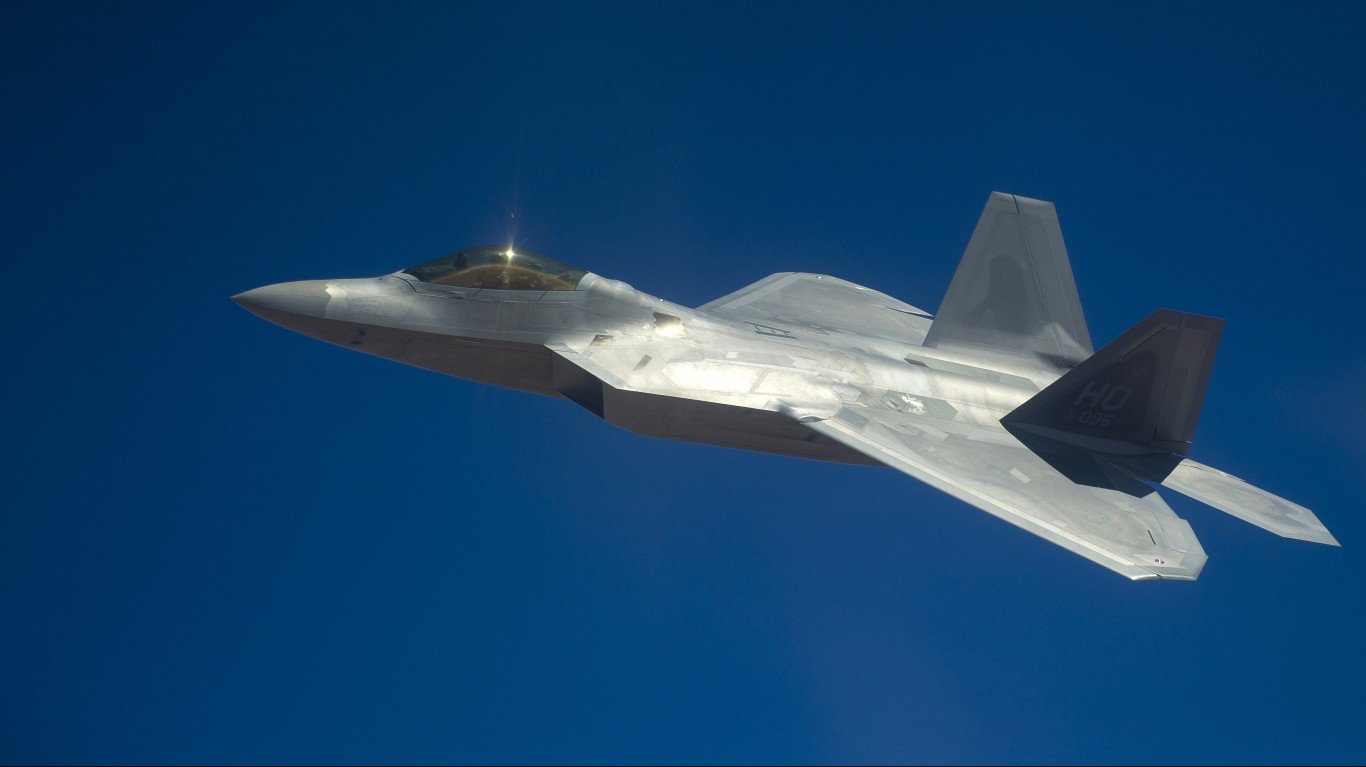
New Mexico: Holloman AFB
> Avg. commute time (minutes): 8.7 (New Mexico: 22.7)
> Share of commuters driving alone: 68.6% (New Mexico: 79.1%)
> Share of commuters carpooling: 13.1% (New Mexico: 10.0%)
> Share of commuters using public transit: 0.0% reported (New Mexico: 1.0%)
> No. of towns considered in ranking: 56
[in-text-ad]
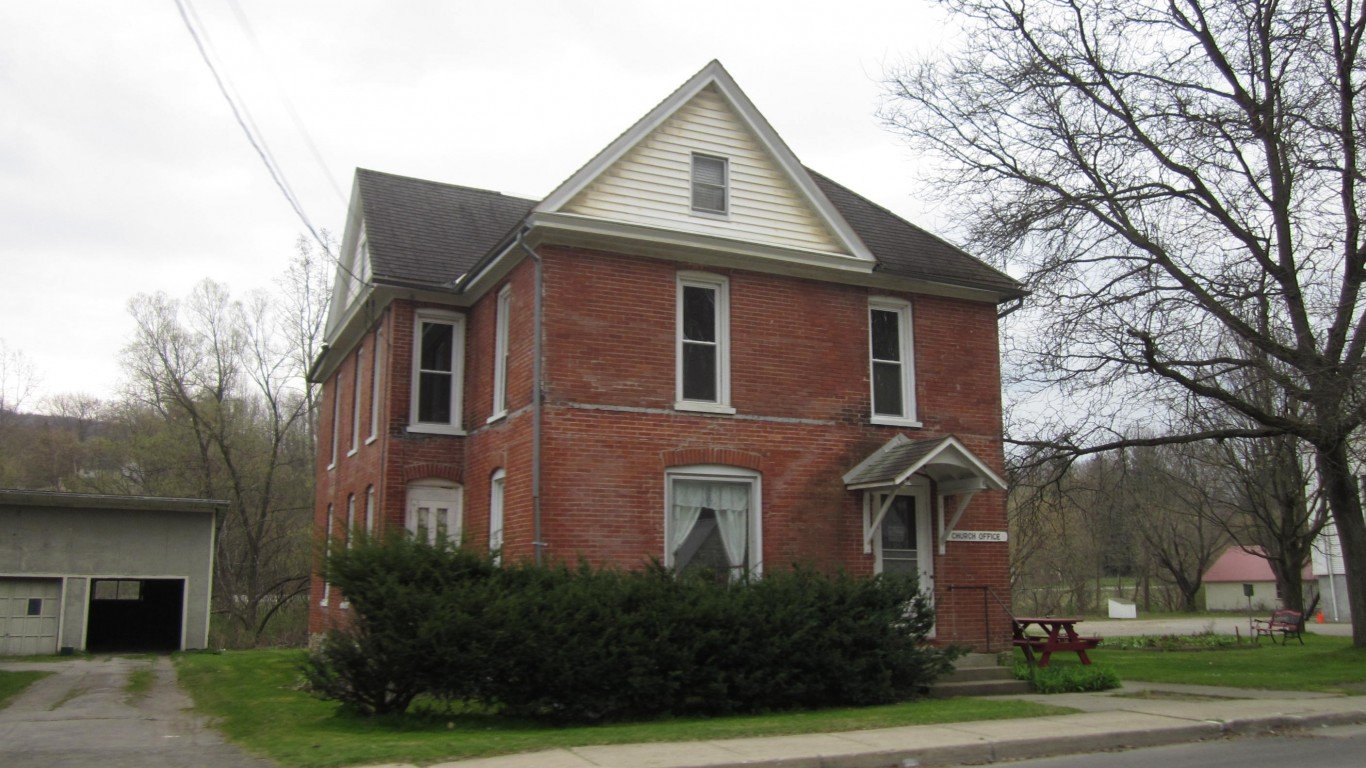
New York: Alfred
> Avg. commute time (minutes): 9.2 (New York: 33.5)
> Share of commuters driving alone: 18.3% (New York: 52.3%)
> Share of commuters carpooling: 2.5% (New York: 6.4%)
> Share of commuters using public transit: 0.8% (New York: 26.2%)
> No. of towns considered in ranking: 515
[recirclink id=1044820]
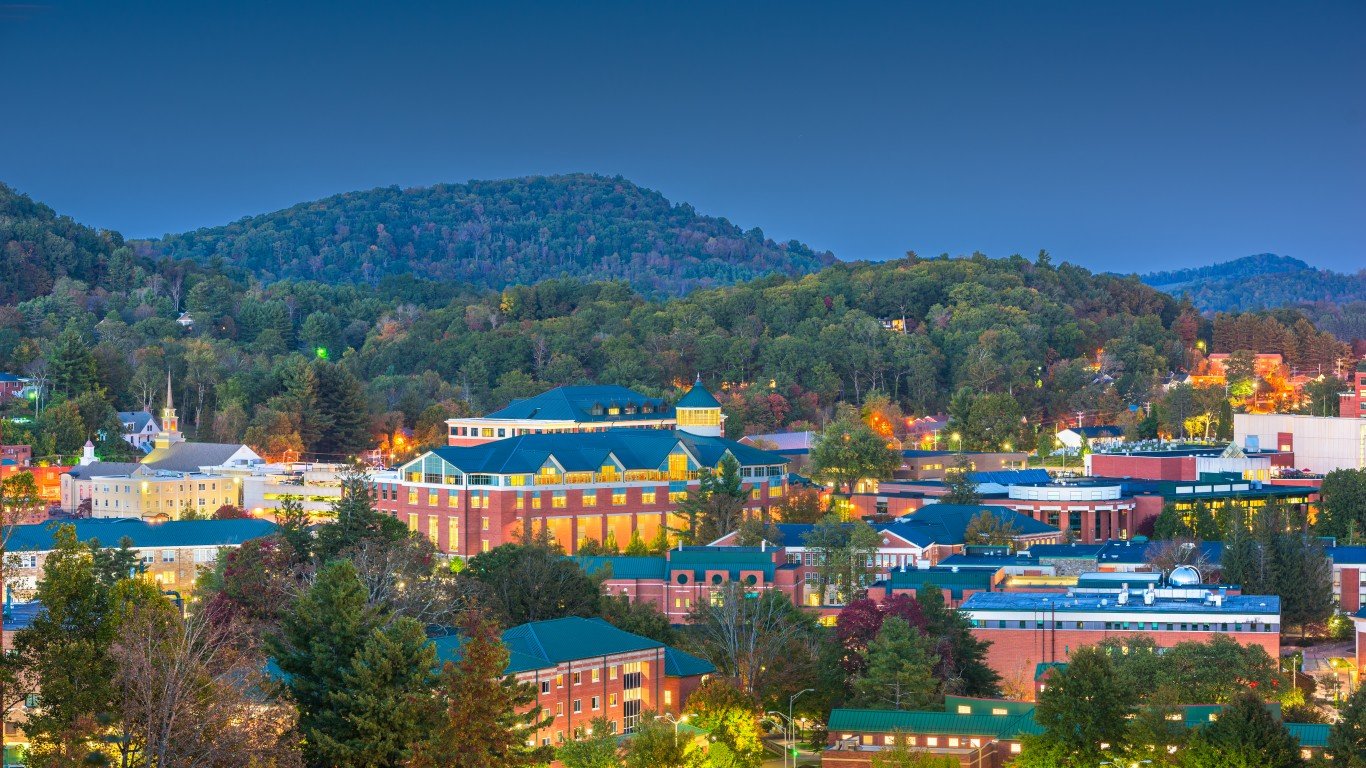
North Carolina: Boone
> Avg. commute time (minutes): 13.7 (North Carolina: 24.9)
> Share of commuters driving alone: 62.4% (North Carolina: 79.3%)
> Share of commuters carpooling: 8.2% (North Carolina: 9.0%)
> Share of commuters using public transit: 4.1% (North Carolina: 1.0%)
> No. of towns considered in ranking: 234

North Dakota: Grand Forks AFB
> Avg. commute time (minutes): 9.0 (North Dakota: 17.6)
> Share of commuters driving alone: 81.6% (North Dakota: 80.8%)
> Share of commuters carpooling: 11.1% (North Dakota: 8.9%)
> Share of commuters using public transit: 0.9% (North Dakota: 0.5%)
> No. of towns considered in ranking: 19
[in-text-ad-2]
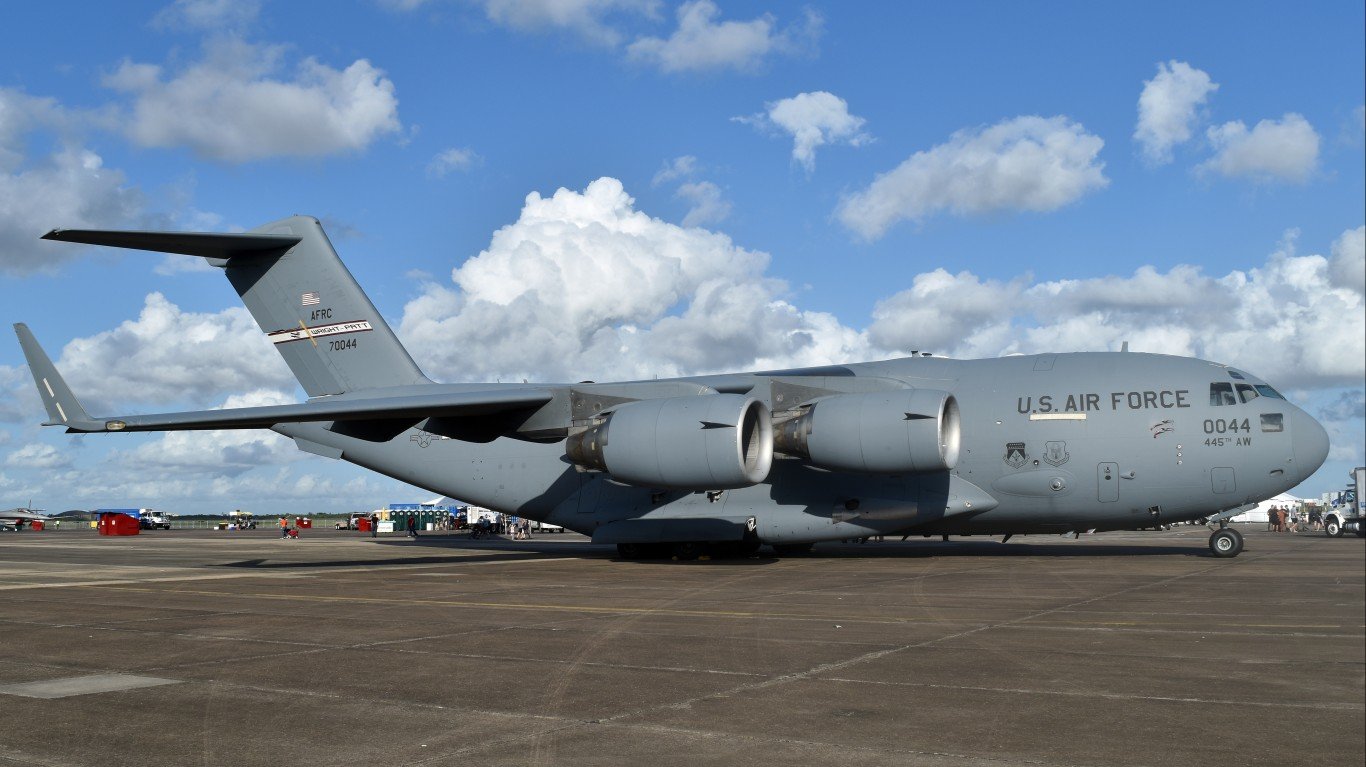
Ohio: Wright-Patterson AFB
> Avg. commute time (minutes): 10.2 (Ohio: 23.7)
> Share of commuters driving alone: 77.4% (Ohio: 81.5%)
> Share of commuters carpooling: 19.3% (Ohio: 7.6%)
> Share of commuters using public transit: 0.0% reported (Ohio: 1.4%)
> No. of towns considered in ranking: 388
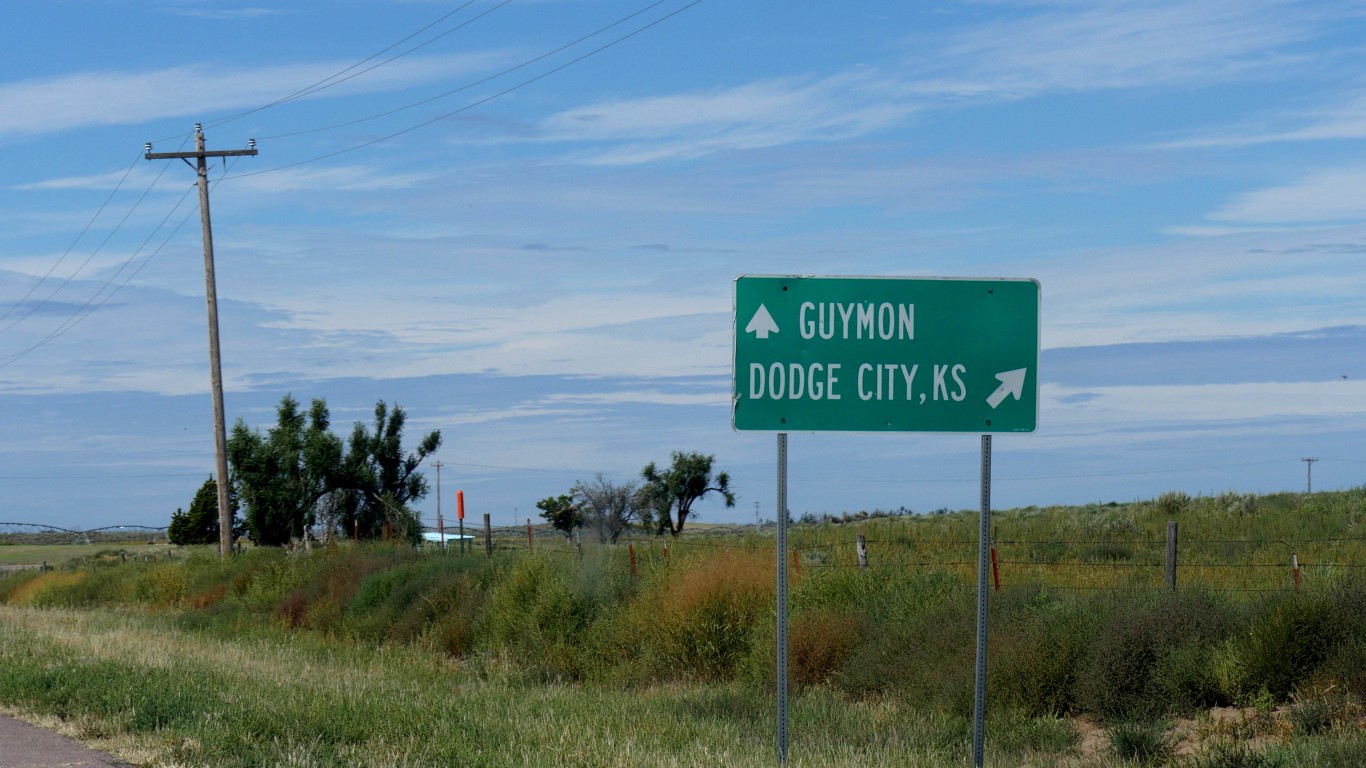
Oklahoma: Guymon
> Avg. commute time (minutes): 10.5 (Oklahoma: 22.0)
> Share of commuters driving alone: 77.9% (Oklahoma: 81.6%)
> Share of commuters carpooling: 18.5% (Oklahoma: 9.7%)
> Share of commuters using public transit: 0.2% (Oklahoma: 0.4%)
> No. of towns considered in ranking: 105
[in-text-ad]
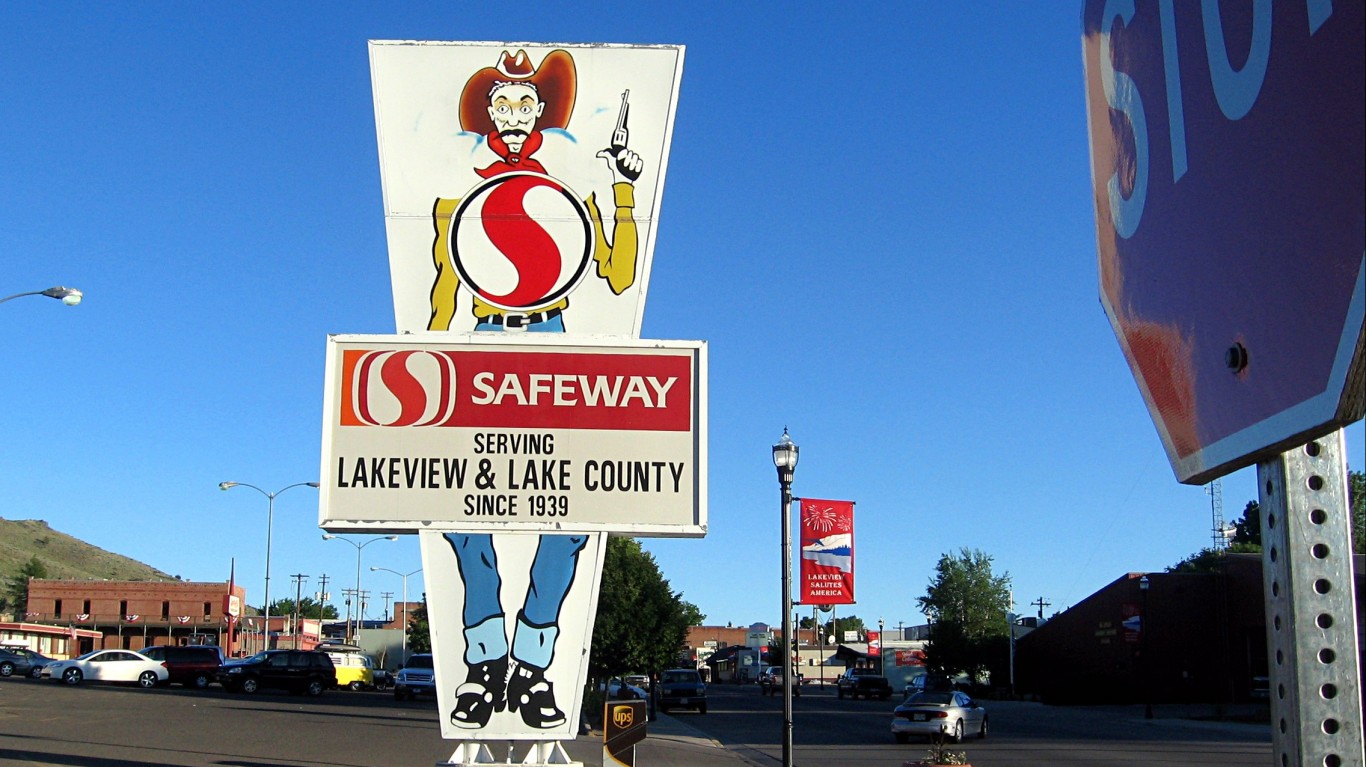
Oregon: Lakeview
> Avg. commute time (minutes): 6.0 (Oregon: 23.9)
> Share of commuters driving alone: 67.8% (Oregon: 70.5%)
> Share of commuters carpooling: 8.9% (Oregon: 9.4%)
> Share of commuters using public transit: 0.2% (Oregon: 4.0%)
> No. of towns considered in ranking: 110
[recirclink id=1054986]
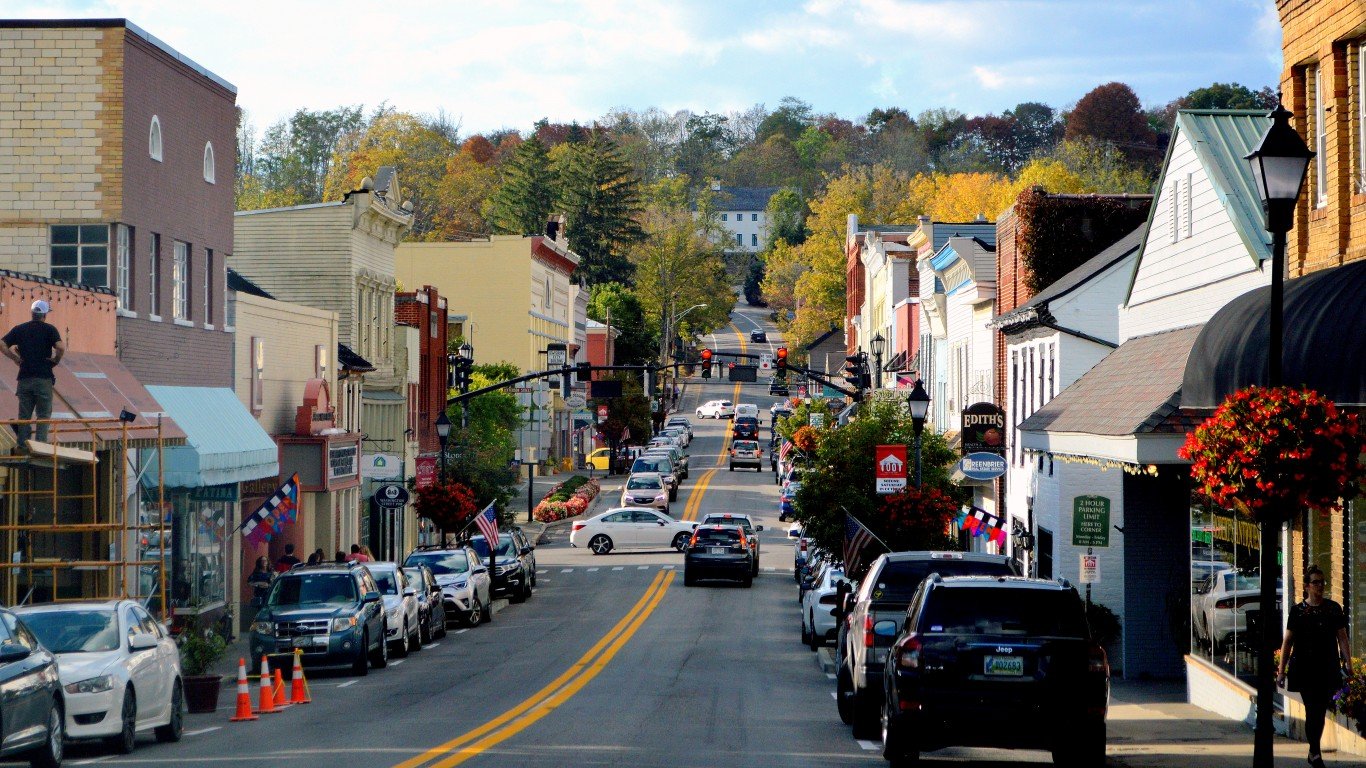
Pennsylvania: Lewisburg
> Avg. commute time (minutes): 10.4 (Pennsylvania: 27.1)
> Share of commuters driving alone: 44.3% (Pennsylvania: 74.4%)
> Share of commuters carpooling: 12.7% (Pennsylvania: 8.2%)
> Share of commuters using public transit: 0.0% reported (Pennsylvania: 5.2%)
> No. of towns considered in ranking: 572

Rhode Island: Kingston
> Avg. commute time (minutes): 17.1 (Rhode Island: 25.3)
> Share of commuters driving alone: 48.9% (Rhode Island: 79.7%)
> Share of commuters carpooling: 7.6% (Rhode Island: 8.1%)
> Share of commuters using public transit: 1.5% (Rhode Island: 2.2%)
> No. of towns considered in ranking: 12
[in-text-ad-2]

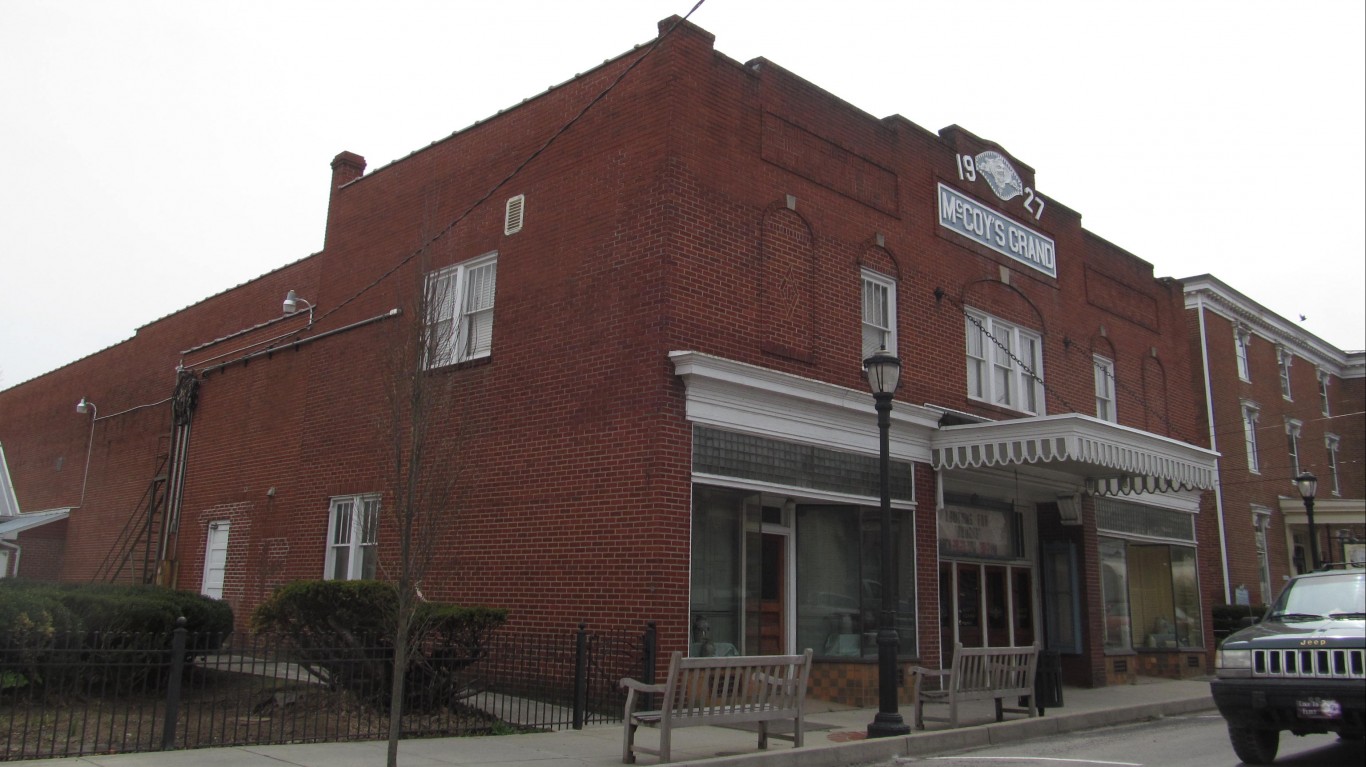
South Carolina: Hilltop
> Avg. commute time (minutes): 12.6 (South Carolina: 25.1)
> Share of commuters driving alone: 73.8% (South Carolina: 81.5%)
> Share of commuters carpooling: 10.5% (South Carolina: 8.9%)
> Share of commuters using public transit: 0.0% reported (South Carolina: 0.5%)
> No. of towns considered in ranking: 147
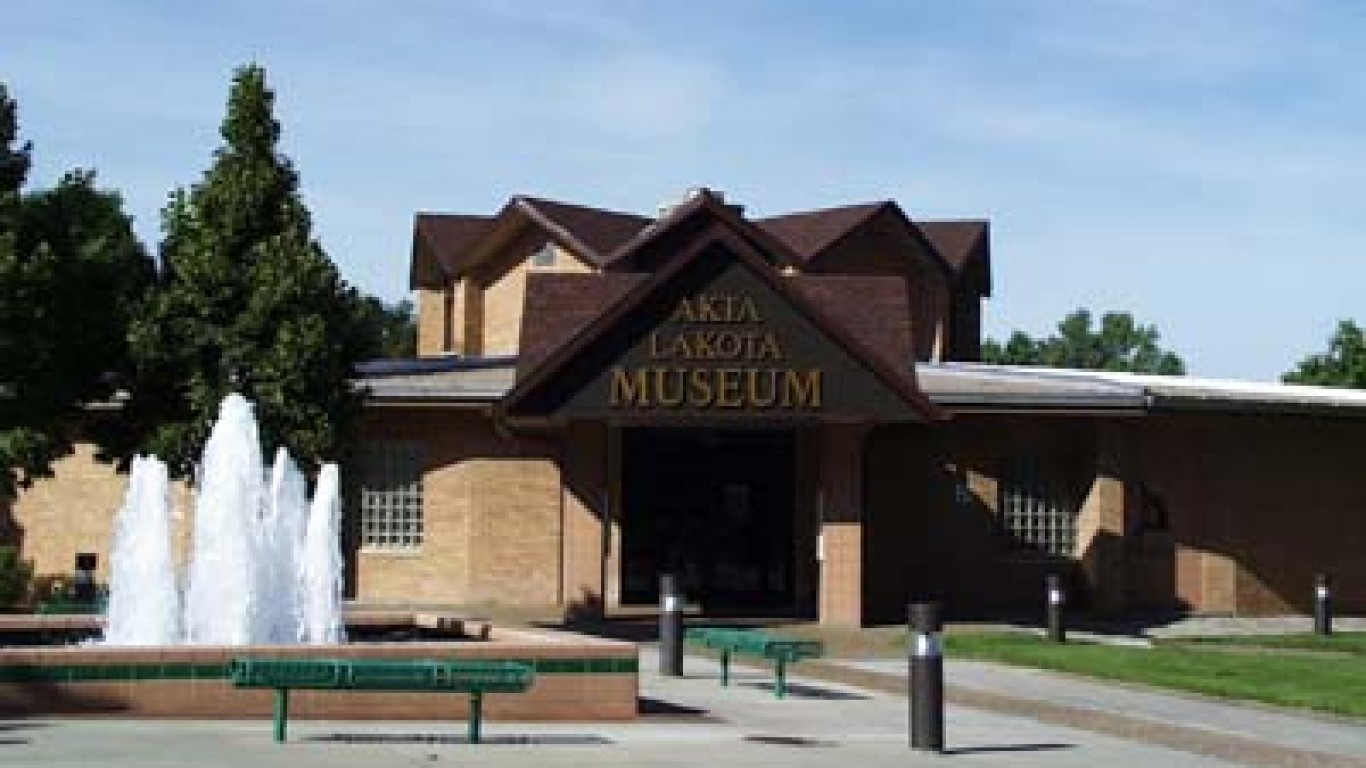
South Dakota: Chamberlain
> Avg. commute time (minutes): 9.0 (South Dakota: 17.3)
> Share of commuters driving alone: 80.9% (South Dakota: 80.0%)
> Share of commuters carpooling: 13.5% (South Dakota: 8.1%)
> Share of commuters using public transit: 0.0% reported (South Dakota: 0.5%)
> No. of towns considered in ranking: 37
[in-text-ad]
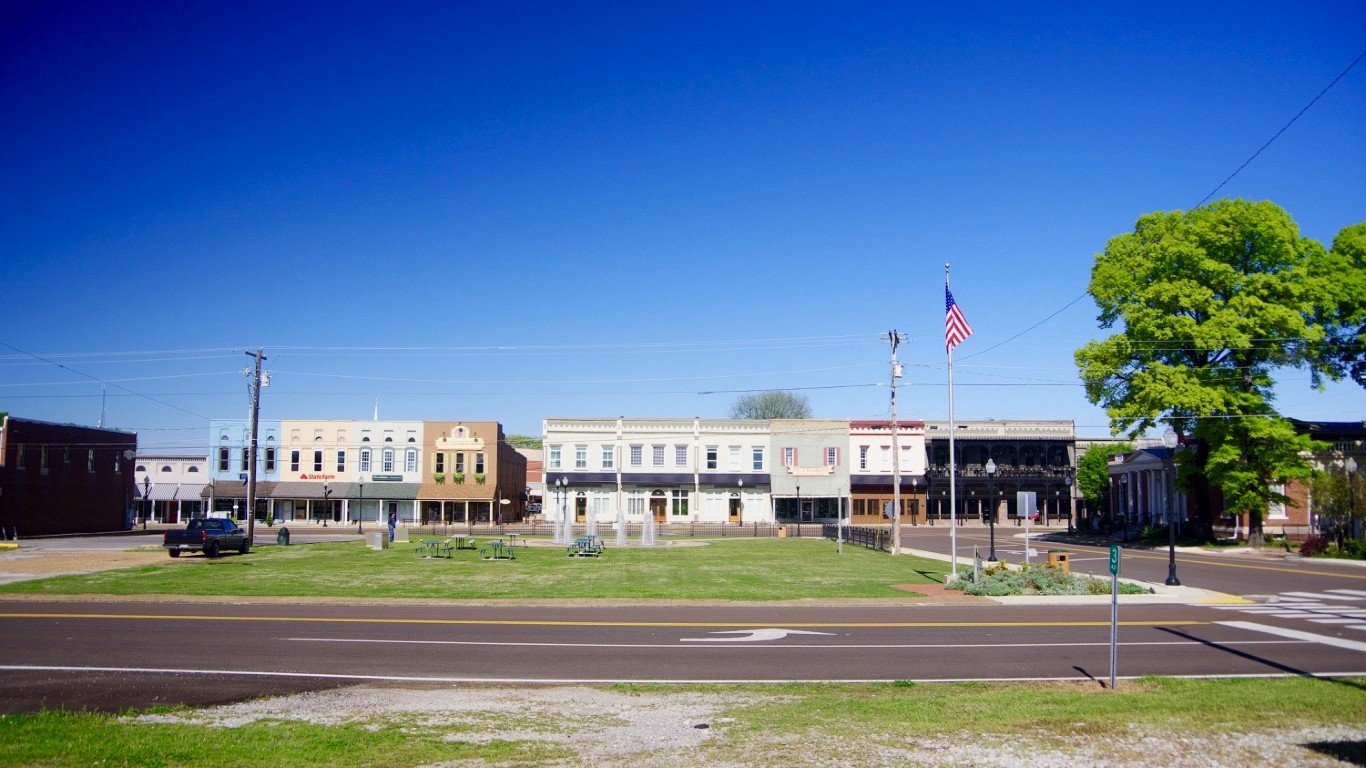
Tennessee: Martin
> Avg. commute time (minutes): 15.0 (Tennessee: 25.4)
> Share of commuters driving alone: 78.9% (Tennessee: 81.9%)
> Share of commuters carpooling: 6.2% (Tennessee: 8.8%)
> Share of commuters using public transit: 0.3% (Tennessee: 0.6%)
> No. of towns considered in ranking: 140
[recirclink id=1060122]

Texas: Laughlin AFB
> Avg. commute time (minutes): 6.2 (Texas: 26.6)
> Share of commuters driving alone: 79.6% (Texas: 78.7%)
> Share of commuters carpooling: 2.1% (Texas: 9.9%)
> Share of commuters using public transit: 0.0% reported (Texas: 1.3%)
> No. of towns considered in ranking: 485
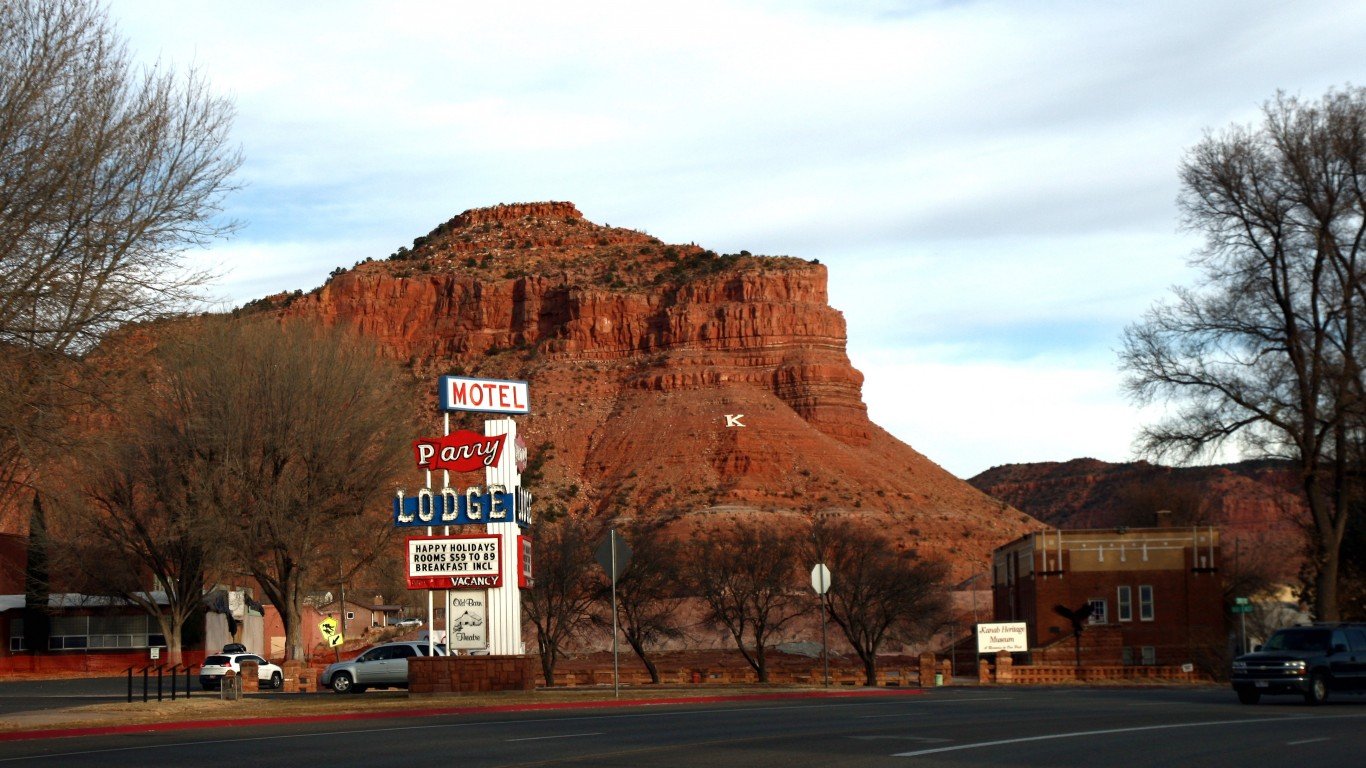
Utah: Kanab
> Avg. commute time (minutes): 7.9 (Utah: 22.0)
> Share of commuters driving alone: 70.6% (Utah: 74.4%)
> Share of commuters carpooling: 8.9% (Utah: 10.4%)
> Share of commuters using public transit: 0.0% reported (Utah: 2.2%)
> No. of towns considered in ranking: 78
[in-text-ad-2]
Vermont: White River Junction
> Avg. commute time (minutes): 11.8 (Vermont: 23.3)
> Share of commuters driving alone: 66.1% (Vermont: 74.4%)
> Share of commuters carpooling: 18.2% (Vermont: 8.5%)
> Share of commuters using public transit: 1.5% (Vermont: 1.2%)
> No. of towns considered in ranking: 23
Virginia: Camp Barrett
> Avg. commute time (minutes): 10.8 (Virginia: 28.6)
> Share of commuters driving alone: 37.3% (Virginia: 74.9%)
> Share of commuters carpooling: 5.3% (Virginia: 8.9%)
> Share of commuters using public transit: 2.9% (Virginia: 4.0%)
> No. of towns considered in ranking: 217
[in-text-ad]
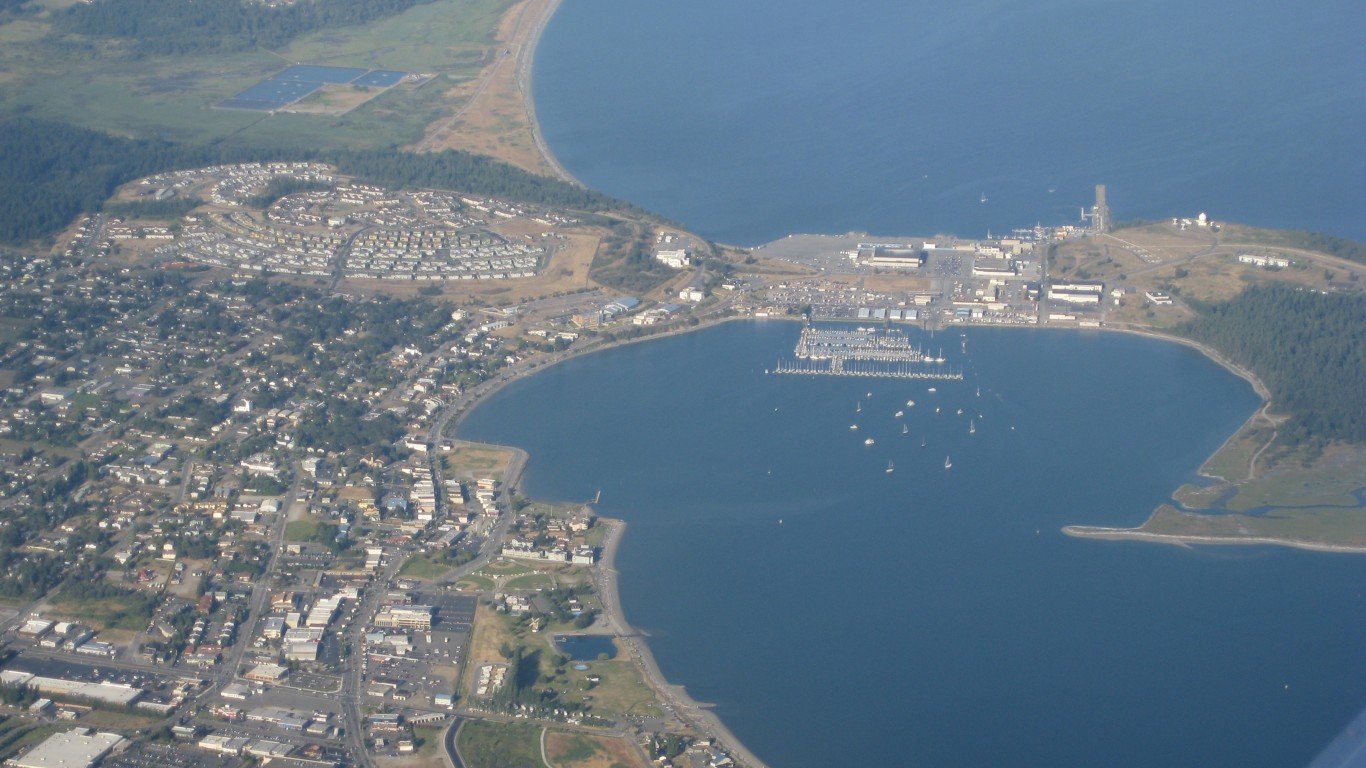
Washington: Whidbey Island Station
> Avg. commute time (minutes): 7.6 (Washington: 28.0)
> Share of commuters driving alone: 49.9% (Washington: 69.7%)
> Share of commuters carpooling: 17.8% (Washington: 9.7%)
> Share of commuters using public transit: 0.0% reported (Washington: 6.0%)
> No. of towns considered in ranking: 241
[recirclink id=1024519]
West Virginia: Moorefield
> Avg. commute time (minutes): 10.3 (West Virginia: 26.1)
> Share of commuters driving alone: 66.1% (West Virginia: 82.0%)
> Share of commuters carpooling: 28.8% (West Virginia: 8.6%)
> Share of commuters using public transit: 0.0% reported (West Virginia: 0.8%)
> No. of towns considered in ranking: 58

Wisconsin: Marinette
> Avg. commute time (minutes): 11.4 (Wisconsin: 22.2)
> Share of commuters driving alone: 87.5% (Wisconsin: 79.9%)
> Share of commuters carpooling: 5.5% (Wisconsin: 7.7%)
> Share of commuters using public transit: 0.2% (Wisconsin: 1.5%)
> No. of towns considered in ranking: 221
[in-text-ad-2]
Wyoming: Warren AFB
> Avg. commute time (minutes): 9.6 (Wyoming: 17.9)
> Share of commuters driving alone: 81.0% (Wyoming: 77.4%)
> Share of commuters carpooling: 13.2% (Wyoming: 10.0%)
> Share of commuters using public transit: 0.2% (Wyoming: 1.0%)
> No. of towns considered in ranking: 25
Methodology
To determine the town with the shortest commute in each state, 24/7 Wall St. reviewed five-year estimates of average commute times from the U.S. Census Bureau’s 2020 American Community Survey.
We used census “place” geographies — a category that includes incorporated legal entities and census-designated statistical entities. We defined towns based on population thresholds — having at least 1,000 people and less than 25,000 people.
Towns were excluded if average commute time estimates were not available in the 2020 ACS, if there were fewer than 1,000 workers 16 years and over who did not work from home, or if the sampling error associated with a town’s data was deemed too high.
The sampling error was defined as too high if the coefficient of variation — a statistical assessment of how reliable an estimate is — for a town’s average commute time was above 15% and greater than two standard deviations above the mean CV for all towns’ average commute times. We similarly excluded towns that had a sampling error too high for their population, using the same definition.
Towns were ranked based on their average commute time. To break ties, we used the share of workers with a commute of 15 minutes or less.
Additional information on the share of commuters driving alone, carpooling, and using public transit are also five-year estimates from the 2020 ACS. Because the Census Bureau didn’t release one-year estimates for 2020 due to data collection issues caused by the COVID-19 pandemic, all ACS data are five-year estimates.
Contact [email protected] for any questions or corrections.