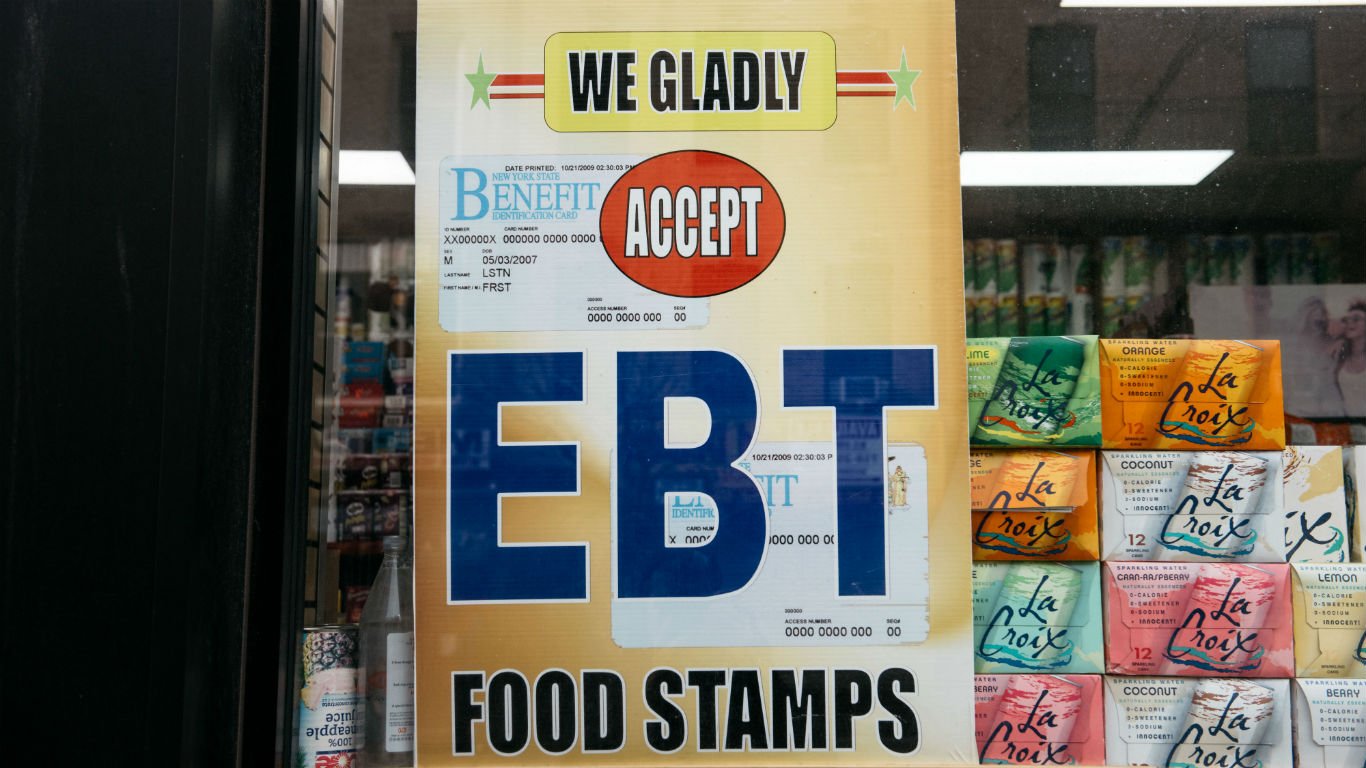
In June, California announced it would be sending $1,050 checks to approximately 23 million residents to combat the devastating effects inflation has had on state residents. Even if other U.S. states were to follow suit and issue their own so-called inflation relief checks, the checks likely would not be enough on their own for needy families. One long-standing program that millions of Americans rely on is the government’s food assistance benefits, the Supplemental Nutrition Assistance Program.
As of 2020, roughly 13.8 million U.S. households received SNAP benefits, formerly known as food stamps. To find the county with the highest SNAP recipiency rate in every state, 24/7 Wall St. reviewed five-year estimates of the share of households that received SNAP benefits in the 12 months prior to the survey from the U.S. Census Bureau’s 2020 American Community Survey.
As of 2020, 11.4% of U.S. households received SNAP benefits. In every state with the exception of Wyoming, there is one county or county equivalent where a higher share of households received nutrition assistance. Among the county or county equivalents in each state with the highest SNAP recipiency rate, that figure ranges from 9.2% to 55.0%.
While factors such as assets and household composition impact whether a household qualifies for the benefit, SNAP recipiency is primarily determined by income. Roughly two-thirds of the counties with the highest SNAP recipiency rate in each state also have poverty rates that rank among the three highest in their respective states. Oglala Lakota County, South Dakota, has a SNAP recipiency rate of 55.0% and a poverty rate of 44.8%, the highest and third highest shares, respectively, in the country. These are the states where the most children live in Poverty.
Because income is the primary determinant for SNAP recipiency, unemployment is strongly linked to how many people receive benefits, as those workers who are out of a job are likely to have little to no income. Just over half of the counties with the highest SNAP recipiency rate in their state also have the highest or second highest five-year unemployment rate in their state. These are the states with the worst spikes in unemployment since the pandemic began.
Click here to see the county with the highest SNAP recipiency rate in every state
Click here to read our detailed methodology

Alabama: Perry County
> Households receiving SNAP benefits: 33.4% (Alabama: 13.4%)
> Poverty rate: 36.1% (Alabama: 16.0%)
> Median household income: $23,875 (Alabama: $52,035)
> Unemployment rate: 11.4% (Alabama: 5.5%)
> No. of counties considered in ranking: 67
[in-text-ad]

Alaska: Kusilvak Census Area
> Households receiving SNAP benefits: 55.0% (Alaska: 10.3%)
> Poverty rate: 37.9% (Alaska: 10.3%)
> Median household income: $37,358 (Alaska: $77,790)
> Unemployment rate: 22.4% (Alaska: 6.8%)
> No. of counties considered in ranking: 23
[recirclink id=1112369]

Arizona: Apache County
> Households receiving SNAP benefits: 27.9% (Arizona: 10.5%)
> Poverty rate: 34.4% (Arizona: 14.1%)
> Median household income: $33,967 (Arizona: $61,529)
> Unemployment rate: 9.4% (Arizona: 5.8%)
> No. of counties considered in ranking: 15

Arkansas: Phillips County
> Households receiving SNAP benefits: 30.5% (Arkansas: 11.7%)
> Poverty rate: 31.3% (Arkansas: 16.1%)
> Median household income: $33,724 (Arkansas: $49,475)
> Unemployment rate: 14.3% (Arkansas: 5.2%)
> No. of counties considered in ranking: 75
[in-text-ad-2]
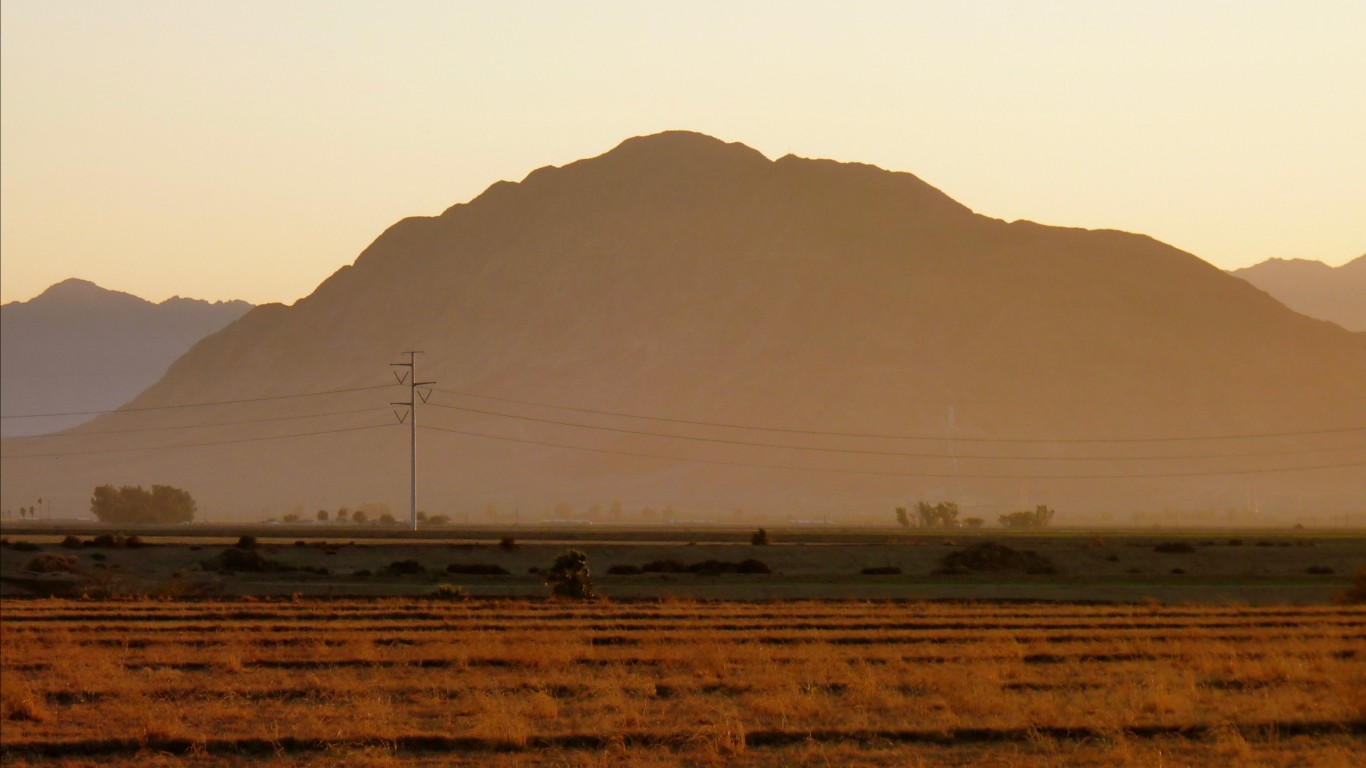
California: Imperial County
> Households receiving SNAP benefits: 23.6% (California: 9.0%)
> Poverty rate: 22.5% (California: 12.6%)
> Median household income: $46,222 (California: $78,672)
> Unemployment rate: 13.6% (California: 6.1%)
> No. of counties considered in ranking: 55
Colorado: Costilla County
> Households receiving SNAP benefits: 31.4% (Colorado: 7.2%)
> Poverty rate: 26.6% (Colorado: 9.8%)
> Median household income: $34,732 (Colorado: $75,231)
> Unemployment rate: 9.3% (Colorado: 4.6%)
> No. of counties considered in ranking: 56
[in-text-ad]

Connecticut: Hartford County
> Households receiving SNAP benefits: 14.7% (Connecticut: 11.6%)
> Poverty rate: 10.8% (Connecticut: 9.8%)
> Median household income: $76,259 (Connecticut: $79,855)
> Unemployment rate: 5.8% (Connecticut: 6.0%)
> No. of counties considered in ranking: 8
[recirclink id=1111559]

Delaware: Kent County
> Households receiving SNAP benefits: 14.8% (Delaware: 10.6%)
> Poverty rate: 13.2% (Delaware: 11.4%)
> Median household income: $60,117 (Delaware: $69,110)
> Unemployment rate: 6.0% (Delaware: 5.8%)
> No. of counties considered in ranking: 3

Florida: Hamilton County
> Households receiving SNAP benefits: 33.0% (Florida: 13.2%)
> Poverty rate: 25.7% (Florida: 13.3%)
> Median household income: $38,300 (Florida: $57,703)
> Unemployment rate: 10.0% (Florida: 5.4%)
> No. of counties considered in ranking: 67
[in-text-ad-2]

Georgia: Randolph County
> Households receiving SNAP benefits: 36.5% (Georgia: 12.2%)
> Poverty rate: 29.7% (Georgia: 14.3%)
> Median household income: $29,400 (Georgia: $61,224)
> Unemployment rate: 8.8% (Georgia: 5.5%)
> No. of counties considered in ranking: 159

Hawaii: Hawaii County
> Households receiving SNAP benefits: 19.1% (Hawaii: 10.7%)
> Poverty rate: 14.0% (Hawaii: 9.3%)
> Median household income: $65,401 (Hawaii: $83,173)
> Unemployment rate: 6.3% (Hawaii: 4.3%)
> No. of counties considered in ranking: 4
[in-text-ad]

Idaho: Shoshone County
> Households receiving SNAP benefits: 16.0% (Idaho: 9.0%)
> Poverty rate: 15.4% (Idaho: 11.9%)
> Median household income: $40,483 (Idaho: $58,915)
> Unemployment rate: 8.6% (Idaho: 4.2%)
> No. of counties considered in ranking: 41
[recirclink id=1047662]

Illinois: Saline County
> Households receiving SNAP benefits: 25.5% (Illinois: 12.4%)
> Poverty rate: 18.3% (Illinois: 12.0%)
> Median household income: $43,928 (Illinois: $68,428)
> Unemployment rate: 7.9% (Illinois: 5.9%)
> No. of counties considered in ranking: 102

Indiana: Fayette County
> Households receiving SNAP benefits: 16.9% (Indiana: 9.3%)
> Poverty rate: 18.2% (Indiana: 12.9%)
> Median household income: $47,465 (Indiana: $58,235)
> Unemployment rate: 4.4% (Indiana: 4.7%)
> No. of counties considered in ranking: 92
[in-text-ad-2]

Iowa: Wapello County
> Households receiving SNAP benefits: 18.5% (Iowa: 9.8%)
> Poverty rate: 16.6% (Iowa: 11.1%)
> Median household income: $46,433 (Iowa: $61,836)
> Unemployment rate: 5.1% (Iowa: 3.9%)
> No. of counties considered in ranking: 99

Kansas: Logan County
> Households receiving SNAP benefits: 14.3% (Kansas: 7.2%)
> Poverty rate: 11.5% (Kansas: 11.4%)
> Median household income: $51,136 (Kansas: $61,091)
> Unemployment rate: 0.6% (Kansas: 4.0%)
> No. of counties considered in ranking: 83
[in-text-ad]

Kentucky: Lee County
> Households receiving SNAP benefits: 38.1% (Kentucky: 13.0%)
> Poverty rate: 32.2% (Kentucky: 16.6%)
> Median household income: $24,699 (Kentucky: $52,238)
> Unemployment rate: 10.1% (Kentucky: 5.3%)
> No. of counties considered in ranking: 120
[recirclink id=1104870]

Louisiana: Madison Parish
> Households receiving SNAP benefits: 30.7% (Louisiana: 15.3%)
> Poverty rate: 36.1% (Louisiana: 18.6%)
> Median household income: $32,585 (Louisiana: $50,800)
> Unemployment rate: 9.8% (Louisiana: 6.5%)
> No. of counties considered in ranking: 63

Maine: Washington County
> Households receiving SNAP benefits: 20.0% (Maine: 12.6%)
> Poverty rate: 18.1% (Maine: 11.1%)
> Median household income: $44,847 (Maine: $59,489)
> Unemployment rate: 7.1% (Maine: 4.0%)
> No. of counties considered in ranking: 16
[in-text-ad-2]
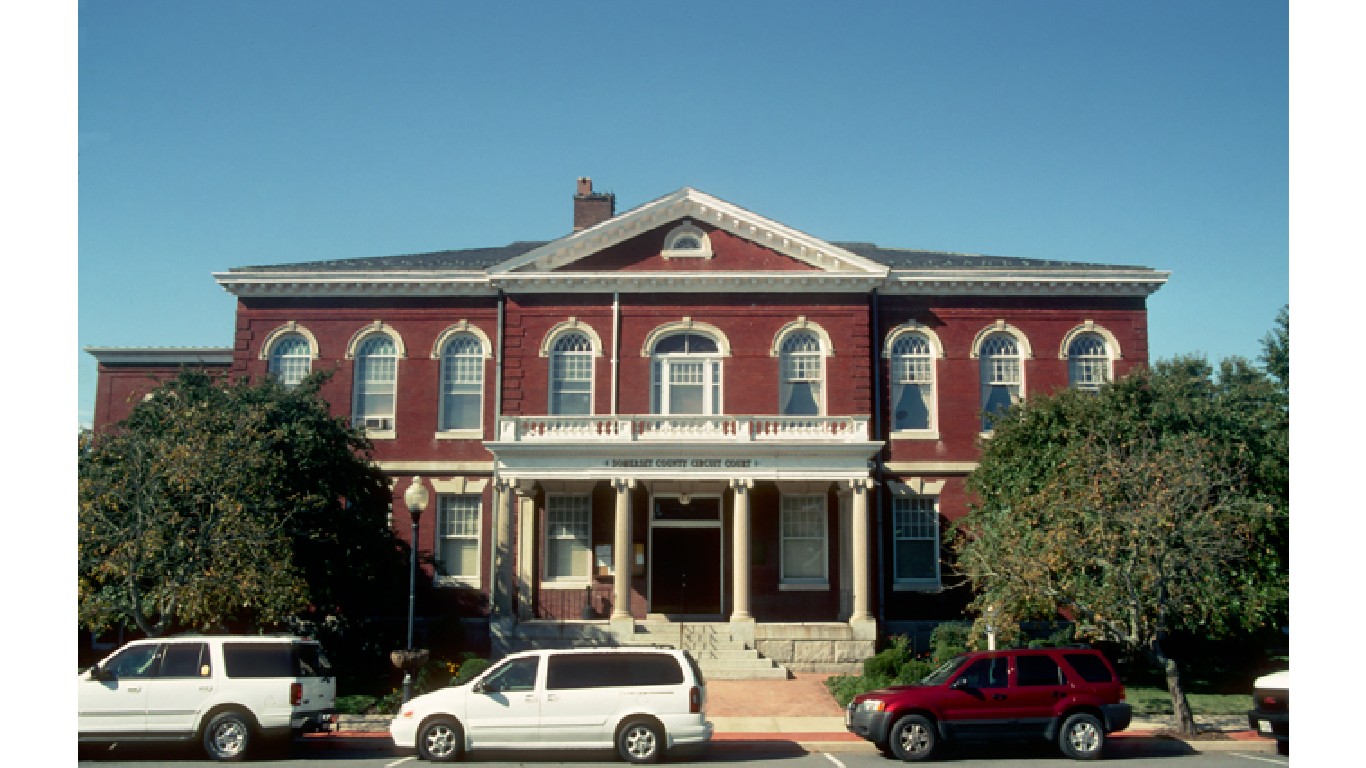
Maryland: Somerset County
> Households receiving SNAP benefits: 24.8% (Maryland: 10.1%)
> Poverty rate: 20.0% (Maryland: 9.0%)
> Median household income: $44,980 (Maryland: $87,063)
> Unemployment rate: 9.2% (Maryland: 5.1%)
> No. of counties considered in ranking: 24

Massachusetts: Hampden County
> Households receiving SNAP benefits: 21.6% (Massachusetts: 11.6%)
> Poverty rate: 15.7% (Massachusetts: 9.8%)
> Median household income: $57,623 (Massachusetts: $84,385)
> Unemployment rate: 6.2% (Massachusetts: 5.1%)
> No. of counties considered in ranking: 13
[in-text-ad]

Michigan: Wayne County
> Households receiving SNAP benefits: 22.0% (Michigan: 12.7%)
> Poverty rate: 21.3% (Michigan: 13.7%)
> Median household income: $49,359 (Michigan: $59,234)
> Unemployment rate: 8.9% (Michigan: 6.0%)
> No. of counties considered in ranking: 83
[recirclink id=1100321]

Minnesota: Mahnomen County
> Households receiving SNAP benefits: 22.5% (Minnesota: 7.5%)
> Poverty rate: 21.0% (Minnesota: 9.3%)
> Median household income: $45,398 (Minnesota: $73,382)
> Unemployment rate: 9.0% (Minnesota: 3.8%)
> No. of counties considered in ranking: 87

Mississippi: Sharkey County
> Households receiving SNAP benefits: 37.7% (Mississippi: 14.6%)
> Poverty rate: 24.1% (Mississippi: 19.6%)
> Median household income: $35,711 (Mississippi: $46,511)
> Unemployment rate: 10.4% (Mississippi: 7.1%)
> No. of counties considered in ranking: 81
[in-text-ad-2]

Missouri: Pemiscot County
> Households receiving SNAP benefits: 34.2% (Missouri: 10.5%)
> Poverty rate: 30.0% (Missouri: 13.0%)
> Median household income: $34,709 (Missouri: $57,290)
> Unemployment rate: 11.3% (Missouri: 4.5%)
> No. of counties considered in ranking: 115

Montana: Glacier County
> Households receiving SNAP benefits: 20.2% (Montana: 9.3%)
> Poverty rate: 29.7% (Montana: 12.8%)
> Median household income: $37,645 (Montana: $56,539)
> Unemployment rate: 6.3% (Montana: 4.1%)
> No. of counties considered in ranking: 43
[in-text-ad]
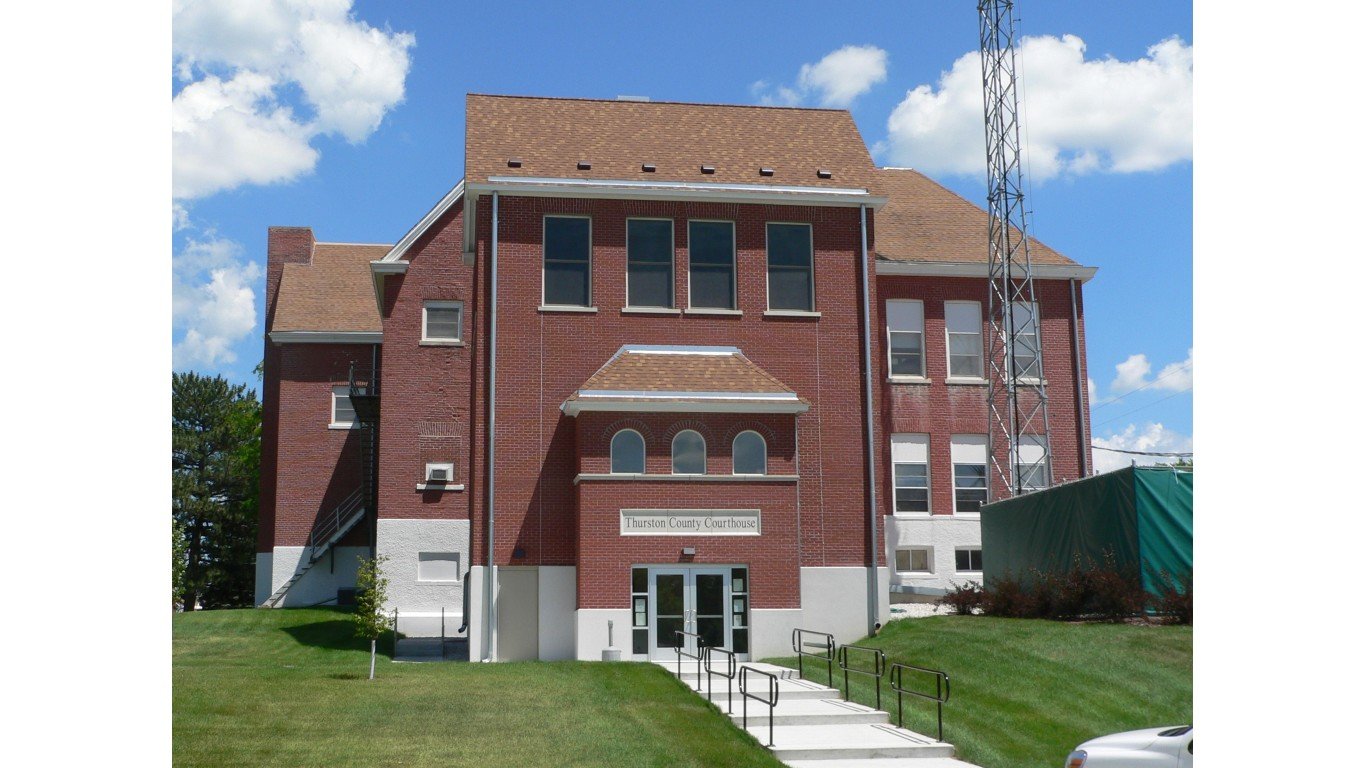
Nebraska: Thurston County
> Households receiving SNAP benefits: 18.3% (Nebraska: 8.1%)
> Poverty rate: 21.2% (Nebraska: 10.4%)
> Median household income: $55,574 (Nebraska: $63,015)
> Unemployment rate: 11.8% (Nebraska: 3.4%)
> No. of counties considered in ranking: 76
[recirclink id=1112369]

Nevada: Mineral County
> Households receiving SNAP benefits: 18.3% (Nevada: 11.6%)
> Poverty rate: 20.8% (Nevada: 12.8%)
> Median household income: $31,500 (Nevada: $62,043)
> Unemployment rate: 12.1% (Nevada: 6.5%)
> No. of counties considered in ranking: 13

New Hampshire: Coos County
> Households receiving SNAP benefits: 12.1% (New Hampshire: 6.4%)
> Poverty rate: 11.7% (New Hampshire: 7.4%)
> Median household income: $48,945 (New Hampshire: $77,923)
> Unemployment rate: 5.0% (New Hampshire: 3.7%)
> No. of counties considered in ranking: 10
[in-text-ad-2]

New Jersey: Passaic County
> Households receiving SNAP benefits: 18.0% (New Jersey: 8.4%)
> Poverty rate: 14.8% (New Jersey: 9.7%)
> Median household income: $73,562 (New Jersey: $85,245)
> Unemployment rate: 6.2% (New Jersey: 5.8%)
> No. of counties considered in ranking: 21

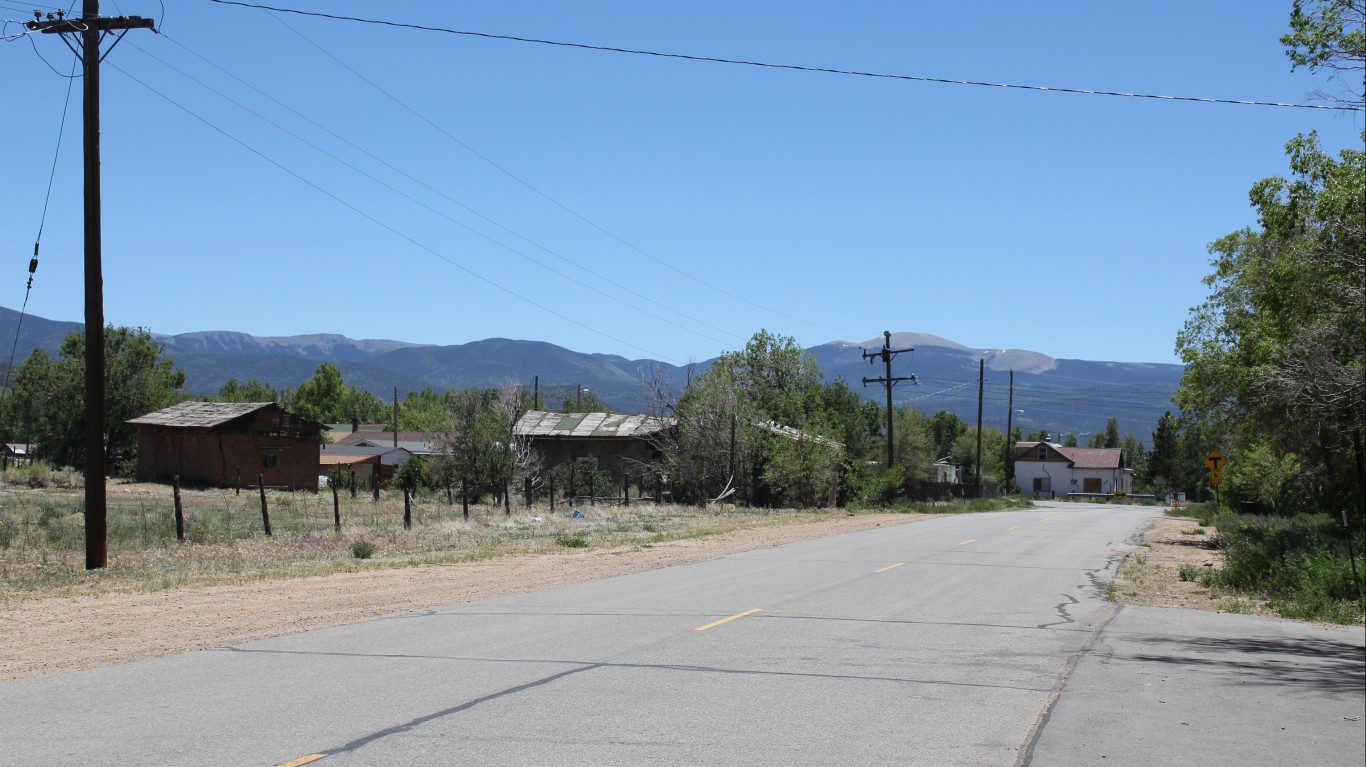
New Mexico: San Miguel County
> Households receiving SNAP benefits: 30.3% (New Mexico: 17.0%)
> Poverty rate: 25.7% (New Mexico: 18.6%)
> Median household income: $32,310 (New Mexico: $51,243)
> Unemployment rate: 5.7% (New Mexico: 6.5%)
> No. of counties considered in ranking: 31
[in-text-ad]

New York: Bronx County
> Households receiving SNAP benefits: 35.2% (New York: 14.3%)
> Poverty rate: 27.0% (New York: 13.6%)
> Median household income: $41,895 (New York: $71,117)
> Unemployment rate: 10.0% (New York: 5.7%)
> No. of counties considered in ranking: 62
[recirclink id=1111559]

North Carolina: Halifax County
> Households receiving SNAP benefits: 28.5% (North Carolina: 12.0%)
> Poverty rate: 25.6% (North Carolina: 14.0%)
> Median household income: $35,904 (North Carolina: $56,642)
> Unemployment rate: 6.5% (North Carolina: 5.3%)
> No. of counties considered in ranking: 100
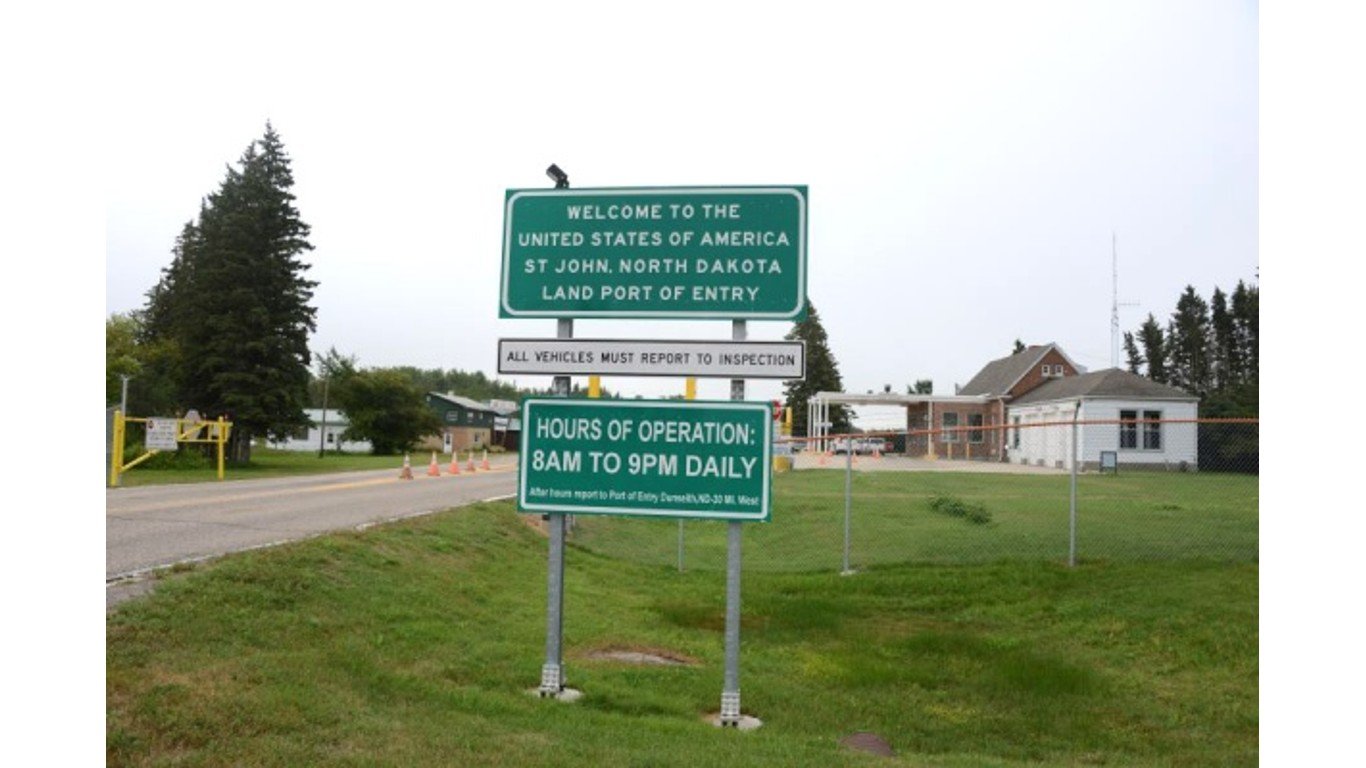
North Dakota: Rolette County
> Households receiving SNAP benefits: 25.4% (North Dakota: 6.6%)
> Poverty rate: 26.7% (North Dakota: 10.5%)
> Median household income: $46,481 (North Dakota: $65,315)
> Unemployment rate: 6.8% (North Dakota: 3.0%)
> No. of counties considered in ranking: 41
[in-text-ad-2]

Ohio: Scioto County
> Households receiving SNAP benefits: 27.8% (Ohio: 12.6%)
> Poverty rate: 23.0% (Ohio: 13.6%)
> Median household income: $41,866 (Ohio: $58,116)
> Unemployment rate: 6.9% (Ohio: 5.3%)
> No. of counties considered in ranking: 88

Oklahoma: Greer County
> Households receiving SNAP benefits: 23.6% (Oklahoma: 12.6%)
> Poverty rate: 17.8% (Oklahoma: 15.3%)
> Median household income: $46,794 (Oklahoma: $53,840)
> Unemployment rate: 5.2% (Oklahoma: 5.0%)
> No. of counties considered in ranking: 77
[in-text-ad]

Oregon: Jefferson County
> Households receiving SNAP benefits: 28.0% (Oregon: 15.0%)
> Poverty rate: 14.3% (Oregon: 12.4%)
> Median household income: $55,844 (Oregon: $65,667)
> Unemployment rate: 9.5% (Oregon: 5.4%)
> No. of counties considered in ranking: 36
[recirclink id=1047662]

Pennsylvania: Philadelphia County
> Households receiving SNAP benefits: 25.2% (Pennsylvania: 13.1%)
> Poverty rate: 23.1% (Pennsylvania: 12.0%)
> Median household income: $49,127 (Pennsylvania: $63,627)
> Unemployment rate: 8.8% (Pennsylvania: 5.3%)
> No. of counties considered in ranking: 67

Rhode Island: Providence County
> Households receiving SNAP benefits: 18.6% (Rhode Island: 14.8%)
> Poverty rate: 14.0% (Rhode Island: 11.6%)
> Median household income: $62,323 (Rhode Island: $70,305)
> Unemployment rate: 5.9% (Rhode Island: 5.5%)
> No. of counties considered in ranking: 5
[in-text-ad-2]

South Carolina: Allendale County
> Households receiving SNAP benefits: 29.5% (South Carolina: 11.2%)
> Poverty rate: 28.0% (South Carolina: 14.7%)
> Median household income: $26,074 (South Carolina: $54,864)
> Unemployment rate: 12.9% (South Carolina: 5.5%)
> No. of counties considered in ranking: 46

South Dakota: Oglala Lakota County
> Households receiving SNAP benefits: 55.0% (South Dakota: 8.7%)
> Poverty rate: 44.8% (South Dakota: 12.8%)
> Median household income: $31,423 (South Dakota: $59,896)
> Unemployment rate: 16.3% (South Dakota: 3.5%)
> No. of counties considered in ranking: 52
[in-text-ad]

Tennessee: Lake County
> Households receiving SNAP benefits: 32.3% (Tennessee: 12.6%)
> Poverty rate: 31.0% (Tennessee: 14.6%)
> Median household income: $34,230 (Tennessee: $54,833)
> Unemployment rate: 12.3% (Tennessee: 5.3%)
> No. of counties considered in ranking: 95
[recirclink id=1104870]

Texas: Presidio County
> Households receiving SNAP benefits: 43.5% (Texas: 11.5%)
> Poverty rate: 39.9% (Texas: 14.2%)
> Median household income: $22,716 (Texas: $63,826)
> Unemployment rate: 9.9% (Texas: 5.3%)
> No. of counties considered in ranking: 223

Utah: San Juan County
> Households receiving SNAP benefits: 15.2% (Utah: 6.2%)
> Poverty rate: 22.8% (Utah: 9.1%)
> Median household income: $49,690 (Utah: $74,197)
> Unemployment rate: 11.9% (Utah: 3.6%)
> No. of counties considered in ranking: 25
[in-text-ad-2]

Vermont: Orleans County
> Households receiving SNAP benefits: 15.7% (Vermont: 10.6%)
> Poverty rate: 12.3% (Vermont: 10.8%)
> Median household income: $54,390 (Vermont: $63,477)
> Unemployment rate: 4.2% (Vermont: 3.8%)
> No. of counties considered in ranking: 14
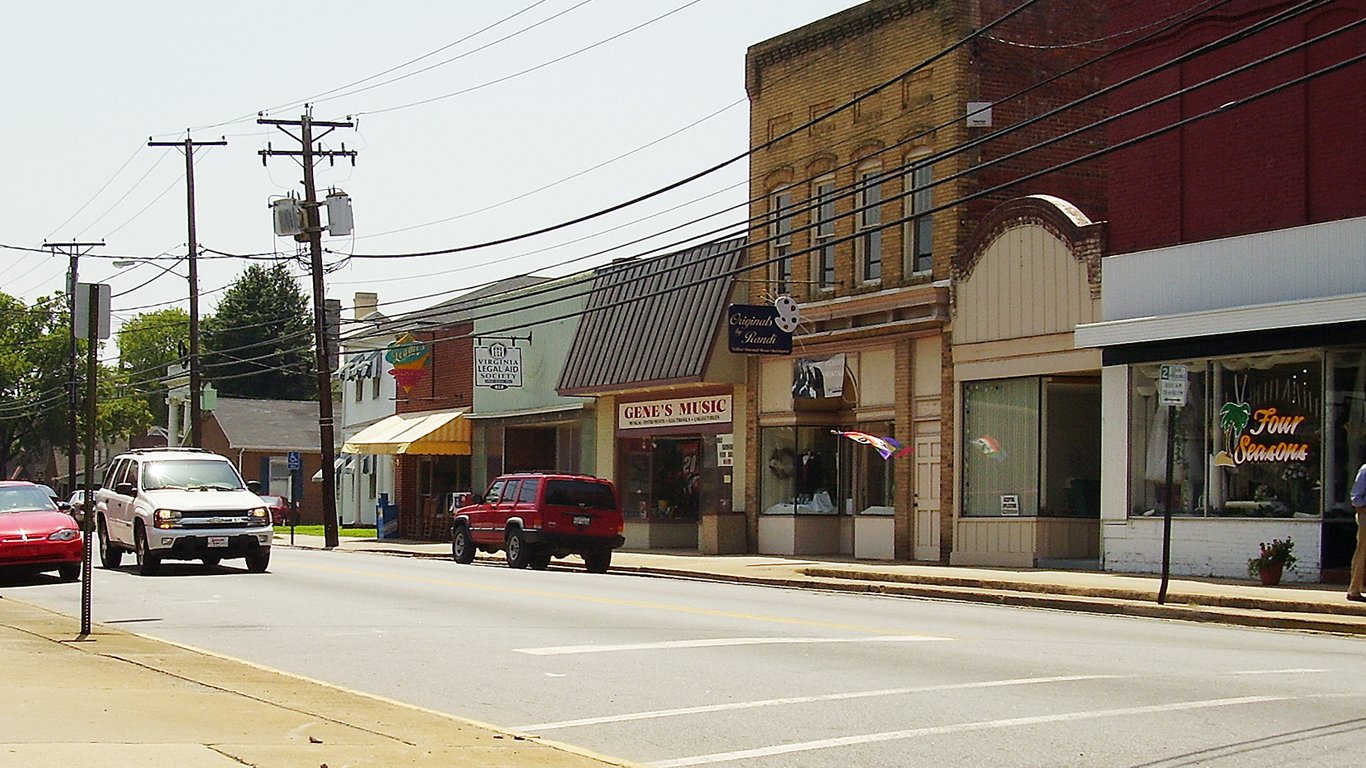
Virginia: Emporia city
> Households receiving SNAP benefits: 31.0% (Virginia: 7.9%)
> Poverty rate: 21.8% (Virginia: 10.0%)
> Median household income: $30,058 (Virginia: $76,398)
> Unemployment rate: 16.7% (Virginia: 4.5%)
> No. of counties considered in ranking: 128
[in-text-ad]

Washington: Yakima County
> Households receiving SNAP benefits: 21.5% (Washington: 11.1%)
> Poverty rate: 16.5% (Washington: 10.2%)
> Median household income: $54,917 (Washington: $77,006)
> Unemployment rate: 6.4% (Washington: 4.8%)
> No. of counties considered in ranking: 39
[recirclink id=1100321]

West Virginia: McDowell County
> Households receiving SNAP benefits: 35.0% (West Virginia: 16.5%)
> Poverty rate: 32.8% (West Virginia: 17.1%)
> Median household income: $26,072 (West Virginia: $48,037)
> Unemployment rate: 15.0% (West Virginia: 6.5%)
> No. of counties considered in ranking: 55

Wisconsin: Menominee County
> Households receiving SNAP benefits: 23.1% (Wisconsin: 10.2%)
> Poverty rate: 28.3% (Wisconsin: 11.0%)
> Median household income: $47,188 (Wisconsin: $63,293)
> Unemployment rate: 10.4% (Wisconsin: 3.5%)
> No. of counties considered in ranking: 72
[in-text-ad-2]

Wyoming: Hot Springs County
> Households receiving SNAP benefits: 9.2% (Wyoming: 5.3%)
> Poverty rate: 13.9% (Wyoming: 10.8%)
> Median household income: $53,398 (Wyoming: $65,304)
> Unemployment rate: 2.9% (Wyoming: 4.3%)
> No. of counties considered in ranking: 16
Methodology
To determine the county with the highest SNAP recipiency rate in every state, 24/7 Wall St. reviewed five-year estimates of the share of households that received SNAP benefits in the 12 months prior to the survey from the U.S. Census Bureau’s 2020 American Community Survey.
Counties were excluded if the SNAP recipiency rate was not available in the 2020 ACS, if there were fewer than 500 households, or if the sampling error associated with a county’s data was deemed too high.
The sampling error was defined as too high if the coefficient of variation — a statistical assessment of how reliable an estimate is — for a county’s SNAP recipiency rate was above 15% and greater than two standard deviations above the mean CV for all counties’ SNAP recipiency rates. We similarly excluded counties that had a sampling error too high for their population, using the same definition.
Counties were ranked based on the share of households that received SNAP benefits in the previous 12 months. To break ties, we used the number of households that received SNAP benefits in the previous 12 months.
Additional information on poverty rate, median household income, and unemployment rate are also five-year estimates from the 2020 ACS. Because the Census Bureau didn’t release one-year estimates for 2020 due to data collection issues caused by the COVID-19 pandemic, all ACS data are five-year estimates.
Contact [email protected] for any questions or corrections.