In June, California announced it would be sending $1,050 checks to approximately 23 million residents to combat the devastating effects inflation has had on state residents. Even if other U.S. states were to follow suit and issue their own so-called inflation relief checks, the checks likely would not be enough on their own for needy families. One long-standing program that millions of Americans rely on is the government’s food assistance benefits, the Supplemental Nutrition Assistance Program.
As of 2020, roughly 13.8 million U.S. households received SNAP benefits, formerly known as food stamps. To determine the ZIP codes with the highest SNAP recipiency rate in every state, 24/7 Wall St. reviewed five-year estimates of the share of households that received SNAP benefits in the 12 months prior to the survey from the U.S. Census Bureau’s 2020 American Community Survey.
As of 2020, 11.4% of U.S. households received SNAP benefits. In every state there is at least one ZIP code where a higher share of households received nutrition assistance. Among the ZIP codes in each state with the highest SNAP recipiency rate, that figure ranges from 20.4% to 71.5%.
While factors such as assets and household composition impact whether a household qualifies for the benefit, SNAP recipiency is primarily determined by income. Roughly half of the ZIP codes with the highest SNAP recipiency rate in each state also have poverty rates that rank among the three highest in their respective states. ZIP 06702, in downtown Waterbury, Connecticut, has a SNAP recipiency rate of 71.5% and a poverty rate of 63.5%, the highest and sixth highest shares, respectively, in the country. These are the states where the most children live in Poverty.
Because income is the primary determinant for SNAP recipiency, unemployment is strongly linked to how many people receive benefits, as those workers who are out of a job are likely to have little to no income. All but two of the ZIP codes with the highest SNAP recipiency rates in each state have a five-year unemployment rate higher than the national five-year unemployment rate of 5.3%. ZIP 25034 in central West Virginia has a five-year unemployment rate of 36.0%, the second highest unemployment rate in the country. These are the states with the worst spikes in unemployment since the pandemic began.
Click here to see the zip code with the highest SNAP recipiency rate in every state.
Click here to read our detailed methodology.

Alabama: 36775
> Location: Sardis
> Households receiving SNAP benefits: 59.3% (Alabama: 13.4%)
> Poverty rate: 22.8% (Alabama: 16.0%)
> Median household income: $47,500 (Alabama: $52,035)
> Unemployment rate: 32.0% (Alabama: 5.5%)
> No. of zip codes considered in ranking: 457
[in-text-ad]

Alaska: 99559
> Location: Bethel
> Households receiving SNAP benefits: 27.9% (Alaska: 10.3%)
> Poverty rate: 20.8% (Alaska: 10.3%)
> Median household income: $80,698 (Alaska: $77,790)
> Unemployment rate: 11.4% (Alaska: 6.8%)
> No. of zip codes considered in ranking: 51
[recirclink id=1112369]

Arizona: 85550
> Location: San Carlos
> Households receiving SNAP benefits: 51.5% (Arizona: 10.5%)
> Poverty rate: 46.9% (Arizona: 14.1%)
> Median household income: $34,881 (Arizona: $61,529)
> Unemployment rate: 17.7% (Arizona: 5.8%)
> No. of zip codes considered in ranking: 293

Arkansas: 72342
> Location: Helena-West Helena
> Households receiving SNAP benefits: 36.5% (Arkansas: 11.7%)
> Poverty rate: 30.8% (Arkansas: 16.1%)
> Median household income: $35,113 (Arkansas: $49,475)
> Unemployment rate: 14.2% (Arkansas: 5.2%)
> No. of zip codes considered in ranking: 283
[in-text-ad-2]

California: 93701
> Location: Fresno
> Households receiving SNAP benefits: 46.2% (California: 9.0%)
> Poverty rate: 44.8% (California: 12.6%)
> Median household income: $23,356 (California: $78,672)
> Unemployment rate: 12.8% (California: 6.1%)
> No. of zip codes considered in ranking: 1,247

Colorado: 81152
> Location: San Luis
> Households receiving SNAP benefits: 39.6% (Colorado: 7.2%)
> Poverty rate: 25.5% (Colorado: 9.8%)
> Median household income: $26,290 (Colorado: $75,231)
> Unemployment rate: 7.8% (Colorado: 4.6%)
> No. of zip codes considered in ranking: 284
[in-text-ad]

Connecticut: 06702
> Location: Waterbury
> Households receiving SNAP benefits: 71.5% (Connecticut: 11.6%)
> Poverty rate: 63.7% (Connecticut: 9.8%)
> Median household income: $11,663 (Connecticut: $79,855)
> Unemployment rate: 25.9% (Connecticut: 6.0%)
> No. of zip codes considered in ranking: 222
[recirclink id=1111559]

Delaware: 19801
> Location: Wilmington
> Households receiving SNAP benefits: 31.8% (Delaware: 10.6%)
> Poverty rate: 29.4% (Delaware: 11.4%)
> Median household income: $33,410 (Delaware: $69,110)
> Unemployment rate: 12.4% (Delaware: 5.8%)
> No. of zip codes considered in ranking: 46

Florida: 34950
> Location: Fort Pierce
> Households receiving SNAP benefits: 48.6% (Florida: 13.2%)
> Poverty rate: 35.8% (Florida: 13.3%)
> Median household income: $33,839 (Florida: $57,703)
> Unemployment rate: 9.7% (Florida: 5.4%)
> No. of zip codes considered in ranking: 860
[in-text-ad-2]

Georgia: 31903
> Location: Columbus
> Households receiving SNAP benefits: 44.1% (Georgia: 12.2%)
> Poverty rate: 42.0% (Georgia: 14.3%)
> Median household income: $23,750 (Georgia: $61,224)
> Unemployment rate: 14.2% (Georgia: 5.5%)
> No. of zip codes considered in ranking: 562

Hawaii: 96737
> Location: Hawaiian Ocean View
> Households receiving SNAP benefits: 38.5% (Hawaii: 10.7%)
> Poverty rate: 36.8% (Hawaii: 9.3%)
> Median household income: $24,818 (Hawaii: $83,173)
> Unemployment rate: 13.5% (Hawaii: 4.3%)
> No. of zip codes considered in ranking: 66
[in-text-ad]

Idaho: 83623
> Location: Glenns Ferry
> Households receiving SNAP benefits: 21.8% (Idaho: 9.0%)
> Poverty rate: 33.9% (Idaho: 11.9%)
> Median household income: $31,579 (Idaho: $58,915)
> Unemployment rate: 1.5% (Idaho: 4.2%)
> No. of zip codes considered in ranking: 125
[recirclink id=1047662]

Illinois: 62201
> Location: East St. Louis
> Households receiving SNAP benefits: 54.5% (Illinois: 12.4%)
> Poverty rate: 50.4% (Illinois: 12.0%)
> Median household income: $15,226 (Illinois: $68,428)
> Unemployment rate: 5.4% (Illinois: 5.9%)
> No. of zip codes considered in ranking: 826
Indiana: 47305
> Location: Muncie
> Households receiving SNAP benefits: 38.4% (Indiana: 9.3%)
> Poverty rate: 38.2% (Indiana: 12.9%)
> Median household income: $26,813 (Indiana: $58,235)
> Unemployment rate: 11.8% (Indiana: 4.7%)
> No. of zip codes considered in ranking: 506
[in-text-ad-2]

Iowa: 50314
> Location: Des Moines
> Households receiving SNAP benefits: 30.8% (Iowa: 9.8%)
> Poverty rate: 35.8% (Iowa: 11.1%)
> Median household income: $39,370 (Iowa: $61,836)
> Unemployment rate: 10.3% (Iowa: 3.9%)
> No. of zip codes considered in ranking: 397

Kansas: 67214
> Location: Wichita
> Households receiving SNAP benefits: 31.5% (Kansas: 7.2%)
> Poverty rate: 29.8% (Kansas: 11.4%)
> Median household income: $29,900 (Kansas: $61,091)
> Unemployment rate: 13.6% (Kansas: 4.0%)
> No. of zip codes considered in ranking: 285
[in-text-ad]

Kentucky: 40202
> Location: Louisville/Jefferson County
> Households receiving SNAP benefits: 47.1% (Kentucky: 13.0%)
> Poverty rate: 46.3% (Kentucky: 16.6%)
> Median household income: $17,295 (Kentucky: $52,238)
> Unemployment rate: 13.1% (Kentucky: 5.3%)
> No. of zip codes considered in ranking: 380
[recirclink id=1104870]
Louisiana: 70456
> Location: Roseland
> Households receiving SNAP benefits: 47.8% (Louisiana: 15.3%)
> Poverty rate: 19.0% (Louisiana: 18.6%)
> Median household income: $48,661 (Louisiana: $50,800)
> Unemployment rate: 7.7% (Louisiana: 6.5%)
> No. of zip codes considered in ranking: 340

Maine: 04668
> Location: Princeton
> Households receiving SNAP benefits: 36.9% (Maine: 12.6%)
> Poverty rate: 30.8% (Maine: 11.1%)
> Median household income: $33,571 (Maine: $59,489)
> Unemployment rate: 8.3% (Maine: 4.0%)
> No. of zip codes considered in ranking: 233
[in-text-ad-2]

Maryland: 21223
> Location: Baltimore
> Households receiving SNAP benefits: 44.8% (Maryland: 10.1%)
> Poverty rate: 36.3% (Maryland: 9.0%)
> Median household income: $29,590 (Maryland: $87,063)
> Unemployment rate: 12.9% (Maryland: 5.1%)
> No. of zip codes considered in ranking: 301

Massachusetts: 01105
> Location: Springfield
> Households receiving SNAP benefits: 60.8% (Massachusetts: 11.6%)
> Poverty rate: 48.1% (Massachusetts: 9.8%)
> Median household income: $21,875 (Massachusetts: $84,385)
> Unemployment rate: 13.6% (Massachusetts: 5.1%)
> No. of zip codes considered in ranking: 423
[in-text-ad]

Michigan: 48213
> Location: Detroit
> Households receiving SNAP benefits: 47.2% (Michigan: 12.7%)
> Poverty rate: 39.6% (Michigan: 13.7%)
> Median household income: $27,726 (Michigan: $59,234)
> Unemployment rate: 18.9% (Michigan: 6.0%)
> No. of zip codes considered in ranking: 762
[recirclink id=1100321]

Minnesota: 55454
> Location: Minneapolis
> Households receiving SNAP benefits: 45.0% (Minnesota: 7.5%)
> Poverty rate: 49.9% (Minnesota: 9.3%)
> Median household income: $20,358 (Minnesota: $73,382)
> Unemployment rate: 18.0% (Minnesota: 3.8%)
> No. of zip codes considered in ranking: 512

Mississippi: 38737
> Location: Drew
> Households receiving SNAP benefits: 52.0% (Mississippi: 14.6%)
> Poverty rate: 42.1% (Mississippi: 19.6%)
> Median household income: $22,238 (Mississippi: $46,511)
> Unemployment rate: 5.6% (Mississippi: 7.1%)
> No. of zip codes considered in ranking: 276
[in-text-ad-2]
Missouri: 63862
> Location: Lilbourn
> Households receiving SNAP benefits: 48.7% (Missouri: 10.5%)
> Poverty rate: 20.6% (Missouri: 13.0%)
> Median household income: $34,931 (Missouri: $57,290)
> Unemployment rate: 6.8% (Missouri: 4.5%)
> No. of zip codes considered in ranking: 534

Montana: 59521
> Location: Rocky Boy West
> Households receiving SNAP benefits: 41.5% (Montana: 9.3%)
> Poverty rate: 35.2% (Montana: 12.8%)
> Median household income: $29,958 (Montana: $56,539)
> Unemployment rate: 11.9% (Montana: 4.1%)
> No. of zip codes considered in ranking: 110
[in-text-ad]
Nebraska: 68111
> Location: Omaha
> Households receiving SNAP benefits: 38.6% (Nebraska: 8.1%)
> Poverty rate: 34.9% (Nebraska: 10.4%)
> Median household income: $30,046 (Nebraska: $63,015)
> Unemployment rate: 10.3% (Nebraska: 3.4%)
> No. of zip codes considered in ranking: 202
[recirclink id=1112369]

Nevada: 89106
> Location: Las Vegas
> Households receiving SNAP benefits: 32.2% (Nevada: 11.6%)
> Poverty rate: 29.6% (Nevada: 12.8%)
> Median household income: $31,031 (Nevada: $62,043)
> Unemployment rate: 10.0% (Nevada: 6.5%)
> No. of zip codes considered in ranking: 108
New Hampshire: 03570
> Location: Berlin
> Households receiving SNAP benefits: 22.6% (New Hampshire: 6.4%)
> Poverty rate: 16.5% (New Hampshire: 7.4%)
> Median household income: $39,091 (New Hampshire: $77,923)
> Unemployment rate: 6.9% (New Hampshire: 3.7%)
> No. of zip codes considered in ranking: 150
[in-text-ad-2]

New Jersey: 08102
> Location: Camden
> Households receiving SNAP benefits: 47.6% (New Jersey: 8.4%)
> Poverty rate: 47.7% (New Jersey: 9.7%)
> Median household income: $22,212 (New Jersey: $85,245)
> Unemployment rate: 11.6% (New Jersey: 5.8%)
> No. of zip codes considered in ranking: 461

New Mexico: 87328
> Location: Navajo
> Households receiving SNAP benefits: 44.1% (New Mexico: 17.0%)
> Poverty rate: 48.7% (New Mexico: 18.6%)
> Median household income: $26,714 (New Mexico: $51,243)
> Unemployment rate: 13.6% (New Mexico: 6.5%)
> No. of zip codes considered in ranking: 132
[in-text-ad]

New York: 14605
> Location: Rochester
> Households receiving SNAP benefits: 55.5% (New York: 14.3%)
> Poverty rate: 40.7% (New York: 13.6%)
> Median household income: $23,196 (New York: $71,117)
> Unemployment rate: 12.6% (New York: 5.7%)
> No. of zip codes considered in ranking: 1,134
[recirclink id=1111559]

North Carolina: 27823
> Location: Enfield
> Households receiving SNAP benefits: 44.0% (North Carolina: 12.0%)
> Poverty rate: 30.8% (North Carolina: 14.0%)
> Median household income: $29,815 (North Carolina: $56,642)
> Unemployment rate: 11.8% (North Carolina: 5.3%)
> No. of zip codes considered in ranking: 622
North Dakota: 58329
> Location: Dunseith
> Households receiving SNAP benefits: 35.4% (North Dakota: 6.6%)
> Poverty rate: 40.6% (North Dakota: 10.5%)
> Median household income: $36,667 (North Dakota: $65,315)
> Unemployment rate: 5.5% (North Dakota: 3.0%)
> No. of zip codes considered in ranking: 81
[in-text-ad-2]
Ohio: 44127
> Location: Cleveland
> Households receiving SNAP benefits: 53.6% (Ohio: 12.6%)
> Poverty rate: 41.0% (Ohio: 13.6%)
> Median household income: $25,792 (Ohio: $58,116)
> Unemployment rate: 19.4% (Ohio: 5.3%)
> No. of zip codes considered in ranking: 839

Oklahoma: 74106
> Location: Tulsa
> Households receiving SNAP benefits: 39.9% (Oklahoma: 12.6%)
> Poverty rate: 34.1% (Oklahoma: 15.3%)
> Median household income: $30,761 (Oklahoma: $53,840)
> Unemployment rate: 12.7% (Oklahoma: 5.0%)
> No. of zip codes considered in ranking: 355
[in-text-ad]

Oregon: 97761
> Location: Warm Springs
> Households receiving SNAP benefits: 53.7% (Oregon: 15.0%)
> Poverty rate: 33.7% (Oregon: 12.4%)
> Median household income: $35,333 (Oregon: $65,667)
> Unemployment rate: 19.0% (Oregon: 5.4%)
> No. of zip codes considered in ranking: 256
[recirclink id=1047662]

Pennsylvania: 19133
> Location: Philadelphia
> Households receiving SNAP benefits: 64.3% (Pennsylvania: 13.1%)
> Poverty rate: 40.2% (Pennsylvania: 12.0%)
> Median household income: $24,725 (Pennsylvania: $63,627)
> Unemployment rate: 15.4% (Pennsylvania: 5.3%)
> No. of zip codes considered in ranking: 1,062

Rhode Island: 02907
> Location: Providence
> Households receiving SNAP benefits: 45.2% (Rhode Island: 14.8%)
> Poverty rate: 28.6% (Rhode Island: 11.6%)
> Median household income: $40,212 (Rhode Island: $70,305)
> Unemployment rate: 6.5% (Rhode Island: 5.5%)
> No. of zip codes considered in ranking: 55
[in-text-ad-2]

South Carolina: 29080
> Location: Lynchburg
> Households receiving SNAP benefits: 32.0% (South Carolina: 11.2%)
> Poverty rate: 30.0% (South Carolina: 14.7%)
> Median household income: $39,563 (South Carolina: $54,864)
> Unemployment rate: 14.0% (South Carolina: 5.5%)
> No. of zip codes considered in ranking: 311

South Dakota: 57764
> Location: Oglala
> Households receiving SNAP benefits: 54.6% (South Dakota: 8.7%)
> Poverty rate: 38.7% (South Dakota: 12.8%)
> Median household income: $27,462 (South Dakota: $59,896)
> Unemployment rate: 26.8% (South Dakota: 3.5%)
> No. of zip codes considered in ranking: 104
[in-text-ad]

Tennessee: 37915
> Location: Knoxville
> Households receiving SNAP benefits: 52.5% (Tennessee: 12.6%)
> Poverty rate: 53.1% (Tennessee: 14.6%)
> Median household income: $16,447 (Tennessee: $54,833)
> Unemployment rate: 8.5% (Tennessee: 5.3%)
> No. of zip codes considered in ranking: 475
[recirclink id=1104870]
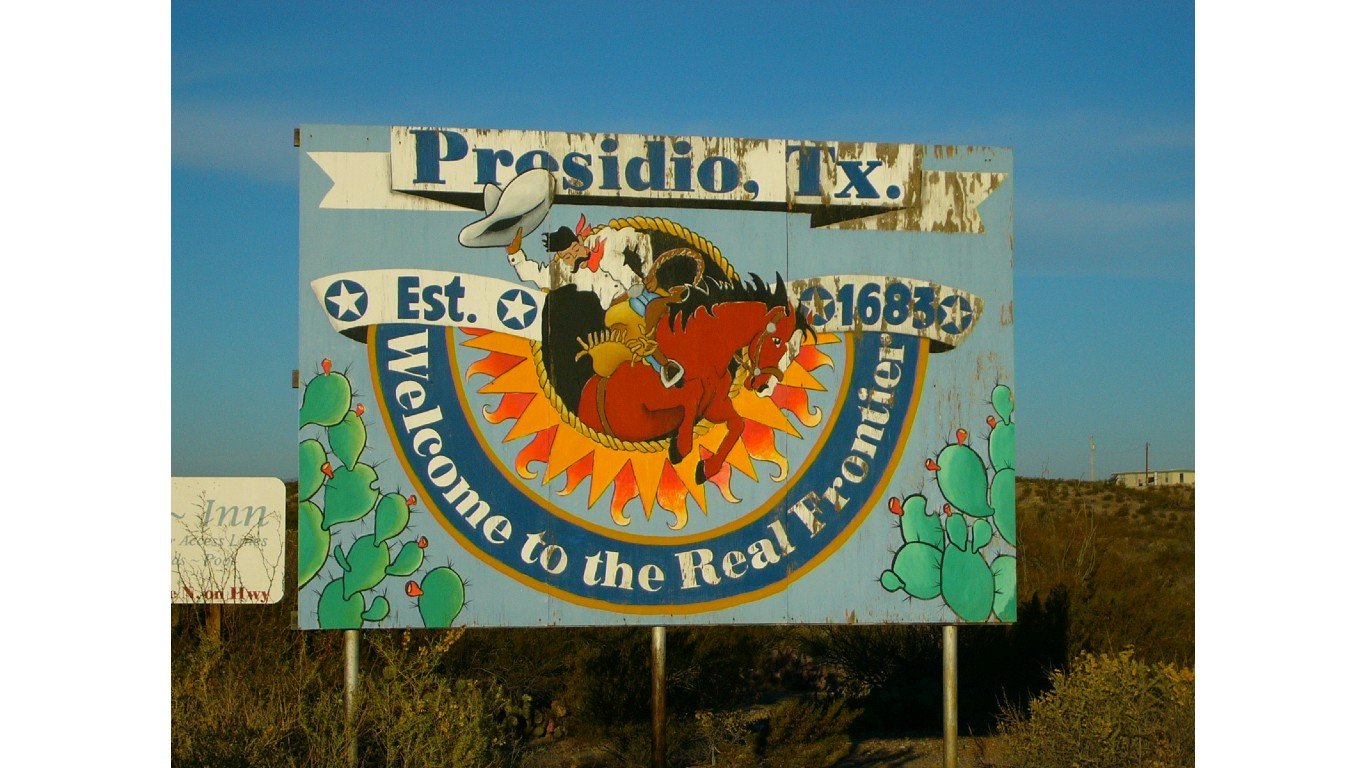
Texas: 79845
> Location: Presidio
> Households receiving SNAP benefits: 64.5% (Texas: 11.5%)
> Poverty rate: 53.3% (Texas: 14.2%)
> Median household income: $17,284 (Texas: $63,826)
> Unemployment rate: 19.6% (Texas: 5.3%)
> No. of zip codes considered in ranking: 1,305

Utah: 84534
> Location: Aneth
> Households receiving SNAP benefits: 22.3% (Utah: 6.2%)
> Poverty rate: 30.0% (Utah: 9.1%)
> Median household income: $39,837 (Utah: $74,197)
> Unemployment rate: 26.8% (Utah: 3.6%)
> No. of zip codes considered in ranking: 128
[in-text-ad-2]
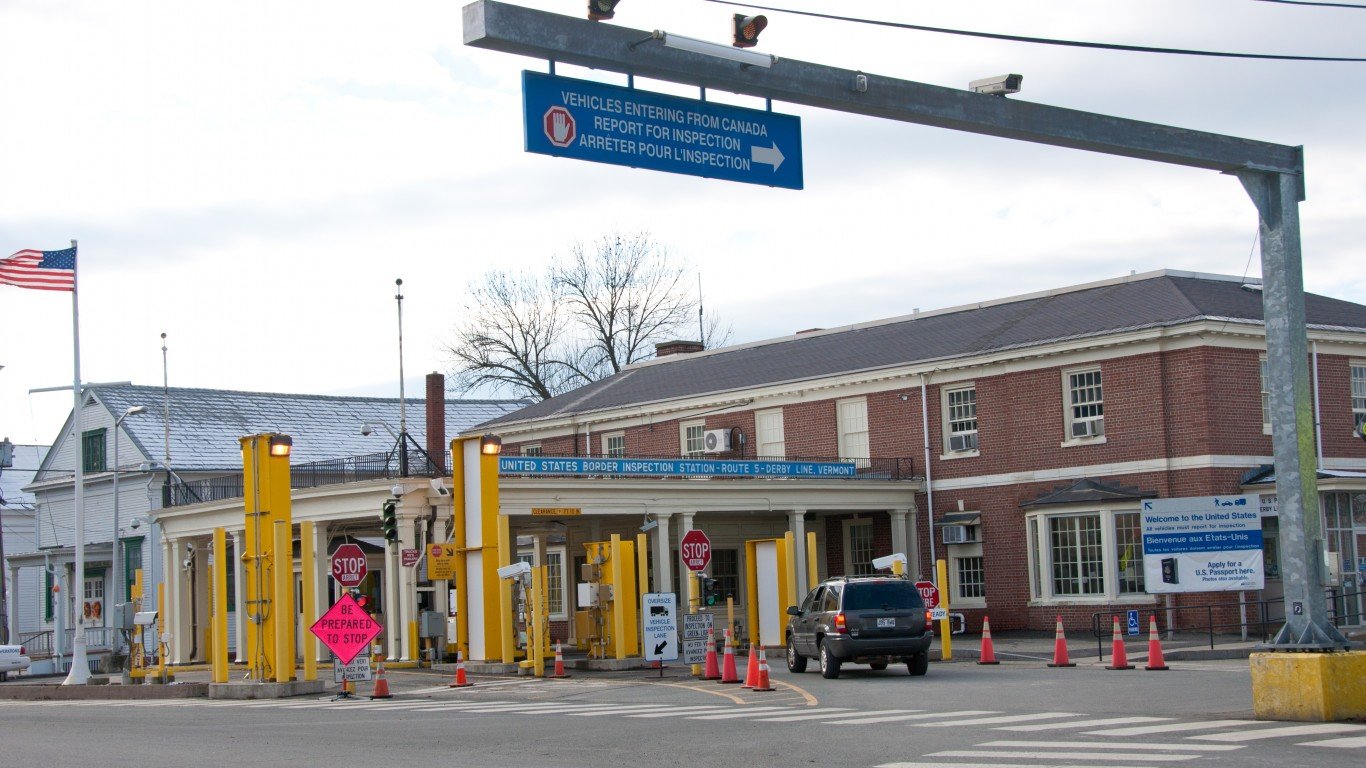
Vermont: 05830
> Location: Derby Line
> Households receiving SNAP benefits: 22.0% (Vermont: 10.6%)
> Poverty rate: 20.4% (Vermont: 10.8%)
> Median household income: $55,417 (Vermont: $63,477)
> Unemployment rate: 3.3% (Vermont: 3.8%)
> No. of zip codes considered in ranking: 113

Virginia: 23523
> Location: Norfolk
> Households receiving SNAP benefits: 41.9% (Virginia: 7.9%)
> Poverty rate: 28.1% (Virginia: 10.0%)
> Median household income: $32,268 (Virginia: $76,398)
> Unemployment rate: 10.0% (Virginia: 4.5%)
> No. of zip codes considered in ranking: 520
[in-text-ad]

Washington: 98952
> Location: White Swan
> Households receiving SNAP benefits: 44.8% (Washington: 11.1%)
> Poverty rate: 29.8% (Washington: 10.2%)
> Median household income: $47,837 (Washington: $77,006)
> Unemployment rate: 14.4% (Washington: 4.8%)
> No. of zip codes considered in ranking: 381
[recirclink id=1100321]

West Virginia: 25043
> Location: Clay
> Households receiving SNAP benefits: 44.1% (West Virginia: 16.5%)
> Poverty rate: 48.8% (West Virginia: 17.1%)
> Median household income: $29,500 (West Virginia: $48,037)
> Unemployment rate: 36.0% (West Virginia: 6.5%)
> No. of zip codes considered in ranking: 208

Wisconsin: 53205
> Location: Milwaukee
> Households receiving SNAP benefits: 57.5% (Wisconsin: 10.2%)
> Poverty rate: 46.1% (Wisconsin: 11.0%)
> Median household income: $20,597 (Wisconsin: $63,293)
> Unemployment rate: 10.2% (Wisconsin: 3.5%)
> No. of zip codes considered in ranking: 582
[in-text-ad-2]

Wyoming: 82644
> Location: Mills
> Households receiving SNAP benefits: 20.4% (Wyoming: 5.3%)
> Poverty rate: 10.9% (Wyoming: 10.8%)
> Median household income: $46,825 (Wyoming: $65,304)
> Unemployment rate: 5.9% (Wyoming: 4.3%)
> No. of zip codes considered in ranking: 41
Methodology
To determine the ZIP codes with the highest SNAP recipiency rate in every state, 24/7 Wall St. reviewed five-year estimates of the share of households that received SNAP benefits in the 12 months prior to the survey from the U.S. Census Bureau’s 2020 American Community Survey.
We used Zip Code Tabulation Areas — a census geography type which defines areal representations of United States Postal Service zip codes (USPS zip codes do not define geographic boundaries but instead are a network of mail delivery routes in a service area). We refer to census ZCTAs as zip codes.
ZIP codes were excluded if the SNAP recipiency rate was not available in the 2020 ACS, if there were fewer than 500 households, or if the sampling error associated with a ZIP code’s data was deemed too high.
The sampling error was defined as too high if the coefficient of variation — a statistical assessment of how reliable an estimate is — for a ZIP code’s SNAP recipiency rate was above 15% and greater than two standard deviations above the mean CV for all ZIP codes’ SNAP recipiency rates. We similarly excluded ZIP codes that had a sampling error too high for their population, using the same definition.
ZIP codes were ranked based on the share of households that received SNAP benefits in the previous 12 months. To break ties, we used the number of households that received SNAP benefits in the previous 12 months.
Additional information on poverty rate, median household income, and unemployment rate are also five-year estimates from the 2020 ACS. Because the Census Bureau didn’t release one-year estimates for 2020 due to data collection issues caused by the COVID-19 pandemic, all ACS data are five-year estimates.
Contact [email protected] for any questions or corrections.