The coronavirus pandemic heavily disrupted the U.S. public elementary and secondary school system. School shutdowns in 2020 emptied school buildings and wreaked havoc on home life as students and parents coped with online learning alternatives during the peak of the pandemic.
As the county approaches the 2022-2023 academic year, public school systems nationwide are still reeling with lower enrollment numbers compared to pre-pandemic levels. Public school funding is tied to student numbers, and that means public primary and secondary educational districts face funding cuts. New York City, which has the nation’s largest school district, is poised to slash $200 million from its public school budget, a move that is being fought in court. (These are the states spending the most on public schools.)
Nationwide, nearly 862,000 fewer students in public primary and secondary school are expected to enroll for the fall 2022 semester, a 1.7% decrease from fall 2019. Enrollment changes vary across states.
To identify the states where public schools are losing the most students, 24/7 Wall St. reviewed public school enrollment figures and projections from the National Center for Education Statistics. States were ranked based on the percent decline in public school enrollment from fall 2019 to the fall 2022, using NCES’s enrollment estimates.
Total population and high school attainment — the percentage of the population 25 or older with at least a high school diploma — came from the U.S. Census Bureau’s American Community Survey 2020 5-year estimates.
In 33 states, student enrollment is estimated to have declined by 0.5% or more compared to 2019. In total, about 955,000 fewer students enrolled in public school in these states, according to estimates from the NCES, a 2.5% decline compared to enrollment in 2019.
Among the top 10 most populous states, Michigan, New York, and California are projected to see declines in public elementary and secondary schools enrollment of between 3% and 4.6%, or a total of nearly 392,000 fewer students compared to the fall 2019 enrollment period.
Seventeen states are not included on this list either because their public elementary and secondary school enrollment numbers increased or decreased by less than 0.5%. Combined, nearly 81,000 more students are expected to enroll in these states compared to the fall of 2019.
The reasons for the widespread decline in enrollment are not fully clear. The New York Times, citing experts, suggests that either parents became fed up with pandemic-era mandates and sent their kids instead to other schools that do not have to adhere to public mandates or began homeschooling them. Another explanation could be that due to pandemic-related financial hardships, students simply dropped out. (These are the 50 schools with the most toxic air.)
Here are the state public school systems losing the most students.
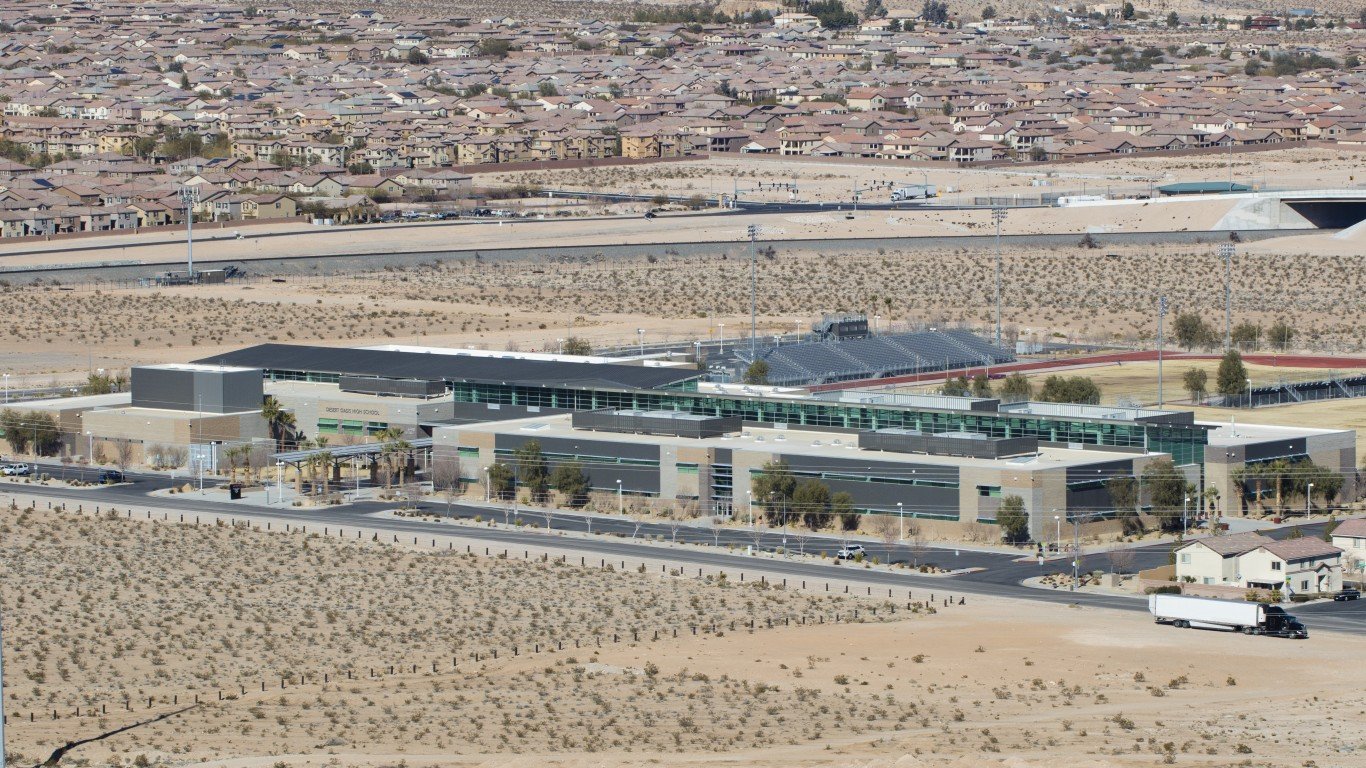
33. Nevada
> Proj, change in public school enrollment, Fall 2019-Fall 2022: -0.5%
> Est. Fall enrollment, 2022: 494,300 — 11th lowest
> Fall enrollment, 2019: 496,934 — 10th lowest
> High school educational attainment: 86.9% — 5th lowest
[in-text-ad]
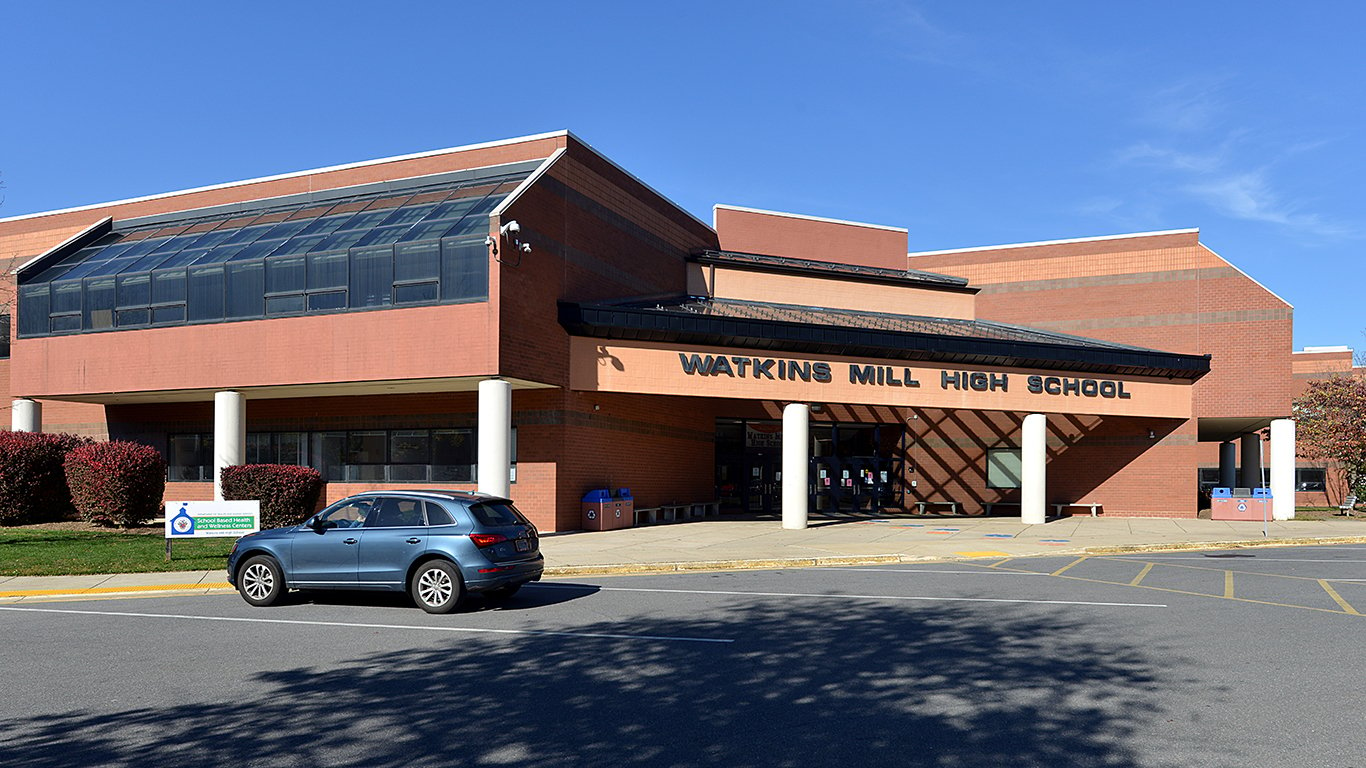
32. Maryland
> Proj, change in public school enrollment, Fall 2019-Fall 2022: -0.7%
> Est. Fall enrollment, 2022: 903,100 — 15th highest
> Fall enrollment, 2019: 909,404 — 17th lowest
> High school educational attainment: 90.6% — 17th lowest
[recirclink id=1126628]
31. Arizona
> Proj, change in public school enrollment, Fall 2019-Fall 2022: -0.7%
> Est. Fall enrollment, 2022: 1,144,400 — 12th highest
> Fall enrollment, 2019: 1,152,586 — 12th highest
> High school educational attainment: 87.9% — 9th lowest
30. Louisiana
> Proj, change in public school enrollment, Fall 2019-Fall 2022: -0.8%
> Est. Fall enrollment, 2022: 705,000 — 15th lowest
> Fall enrollment, 2019: 710,439 — 15th lowest
> High school educational attainment: 85.9% — 3rd lowest
[in-text-ad-2]
29. North Carolina
> Proj, change in public school enrollment, Fall 2019-Fall 2022: -1.0%
> Est. Fall enrollment, 2022: 1,545,000 — 8th highest
> Fall enrollment, 2019: 1,560,350 — 8th highest
> High school educational attainment: 88.5% — 11th lowest
28. Illinois
> Proj, change in public school enrollment, Fall 2019-Fall 2022: -1.0%
> Est. Fall enrollment, 2022: 1,924,000 — 4th highest
> Fall enrollment, 2019: 1,943,117 — 4th highest
> High school educational attainment: 89.7% — 14th lowest
[in-text-ad]
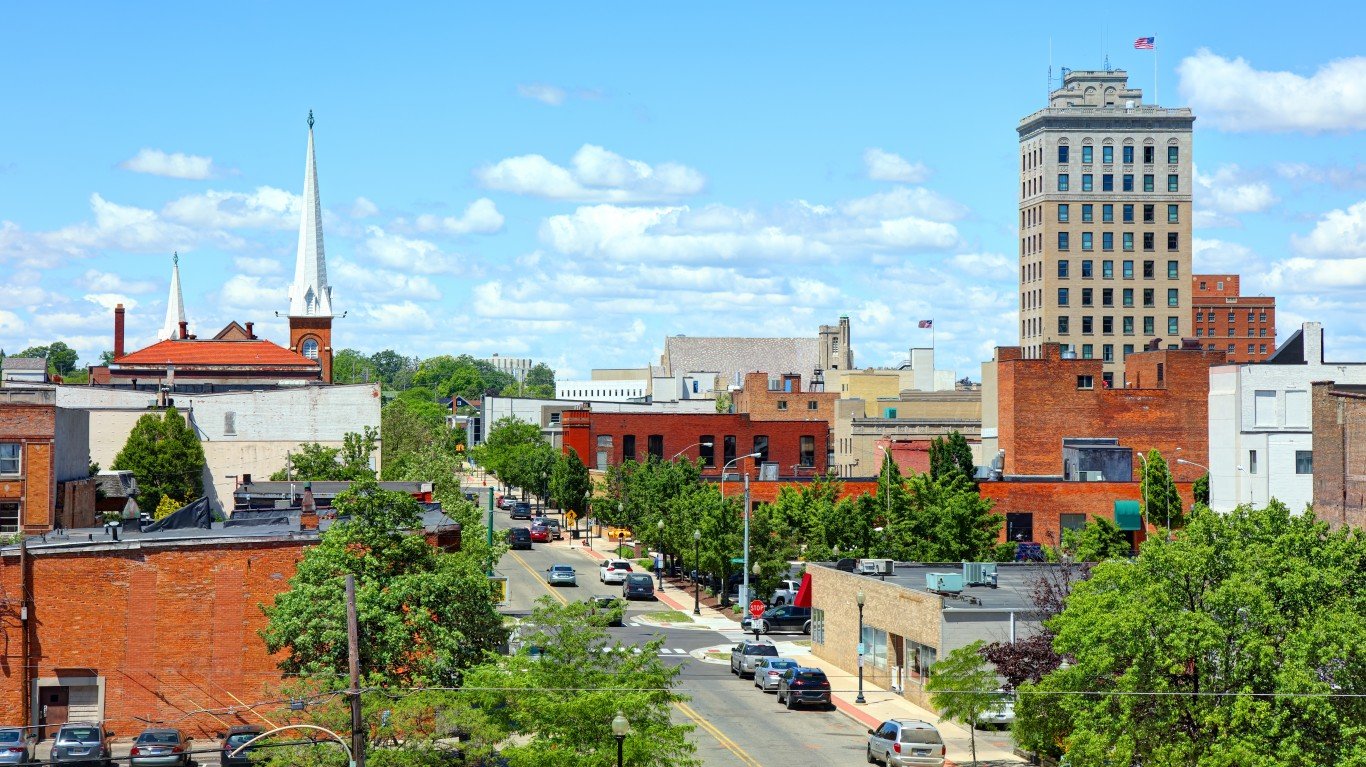
27. Pennsylvania
> Proj, change in public school enrollment, Fall 2019-Fall 2022: -1.1%
> Est. Fall enrollment, 2022: 1,712,900 — 6th highest
> Fall enrollment, 2019: 1,732,449 — 6th highest
> High school educational attainment: 91.0% — 13th highest
[recirclink id=1119123]
26. Ohio
> Proj, change in public school enrollment, Fall 2019-Fall 2022: -1.2%
> Est. Fall enrollment, 2022: 1,670,300 — 7th highest
> Fall enrollment, 2019: 1,689,867 — 7th highest
> High school educational attainment: 90.8% — 15th highest
25. New Jersey education
> Proj, change in public school enrollment, Fall 2019-Fall 2022: -1.3%
> Est. Fall enrollment, 2022: 1,393,000 — 10th highest
> Fall enrollment, 2019: 1,411,917 — 10th highest
> High school educational attainment: 90.3% — 15th lowest
[in-text-ad-2]
24. Florida
> Proj, change in public school enrollment, Fall 2019-Fall 2022: -1.5%
> Est. Fall enrollment, 2022: 2,814,600 — 2nd highest
> Fall enrollment, 2019: 2,858,461 — 2nd highest
> High school educational attainment: 88.5% — 12th lowest
23. Montana
> Proj, change in public school enrollment, Fall 2019-Fall 2022: -1.7%
> Est. Fall enrollment, 2022: 147,400 — 3rd lowest
> Fall enrollment, 2019: 149,917 — 3rd lowest
> High school educational attainment: 94.0% — the highest
[in-text-ad]
22. sconsin
> Proj, change in public school enrollment, Fall 2019-Fall 2022: -1.7%
> Est. Fall enrollment, 2022: 840,500 — 16th lowest
> Fall enrollment, 2019: 855,400 — 16th lowest
> High school educational attainment: 92.6% — 5th highest
[recirclink id=1056702]
21. Georgia
> Proj, change in public school enrollment, Fall 2019-Fall 2022: -1.8%
> Est. Fall enrollment, 2022: 1,738,100 — 5th highest
> Fall enrollment, 2019: 1,769,657 — 5th highest
> High school educational attainment: 87.9% — 10th lowest
20. Hawaii
> Proj, change in public school enrollment, Fall 2019-Fall 2022: -2.1%
> Est. Fall enrollment, 2022: 177,200 — 6th lowest
> Fall enrollment, 2019: 181,088 — 6th lowest
> High school educational attainment: 92.5% — 6th highest
[in-text-ad-2]
19. Connecticut
> Proj, change in public school enrollment, Fall 2019-Fall 2022: -2.2%
> Est. Fall enrollment, 2022: 512,300 — 12th lowest
> Fall enrollment, 2019: 523,690 — 12th lowest
> High school educational attainment: 90.9% — 14th highest
18. Kansas
> Proj, change in public school enrollment, Fall 2019-Fall 2022: -2.7%
> Est. Fall enrollment, 2022: 484,500 — 10th lowest
> Fall enrollment, 2019: 497,963 — 11th lowest
> High school educational attainment: 91.4% — 9th highest
[in-text-ad]
17. Rhode Island
> Proj, change in public school enrollment, Fall 2019-Fall 2022: -2.8%
> Est. Fall enrollment, 2022: 139,500 — 2nd lowest
> Fall enrollment, 2019: 143,557 — 2nd lowest
> High school educational attainment: 89.2% — 13th lowest
[recirclink id=1036772]
16. New York
> Proj, change in public school enrollment, Fall 2019-Fall 2022: -3.0%
> Est. Fall enrollment, 2022: 2,613,000 — 3rd highest
> Fall enrollment, 2019: 2,692,589 — 3rd highest
> High school educational attainment: 87.2% — 7th lowest
15. Missouri
> Proj, change in public school enrollment, Fall 2019-Fall 2022: -3.0%
> Est. Fall enrollment, 2022: 882,700 — 17th lowest
> Fall enrollment, 2019: 910,466 — 16th highest
> High school educational attainment: 90.6% — 16th highest
[in-text-ad-2]
14. Colorado
> Proj, change in public school enrollment, Fall 2019-Fall 2022: -3.3%
> Est. Fall enrollment, 2022: 883,200 — 16th highest
> Fall enrollment, 2019: 913,223 — 15th highest
> High school educational attainment: 92.1% — 7th highest
13. Virginia
> Proj, change in public school enrollment, Fall 2019-Fall 2022: -3.3%
> Est. Fall enrollment, 2022: 1,254,300 — 11th highest
> Fall enrollment, 2019: 1,297,012 — 11th highest
> High school educational attainment: 90.3% — 16th lowest
[in-text-ad]
12. Massachusetts
> Proj, change in public school enrollment, Fall 2019-Fall 2022: -3.4%
> Est. Fall enrollment, 2022: 927,200 — 14th highest
> Fall enrollment, 2019: 959,394 — 14th highest
> High school educational attainment: 91.1% — 12th highest
[recirclink id=1148096]
11. Vermont
> Proj, change in public school enrollment, Fall 2019-Fall 2022: -3.6%
> Est. Fall enrollment, 2022: 83,600 — the lowest
> Fall enrollment, 2019: 86,759 — the lowest
> High school educational attainment: 93.5% — 2nd highest
10. Kentucky
> Proj, change in public school enrollment, Fall 2019-Fall 2022: -3.8%
> Est. Fall enrollment, 2022: 665,700 — 14th lowest
> Fall enrollment, 2019: 691,996 — 14th lowest
> High school educational attainment: 87.2% — 6th lowest
[in-text-ad-2]
9. California
> Proj, change in public school enrollment, Fall 2019-Fall 2022: -3.9%
> Est. Fall enrollment, 2022: 6,005,300 — the highest
> Fall enrollment, 2019: 6,249,005 — the highest
> High school educational attainment: 83.9% — the lowest
8. Washington
> Proj, change in public school enrollment, Fall 2019-Fall 2022: -4.0%
> Est. Fall enrollment, 2022: 1,096,900 — 13th highest
> Fall enrollment, 2019: 1,142,073 — 13th highest
> High school educational attainment: 91.7% — 8th highest
[in-text-ad]
7. Maine
> Proj, change in public school enrollment, Fall 2019-Fall 2022: -4.0%
> Est. Fall enrollment, 2022: 173,000 — 5th lowest
> Fall enrollment, 2019: 180,291 — 5th lowest
> High school educational attainment: 93.2% — 4th highest
[recirclink id=1126628]
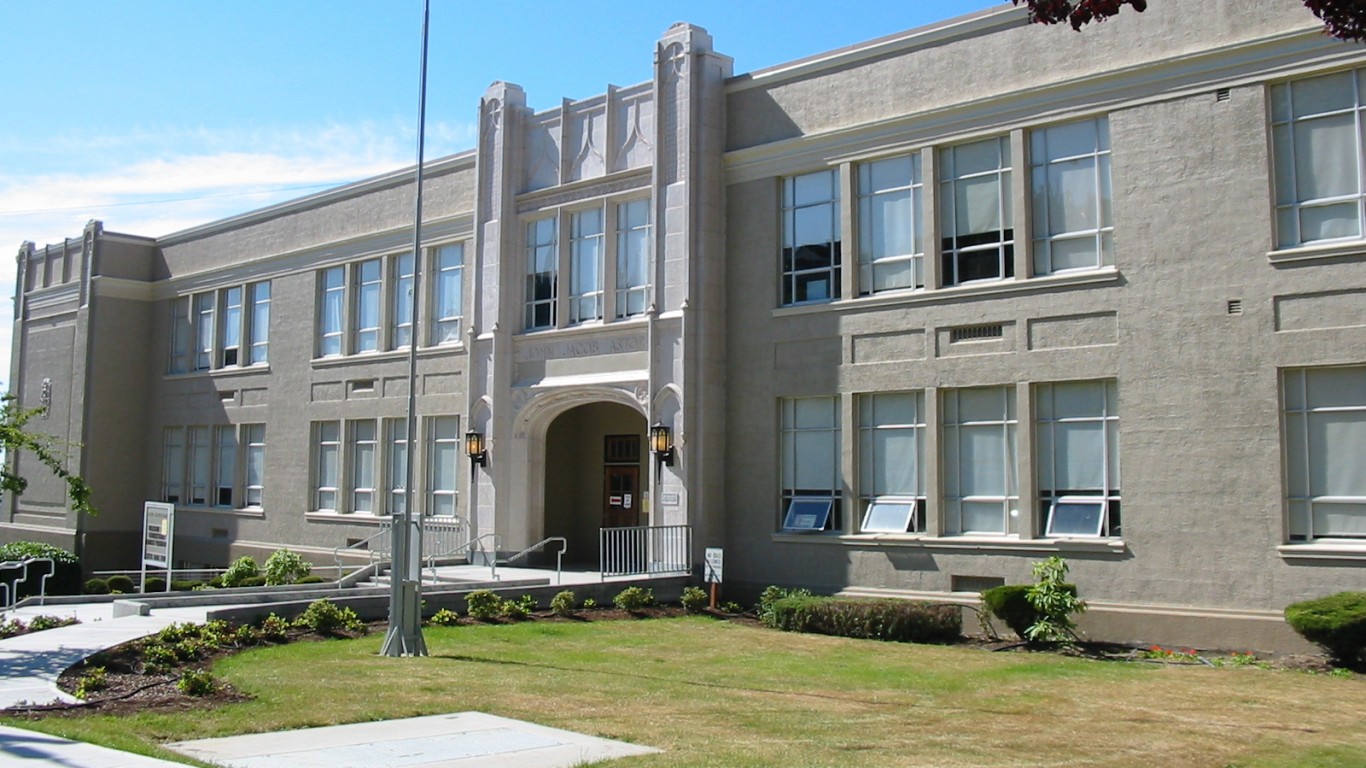
6. Oregon
> Proj, change in public school enrollment, Fall 2019-Fall 2022: -4.3%
> Est. Fall enrollment, 2022: 584,300 — 13th lowest
> Fall enrollment, 2019: 610,648 — 13th lowest
> High school educational attainment: 91.1% — 11th highest
5. Michigan
> Proj, change in public school enrollment, Fall 2019-Fall 2022: -4.6%
> Est. Fall enrollment, 2022: 1,427,600 — 9th highest
> Fall enrollment, 2019: 1,495,925 — 9th highest
> High school educational attainment: 91.3% — 10th highest
[in-text-ad-2]
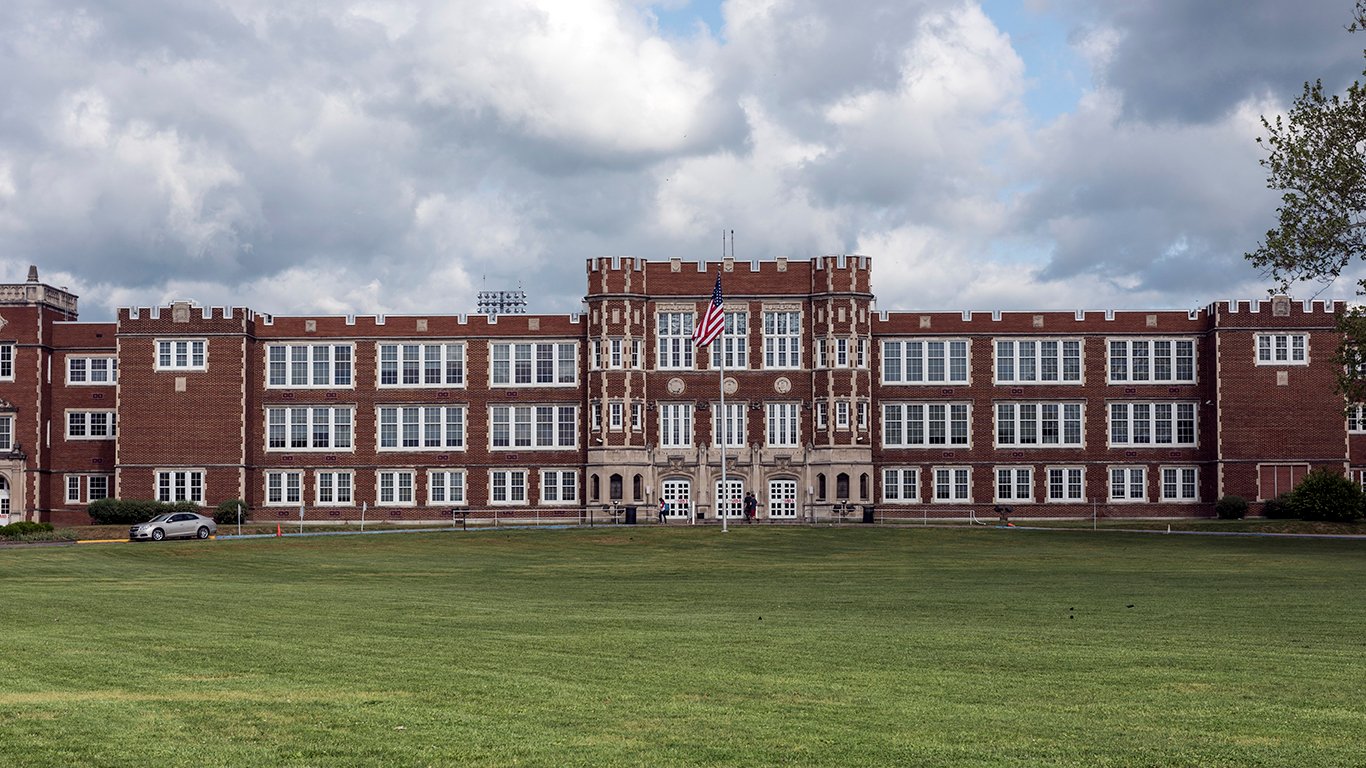
4. West Virginia
> Proj, change in public school enrollment, Fall 2019-Fall 2022: -5.5%
> Est. Fall enrollment, 2022: 249,100 — 7th lowest
> Fall enrollment, 2019: 263,486 — 7th lowest
> High school educational attainment: 87.6% — 8th lowest
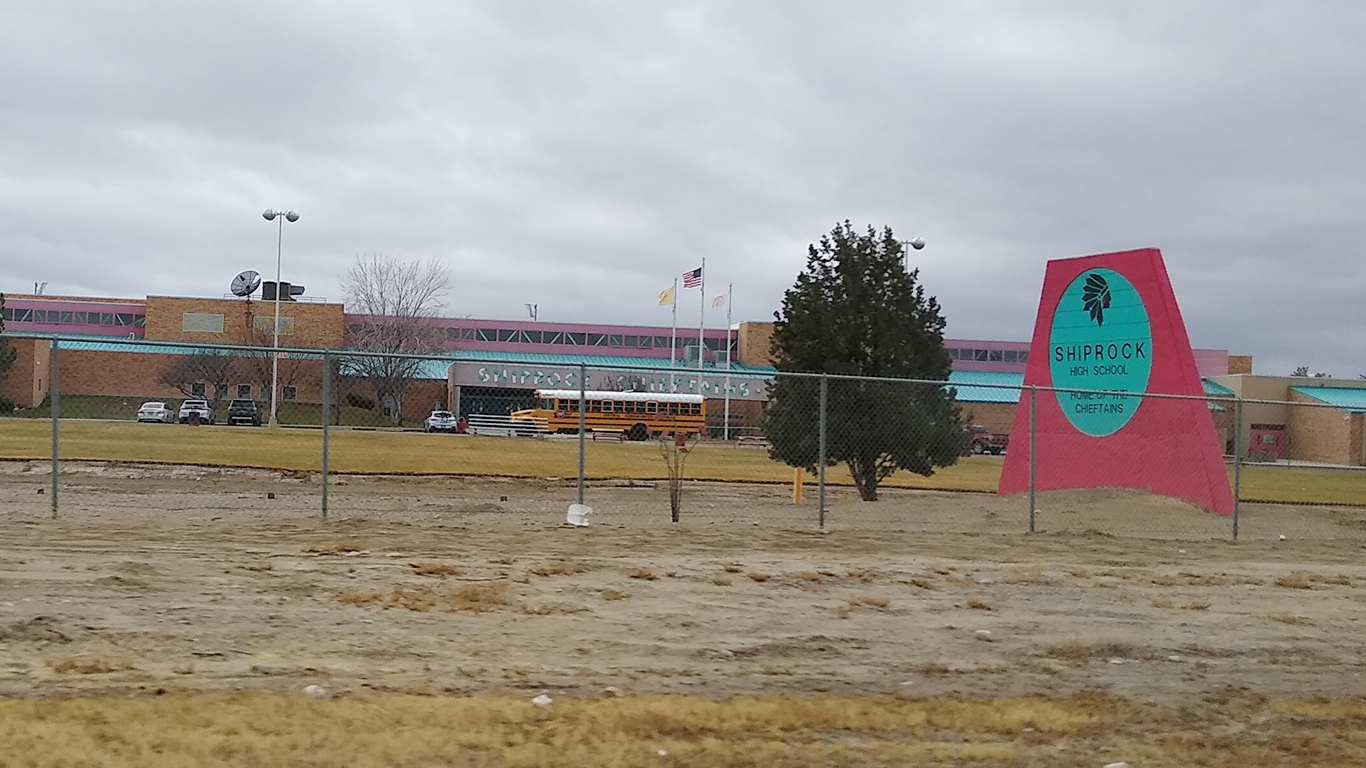
3. New Mexico
> Proj, change in public school enrollment, Fall 2019-Fall 2022: -6.0%
> Est. Fall enrollment, 2022: 311,400 — 8th lowest
> Fall enrollment, 2019: 331,206 — 8th lowest
> High school educational attainment: 86.5% — 4th lowest
[in-text-ad]
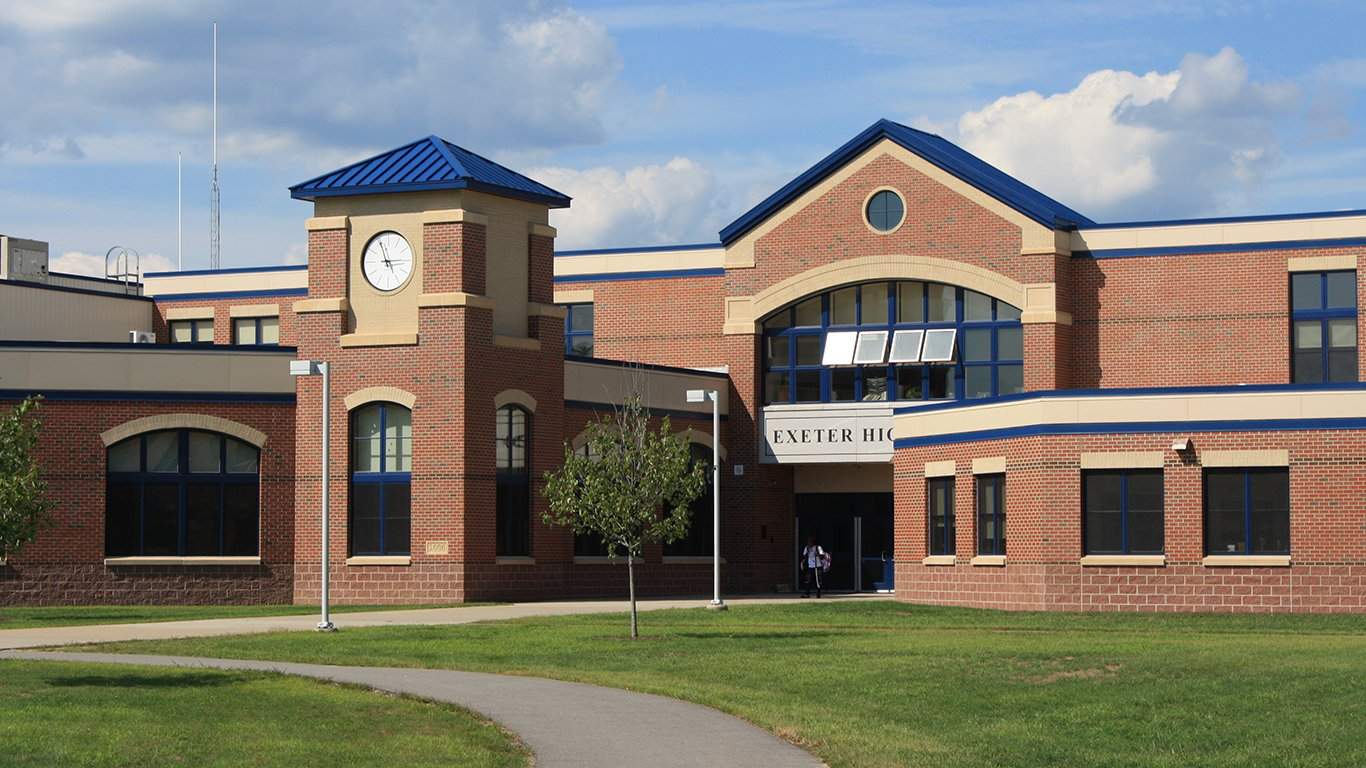
2. New Hampshire
> Proj, change in public school enrollment, Fall 2019-Fall 2022: -6.5%
> Est. Fall enrollment, 2022: 165,900 — 4th lowest
> Fall enrollment, 2019: 177,351 — 4th lowest
> High school educational attainment: 93.3% — 3rd highest
[recirclink id=1119123]
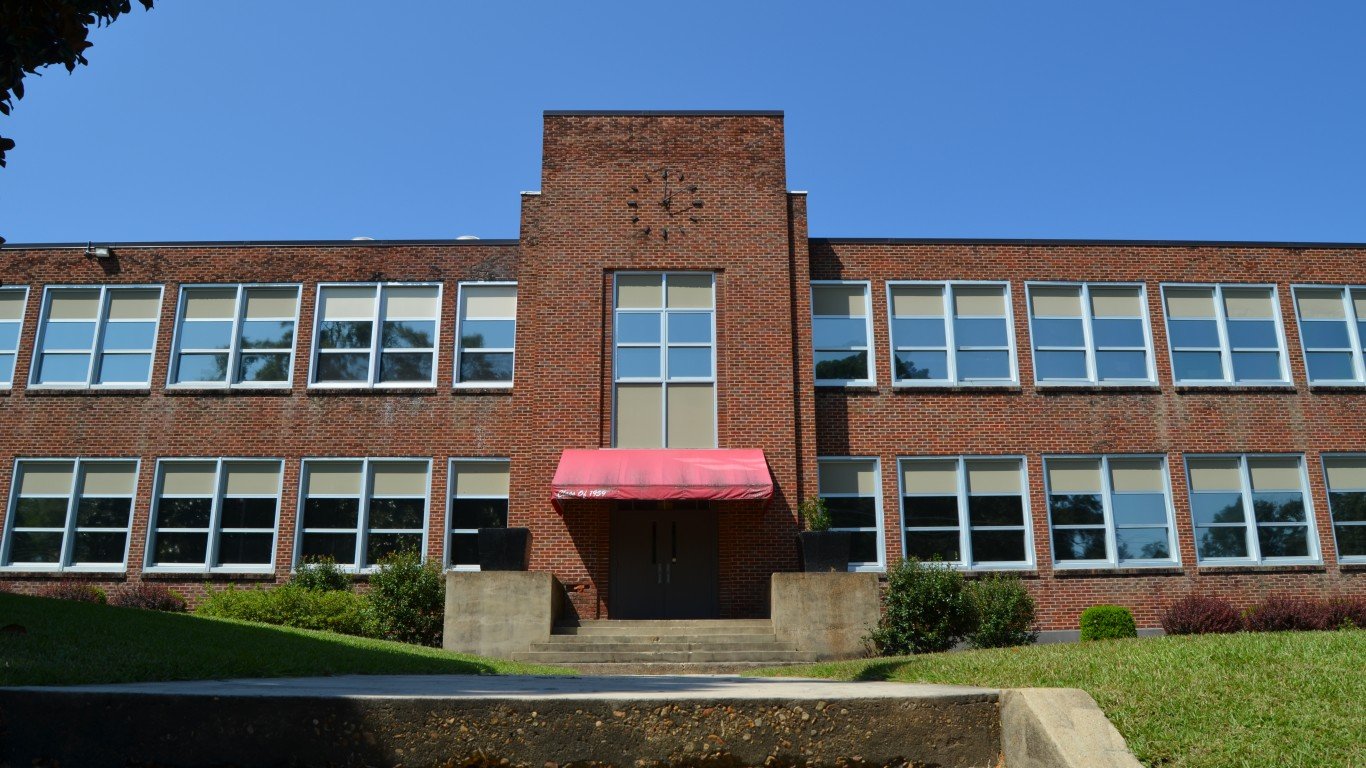
1. Mississippi
> Proj, change in public school enrollment, Fall 2019-Fall 2022: -7.8%
> Est. Fall enrollment, 2022: 429,800 — 9th lowest
> Fall enrollment, 2019: 466,002 — 9th lowest
> High school educational attainment: 85.3% — 2nd lowest
Contact [email protected] for any questions or corrections.