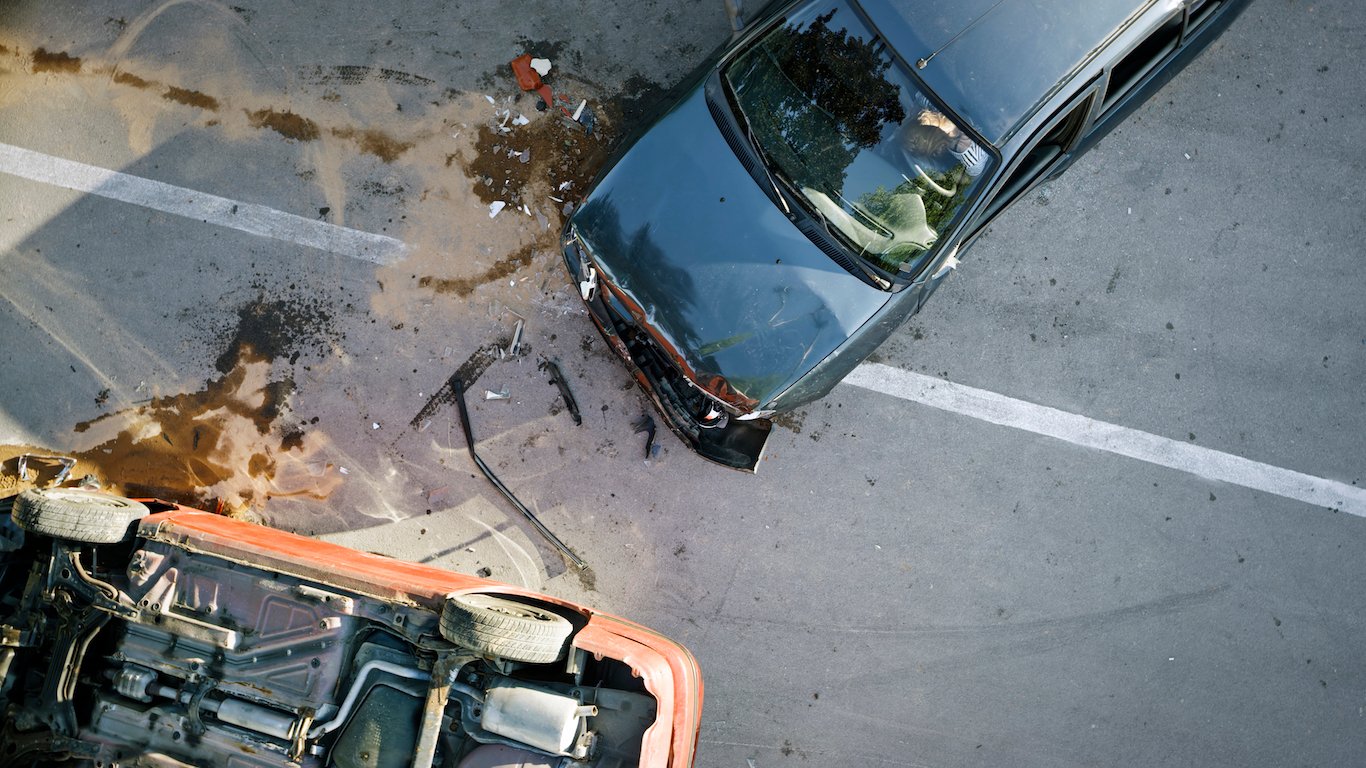
The National Highway Traffic Safety Administration estimates that 42,915 people died in motor vehicle crashes in 2021, a 10.5% increase from 2020 and the most since 2005. These fatalities include pedestrians and cyclists. (Not always fatal, these are the 20 car accidents Americans get in the most.)
The alarming spike in fatalities correlates with an estimated 11.2% increase in travel on U.S. roads and highways in 2021 compared to the previous year, according to the Federal Highway Administration. The NHTSA has also reported that 9,560 people died in motor vehicle accidents in the first three months of 2022, a 7% increase from the same period last year. Still, this is low compared to 1966, the deadliest year for car wrecks since records began.
Today, fewer people in the U.S. die from car crashes than they do from guns, but that was not always the case. Firearm deaths have risen (guns became the leading cause of death among American children for the first time in 2020) while automobile-related fatalities have declined thanks to the introduction of safety features like seat belts, airbags, and improved vehicle design.
To determine the deadliest year for car wrecks, 24/7 Wall St. reviewed data from the NHTSA. Years from 1968 to 2020 were ranked by the number of auto fatalities per 100,000 licensed drivers. Supplemental data also came from the NHTSA.
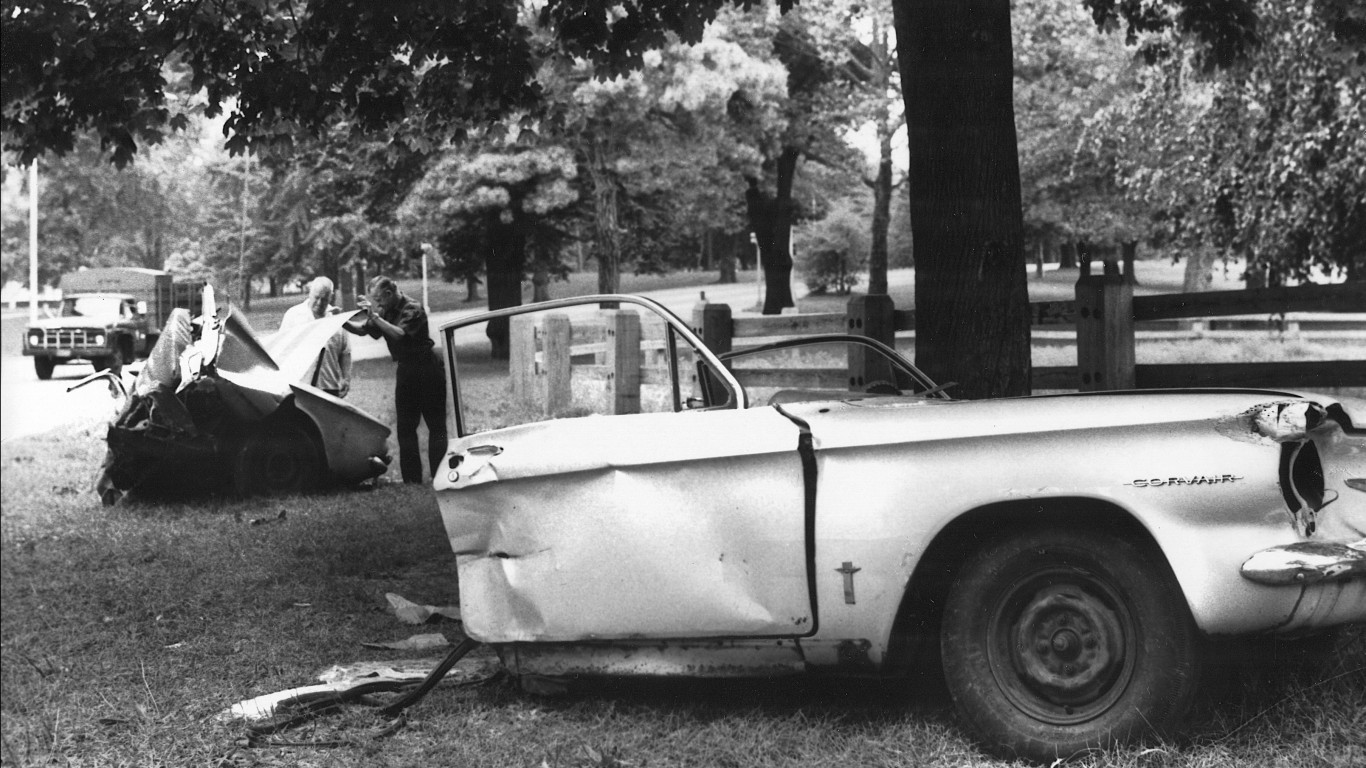
Seat belts became mandatory in all new vehicles sold in the United States in 1968, the second-highest year for automotive-related fatalities since records began in 1966. However, it was not mandatory for all drivers and passengers in cars to actually wear them, and it took decades before laws made usage commonplace across the country. And it is likely not a coincidence that over the years, fatality rates have declined.
As seat belts became ubiquitous, the number of lives saved by seat belts jumped. For example, in 1966, the NHTSA estimated that only 195 lives were saved by wearing seat belts. By 2005, more than 17,000 lives were saved by seat belts. (Like nearly everything else, car accidents and fatalities vary by state. These are the deadliest states to drive.)
Over the decades, fewer Ameircans have died in vehicle-related crashes. In 2008, the annual rate of overall traffic fatalities fell below 18 deaths per 100,000 licensed drivers for the first time. In 2014, that rate hit a record low of 15.3 per 100,000. This is a huge improvement from the 1960s and early ‘70s, when there were more than 45 fatalities per 100,000 licensed drivers.
Here is the deadliest year for car wrecks.
1968
> Auto fatality rate: 50.0 deaths per 100,000 licensed drivers — the highest since 1968
> Total fatalities: 52,725 — 4th highest since 1968
> Licensed drivers: 105,410,000 — the fewest since 1968
> Lives saved by wearing seat belts: 240 — the lowest since 1968
[in-text-ad]
1969
> Auto fatality rate: 49.4 deaths per 100,000 licensed drivers — 2nd highest since 1968
> Total fatalities: 53,543 — 3rd highest since 1968
> Licensed drivers: 108,306,000 — 2nd fewest since 1968
> Lives saved by wearing seat belts: 298 — 2nd lowest since 1968
[recirclink id=1162180]
1970
> Auto fatality rate: 47.2 deaths per 100,000 licensed drivers — 3rd highest since 1968
> Total fatalities: 52,627 — 5th highest since 1968
> Licensed drivers: 111,543,000 — 3rd fewest since 1968
> Lives saved by wearing seat belts: 332 — 3rd lowest since 1968
1971
> Auto fatality rate: 45.9 deaths per 100,000 licensed drivers — 5th highest since 1968
> Total fatalities: 52,542 — 6th highest since 1968
> Licensed drivers: 114,426,000 — 4th fewest since 1968
> Lives saved by wearing seat belts: 379 — 4th lowest since 1968
[in-text-ad-2]
1972
> Auto fatality rate: 46.1 deaths per 100,000 licensed drivers — 4th highest since 1968
> Total fatalities: 54,589 — the highest since 1968
> Licensed drivers: 118,414,000 — 5th fewest since 1968
> Lives saved by wearing seat belts: 470 — 5th lowest since 1968

1973
> Auto fatality rate: 44.5 deaths per 100,000 licensed drivers — 6th highest since 1968
> Total fatalities: 54,052 — 2nd highest since 1968
> Licensed drivers: 121,546,000 — 6th fewest since 1968
> Lives saved by wearing seat belts: 546 — 6th lowest since 1968
[in-text-ad]
1974
> Auto fatality rate: 36.0 deaths per 100,000 licensed drivers — 7th highest since 1968
> Total fatalities: 45,196 — 17th highest since 1968
> Licensed drivers: 125,427,000 — 7th fewest since 1968
> Lives saved by wearing seat belts: 591 — 7th lowest since 1968
[recirclink id=1162502]

1975
> Auto fatality rate: 34.3 deaths per 100,000 licensed drivers — 12th highest since 1968
> Total fatalities: 44,525 — 19th highest since 1968
> Licensed drivers: 129,791,000 — 8th fewest since 1968
> Lives saved by wearing seat belts: 843 — 16th lowest since 1968
1976
> Auto fatality rate: 34.0 deaths per 100,000 licensed drivers — 13th highest since 1968
> Total fatalities: 45,523 — 16th highest since 1968
> Licensed drivers: 134,036,000 — 9th fewest since 1968
> Lives saved by wearing seat belts: 755 — 12th lowest since 1968
[in-text-ad-2]
1977
> Auto fatality rate: 34.7 deaths per 100,000 licensed drivers — 11th highest since 1968
> Total fatalities: 47,878 — 11th highest since 1968
> Licensed drivers: 138,121,000 — 10th fewest since 1968
> Lives saved by wearing seat belts: 791 — 13th lowest since 1968
1978
> Auto fatality rate: 35.7 deaths per 100,000 licensed drivers — 8th highest since 1968
> Total fatalities: 50,331 — 9th highest since 1968
> Licensed drivers: 140,844,000 — 11th fewest since 1968
> Lives saved by wearing seat belts: 797 — 14th lowest since 1968
[in-text-ad]
1979
> Auto fatality rate: 35.7 deaths per 100,000 licensed drivers — 9th highest since 1968
> Total fatalities: 51,093 — 7th highest since 1968
> Licensed drivers: 143,284,000 — 12th fewest since 1968
> Lives saved by wearing seat belts: 707 — 11th lowest since 1968
[recirclink id=1162267]
1980
> Auto fatality rate: 35.2 deaths per 100,000 licensed drivers — 10th highest since 1968
> Total fatalities: 51,091 — 8th highest since 1968
> Licensed drivers: 145,295,000 — 13th fewest since 1968
> Lives saved by wearing seat belts: 706 — 10th lowest since 1968
1981
> Auto fatality rate: 33.5 deaths per 100,000 licensed drivers — 14th highest since 1968
> Total fatalities: 49,301 — 10th highest since 1968
> Licensed drivers: 147,075,000 — 14th fewest since 1968
> Lives saved by wearing seat belts: 666 — 9th lowest since 1968
[in-text-ad-2]
1982
> Auto fatality rate: 29.3 deaths per 100,000 licensed drivers — 15th highest since 1968
> Total fatalities: 43,945 — 21st highest since 1968
> Licensed drivers: 150,234,000 — 15th fewest since 1968
> Lives saved by wearing seat belts: 657 — 8th lowest since 1968
1983
> Auto fatality rate: 27.6 deaths per 100,000 licensed drivers — 21st highest since 1968
> Total fatalities: 42,589 — 26th lowest since 1968
> Licensed drivers: 154,389,000 — 16th fewest since 1968
> Lives saved by wearing seat belts: 823 — 15th lowest since 1968
[in-text-ad]
1984
> Auto fatality rate: 28.5 deaths per 100,000 licensed drivers — 19th highest since 1968
> Total fatalities: 44,257 — 20th highest since 1968
> Licensed drivers: 155,424,000 — 17th fewest since 1968
> Lives saved by wearing seat belts: 1,151 — 17th lowest since 1968
[recirclink id=1162502]
1985
> Auto fatality rate: 27.9 deaths per 100,000 licensed drivers — 20th highest since 1968
> Total fatalities: 43,825 — 22nd highest since 1968
> Licensed drivers: 156,868,000 — 18th fewest since 1968
> Lives saved by wearing seat belts: 2,370 — 18th lowest since 1968
1986
> Auto fatality rate: 28.9 deaths per 100,000 licensed drivers — 17th highest since 1968
> Total fatalities: 46,087 — 14th highest since 1968
> Licensed drivers: 159,486,000 — 19th fewest since 1968
> Lives saved by wearing seat belts: 3,979 — 19th lowest since 1968
[in-text-ad-2]
1987
> Auto fatality rate: 28.7 deaths per 100,000 licensed drivers — 18th highest since 1968
> Total fatalities: 46,390 — 13th highest since 1968
> Licensed drivers: 161,816,000 — 20th fewest since 1968
> Lives saved by wearing seat belts: 5,075 — 20th lowest since 1968
1988
> Auto fatality rate: 28.9 deaths per 100,000 licensed drivers — 16th highest since 1968
> Total fatalities: 47,087 — 12th highest since 1968
> Licensed drivers: 162,854,000 — 21st fewest since 1968
> Lives saved by wearing seat belts: 5,971 — 21st lowest since 1968
[in-text-ad]
1989
> Auto fatality rate: 27.5 deaths per 100,000 licensed drivers — 22nd highest since 1968
> Total fatalities: 45,582 — 15th highest since 1968
> Licensed drivers: 165,554,000 — 22nd fewest since 1968
> Lives saved by wearing seat belts: 6,190 — 22nd lowest since 1968
[recirclink id=1027744]
1990
> Auto fatality rate: 26.7 deaths per 100,000 licensed drivers — 23rd highest since 1968
> Total fatalities: 44,599 — 18th highest since 1968
> Licensed drivers: 167,015,000 — 23rd fewest since 1968
> Lives saved by wearing seat belts: 6,373 — 23rd lowest since 1968
1991
> Auto fatality rate: 24.6 deaths per 100,000 licensed drivers — 24th highest since 1968
> Total fatalities: 41,508 — 19th lowest since 1968
> Licensed drivers: 168,995,000 — 24th fewest since 1968
> Lives saved by wearing seat belts: 6,915 — 24th lowest since 1968
[in-text-ad-2]
1992
> Auto fatality rate: 22.7 deaths per 100,000 licensed drivers — 24th lowest since 1968
> Total fatalities: 39,250 — 14th lowest since 1968
> Licensed drivers: 173,125,000 — 25th fewest since 1968
> Lives saved by wearing seat belts: 7,269 — 25th lowest since 1968
1993
> Auto fatality rate: 23.2 deaths per 100,000 licensed drivers — 26th lowest since 1968
> Total fatalities: 40,150 — 15th lowest since 1968
> Licensed drivers: 173,149,000 — 26th fewest since 1968
> Lives saved by wearing seat belts: 8,235 — 25th highest since 1968
[in-text-ad]
1994
> Auto fatality rate: 23.2 deaths per 100,000 licensed drivers — 27th highest since 1968
> Total fatalities: 40,716 — 16th lowest since 1968
> Licensed drivers: 175,403,000 — 27th most since 1968
> Lives saved by wearing seat belts: 9,125 — 24th highest since 1968
[recirclink id=1162180]
1995
> Auto fatality rate: 23.7 deaths per 100,000 licensed drivers — 25th highest since 1968
> Total fatalities: 41,817 — 21st lowest since 1968
> Licensed drivers: 176,628,482 — 26th most since 1968
> Lives saved by wearing seat belts: 9,461 — 23rd highest since 1968
1996
> Auto fatality rate: 23.4 deaths per 100,000 licensed drivers — 26th highest since 1968
> Total fatalities: 42,065 — 24th lowest since 1968
> Licensed drivers: 179,539,340 — 25th most since 1968
> Lives saved by wearing seat belts: 10,569 — 22nd highest since 1968
[in-text-ad-2]
1997
> Auto fatality rate: 23.0 deaths per 100,000 licensed drivers — 25th lowest since 1968
> Total fatalities: 42,013 — 23rd lowest since 1968
> Licensed drivers: 182,709,204 — 24th most since 1968
> Lives saved by wearing seat belts: 11,022 — 21st highest since 1968
1998
> Auto fatality rate: 22.4 deaths per 100,000 licensed drivers — 23rd lowest since 1968
> Total fatalities: 41,501 — 18th lowest since 1968
> Licensed drivers: 184,860,969 — 23rd most since 1968
> Lives saved by wearing seat belts: 11,556 — 20th highest since 1968
[in-text-ad]
1999
> Auto fatality rate: 22.3 deaths per 100,000 licensed drivers — 22nd lowest since 1968
> Total fatalities: 41,717 — 20th lowest since 1968
> Licensed drivers: 187,170,420 — 22nd most since 1968
> Lives saved by wearing seat belts: 11,717 — 19th highest since 1968
[recirclink id=1162502]
2000
> Auto fatality rate: 22.0 deaths per 100,000 licensed drivers — 19th lowest since 1968
> Total fatalities: 41,945 — 22nd lowest since 1968
> Licensed drivers: 190,625,023 — 21st most since 1968
> Lives saved by wearing seat belts: 12,999 — 17th highest since 1968
2001
> Auto fatality rate: 22.1 deaths per 100,000 licensed drivers — 20th lowest since 1968
> Total fatalities: 42,196 — 25th lowest since 1968
> Licensed drivers: 191,275,719 — 20th most since 1968
> Lives saved by wearing seat belts: 13,564 — 15th highest since 1968
[in-text-ad-2]
2002
> Auto fatality rate: 22.1 deaths per 100,000 licensed drivers — 21st lowest since 1968
> Total fatalities: 43,005 — 24th highest since 1968
> Licensed drivers: 194,602,202 — 19th most since 1968
> Lives saved by wearing seat belts: 14,919 — 12th highest since 1968
2003
> Auto fatality rate: 21.9 deaths per 100,000 licensed drivers — 18th lowest since 1968
> Total fatalities: 42,884 — 25th highest since 1968
> Licensed drivers: 196,165,667 — 18th most since 1968
> Lives saved by wearing seat belts: 15,795 — 5th highest since 1968
[in-text-ad]
2004
> Auto fatality rate: 21.5 deaths per 100,000 licensed drivers — 16th lowest since 1968
> Total fatalities: 42,836 — 26th highest since 1968
> Licensed drivers: 198,888,912 — 17th most since 1968
> Lives saved by wearing seat belts: 16,307 — 4th highest since 1968
[recirclink id=1162267]
2005
> Auto fatality rate: 21.7 deaths per 100,000 licensed drivers — 17th lowest since 1968
> Total fatalities: 43,510 — 23rd highest since 1968
> Licensed drivers: 200,548,972 — 16th most since 1968
> Lives saved by wearing seat belts: 17,373 — the highest since 1968
2006
> Auto fatality rate: 21.1 deaths per 100,000 licensed drivers — 15th lowest since 1968
> Total fatalities: 42,708 — 27th highest since 1968
> Licensed drivers: 202,810,438 — 15th most since 1968
> Lives saved by wearing seat belts: 17,287 — 3rd highest since 1968
[in-text-ad-2]
2007
> Auto fatality rate: 20.1 deaths per 100,000 licensed drivers — 14th lowest since 1968
> Total fatalities: 41,259 — 17th lowest since 1968
> Licensed drivers: 205,741,845 — 14th most since 1968
> Lives saved by wearing seat belts: 17,296 — 2nd highest since 1968
2008
> Auto fatality rate: 18.0 deaths per 100,000 licensed drivers — 13th lowest since 1968
> Total fatalities: 37,423 — 10th lowest since 1968
> Licensed drivers: 208,320,601 — 13th most since 1968
> Lives saved by wearing seat belts: 15,763 — 6th highest since 1968
[in-text-ad]
2009
> Auto fatality rate: 16.2 deaths per 100,000 licensed drivers — 7th lowest since 1968
> Total fatalities: 33,883 — 6th lowest since 1968
> Licensed drivers: 209,618,386 — 12th most since 1968
> Lives saved by wearing seat belts: 15,118 — 9th highest since 1968
[recirclink id=1162502]
2010
> Auto fatality rate: 15.7 deaths per 100,000 licensed drivers — 4th lowest since 1968
> Total fatalities: 32,999 — 4th lowest since 1968
> Licensed drivers: 210,114,939 — 11th most since 1968
> Lives saved by wearing seat belts: 15,229 — 8th highest since 1968
2011
> Auto fatality rate: 15.3 deaths per 100,000 licensed drivers — 2nd lowest since 1968
> Total fatalities: 32,479 — the lowest since 1968
> Licensed drivers: 211,874,649 — 9th most since 1968
> Lives saved by wearing seat belts: 14,766 — 13th highest since 1968
[in-text-ad-2]
2012
> Auto fatality rate: 15.9 deaths per 100,000 licensed drivers — 6th lowest since 1968
> Total fatalities: 33,782 — 5th lowest since 1968
> Licensed drivers: 211,814,830 — 10th most since 1968
> Lives saved by wearing seat belts: 15,485 — 7th highest since 1968
2013
> Auto fatality rate: 15.5 deaths per 100,000 licensed drivers — 3rd lowest since 1968
> Total fatalities: 32,893 — 3rd lowest since 1968
> Licensed drivers: 212,159,728 — 8th most since 1968
> Lives saved by wearing seat belts: 12,847 — 18th highest since 1968
[in-text-ad]
2014
> Auto fatality rate: 15.3 deaths per 100,000 licensed drivers — the lowest since 1968
> Total fatalities: 32,744 — 2nd lowest since 1968
> Licensed drivers: 214,092,472 — 7th most since 1968
> Lives saved by wearing seat belts: 13,054 — 16th highest since 1968
[recirclink id=1027744]
2015
> Auto fatality rate: 16.3 deaths per 100,000 licensed drivers — 9th lowest since 1968
> Total fatalities: 35,484 — 7th lowest since 1968
> Licensed drivers: 218,084,465 — 6th most since 1968
> Lives saved by wearing seat belts: 14,207 — 14th highest since 1968
2016
> Auto fatality rate: 17.1 deaths per 100,000 licensed drivers — 12th lowest since 1968
> Total fatalities: 37,806 — 12th lowest since 1968
> Licensed drivers: 221,711,918 — 5th most since 1968
> Lives saved by wearing seat belts: 14,996 — 10th highest since 1968
[in-text-ad-2]
2017
> Auto fatality rate: 16.6 deaths per 100,000 licensed drivers — 10th lowest since 1968
> Total fatalities: 37,473 — 11th lowest since 1968
> Licensed drivers: 225,346,257 — 4th most since 1968
> Lives saved by wearing seat belts: 14,955 — 11th highest since 1968
2018
> Auto fatality rate: 16.2 deaths per 100,000 licensed drivers — 8th lowest since 1968
> Total fatalities: 36,835 — 9th lowest since 1968
> Licensed drivers: 227,558,385 — 3rd most since 1968
> Lives saved by wearing seat belts: N/A
[in-text-ad]

2019
> Auto fatality rate: 15.9 deaths per 100,000 licensed drivers — 5th lowest since 1968
> Total fatalities: 36,355 — 8th lowest since 1968
> Licensed drivers: 228,915,520 — the most since 1968
> Lives saved by wearing seat belts: N/A
[recirclink id=1162180]

2020
> Auto fatality rate: 17.0 deaths per 100,000 licensed drivers — 11th lowest since 1968
> Total fatalities: 38,824 — 13th lowest since 1968
> Licensed drivers: 228,195,802 — 2nd most since 1968
> Lives saved by wearing seat belts: N/A
Contact [email protected] for any questions or corrections.