The youngest members of the massive postwar Boomer generation will soon hit retirement age, while many of the oldest are in their 70s. At the same time, U.S. birth rates have been on a steady decline — by 20% from 2007 to 2020, according to Econofact.org using data from the U.S. Centers of Disease Control and Prevention.
This means the U.S. population is expected to age significantly over the coming decades as younger generations have fewer children and people generally live longer. (That said, certain factors like the COVID-19 pandemic and drug overdoses have driven down life expectancy in the U.S. in recent years. Here are 28 states with the shortest life expectancy.)
By 2060, about a quarter of all U.S. residents will be over the age of 65, according to the U.S. Census Bureau.
To determine the cities that will age the most by 2060, 24/7 Wall St. reviewed population projections data from Woods & Poole Economics, Inc., Washington D.C. Copyright 2022. Metropolitan areas were ranked based on the absolute projected change in median age from 2022 to 2060. Supplemental data on the projected share of the population 65 years and older and projections for the total population are also from Woods & Poole.
Nationwide, the median age in 2022 is estimated at 38.4. It is projected to rise to 41.1 by 2060, a 2.7 years increase. Among the 40 U.S. metropolitan areas on the list, the projected increase in the median age between 2022 and 2060 ranges from 6.2 years in Champaign-Urbana, Illinois, to nearly 14.5 years in Flagstaff, Arizona. (Here are 22 states where people live the longest.)
The share of the population that is 65 years of age and over nationwide is 17.6%, according to Woods & Poole. That share is expected to increase to 22.3% by 2060. In the metropolitan areas on the list, the share of the population 65 and over is expected to be above 34% by 2060 in five cities, including Bend, Oregon, and St. George, Utah.
The Villages, Florida, will continue to be the city with the largest elderly population in the country. The median age in this massive, age-restricted retirement community is expected to rise to 76.1 years by 2060, up from the current 69 years.
Places with warmer year-round weather tend to attract retirees who want to avoid harsh winters. And the country’s three largest states by population that are also known to have mild cold seasons have the most cities that are projected to experience the biggest increases in median age: Texas, Florida, and California.
Two cities that are projected to age the most by 2060 are also projected to have a million residents by 2060: the metropolitan areas of Los Angeles and Orlando, Florida.
Here are the cities that will age the most.
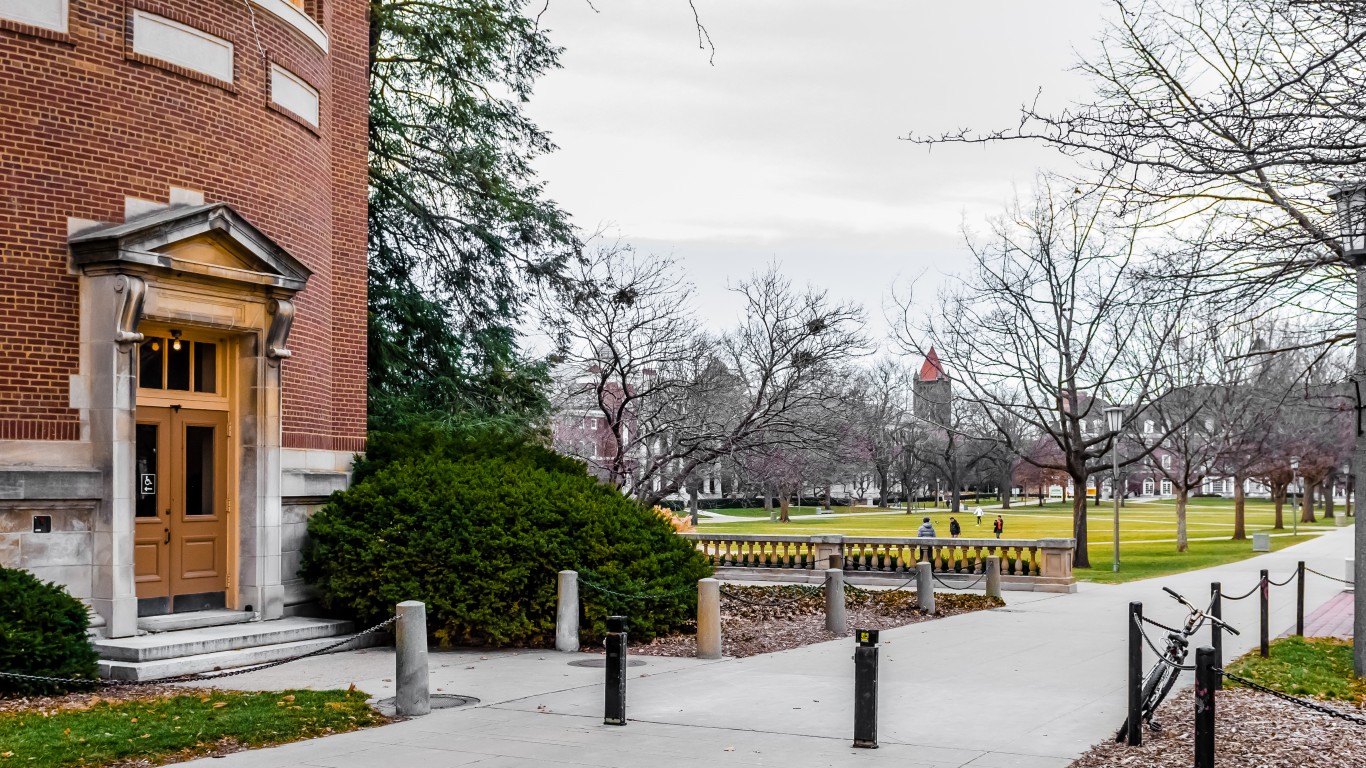
40. Champaign-Urbana, IL
> Projected median age, 2060: 37.2 years (+6.2 years from 2022)
> Projected 65+ population, 2060: 18.4% (+3.7 ppts. from 2022)
> Projected total population, 2060: 258,303 (+15.4% from 2022)
> Total population, 2022: 223,920
[in-text-ad]
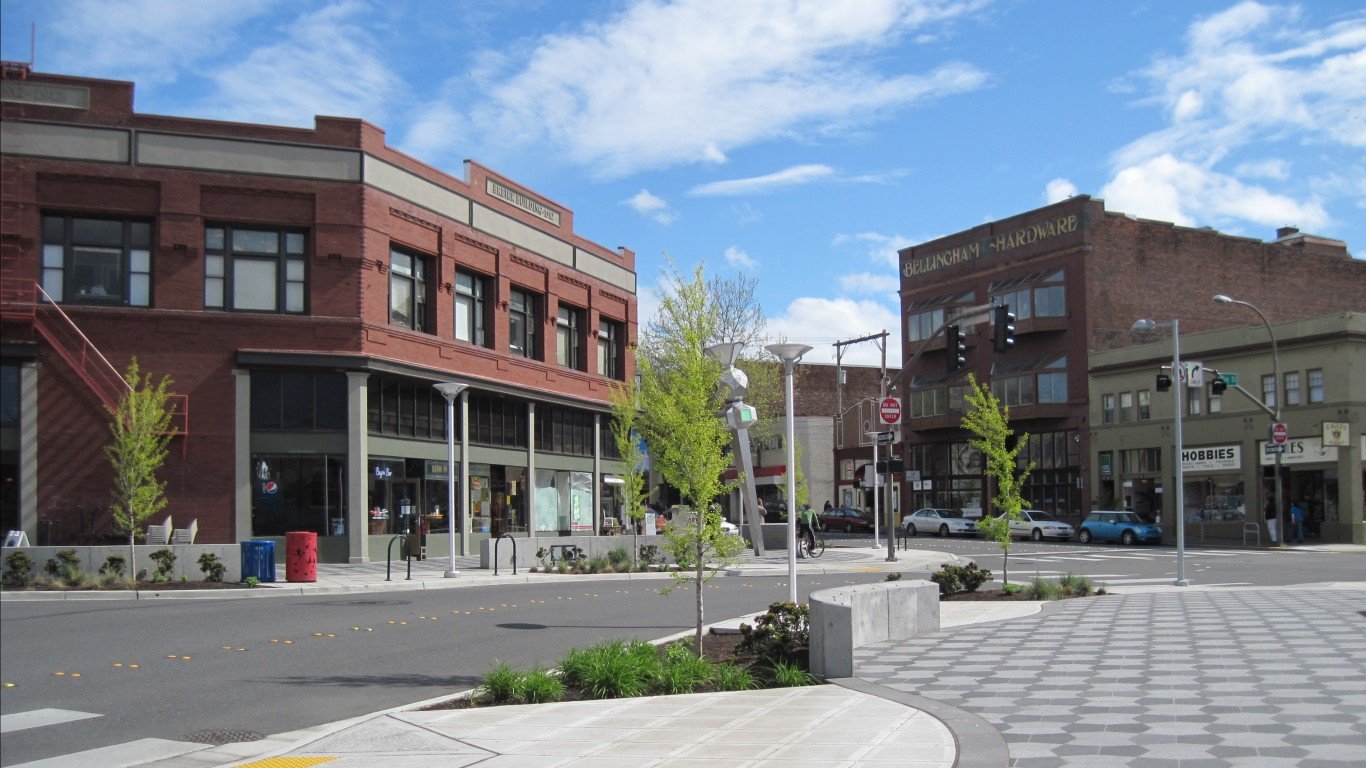
39. Bellingham, WA
> Projected median age, 2060: 43.8 years (+6.3 years from 2022)
> Projected 65+ population, 2060: 24.9% (+5.6 ppts. from 2022)
> Projected total population, 2060: 326,092 (+41.2% from 2022)
> Total population, 2022: 230,918
[recirclink id=1166374]

38. San Jose-Sunnyvale-Santa Clara, CA
> Projected median age, 2060: 43.8 years (+6.4 years from 2022)
> Projected 65+ population, 2060: 24.1% (+9.3 ppts. from 2022)
> Projected total population, 2060: 2.5 million (+25.4% from 2022)
> Total population, 2022: 2.0 million
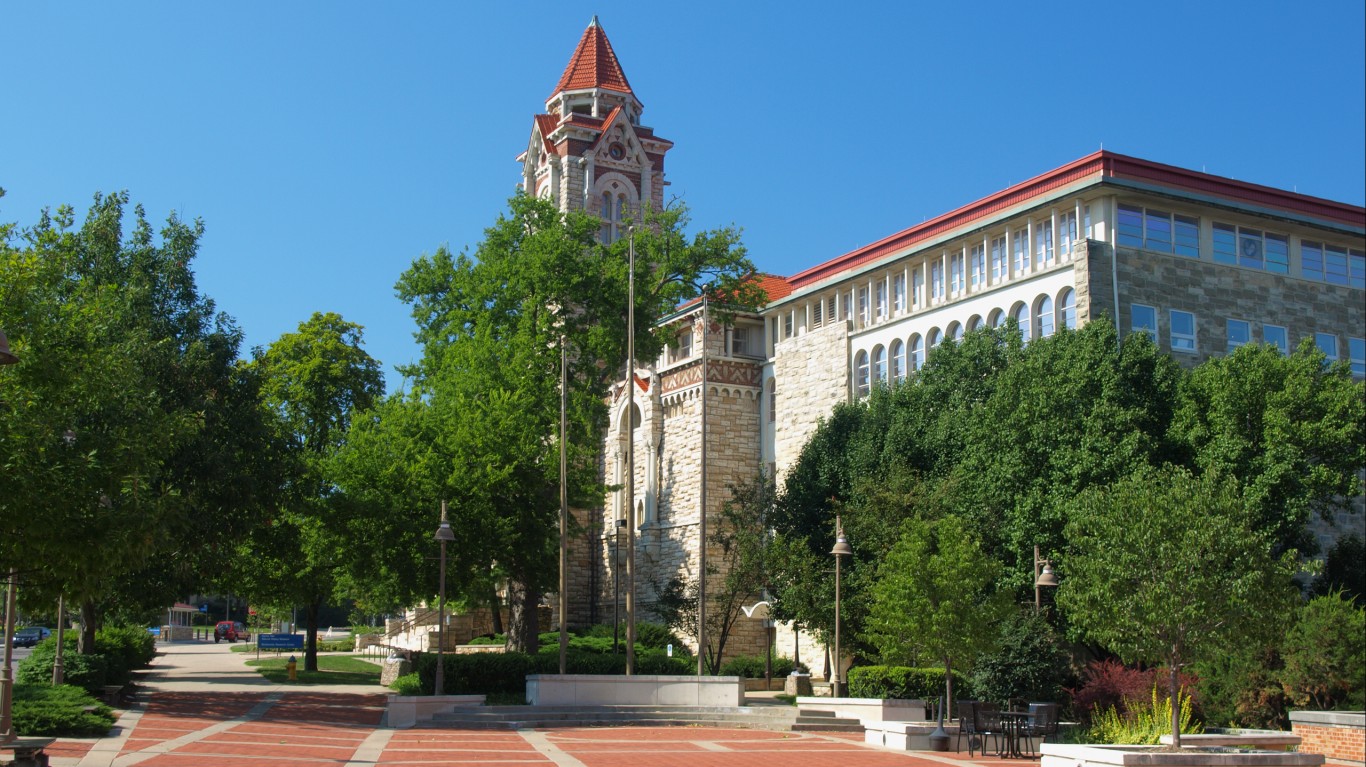
37. Lawrence, KS
> Projected median age, 2060: 36.9 years (+6.4 years from 2022)
> Projected 65+ population, 2060: 17.7% (+4.0 ppts. from 2022)
> Projected total population, 2060: 154,315 (+28.2% from 2022)
> Total population, 2022: 120,384
[in-text-ad-2]
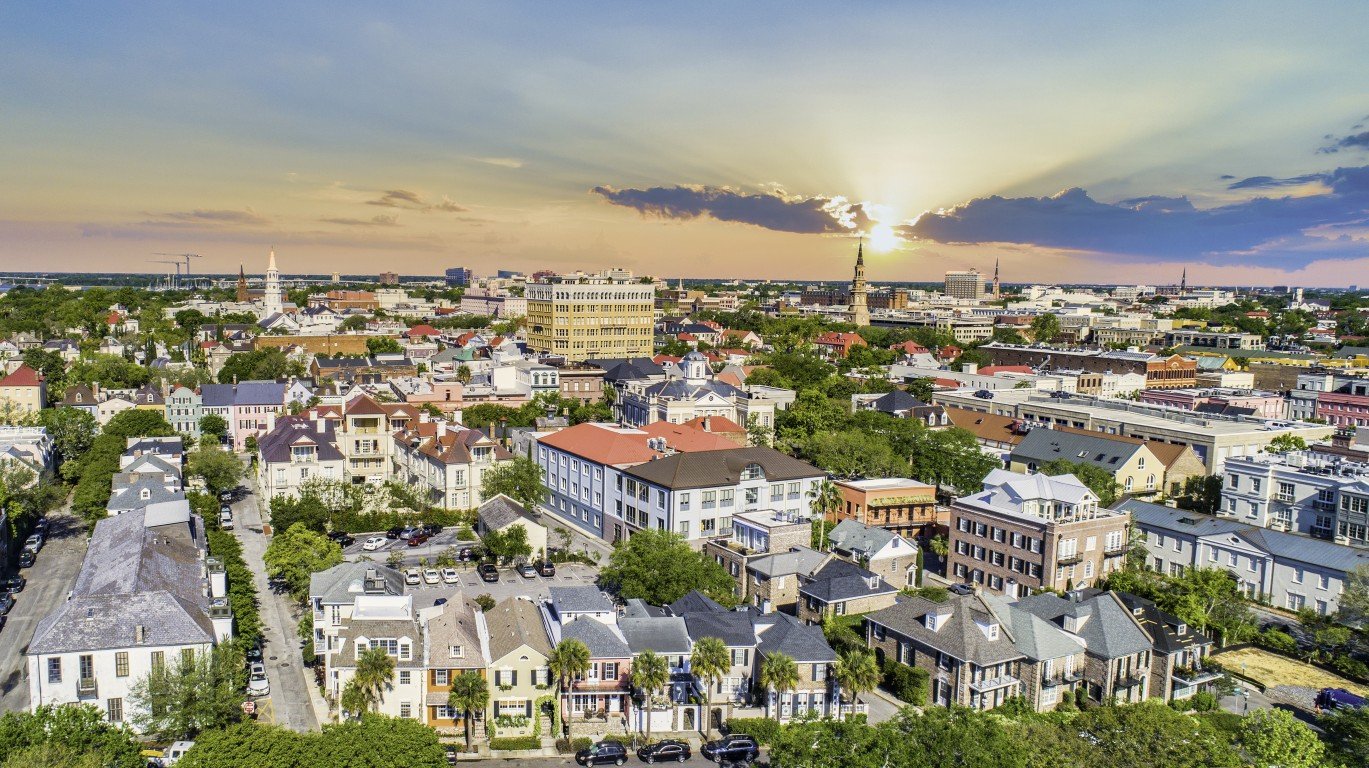
36. Charleston-North Charleston, SC
> Projected median age, 2060: 44.7 years (+6.4 years from 2022)
> Projected 65+ population, 2060: 26.8% (+9.7 ppts. from 2022)
> Projected total population, 2060: 1.3 million (+60.3% from 2022)
> Total population, 2022: 824,403

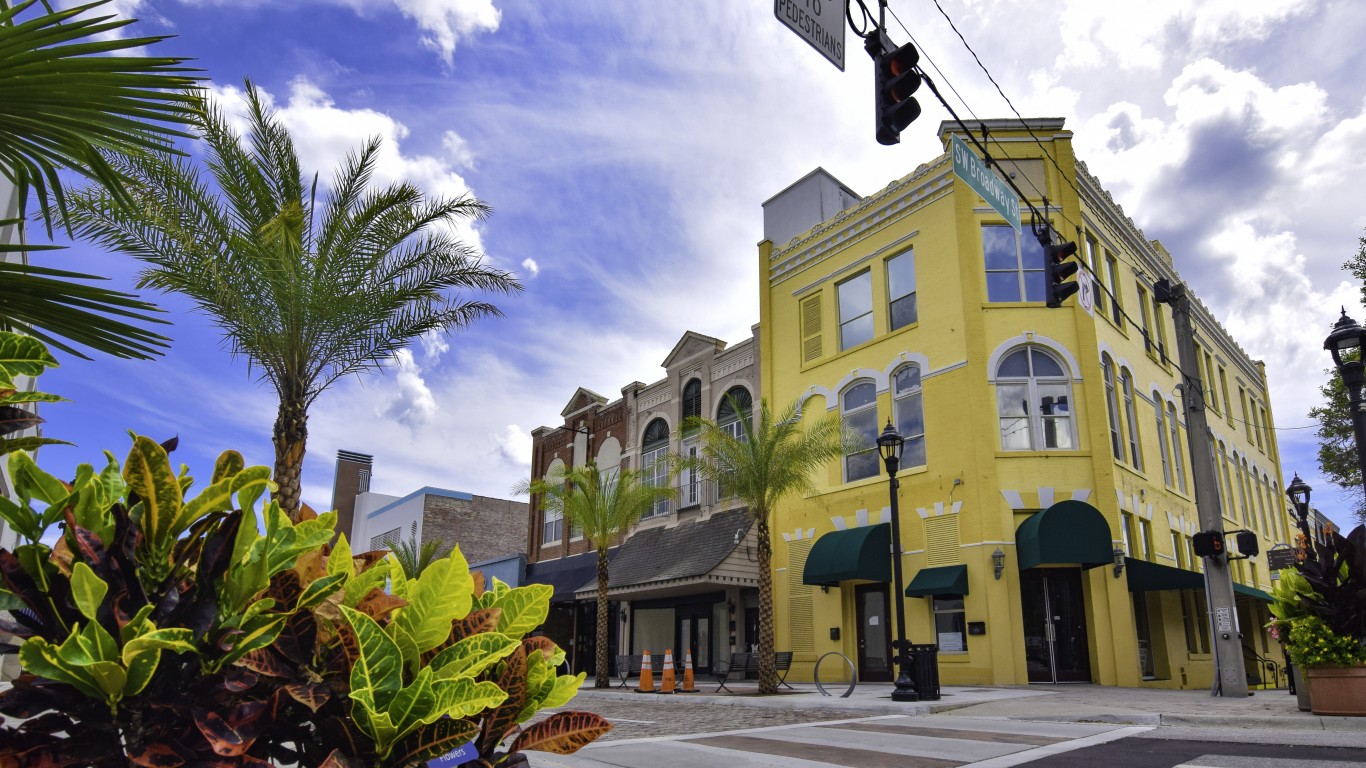
35. Pensacola-Ferry Pass-Brent, FL
> Projected median age, 2060: 44.7 years (+6.5 years from 2022)
> Projected 65+ population, 2060: 26.0% (+7.9 ppts. from 2022)
> Projected total population, 2060: 682,984 (+31.1% from 2022)
> Total population, 2022: 520,897
[in-text-ad]

34. Burlington-South Burlington, VT
> Projected median age, 2060: 44.4 years (+6.9 years from 2022)
> Projected 65+ population, 2060: 25.1% (+7.6 ppts. from 2022)
> Projected total population, 2060: 258,010 (+13.3% from 2022)
> Total population, 2022: 227,697
[recirclink id=1165876]

33. Coeur D’Alene, ID
> Projected median age, 2060: 48.0 years (+7.0 years from 2022)
> Projected 65+ population, 2060: 29.6% (+8.4 ppts. from 2022)
> Projected total population, 2060: 292,627 (+60.5% from 2022)
> Total population, 2022: 182,354

32. Vallejo, CA
> Projected median age, 2060: 45.8 years (+7.0 years from 2022)
> Projected 65+ population, 2060: 28.7% (+10.6 ppts. from 2022)
> Projected total population, 2060: 563,901 (+23.9% from 2022)
> Total population, 2022: 455,018
[in-text-ad-2]
31. Harrisonburg, VA
> Projected median age, 2060: 41.9 years (+7.1 years from 2022)
> Projected 65+ population, 2060: 23.5% (+6.5 ppts. from 2022)
> Projected total population, 2060: 180,869 (+32.0% from 2022)
> Total population, 2022: 137,036

30. The Villages, FL
> Projected median age, 2060: 76.1 years (+7.1 years from 2022)
> Projected 65+ population, 2060: 68.3% (+6.0 ppts. from 2022)
> Projected total population, 2060: 452,092 (+223.2% from 2022)
> Total population, 2022: 139,890
[in-text-ad]
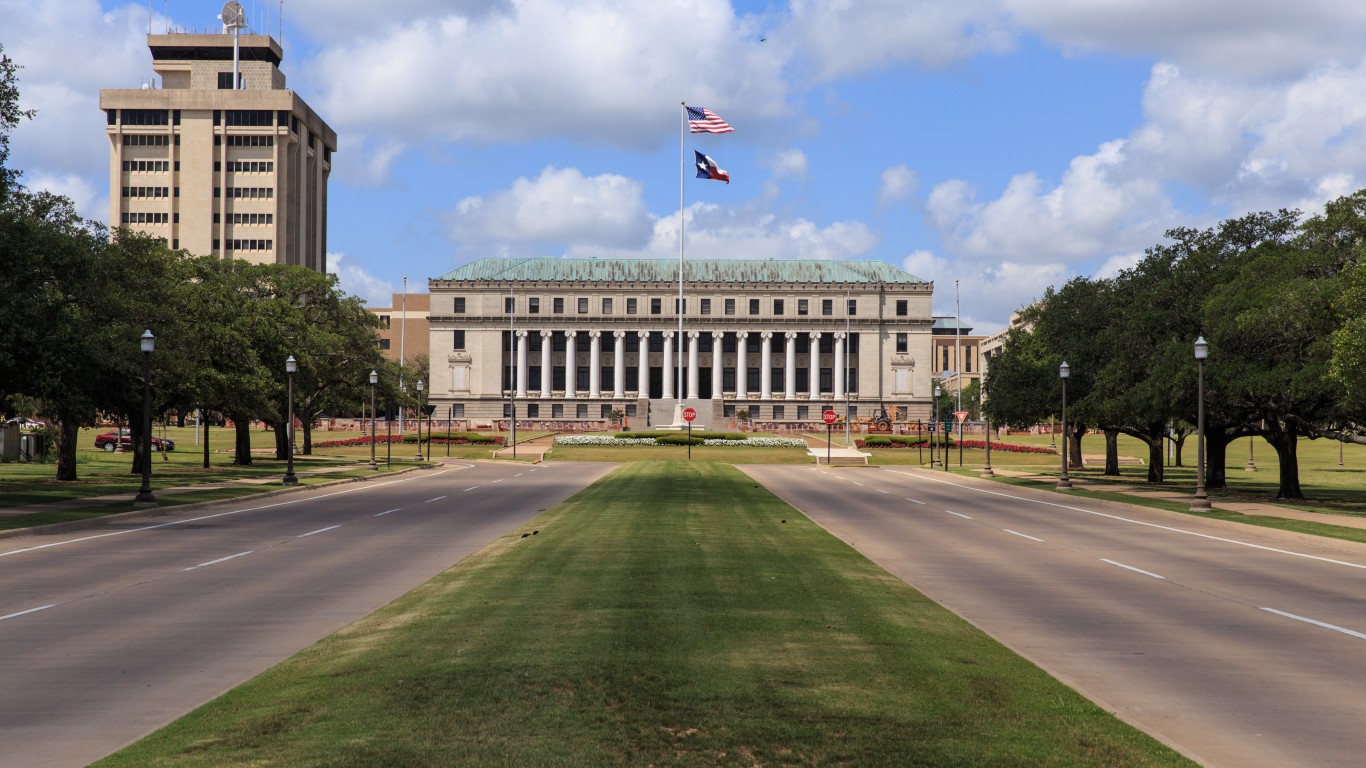
29. College Station-Bryan, TX
> Projected median age, 2060: 36.5 years (+7.2 years from 2022)
> Projected 65+ population, 2060: 19.0% (+6.9 ppts. from 2022)
> Projected total population, 2060: 424,711 (+54.4% from 2022)
> Total population, 2022: 275,123
[recirclink id=1163587]
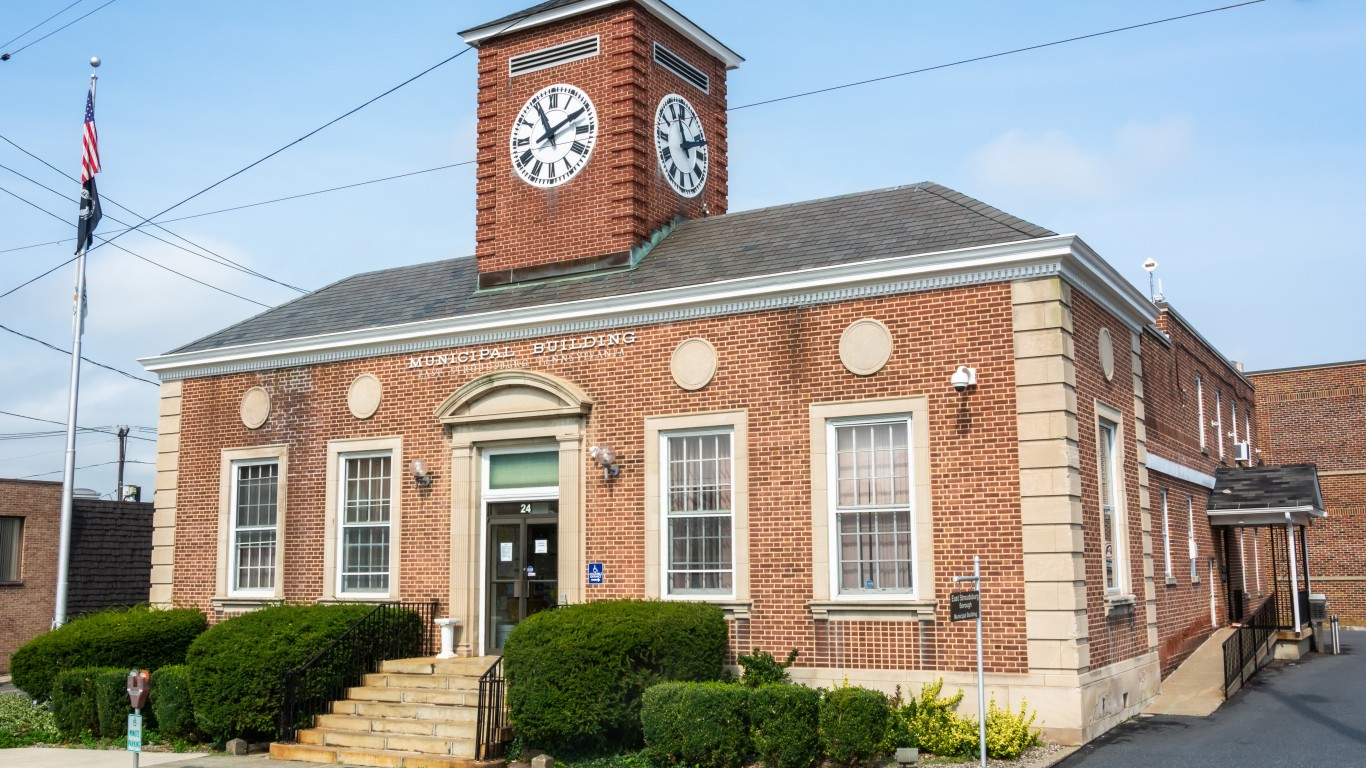
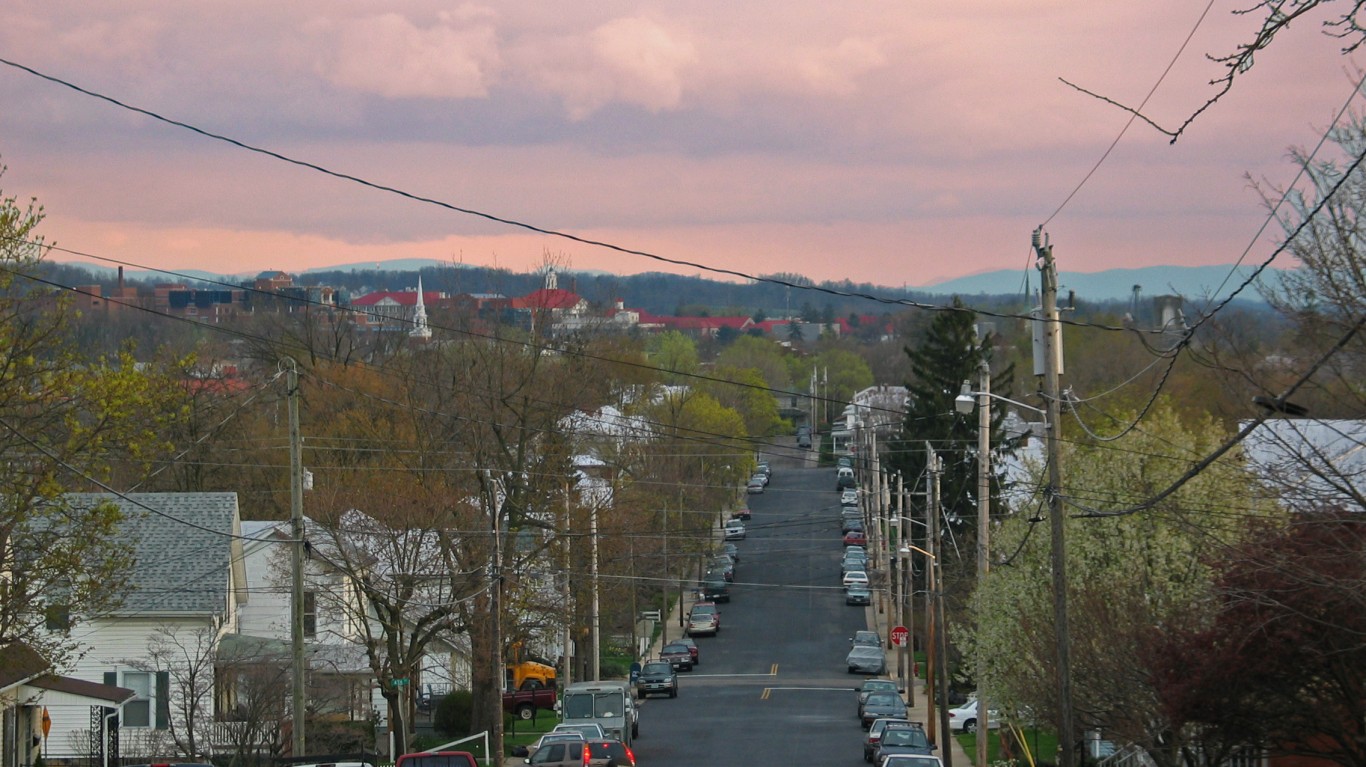
28. East Stroudsburg, PA
> Projected median age, 2060: 50.5 years (+7.3 years from 2022)
> Projected 65+ population, 2060: 27.9% (+7.9 ppts. from 2022)
> Projected total population, 2060: 228,159 (+33.8% from 2022)
> Total population, 2022: 170,574
27. Brownsville-Harlingen, TX
> Projected median age, 2060: 39.7 years (+7.3 years from 2022)
> Projected 65+ population, 2060: 21.7% (+7.0 ppts. from 2022)
> Projected total population, 2060: 587,488 (+37.5% from 2022)
> Total population, 2022: 427,269
[in-text-ad-2]

26. Los Angeles-Long Beach-Anaheim, CA
> Projected median age, 2060: 45.0 years (+7.3 years from 2022)
> Projected 65+ population, 2060: 25.8% (+10.2 ppts. from 2022)
> Projected total population, 2060: 14.3 million (+9.8% from 2022)
> Total population, 2022: 13.1 million

25. Kingston, NY
> Projected median age, 2060: 51.6 years (+7.3 years from 2022)
> Projected 65+ population, 2060: 31.1% (+9.0 ppts. from 2022)
> Projected total population, 2060: 186,754 (+2.0% from 2022)
> Total population, 2022: 183,048
[in-text-ad]

24. Lewiston, ID-WA
> Projected median age, 2060: 50.1 years (+7.4 years from 2022)
> Projected 65+ population, 2060: 32.4% (+8.9 ppts. from 2022)
> Projected total population, 2060: 73,857 (+13.3% from 2022)
> Total population, 2022: 65,167
[recirclink id=1162756]

23. Bismarck, ND
> Projected median age, 2060: 45.6 years (+7.4 years from 2022)
> Projected 65+ population, 2060: 28.1% (+9.7 ppts. from 2022)
> Projected total population, 2060: 185,052 (+36.3% from 2022)
> Total population, 2022: 135,786

22. Farmington, NM
> Projected median age, 2060: 44.5 years (+7.6 years from 2022)
> Projected 65+ population, 2060: 28.5% (+11.3 ppts. from 2022)
> Projected total population, 2060: 141,218 (+16.1% from 2022)
> Total population, 2022: 121,681
[in-text-ad-2]
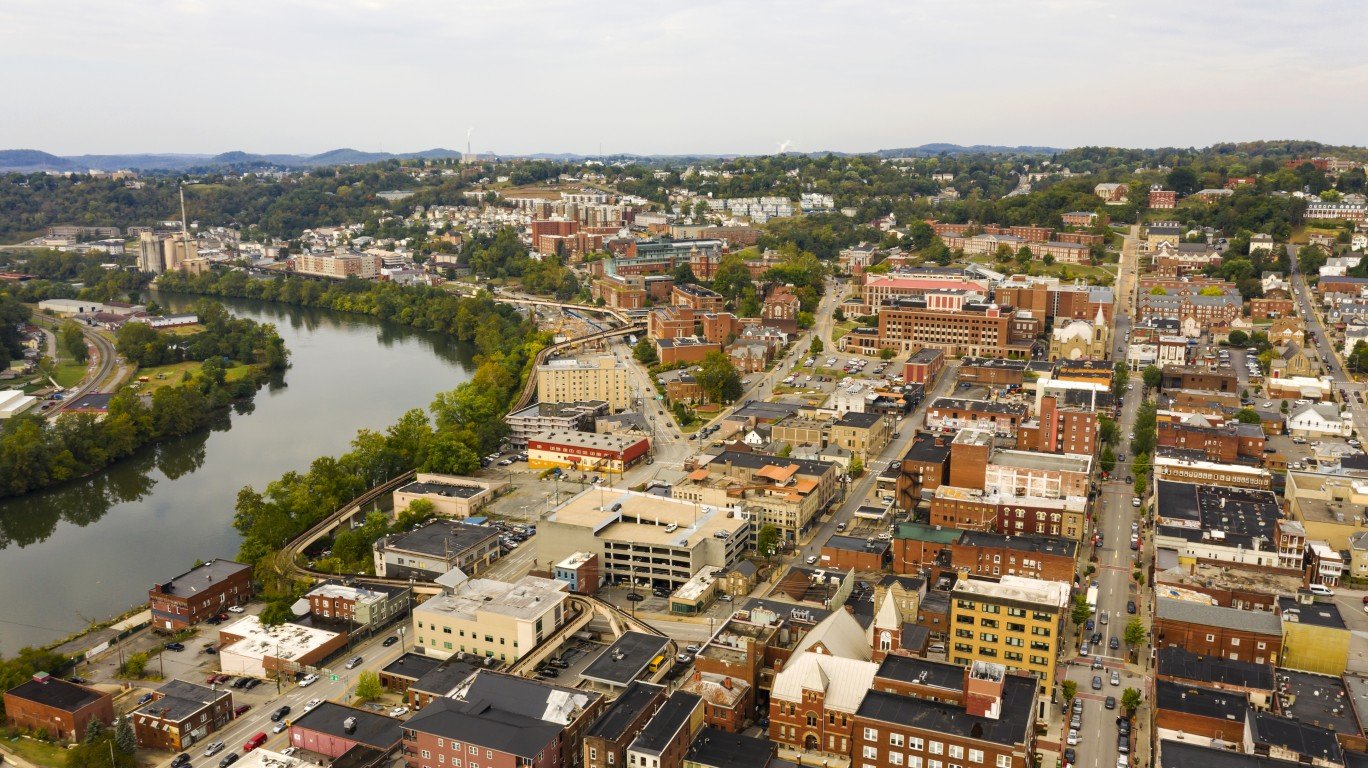
21. Morgantown, WV
> Projected median age, 2060: 42.4 years (+7.7 years from 2022)
> Projected 65+ population, 2060: 22.4% (+6.8 ppts. from 2022)
> Projected total population, 2060: 183,586 (+29.3% from 2022)
> Total population, 2022: 141,956

20. Missoula, MT
> Projected median age, 2060: 44.5 years (+7.8 years from 2022)
> Projected 65+ population, 2060: 25.2% (+7.6 ppts. from 2022)
> Projected total population, 2060: 160,653 (+33.2% from 2022)
> Total population, 2022: 120,623
[in-text-ad]
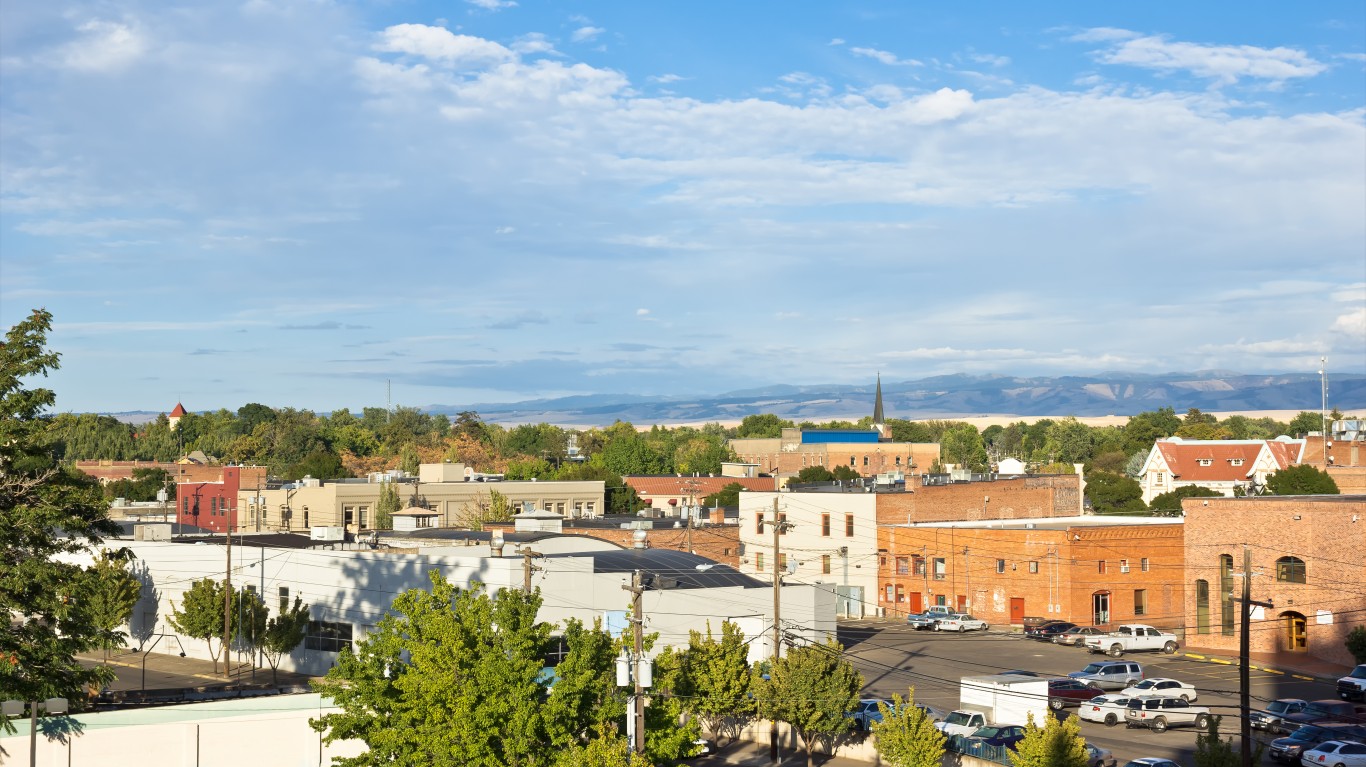
19. Walla Walla, WA
> Projected median age, 2060: 46.4 years (+7.9 years from 2022)
> Projected 65+ population, 2060: 27.5% (+7.1 ppts. from 2022)
> Projected total population, 2060: 71,409 (+13.5% from 2022)
> Total population, 2022: 62,891
[recirclink id=1156704]
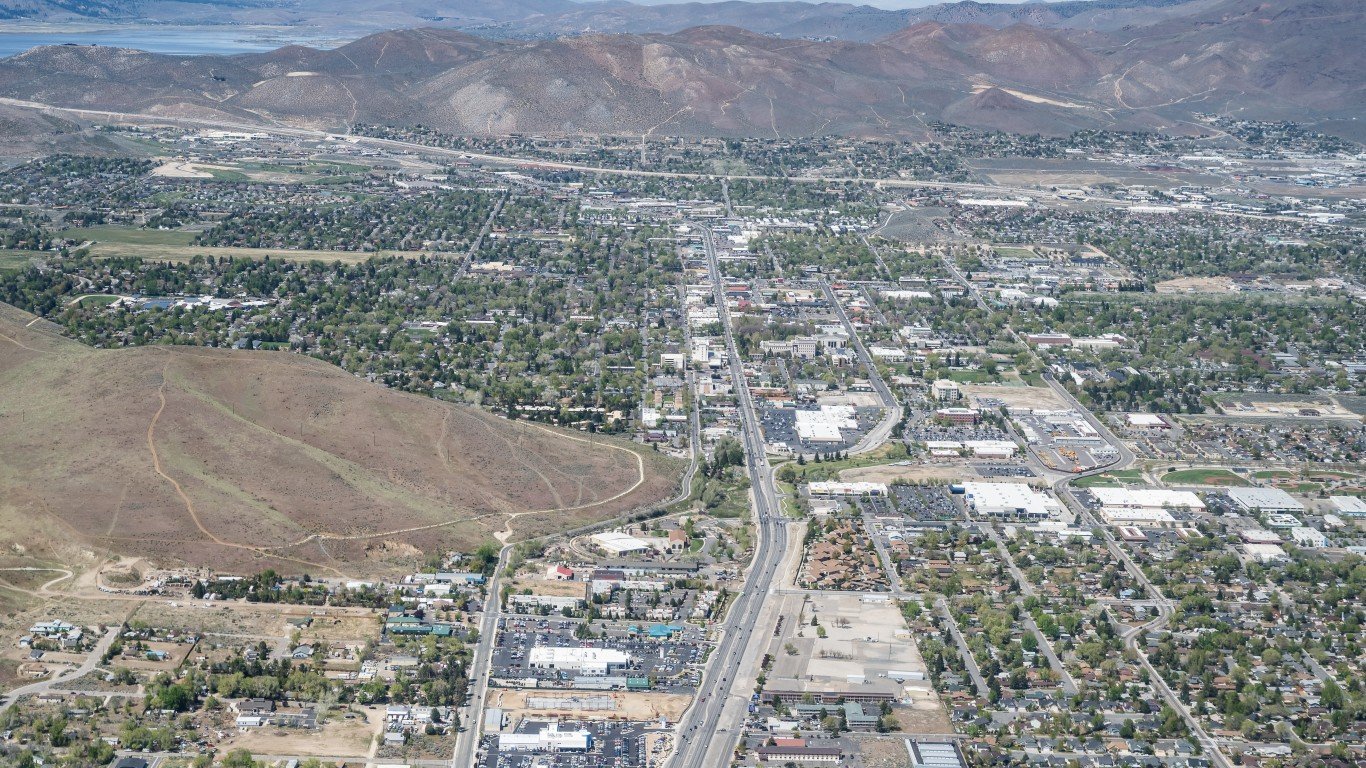
18. Carson City, NV
> Projected median age, 2060: 50.3 years (+7.9 years from 2022)
> Projected 65+ population, 2060: 34.5% (+12.2 ppts. from 2022)
> Projected total population, 2060: 67,478 (+13.8% from 2022)
> Total population, 2022: 59,306
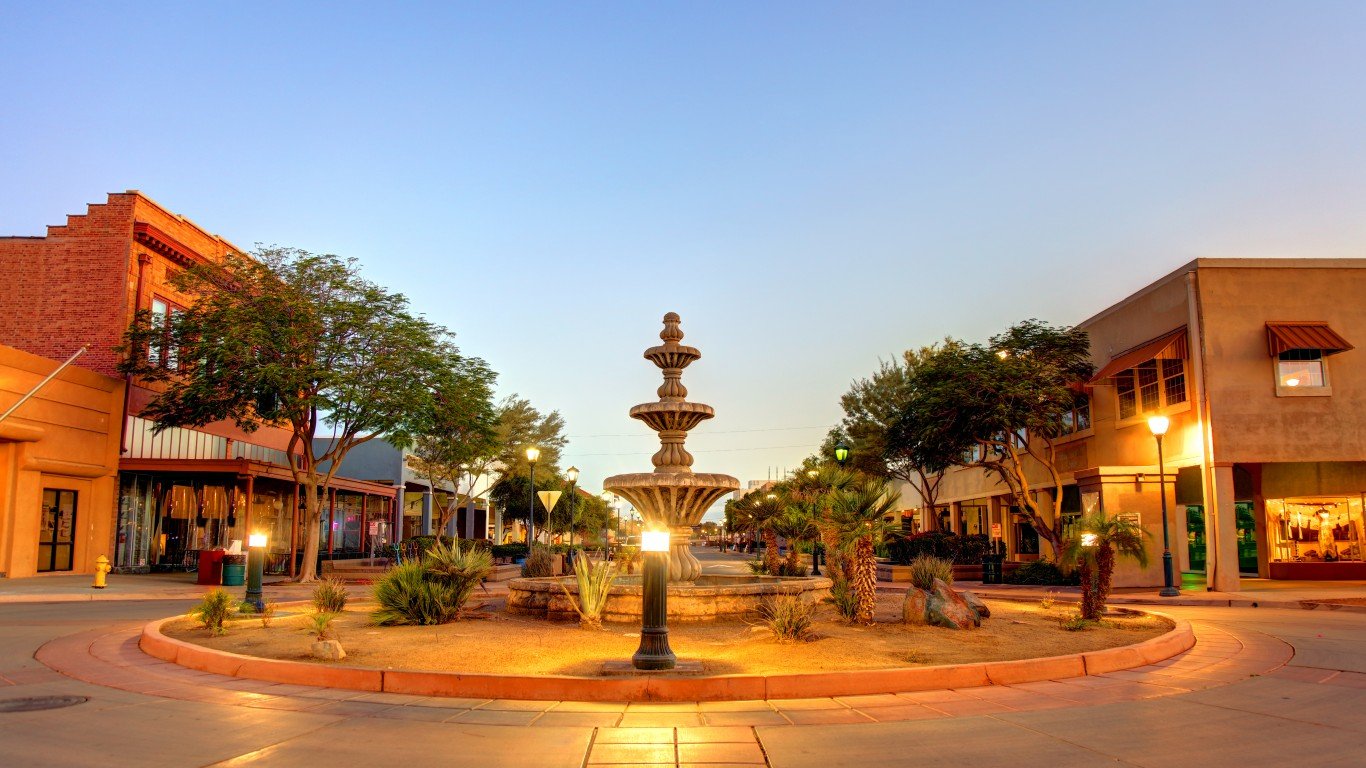
17. Yuma, AZ
> Projected median age, 2060: 43.0 years (+8.0 years from 2022)
> Projected 65+ population, 2060: 26.5% (+6.8 ppts. from 2022)
> Projected total population, 2060: 306,358 (+46.5% from 2022)
> Total population, 2022: 209,081
[in-text-ad-2]
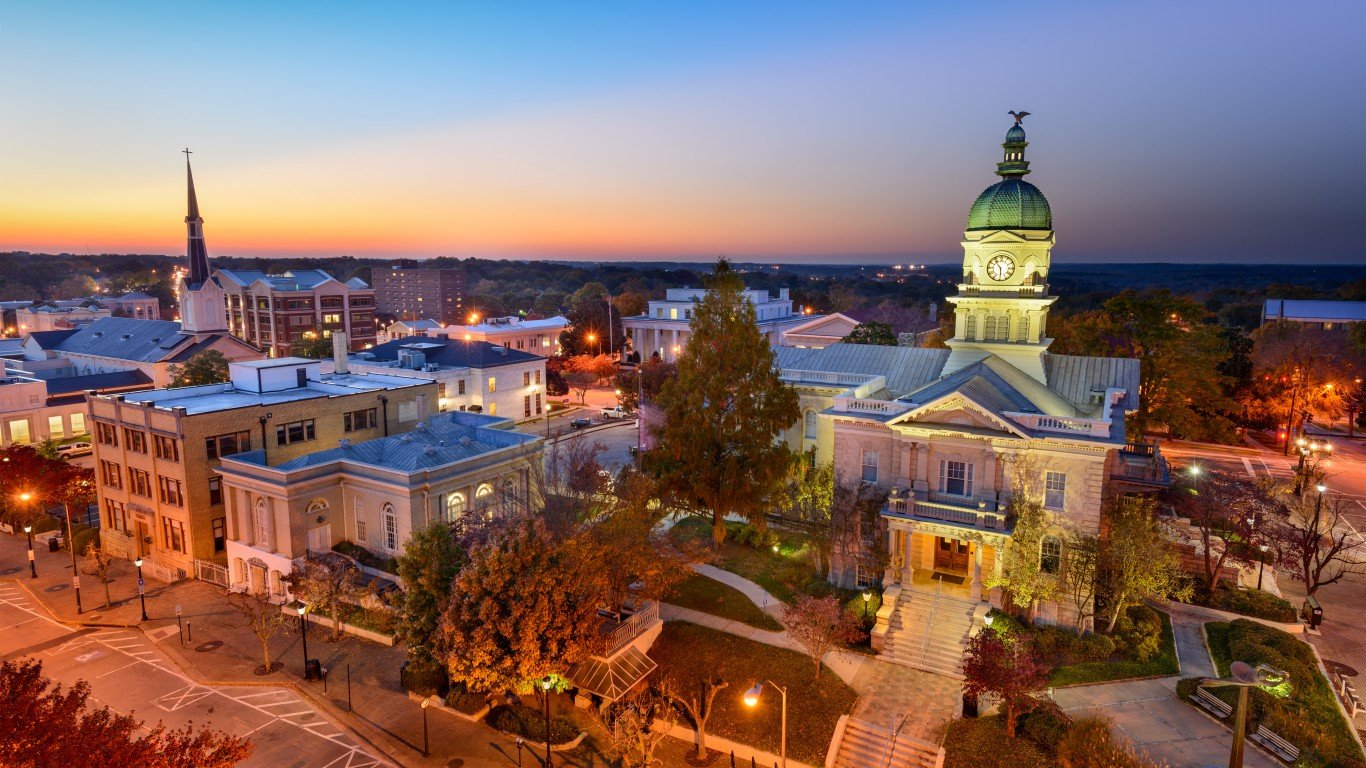
16. Athens-Clarke County, GA
> Projected median age, 2060: 41.1 years (+8.0 years from 2022)
> Projected 65+ population, 2060: 21.4% (+6.8 ppts. from 2022)
> Projected total population, 2060: 293,932 (+33.8% from 2022)
> Total population, 2022: 219,683
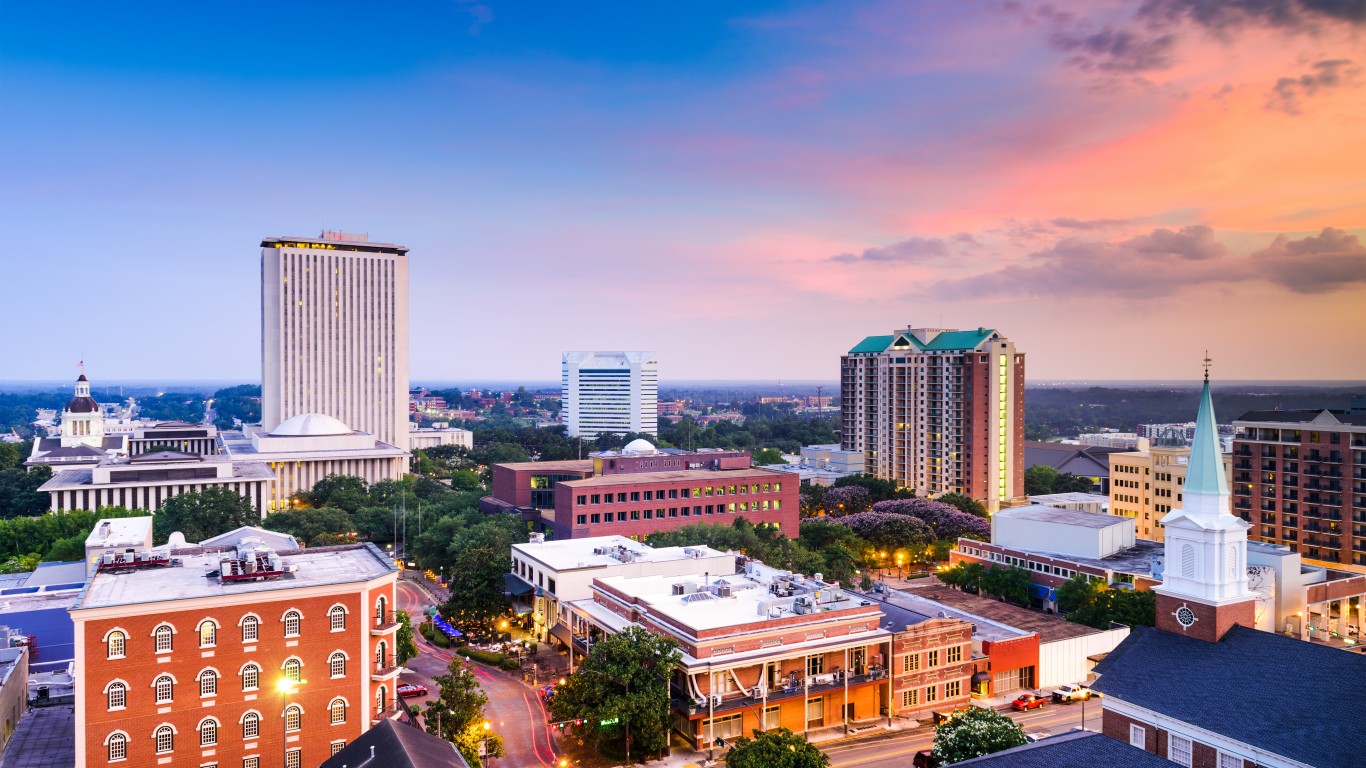
15. Tallahassee, FL
> Projected median age, 2060: 41.7 years (+8.0 years from 2022)
> Projected 65+ population, 2060: 21.6% (+5.6 ppts. from 2022)
> Projected total population, 2060: 496,765 (+27.7% from 2022)
> Total population, 2022: 388,922
[in-text-ad]
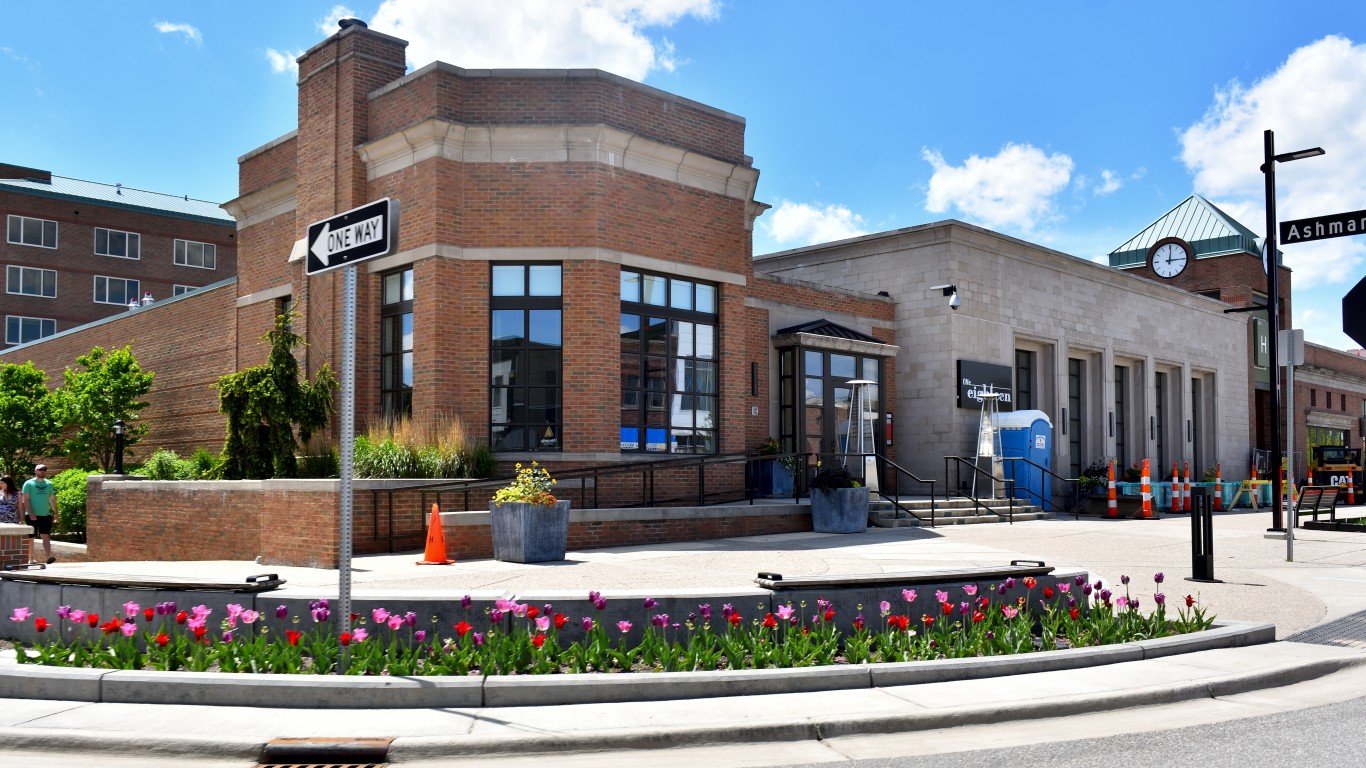
14. Midland, MI
> Projected median age, 2060: 50.0 years (+8.2 years from 2022)
> Projected 65+ population, 2060: 32.7% (+11.8 ppts. from 2022)
> Projected total population, 2060: 85,932 (+2.9% from 2022)
> Total population, 2022: 83,520
[recirclink id=1166374]
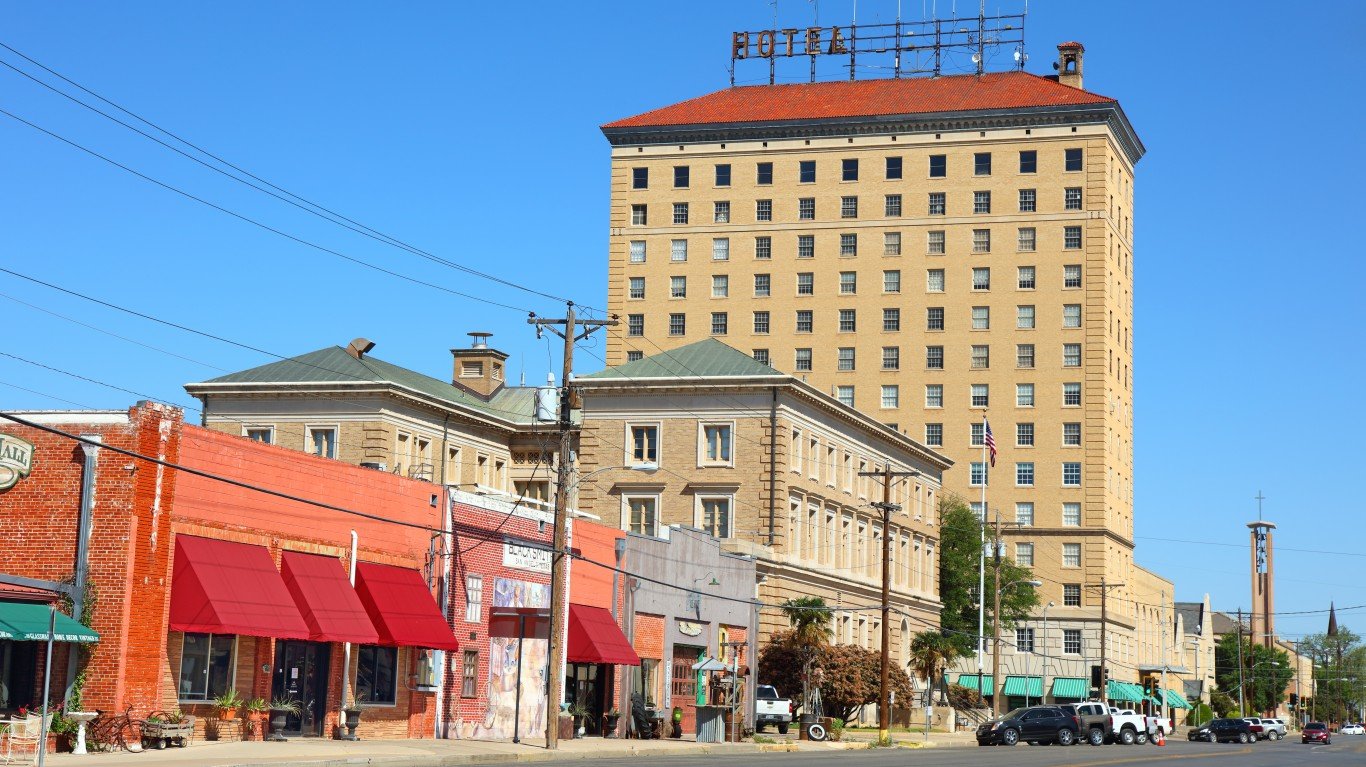
13. San Angelo, TX
> Projected median age, 2060: 43.4 years (+8.2 years from 2022)
> Projected 65+ population, 2060: 26.1% (+9.4 ppts. from 2022)
> Projected total population, 2060: 143,949 (+17.0% from 2022)
> Total population, 2022: 123,050

12. Naples-Marco Island, FL
> Projected median age, 2060: 60.7 years (+8.3 years from 2022)
> Projected 65+ population, 2060: 45.9% (+12.1 ppts. from 2022)
> Projected total population, 2060: 700,703 (+78.5% from 2022)
> Total population, 2022: 392,566
[in-text-ad-2]
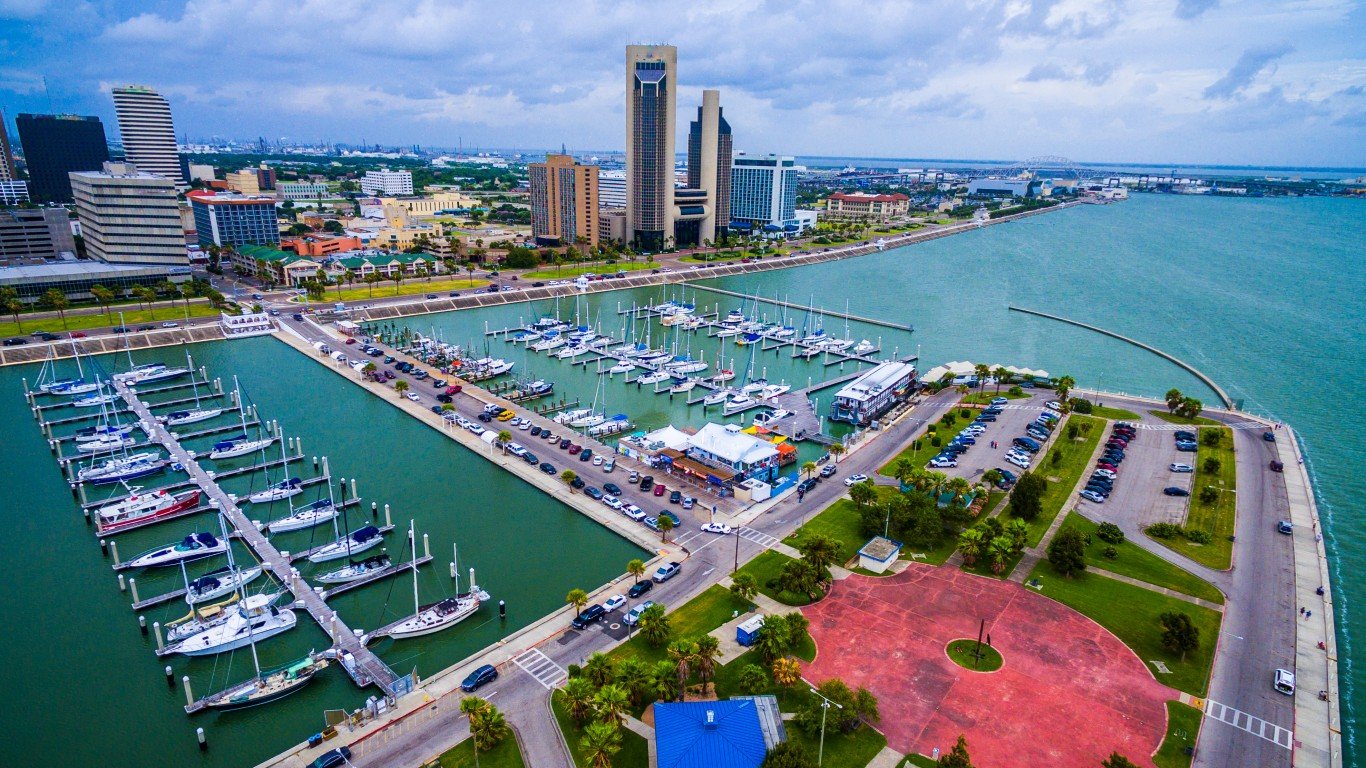
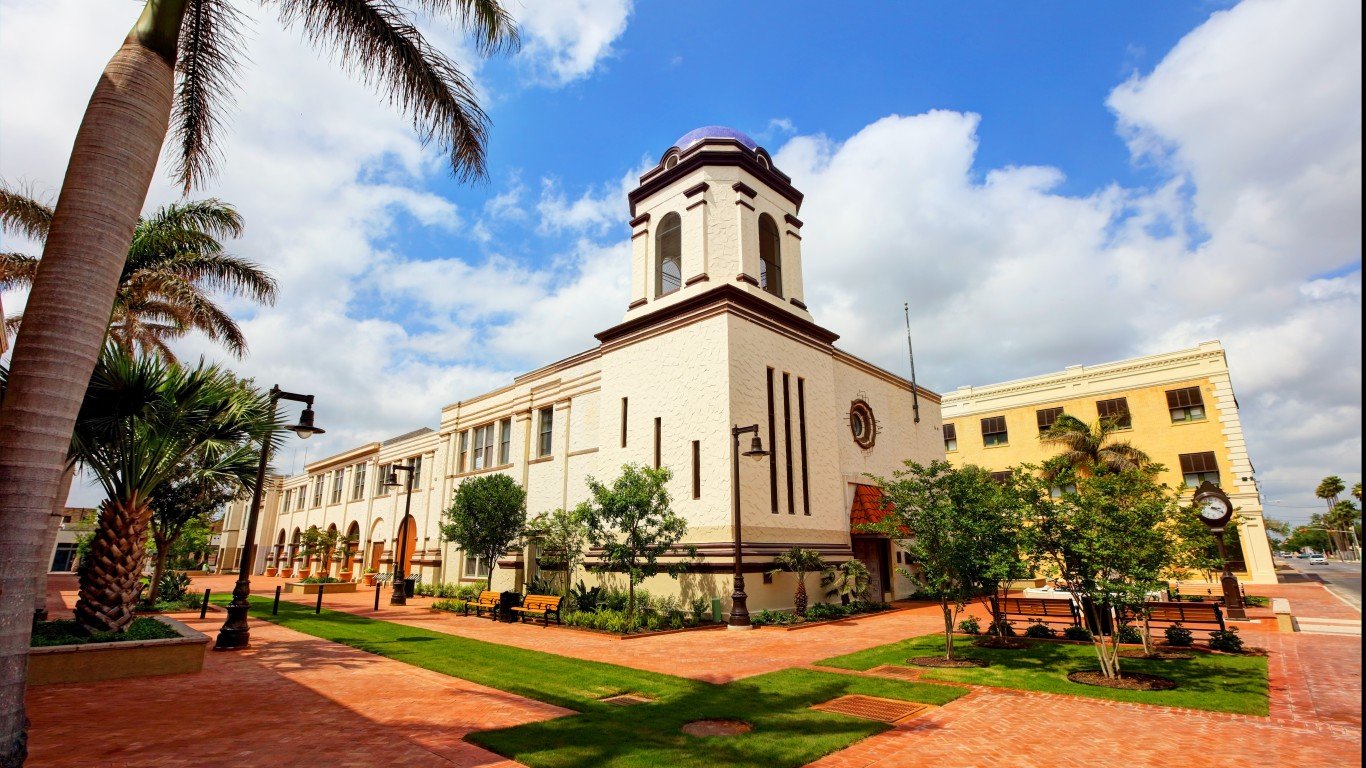
11. Corpus Christi, TX
> Projected median age, 2060: 44.9 years (+8.4 years from 2022)
> Projected 65+ population, 2060: 25.2% (+9.1 ppts. from 2022)
> Projected total population, 2060: 492,004 (+15.7% from 2022)
> Total population, 2022: 425,223
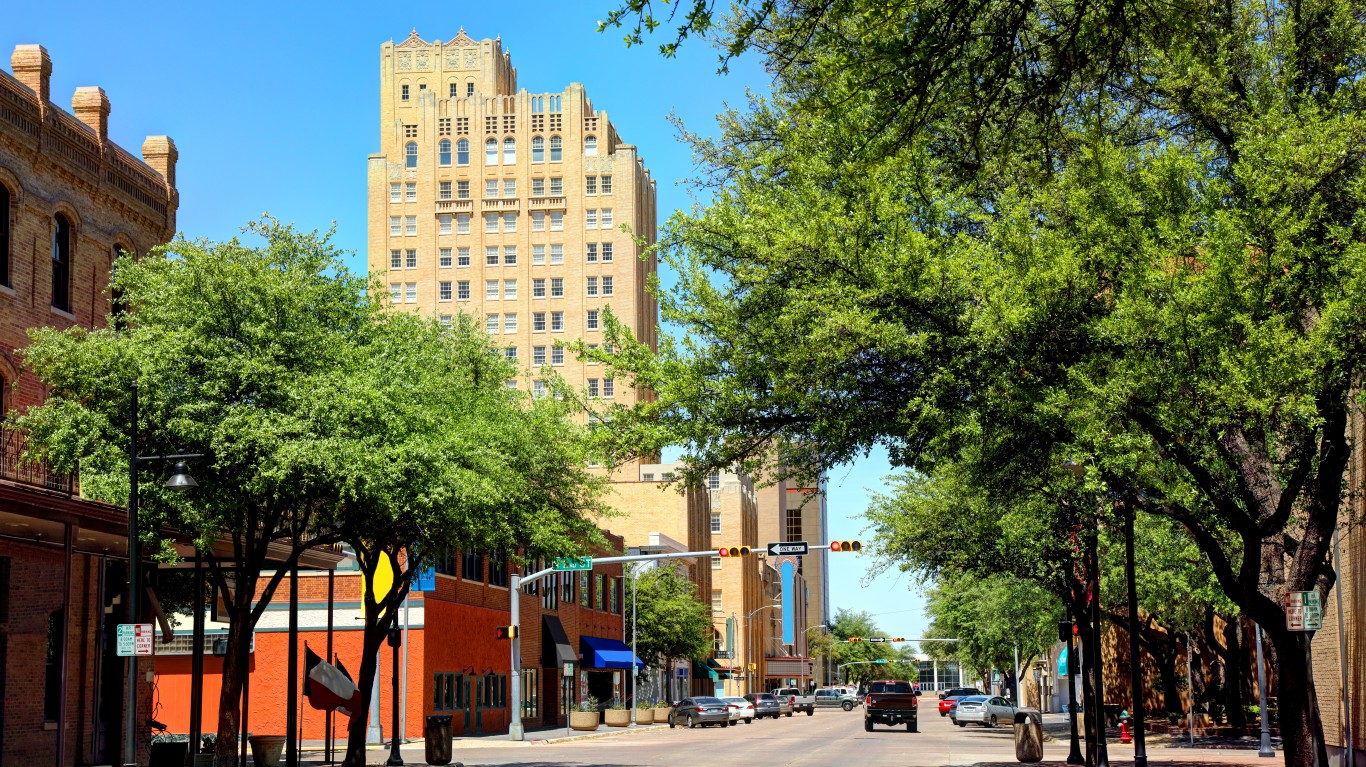
10. Abilene, TX
> Projected median age, 2060: 42.6 years (+8.4 years from 2022)
> Projected 65+ population, 2060: 22.6% (+6.7 ppts. from 2022)
> Projected total population, 2060: 198,013 (+11.2% from 2022)
> Total population, 2022: 178,087
[in-text-ad]

9. Gainesville, FL
> Projected median age, 2060: 42.8 years (+8.8 years from 2022)
> Projected 65+ population, 2060: 24.2% (+6.9 ppts. from 2022)
> Projected total population, 2060: 459,209 (+33.2% from 2022)
> Total population, 2022: 344,857
[recirclink id=1165876]
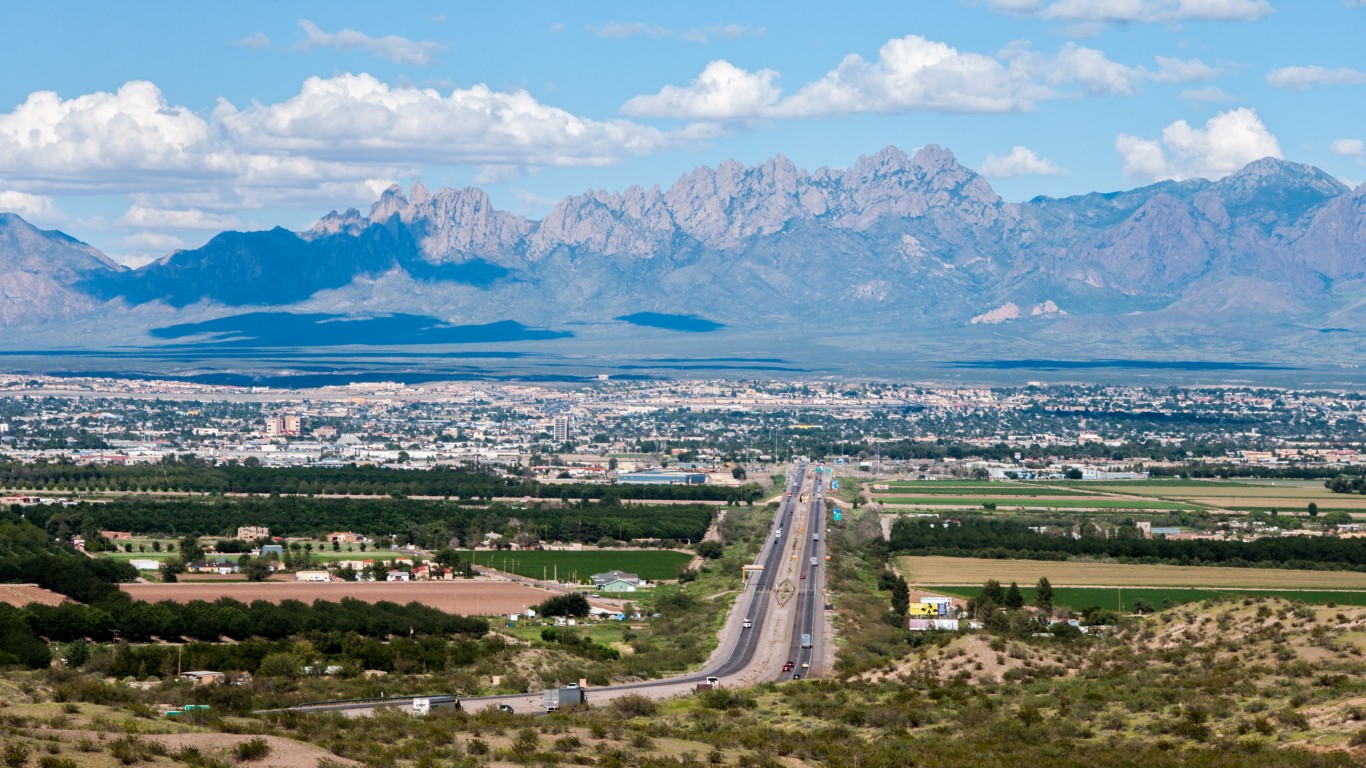
8. Las Cruces, NM
> Projected median age, 2060: 42.3 years (+8.8 years from 2022)
> Projected 65+ population, 2060: 25.3% (+8.0 ppts. from 2022)
> Projected total population, 2060: 308,579 (+37.9% from 2022)
> Total population, 2022: 223,748

7. El Paso, TX
> Projected median age, 2060: 42.1 years (+9.1 years from 2022)
> Projected 65+ population, 2060: 25.0% (+11.5 ppts. from 2022)
> Projected total population, 2060: 1.2 million (+36.2% from 2022)
> Total population, 2022: 879,754
[in-text-ad-2]

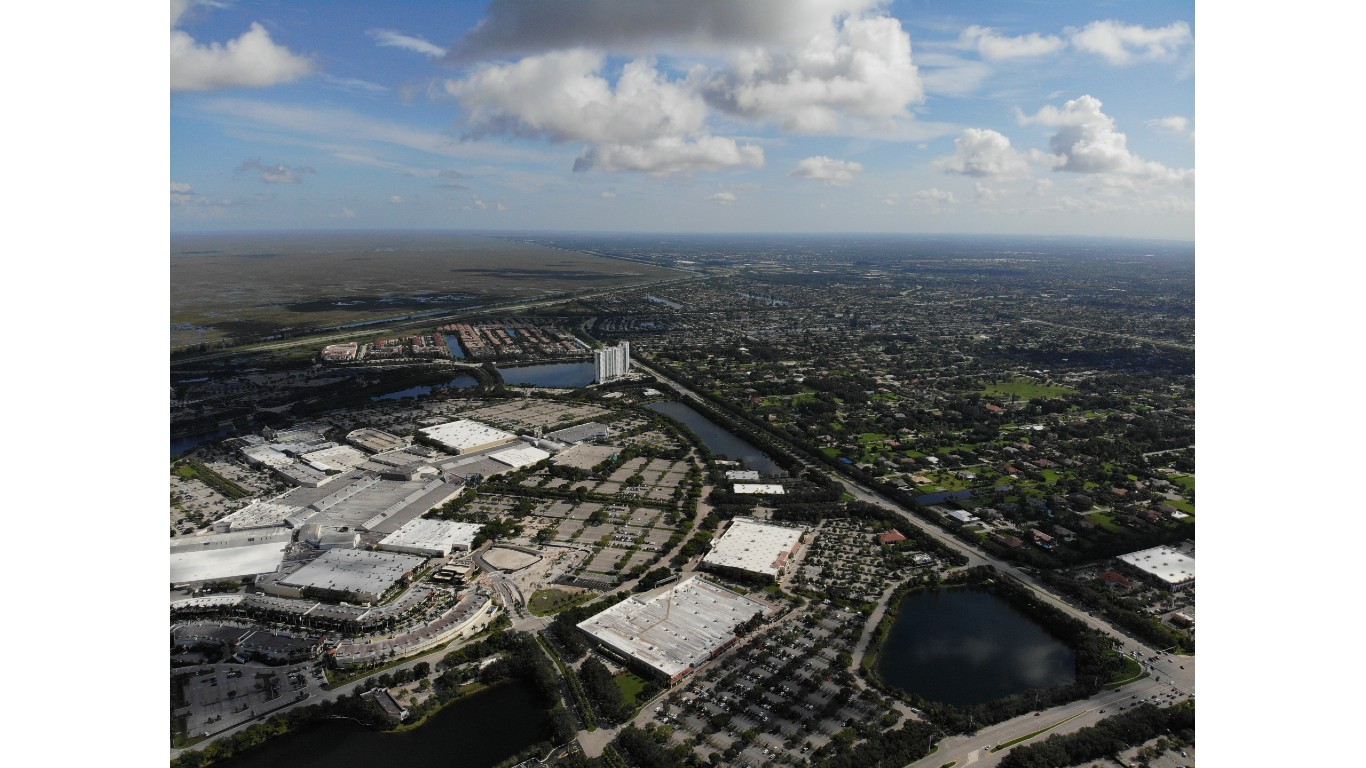
6. Orlando-Kissimmee-Sanford, FL
> Projected median age, 2060: 48.5 years (+10.4 years from 2022)
> Projected 65+ population, 2060: 32.0% (+15.7 ppts. from 2022)
> Projected total population, 2060: 4.8 million (+75.3% from 2022)
> Total population, 2022: 2.7 million

5. Bend, OR
> Projected median age, 2060: 53.4 years (+10.5 years from 2022)
> Projected 65+ population, 2060: 35.7% (+13.3 ppts. from 2022)
> Projected total population, 2060: 382,860 (+83.6% from 2022)
> Total population, 2022: 208,513
[in-text-ad]

4. St. George, UT
> Projected median age, 2060: 50.2 years (+11.0 years from 2022)
> Projected 65+ population, 2060: 35.3% (+11.4 ppts. from 2022)
> Projected total population, 2060: 425,690 (+118.1% from 2022)
> Total population, 2022: 195,191
[recirclink id=1163587]
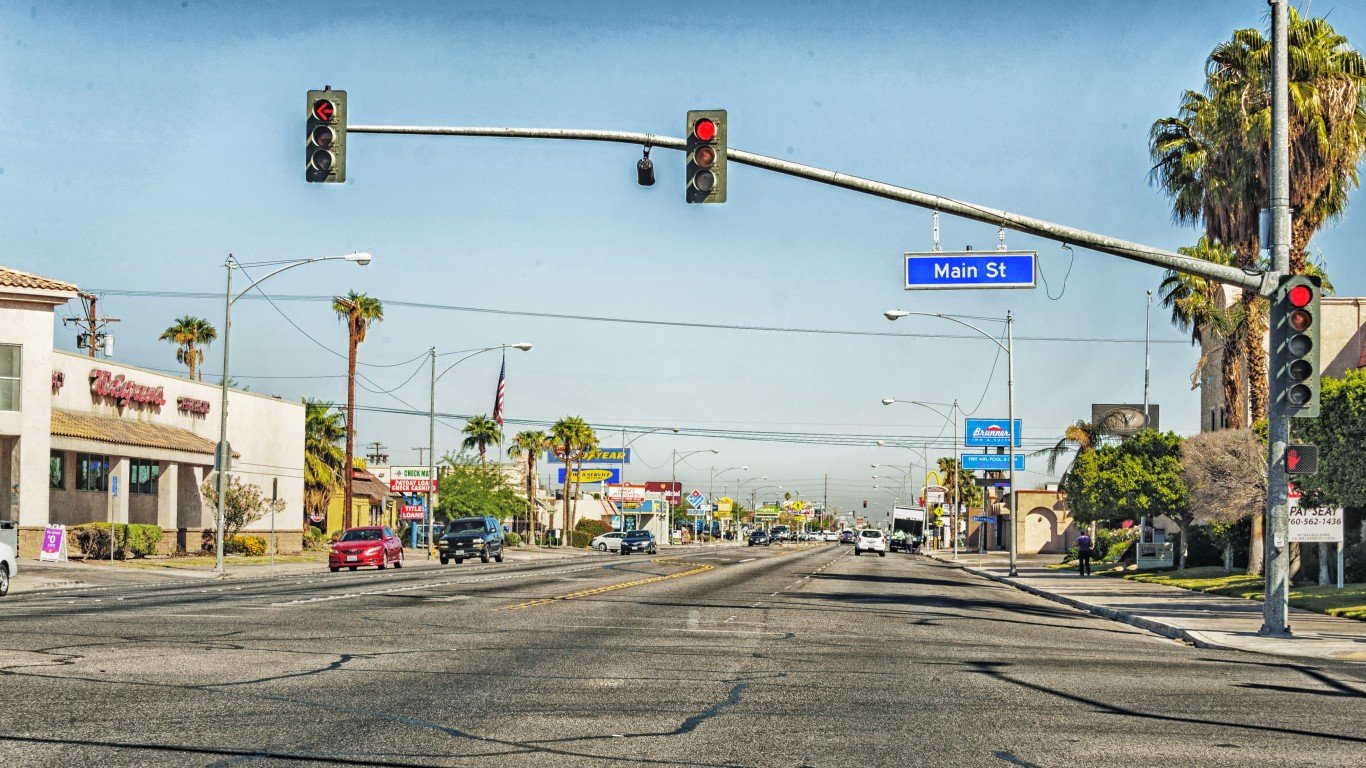
3. El Centro, CA
> Projected median age, 2060: 44.5 years (+11.4 years from 2022)
> Projected 65+ population, 2060: 28.2% (+13.7 ppts. from 2022)
> Projected total population, 2060: 250,461 (+38.1% from 2022)
> Total population, 2022: 181,385
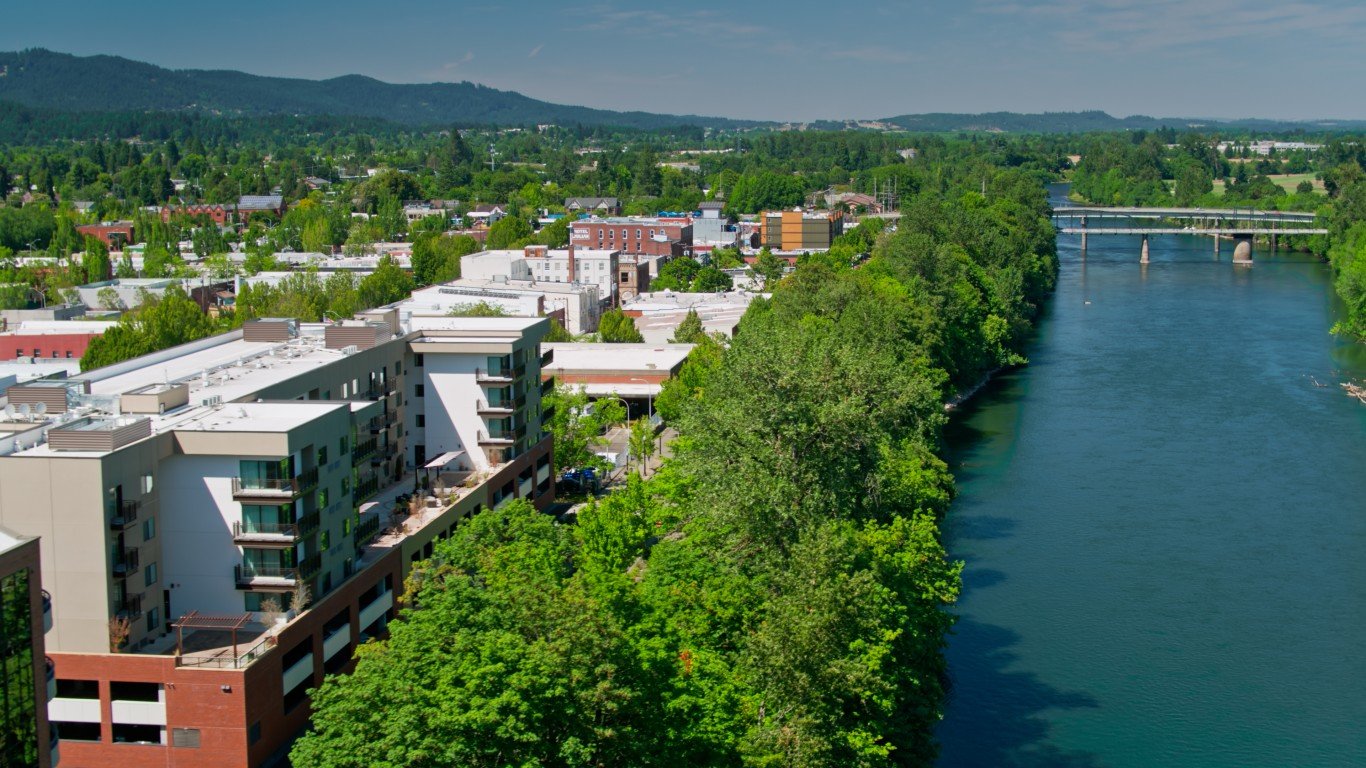
2. Corvallis, OR
> Projected median age, 2060: 44.9 years (+12.5 years from 2022)
> Projected 65+ population, 2060: 26.7% (+8.6 ppts. from 2022)
> Projected total population, 2060: 121,317 (+25.6% from 2022)
> Total population, 2022: 96,595
[in-text-ad-2]
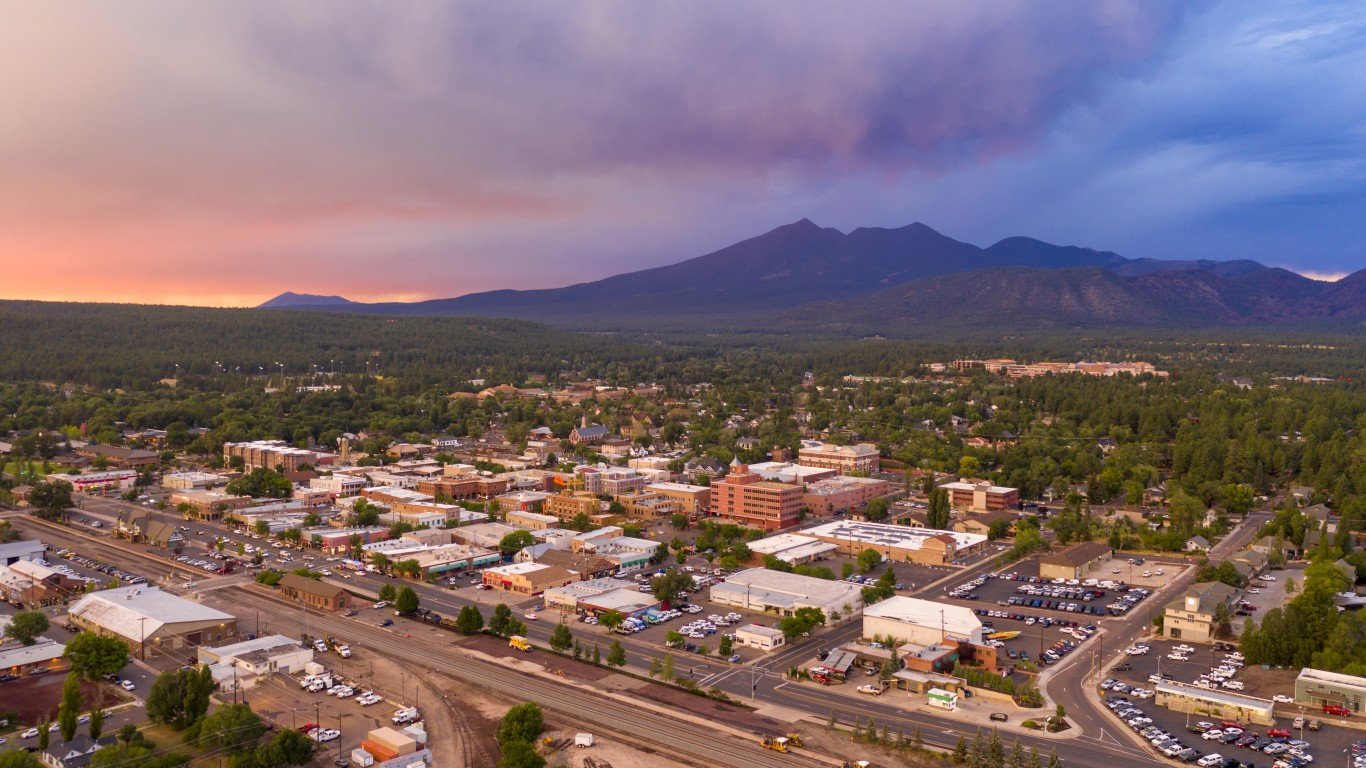
1. Flagstaff, AZ
> Projected median age, 2060: 45.9 years (+14.5 years from 2022)
> Projected 65+ population, 2060: 24.5% (+10.2 ppts. from 2022)
> Projected total population, 2060: 197,978 (+35.2% from 2022)
> Total population, 2022: 146,408
Contact [email protected] for any questions or corrections.