Home to less than 5% of the global population, while accounting for over 26% of gross domestic product globally the United States stands out as the world’s economic center of gravity. Perhaps not surprisingly, many commonly cited economic indicators suggest that the U.S. population is also among the wealthiest in the world.
24/7 Wall St. Key Points:
- Despite having the world’s largest economy, the U.S. is home to millions of people living below the poverty line.
- While the national poverty rate of 12.5% is lower than it has been in recent years, there are cities across the country where the poverty rate is well above the national average.
- Also: 2 Dividend Legends To Hold Forever
As of 2023, individuals and businesses in the United States earned an estimated $26.9 trillion — or about $80,450 per person. Only four countries with available data had a higher per capita gross national income that year. For reference, global GNI per capital totaled just $13,179 in 2023. These statistics can be misleading, however, as they do not account for the distribution of that income within the United States — and currently, the U.S. has some of the worst income and wealth inequality among highly developed countries.
According to the latest available data from the World Bank, income inequality is about seven to nine percentage points higher in the U.S. than in countries like Australia, Germany, Italy, and the United Kingdom — and about 10 or more percentage points higher than in places like Austria, Canada, France, and Sweden.
Unequal distribution of wealth in the U.S. population is evidenced, in part, by the nearly 41 million Americans living on poverty level incomes. The Department of Health and Human Services has set the poverty line at an annual income of $15,650 for individuals and $32,150 for a family of four in the continental United States, with slightly higher thresholds in Alaska and Hawaii. Currently, that poverty rate is about 12.5%, but in many cities across the country, serious financial hardship is far more common.
Using five-year estimates from the U.S. Census Bureau’s 2023 American Community Survey, 24/7 Wall St. identified the U.S. cities with the highest poverty rates. All cities, towns, villages, and unincorporated communities in the U.S. with available data and populations of 50,000 or more were considered in this analysis. All supplemental data are also five-year estimates from the ACS.
Among the 50 cities on this list, poverty rates range from about 25% to over 35%. In addition to a high poverty rate, many of the places on this list also share other similar socioeconomic attributes.
Adults with a four-year college education are at least half as likely to live below the poverty line than those who have not attended or completed college. Nationwide, 35% of the 25 and older population have a bachelor’s degree or higher — and in most cities on this list, the bachelor’s degree attainment rate is well below the national average, often by over 10 percentage points. (Here is a look at the five most common ways for Americans to move from poverty to the middle class.)
The relatively widespread financial hardship found in many of the places on this list is often due in part to a weak job market. According to data from the U.S. Census Bureau, all but a handful of cities on this list have a higher five-year average jobless rate than the comparable 5.2% unemployment rate nationwide. (Here is a look at the poorest county in every state.)
These are the American cities with the highest poverty rates.
Why It Matters

By many measures, the U.S. is one of wealthiest counties in the world. However, not all Americans are benefiting equally from the strength of the U.S. economy. Currently, 12.5% of the U.S. population, or about 41 million people, are living on poverty level incomes. But in cities across the country, poverty is far more concentrated than it is nationwide.
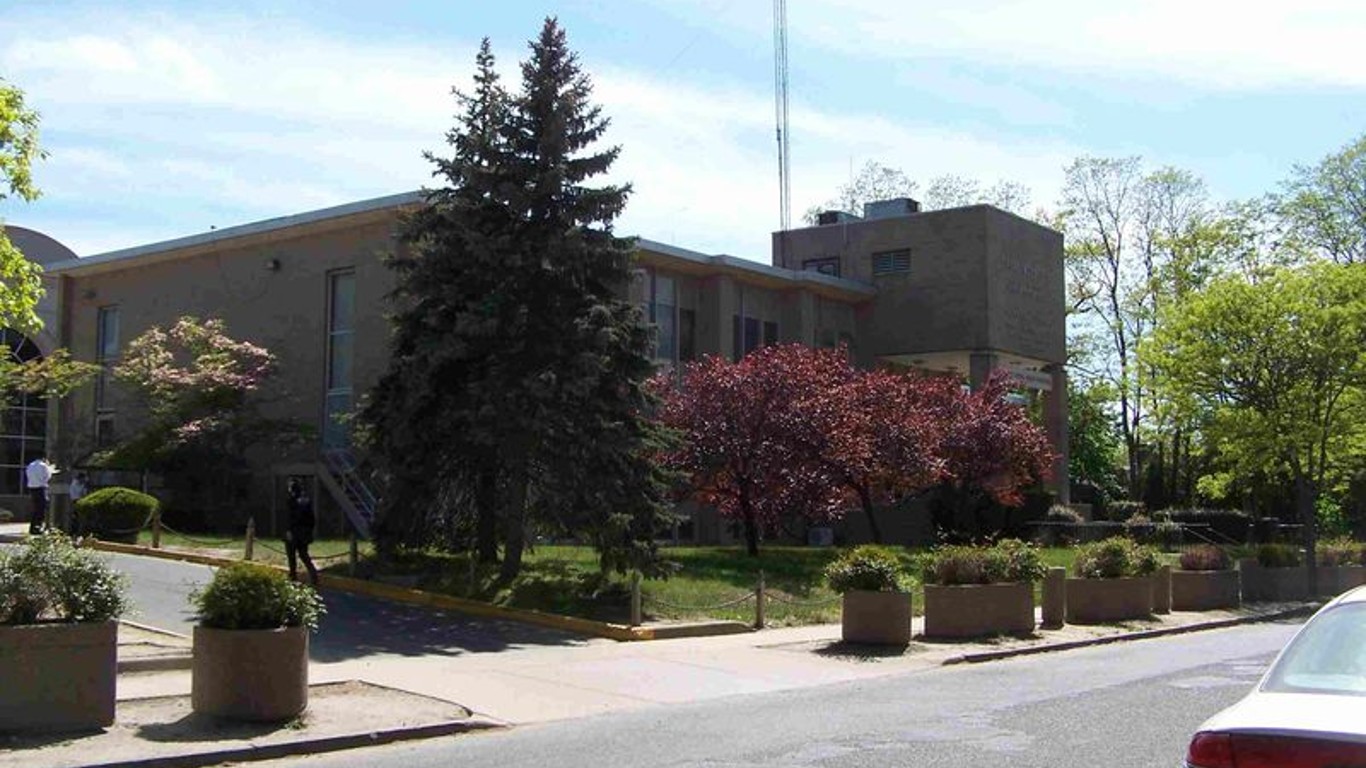
50. Trenton, New Jersey

- Local poverty rate in 2023: 24.7%
- Median household income in city: $47,102 ($31,436 less than national median)
- Bachelor’s degree attainment rate in city: 16.7% (18.3 ppts. lower than comparable national rate)
- Five-year avg. unemployment rate in city: 10.5% (5.3 ppts. higher than national jobless rate)
- City population: 89,966
49. Newark, New Jersey

- Local poverty rate in 2023: 24.7%
- Median household income in city: $48,416 ($30,122 less than national median)
- Bachelor’s degree attainment rate in city: 17.4% (17.6 ppts. lower than comparable national rate)
- Five-year avg. unemployment rate in city: 10.9% (5.7 ppts. higher than national jobless rate)
- City population: 307,188
48. Macon-Bibb County, Georgia

- Local poverty rate in 2023: 24.8%
- Median household income in city: $50,747 ($27,791 less than national median)
- Bachelor’s degree attainment rate in city: 26.0% (9.0 ppts. lower than comparable national rate)
- Five-year avg. unemployment rate in city: 7.5% (2.3 ppts. higher than national jobless rate)
- City population: 156,543
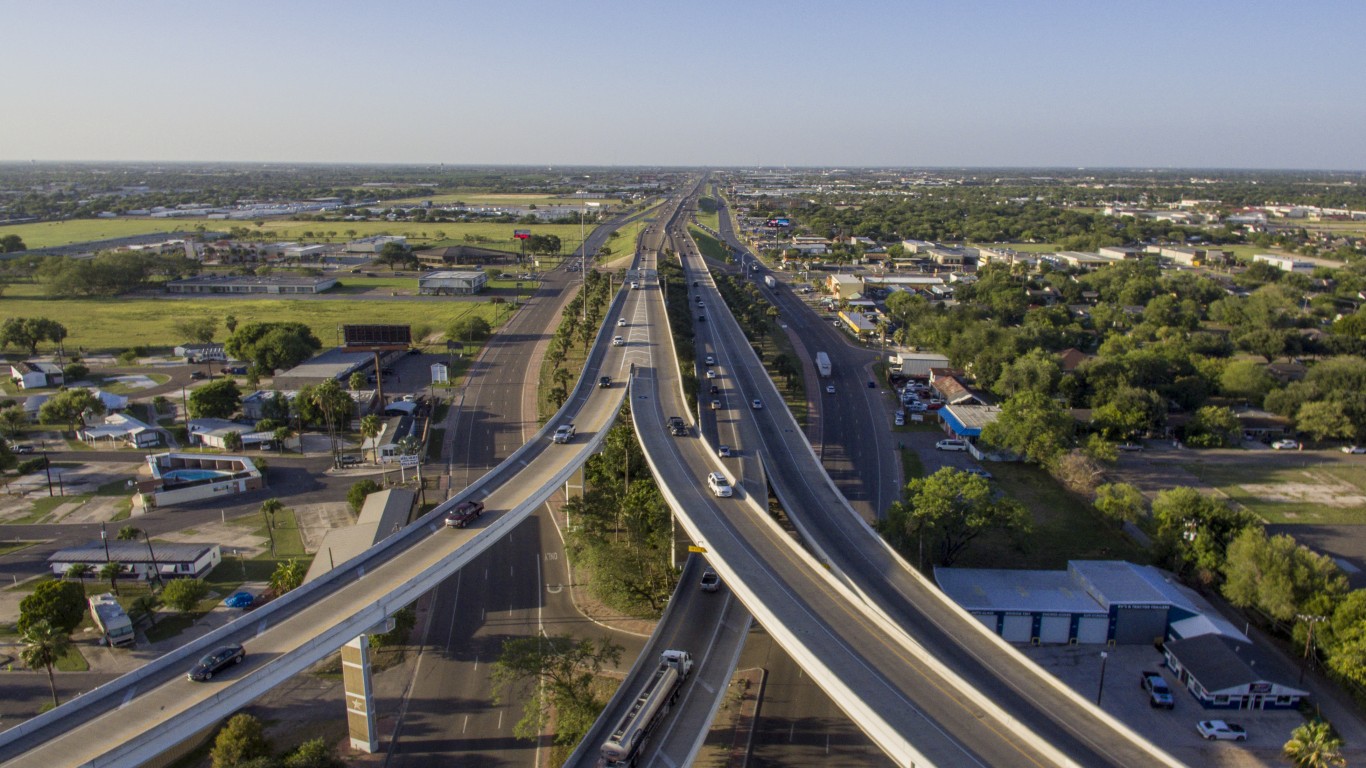
47. Brownsville, Texas
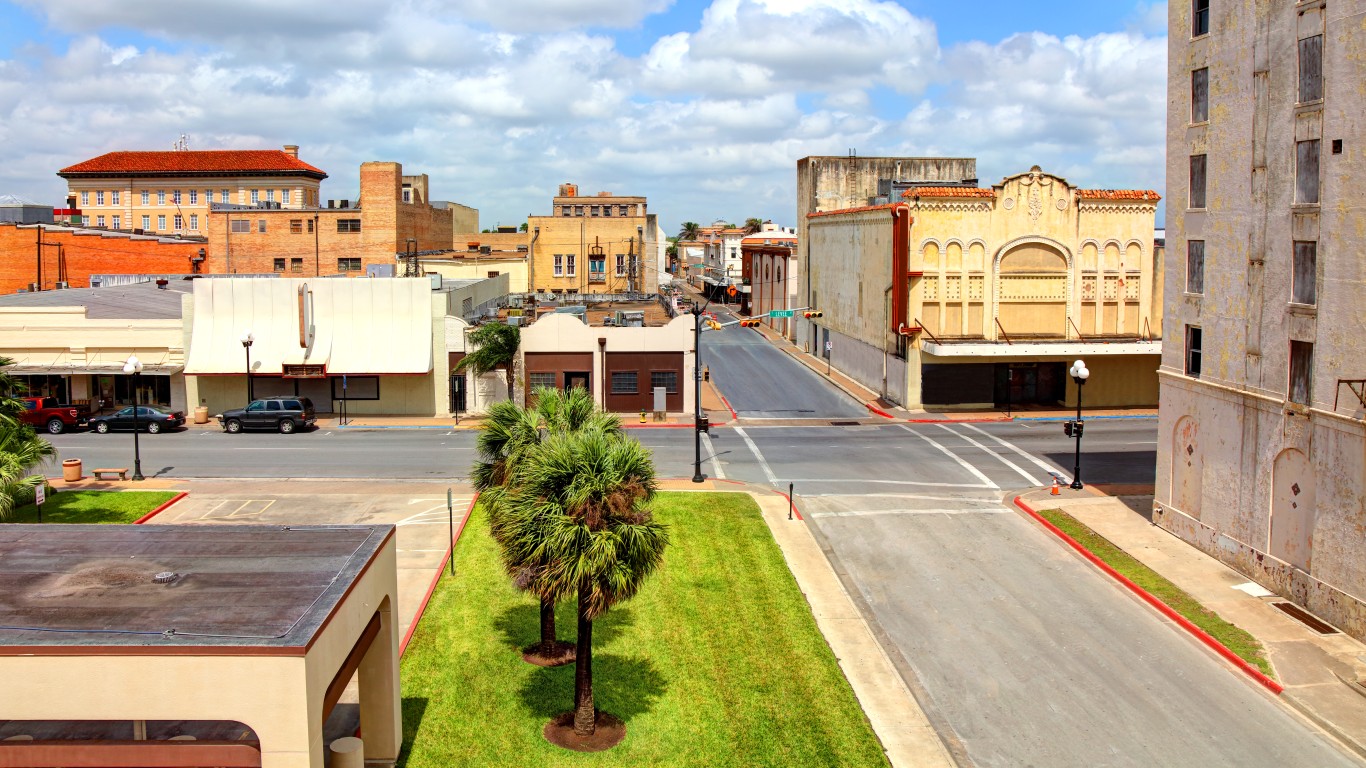
- Local poverty rate in 2023: 24.9%
- Median household income in city: $48,675 ($29,863 less than national median)
- Bachelor’s degree attainment rate in city: 22.3% (12.7 ppts. lower than comparable national rate)
- Five-year avg. unemployment rate in city: 6.1% (0.9 ppts. higher than national jobless rate)
- City population: 188,023
46. Baton Rouge, Louisiana
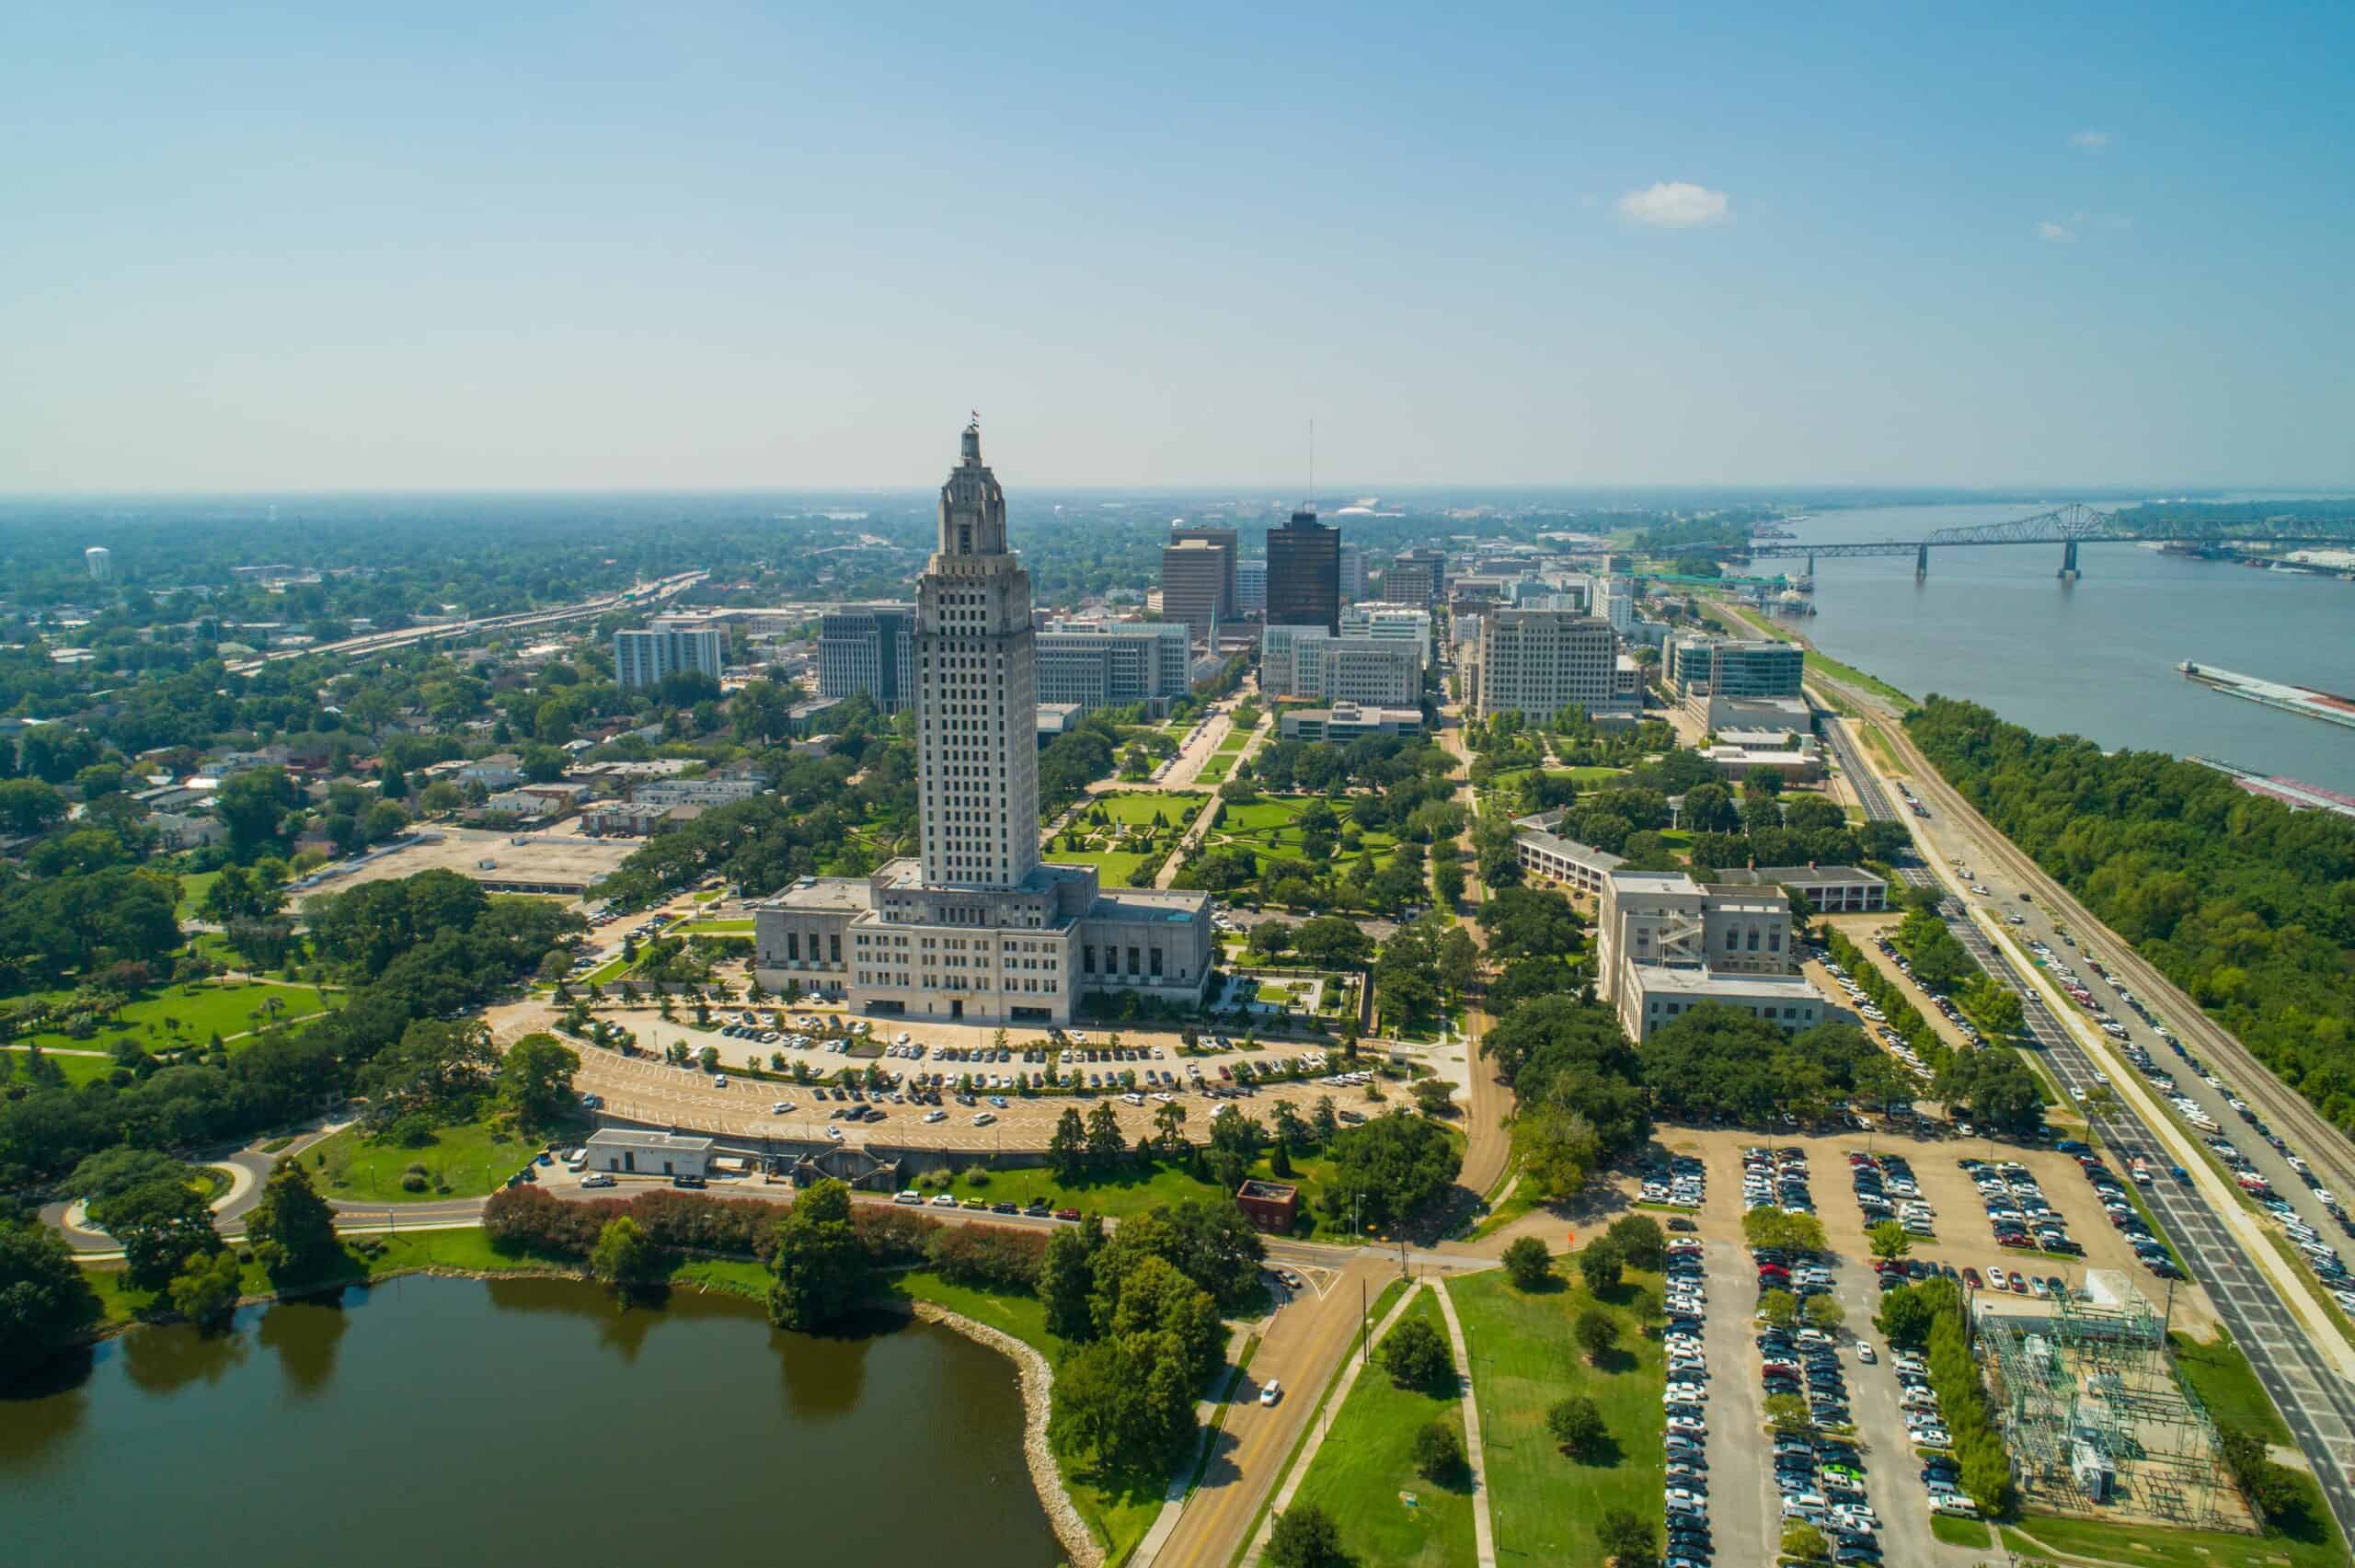
- Local poverty rate in 2023: 25.0%
- Median household income in city: $49,944 ($28,594 less than national median)
- Bachelor’s degree attainment rate in city: 35.8% (0.8 ppts. higher than comparable national rate)
- Five-year avg. unemployment rate in city: 9.1% (3.9 ppts. higher than national jobless rate)
- City population: 223,699
45. New Haven, Connecticut

- Local poverty rate in 2023: 25.0%
- Median household income in city: $53,771 ($24,767 less than national median)
- Bachelor’s degree attainment rate in city: 37.7% (2.7 ppts. higher than comparable national rate)
- Five-year avg. unemployment rate in city: 7.7% (2.5 ppts. higher than national jobless rate)
- City population: 132,893
44. Davis, California

- Local poverty rate in 2023: 25.1%
- Median household income in city: $87,421 ($8,883 more than national median)
- Bachelor’s degree attainment rate in city: 75.1% (40.1 ppts. higher than comparable national rate)
- Five-year avg. unemployment rate in city: 5.6% (0.4 ppts. higher than national jobless rate)
- City population: 66,801
43. Birmingham, Alabama
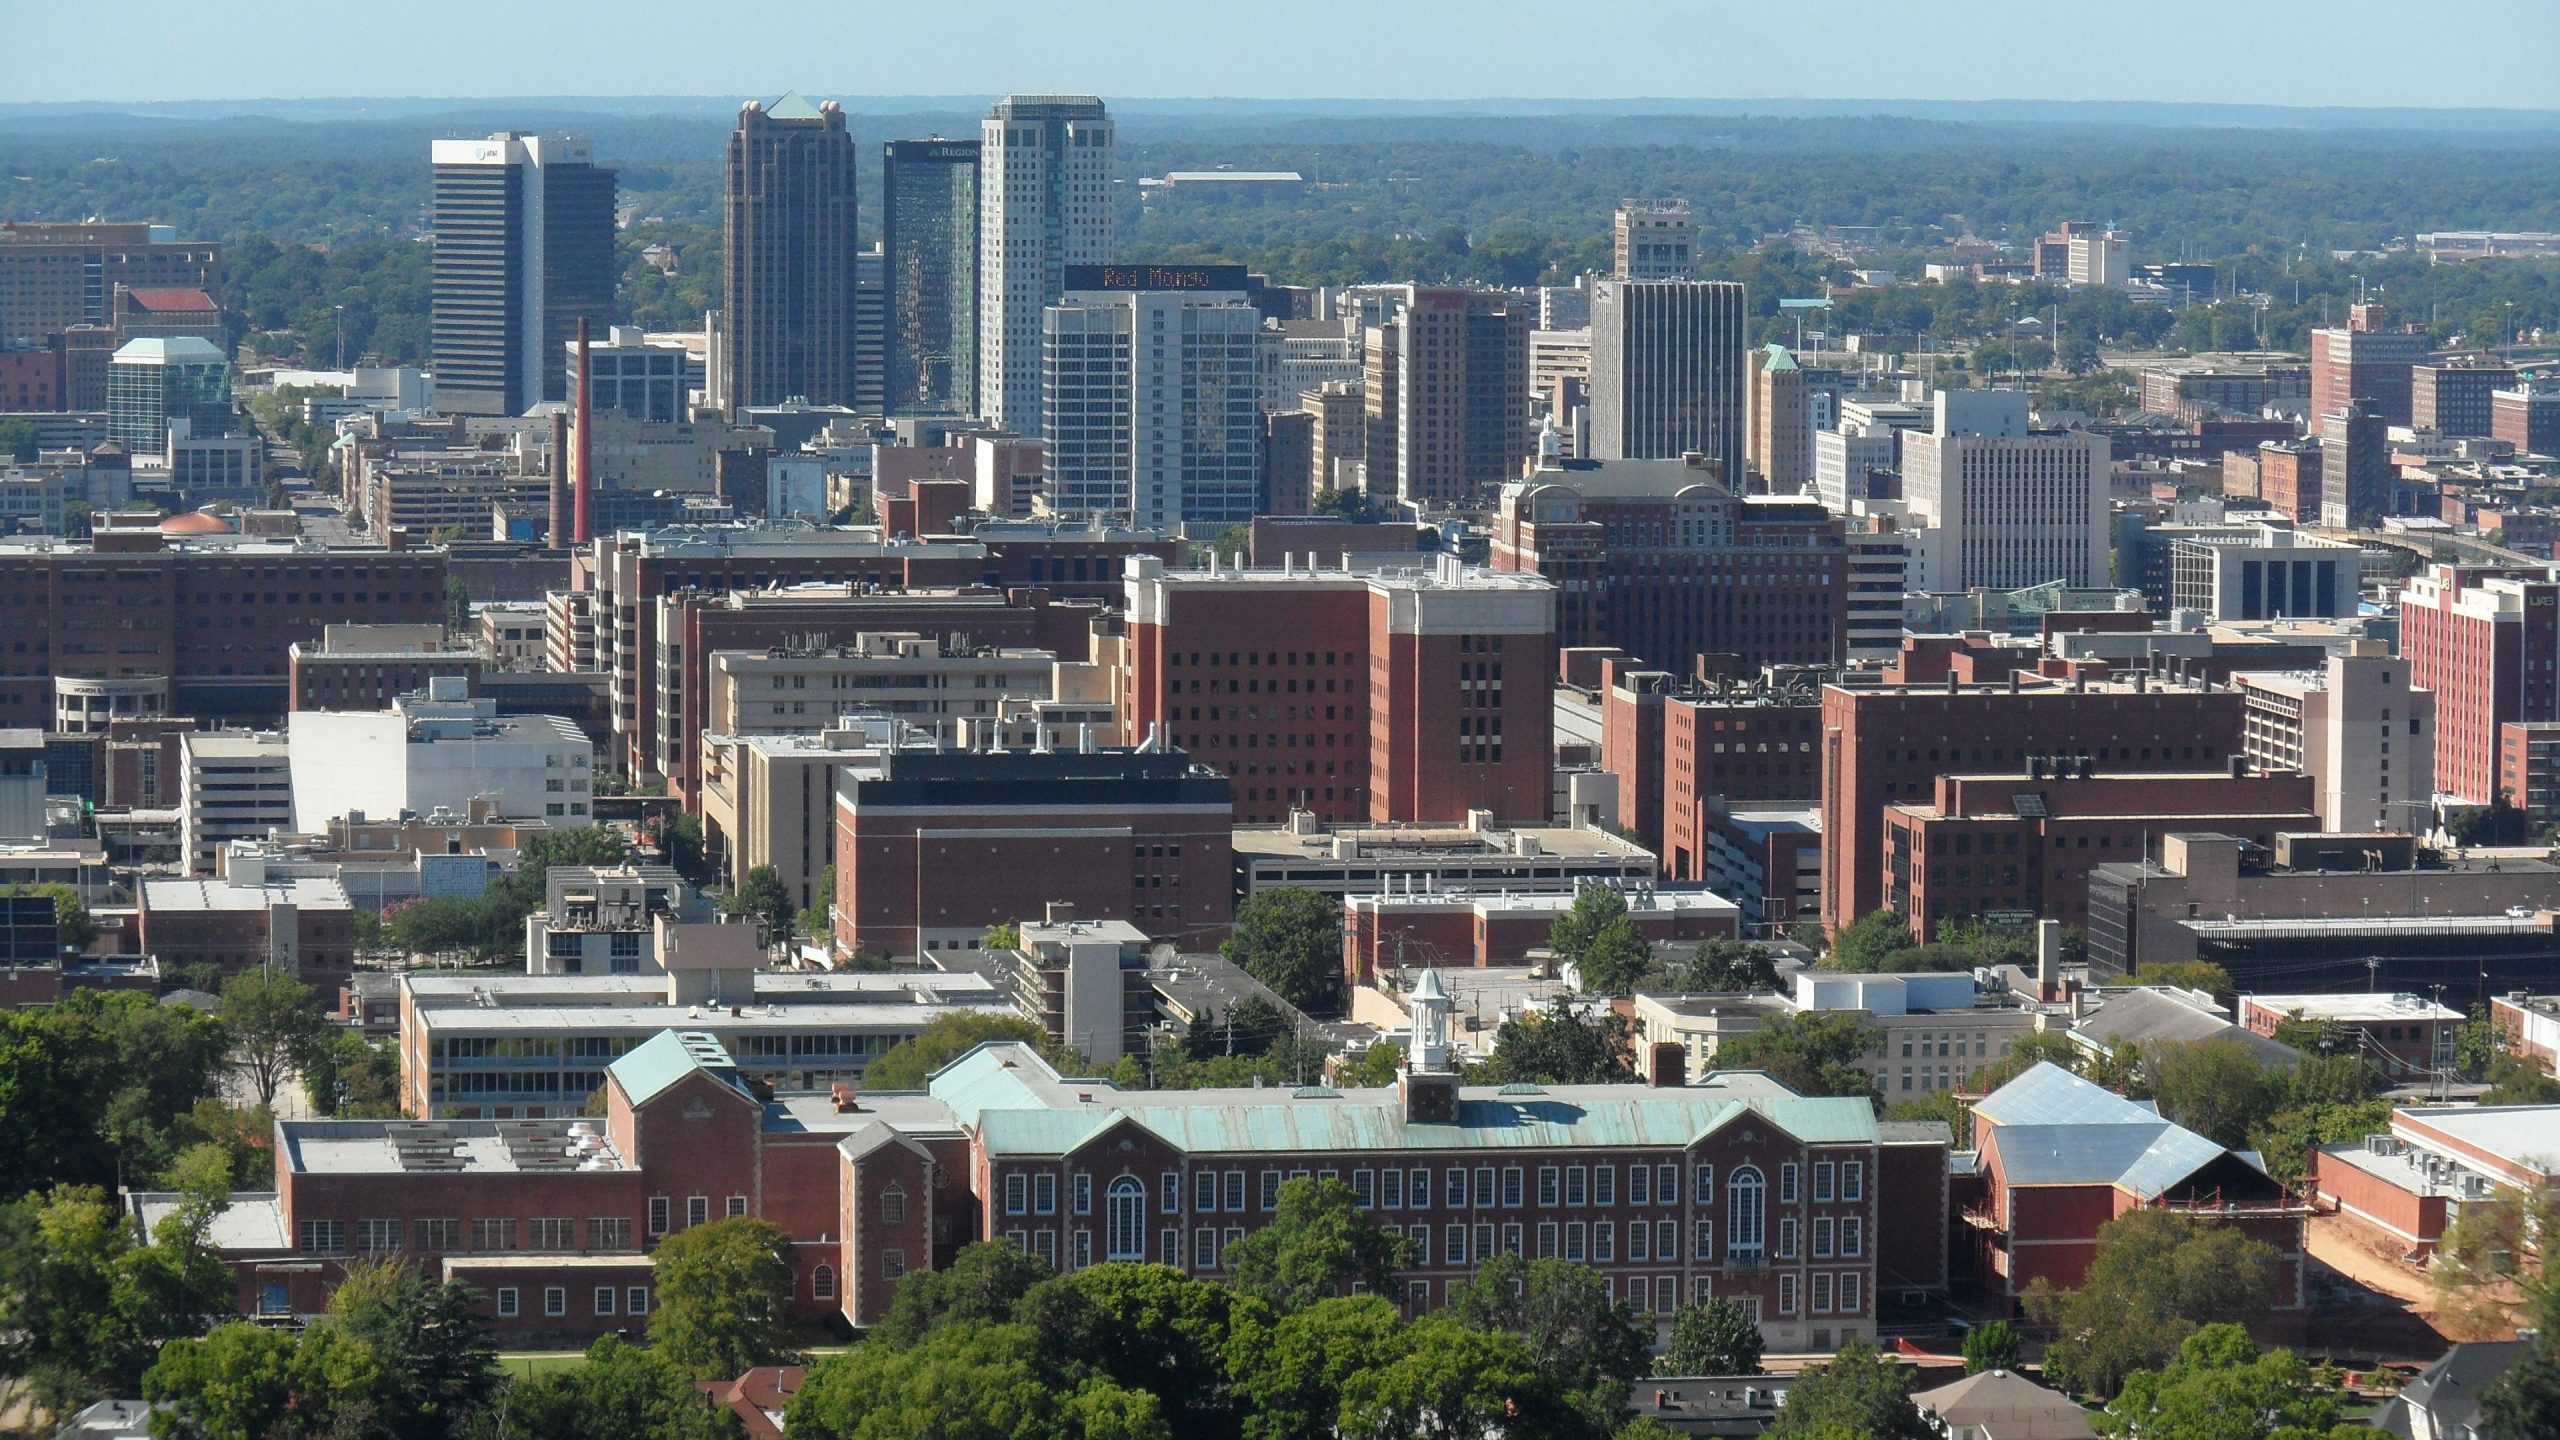
- Local poverty rate in 2023: 25.2%
- Median household income in city: $44,376 ($34,162 less than national median)
- Bachelor’s degree attainment rate in city: 30.7% (4.3 ppts. lower than comparable national rate)
- Five-year avg. unemployment rate in city: 6.1% (0.9 ppts. higher than national jobless rate)
- City population: 199,322
42. Springfield, Massachusetts

- Local poverty rate in 2023: 25.3%
- Median household income in city: $51,339 ($27,199 less than national median)
- Bachelor’s degree attainment rate in city: 19.7% (15.3 ppts. lower than comparable national rate)
- Five-year avg. unemployment rate in city: 8.2% (3 ppts. higher than national jobless rate)
- City population: 154,751
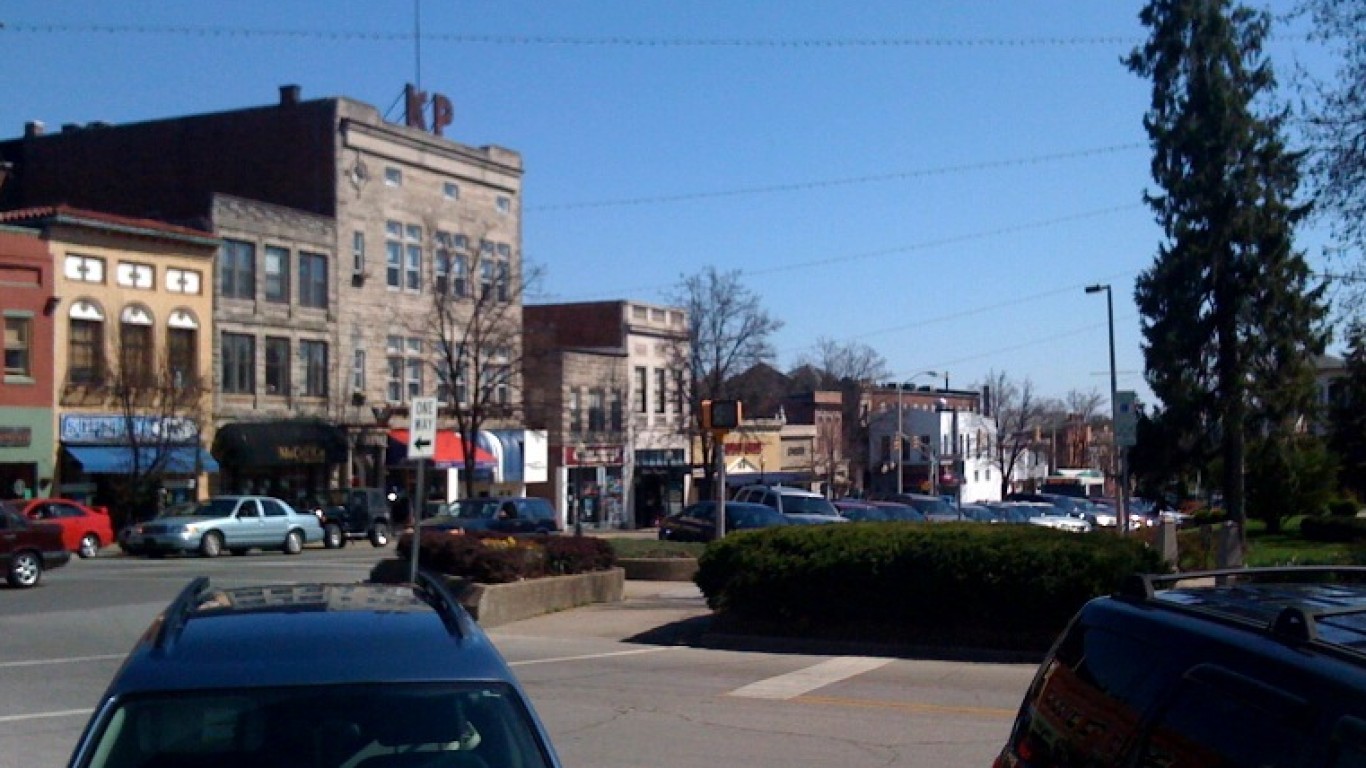
41. Bowling Green, Kentucky
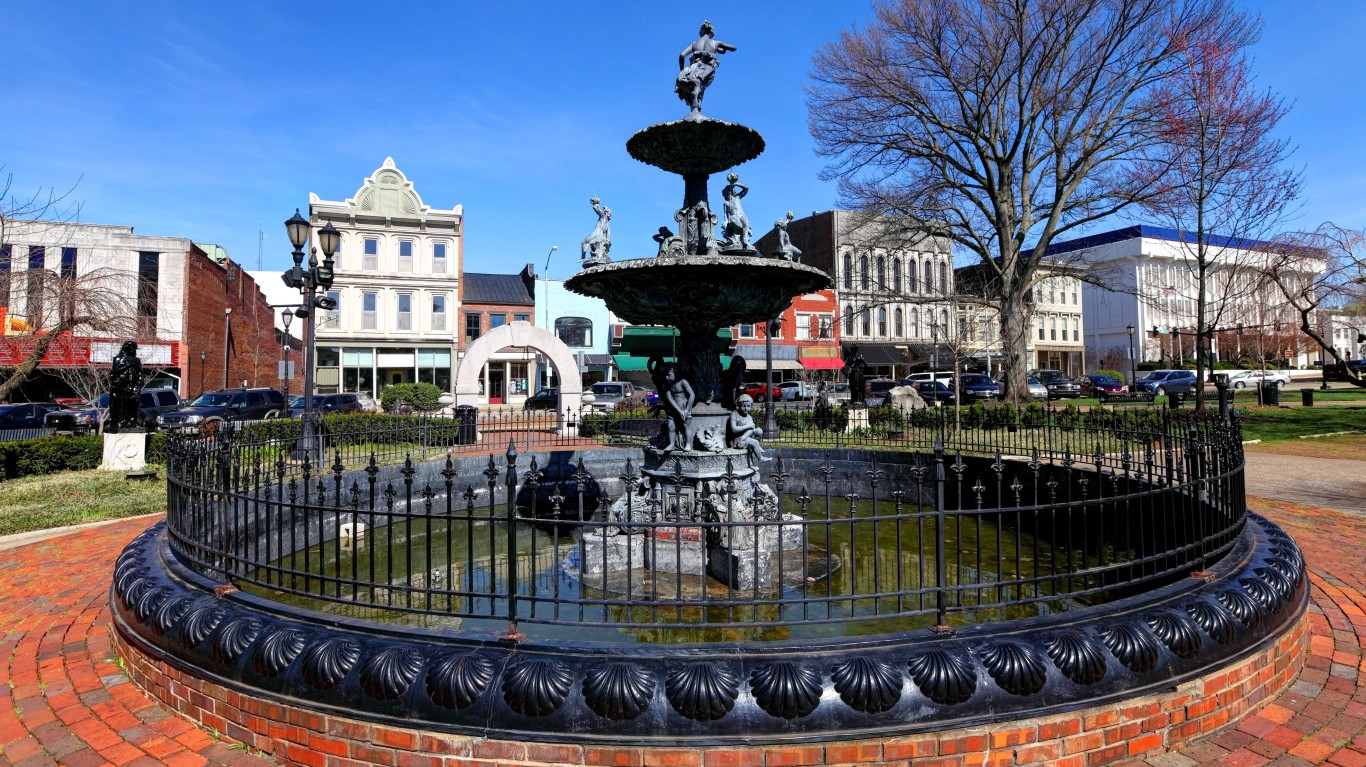
- Local poverty rate in 2023: 25.4%
- Median household income in city: $48,419 ($30,119 less than national median)
- Bachelor’s degree attainment rate in city: 32.0% (3.0 ppts. lower than comparable national rate)
- Five-year avg. unemployment rate in city: 5.1% (0.1 ppts. lower than national jobless rate)
- City population: 73,638
40. Hartford, Connecticut

- Local poverty rate in 2023: 25.5%
- Median household income in city: $45,300 ($33,238 less than national median)
- Bachelor’s degree attainment rate in city: 18.3% (16.7 ppts. lower than comparable national rate)
- Five-year avg. unemployment rate in city: 10.6% (5.4 ppts. higher than national jobless rate)
- City population: 119,970
39. Harrisonburg, Virginia
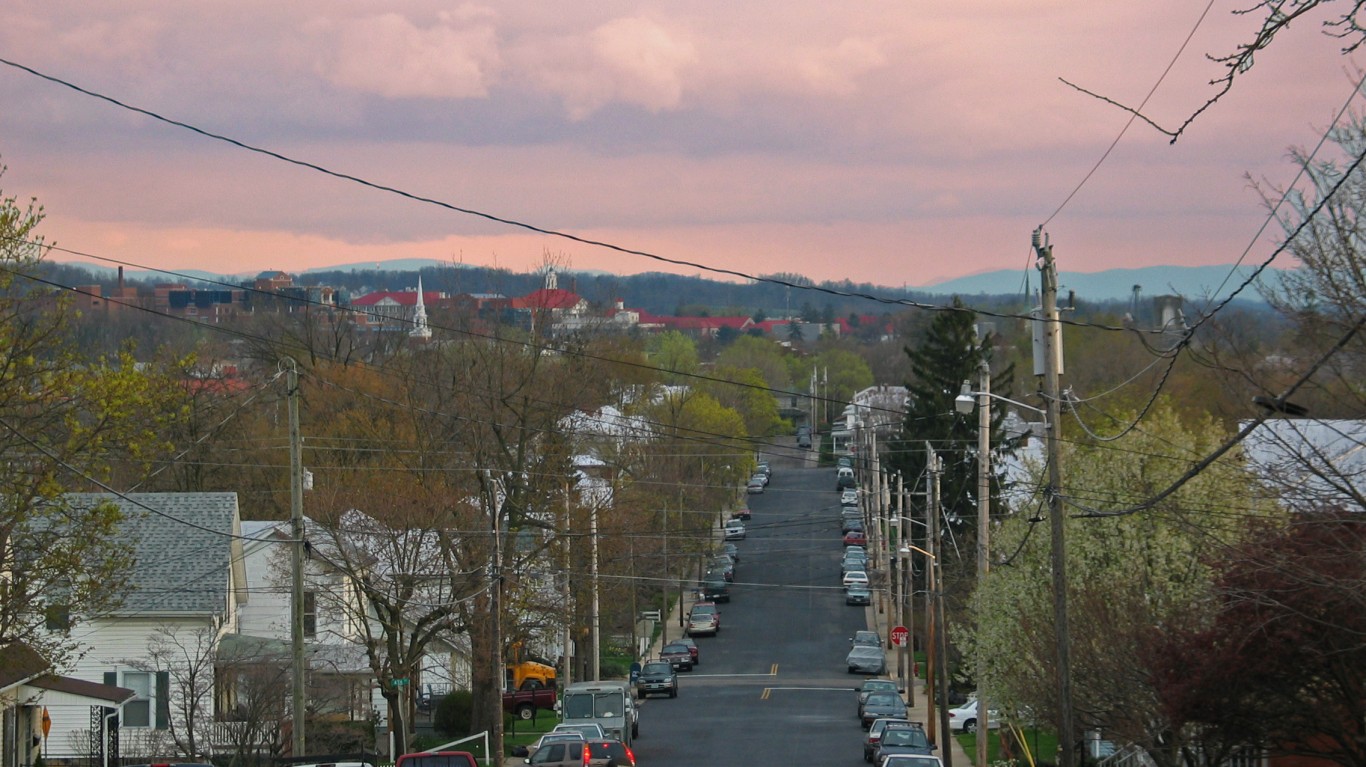
- Local poverty rate in 2023: 25.6%
- Median household income in city: $59,752 ($18,786 less than national median)
- Bachelor’s degree attainment rate in city: 36.7% (1.7 ppts. higher than comparable national rate)
- Five-year avg. unemployment rate in city: 7.1% (1.9 ppts. higher than national jobless rate)
- City population: 51,492
38. Pontiac, Michigan
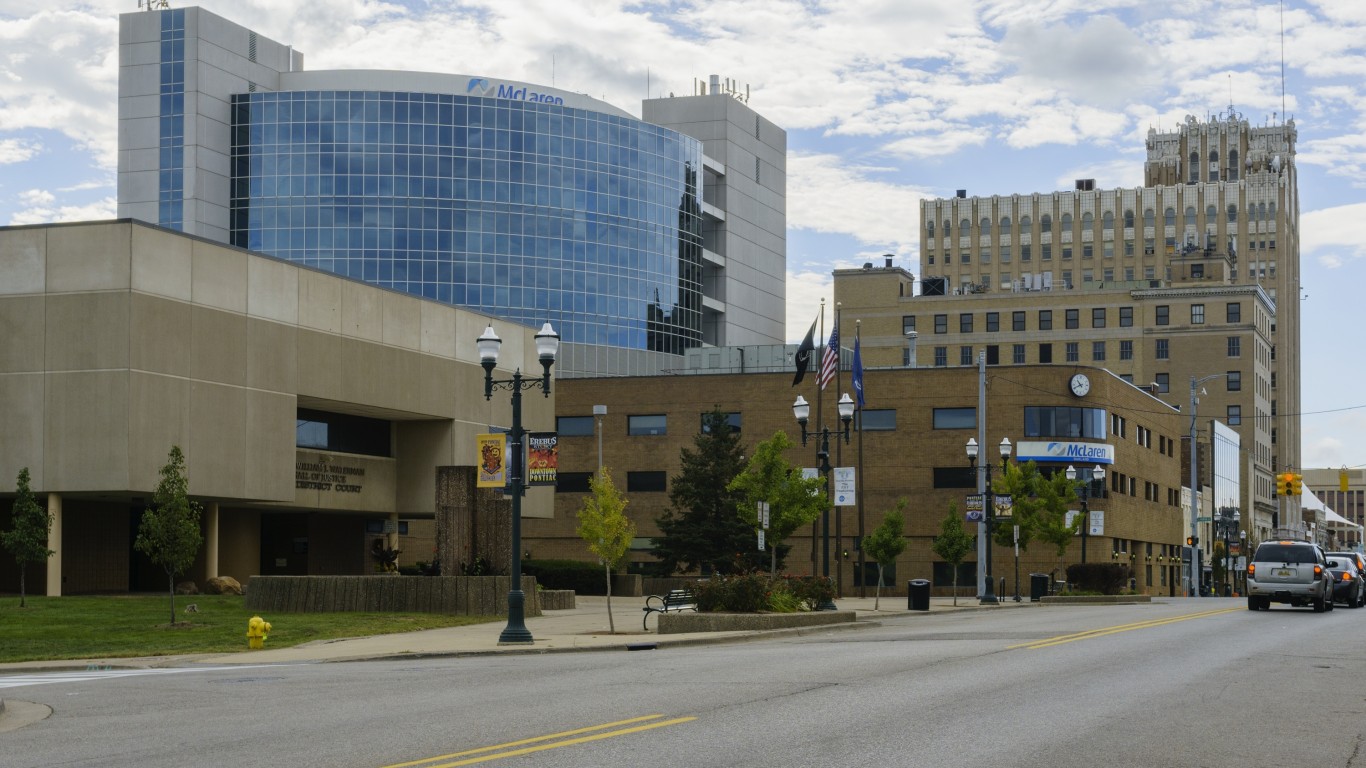
- Local poverty rate in 2023: 25.6%
- Median household income in city: $42,791 ($35,747 less than national median)
- Bachelor’s degree attainment rate in city: 16.2% (18.8 ppts. lower than comparable national rate)
- Five-year avg. unemployment rate in city: 10.6% (5.4 ppts. higher than national jobless rate)
- City population: 61,914
37. Edinburg, Texas
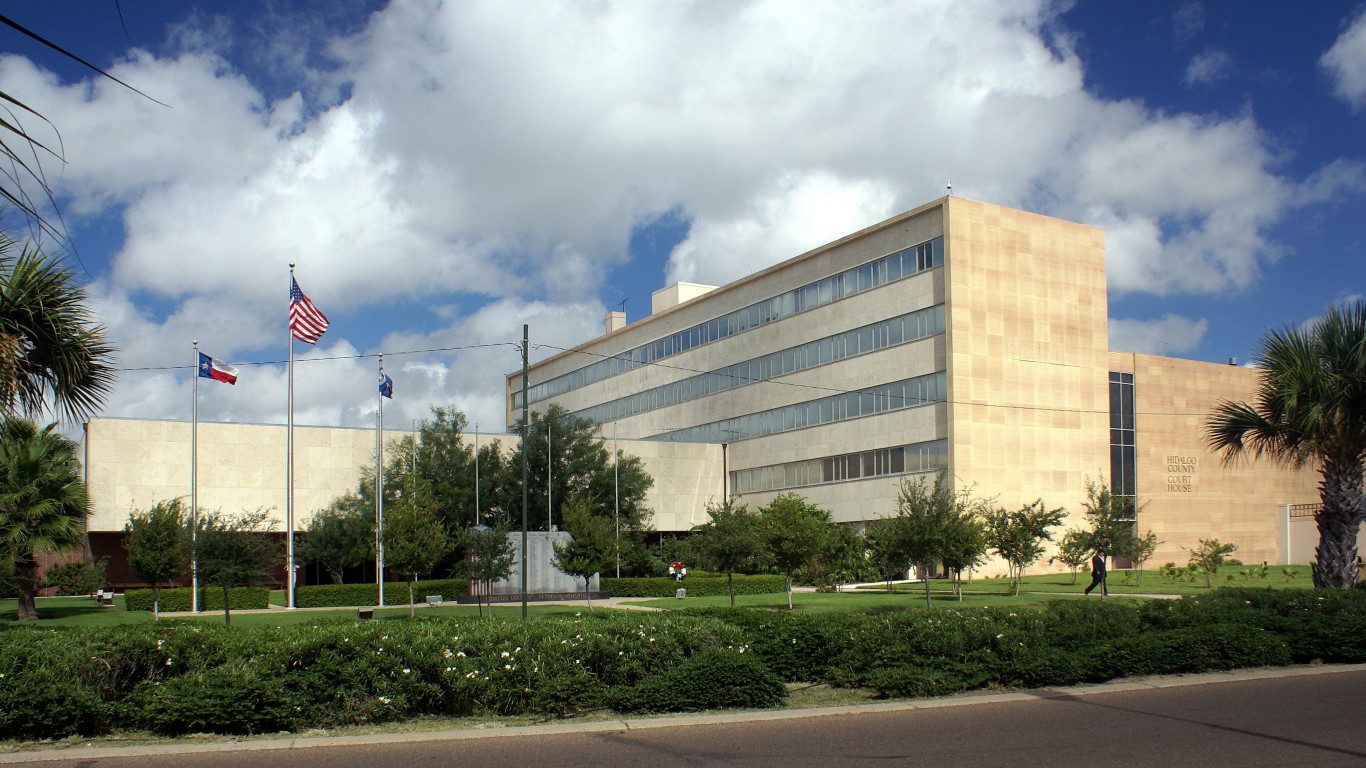
- Local poverty rate in 2023: 25.7%
- Median household income in city: $57,789 ($20,749 less than national median)
- Bachelor’s degree attainment rate in city: 28.9% (6.1 ppts. lower than comparable national rate)
- Five-year avg. unemployment rate in city: 6.6% (1.4 ppts. higher than national jobless rate)
- City population: 102,561
36. Corvallis, Oregon
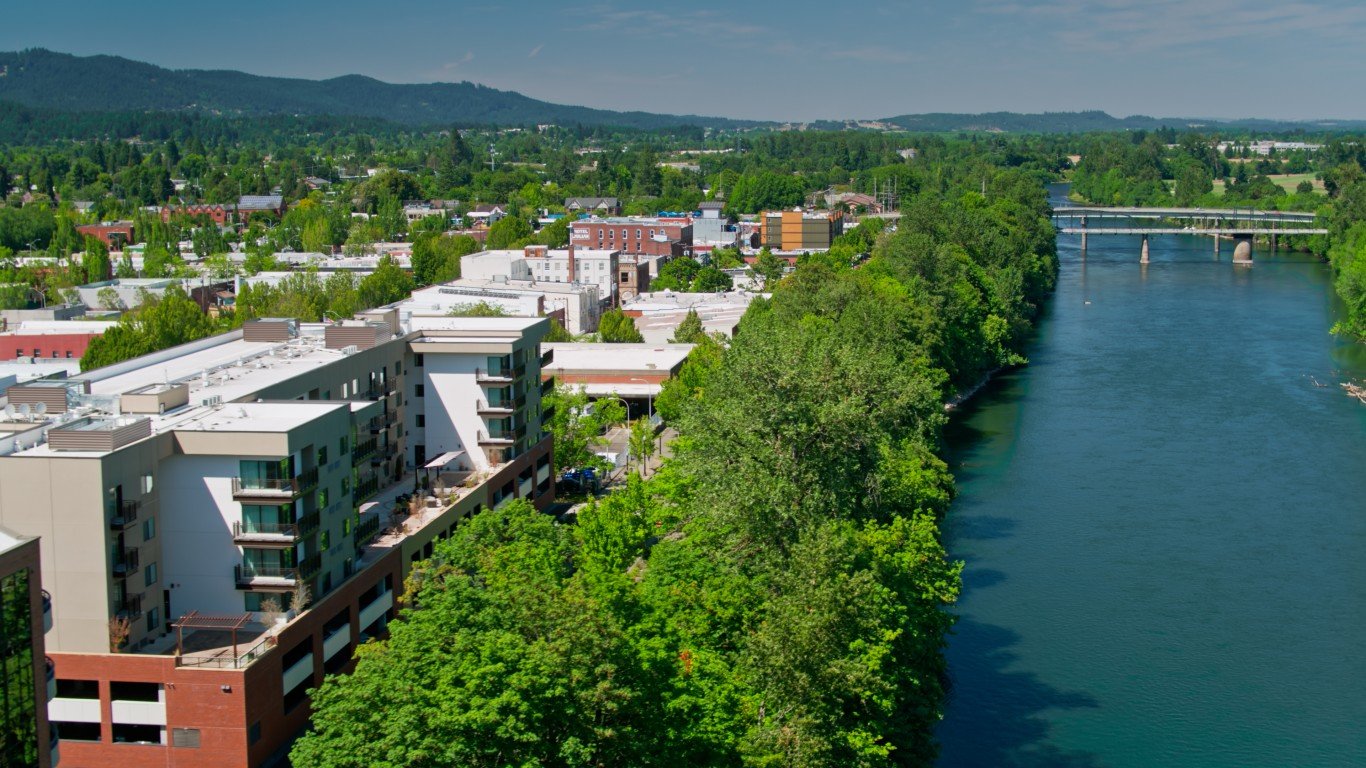
- Local poverty rate in 2023: 25.9%
- Median household income in city: $63,807 ($14,731 less than national median)
- Bachelor’s degree attainment rate in city: 60.9% (25.9 ppts. higher than comparable national rate)
- Five-year avg. unemployment rate in city: 7.9% (2.7 ppts. higher than national jobless rate)
- City population: 60,424
35. Ames, Iowa
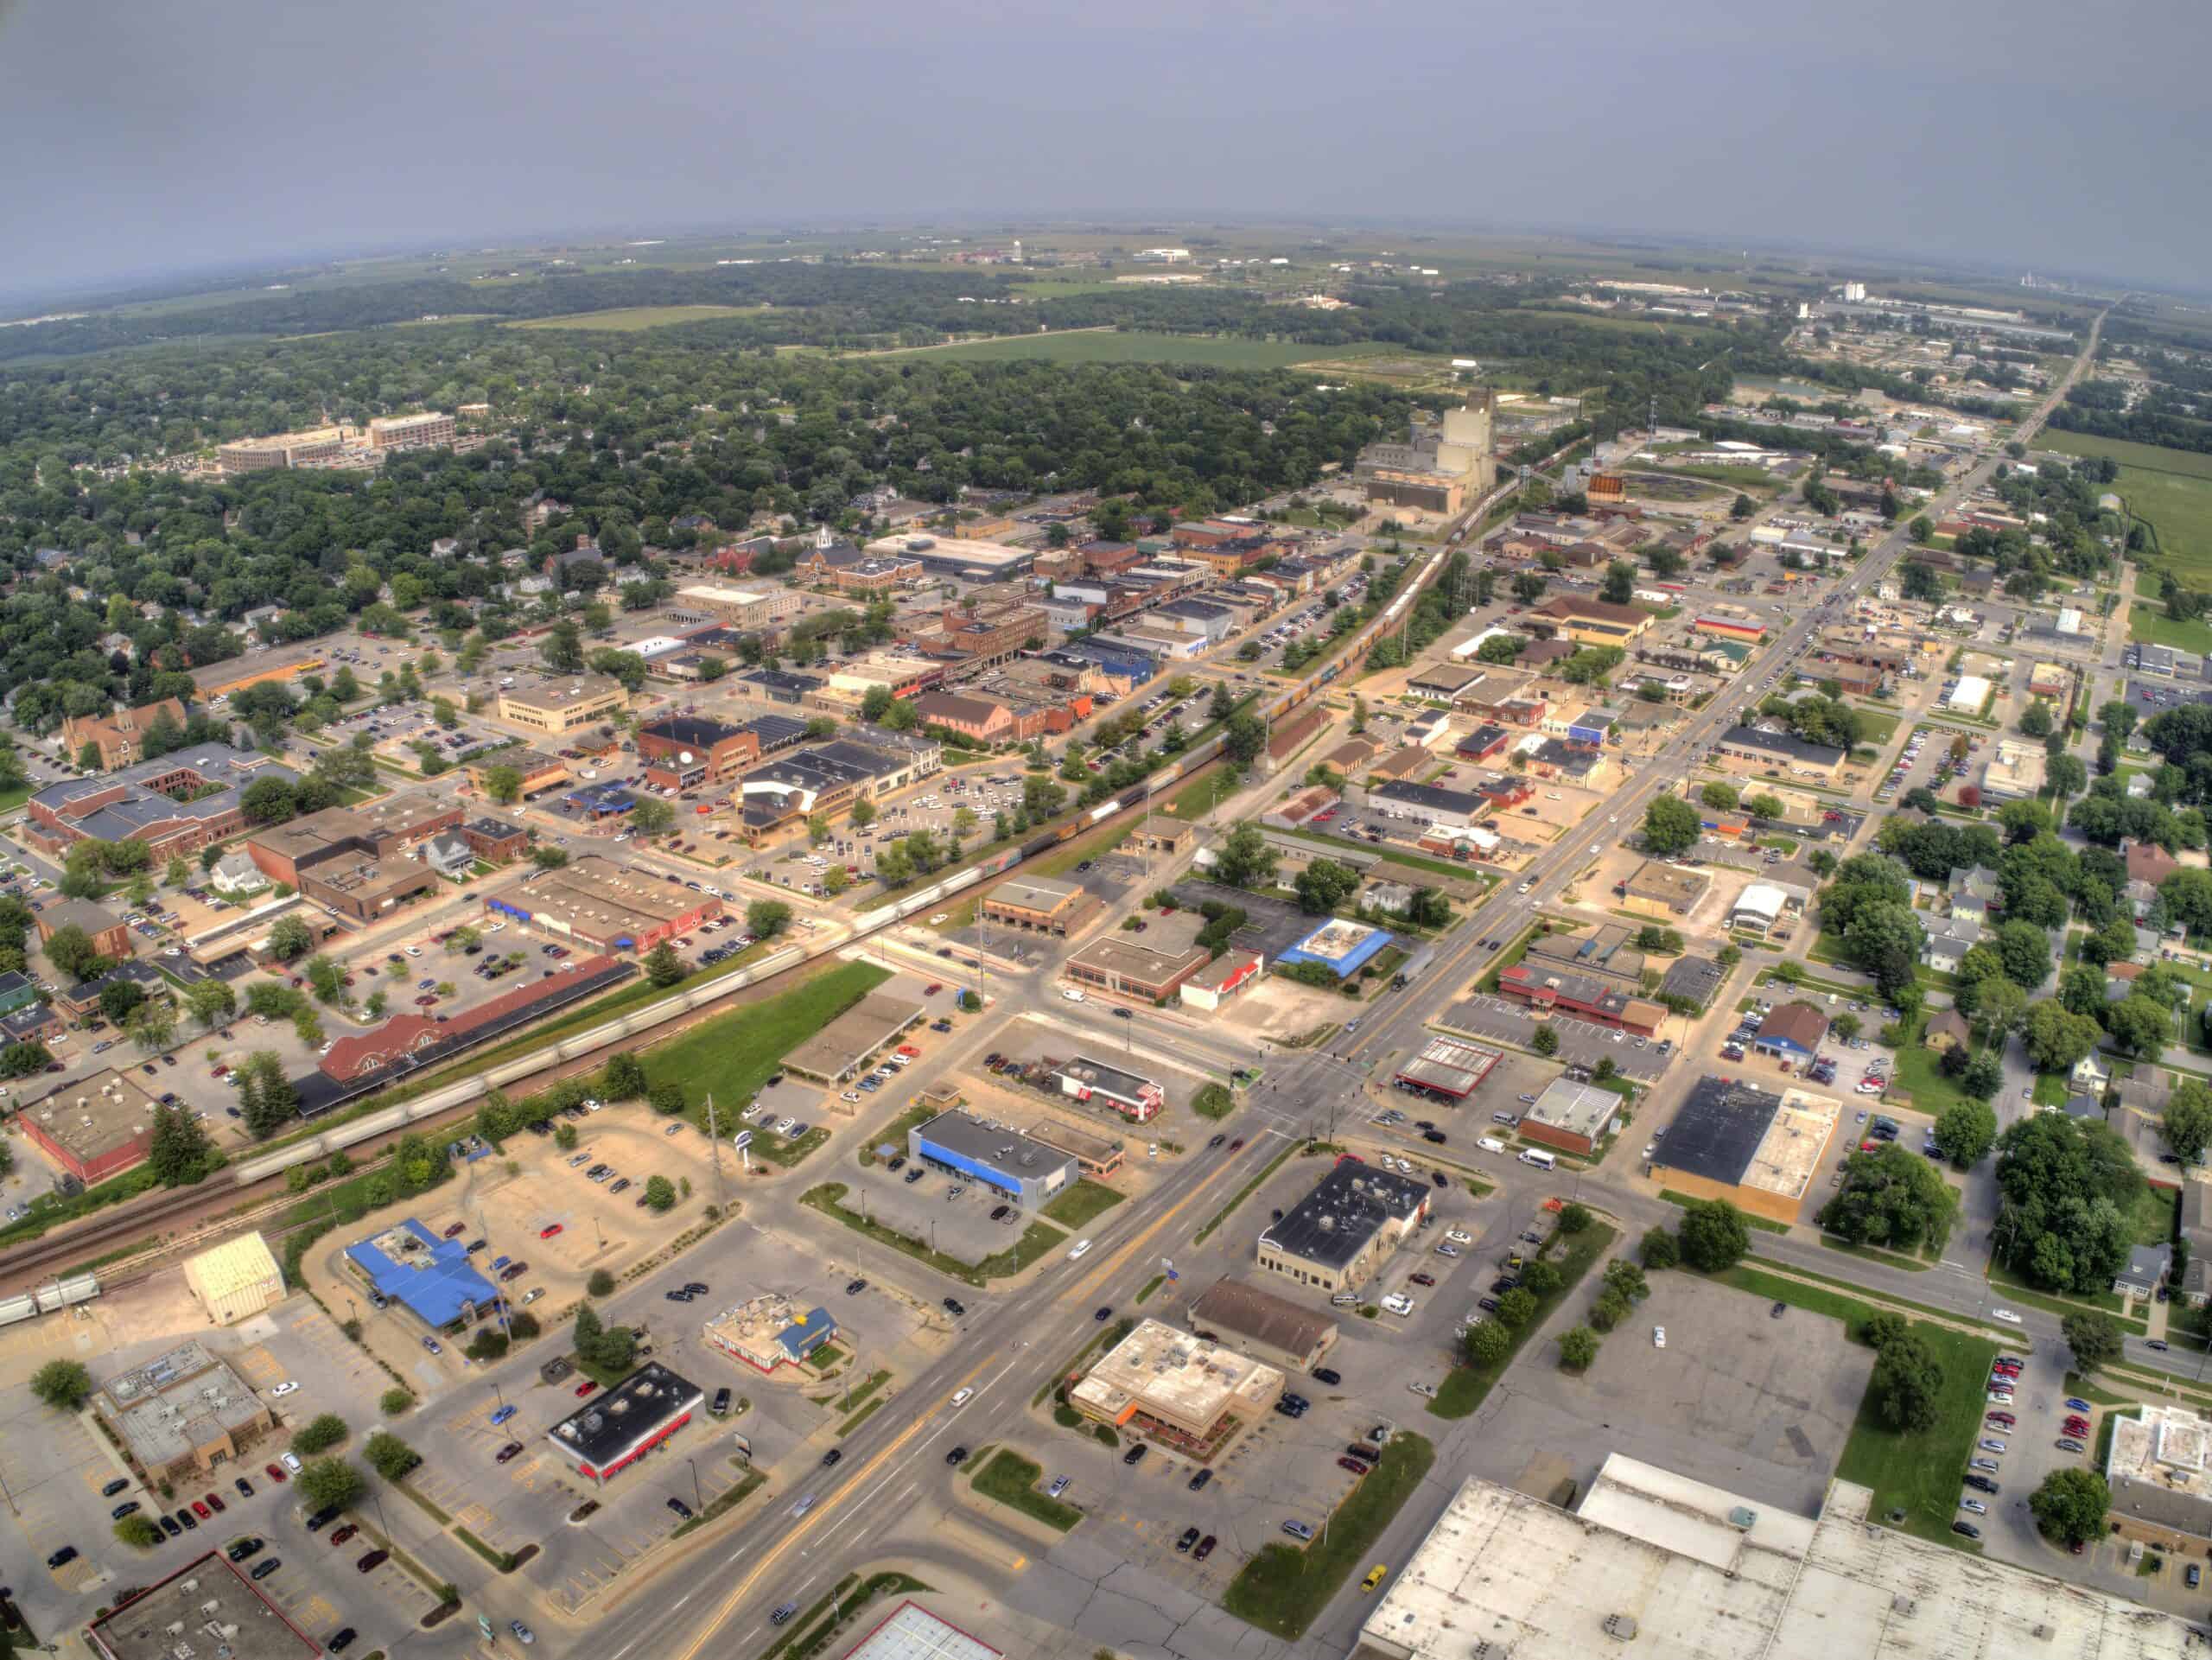
- Local poverty rate in 2023: 25.9%
- Median household income in city: $60,102 ($18,436 less than national median)
- Bachelor’s degree attainment rate in city: 63.5% (28.5 ppts. higher than comparable national rate)
- Five-year avg. unemployment rate in city: 6.4% (1.2 ppts. higher than national jobless rate)
- City population: 66,112
34. Madera, California

- Local poverty rate in 2023: 26.0%
- Median household income in city: $63,619 ($14,919 less than national median)
- Bachelor’s degree attainment rate in city: 10.3% (24.7 ppts. lower than comparable national rate)
- Five-year avg. unemployment rate in city: 11.9% (6.7 ppts. higher than national jobless rate)
- City population: 67,133
33. Manhattan, Kansas
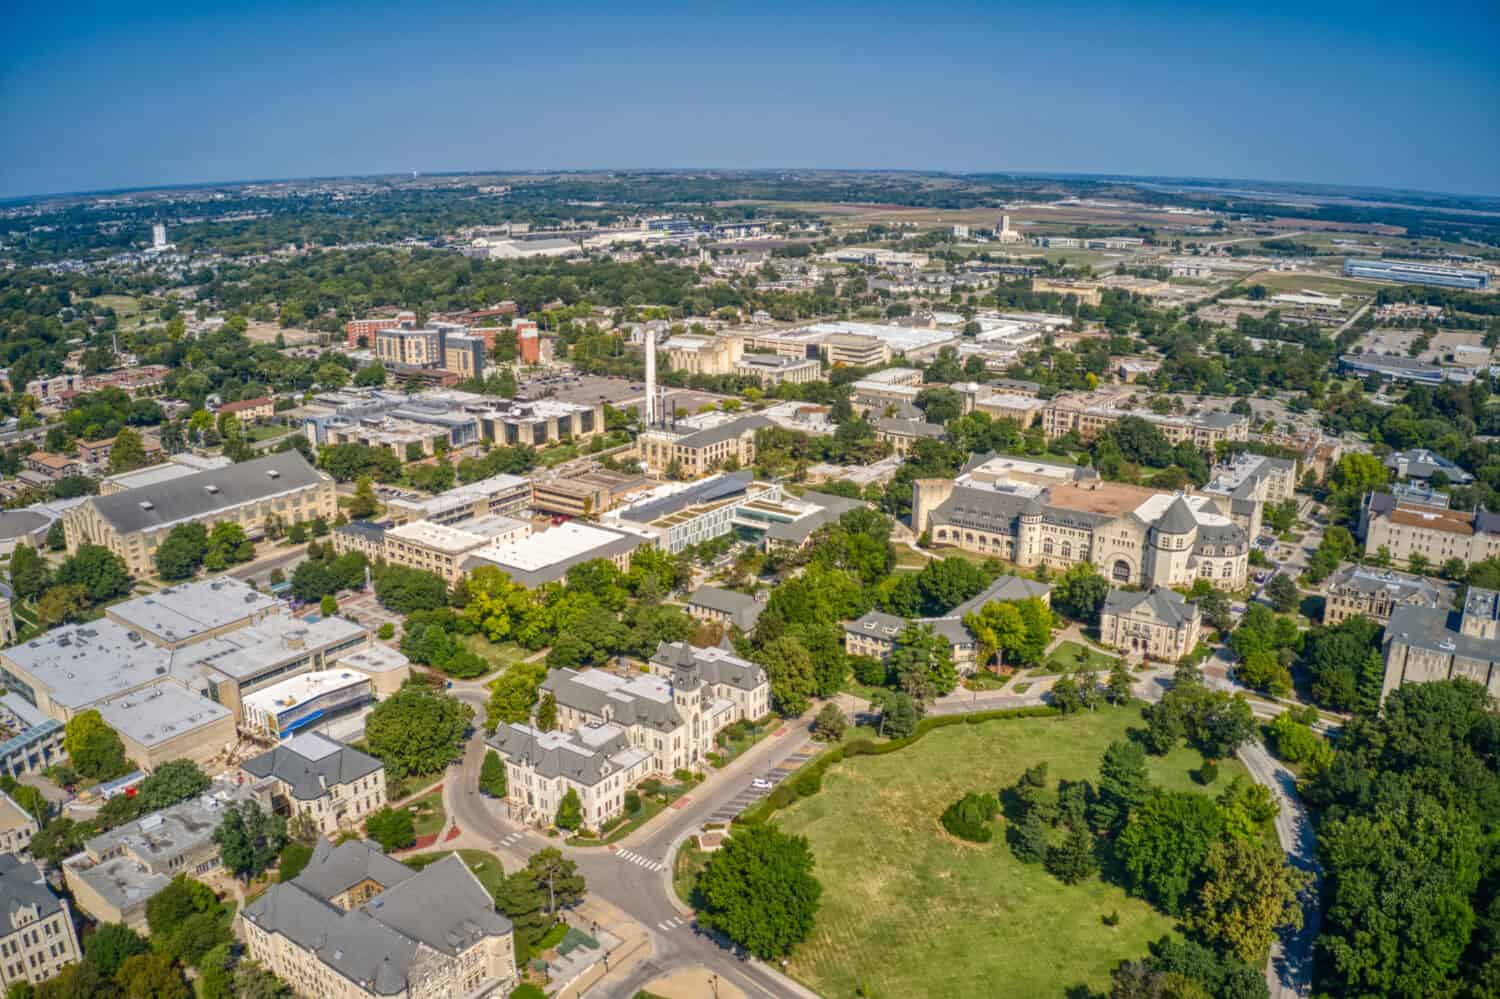
- Local poverty rate in 2023: 26.1%
- Median household income in city: $58,441 ($20,097 less than national median)
- Bachelor’s degree attainment rate in city: 52.1% (17.1 ppts. higher than comparable national rate)
- Five-year avg. unemployment rate in city: 4.4% (0.8 ppts. lower than national jobless rate)
- City population: 53,951
32. Auburn, Alabama
- Local poverty rate in 2023: 26.1%
- Median household income in city: $56,123 ($22,415 less than national median)
- Bachelor’s degree attainment rate in city: 62.8% (27.8 ppts. higher than comparable national rate)
- Five-year avg. unemployment rate in city: 3.8% (1.4 ppts. lower than national jobless rate)
- City population: 78,738
31. Iowa City, Iowa
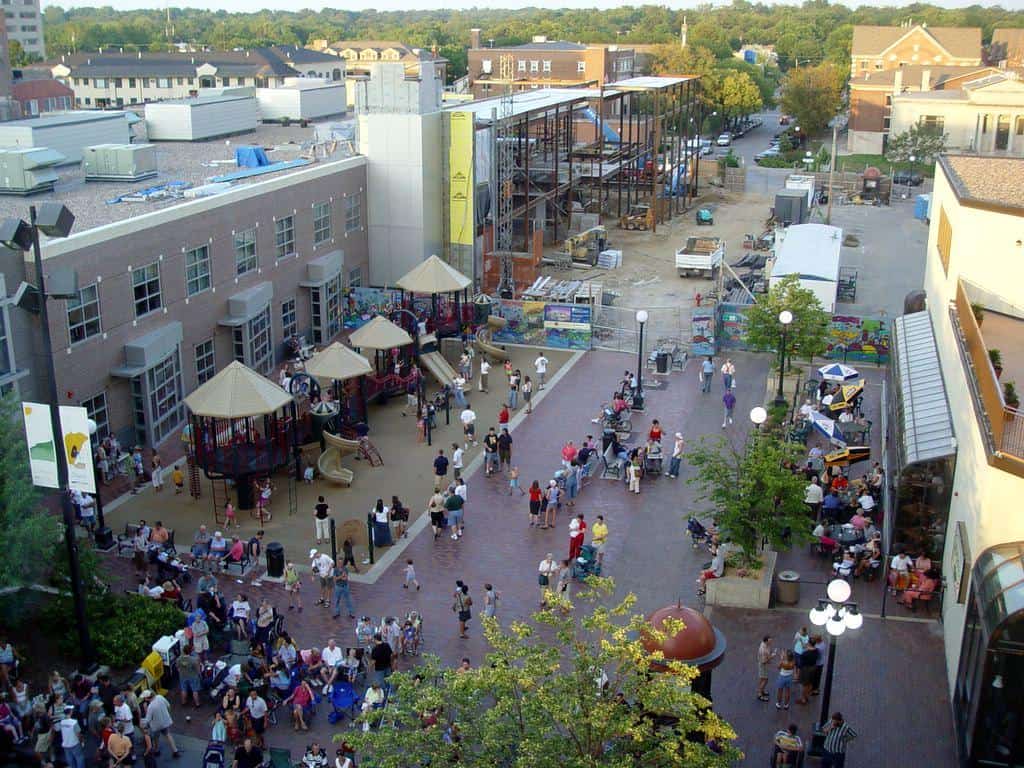
- Local poverty rate in 2023: 26.3%
- Median household income in city: $57,533 ($21,005 less than national median)
- Bachelor’s degree attainment rate in city: 60.7% (25.7 ppts. higher than comparable national rate)
- Five-year avg. unemployment rate in city: 4.2% (1 ppts. lower than national jobless rate)
- City population: 75,264
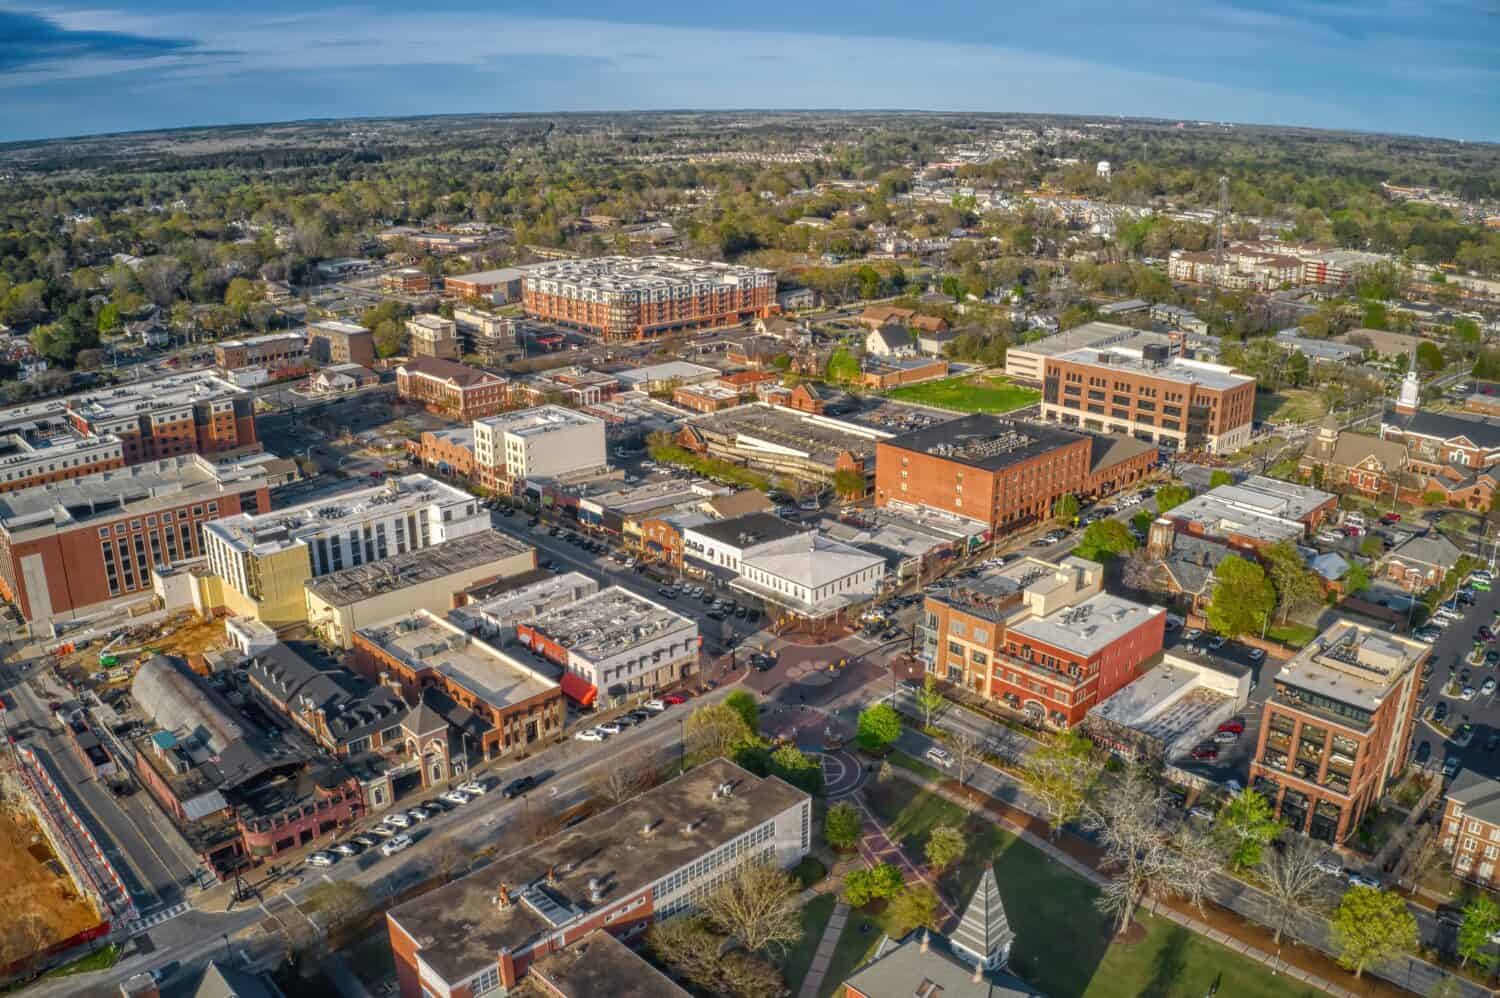
30. Athens-Clarke County, Georgia

- Local poverty rate in 2023: 26.3%
- Median household income in city: $51,655 ($26,883 less than national median)
- Bachelor’s degree attainment rate in city: 48.7% (13.7 ppts. higher than comparable national rate)
- Five-year avg. unemployment rate in city: 5.2% (in line with national jobless rate)
- City population: 126,987
29. Rochester, New York
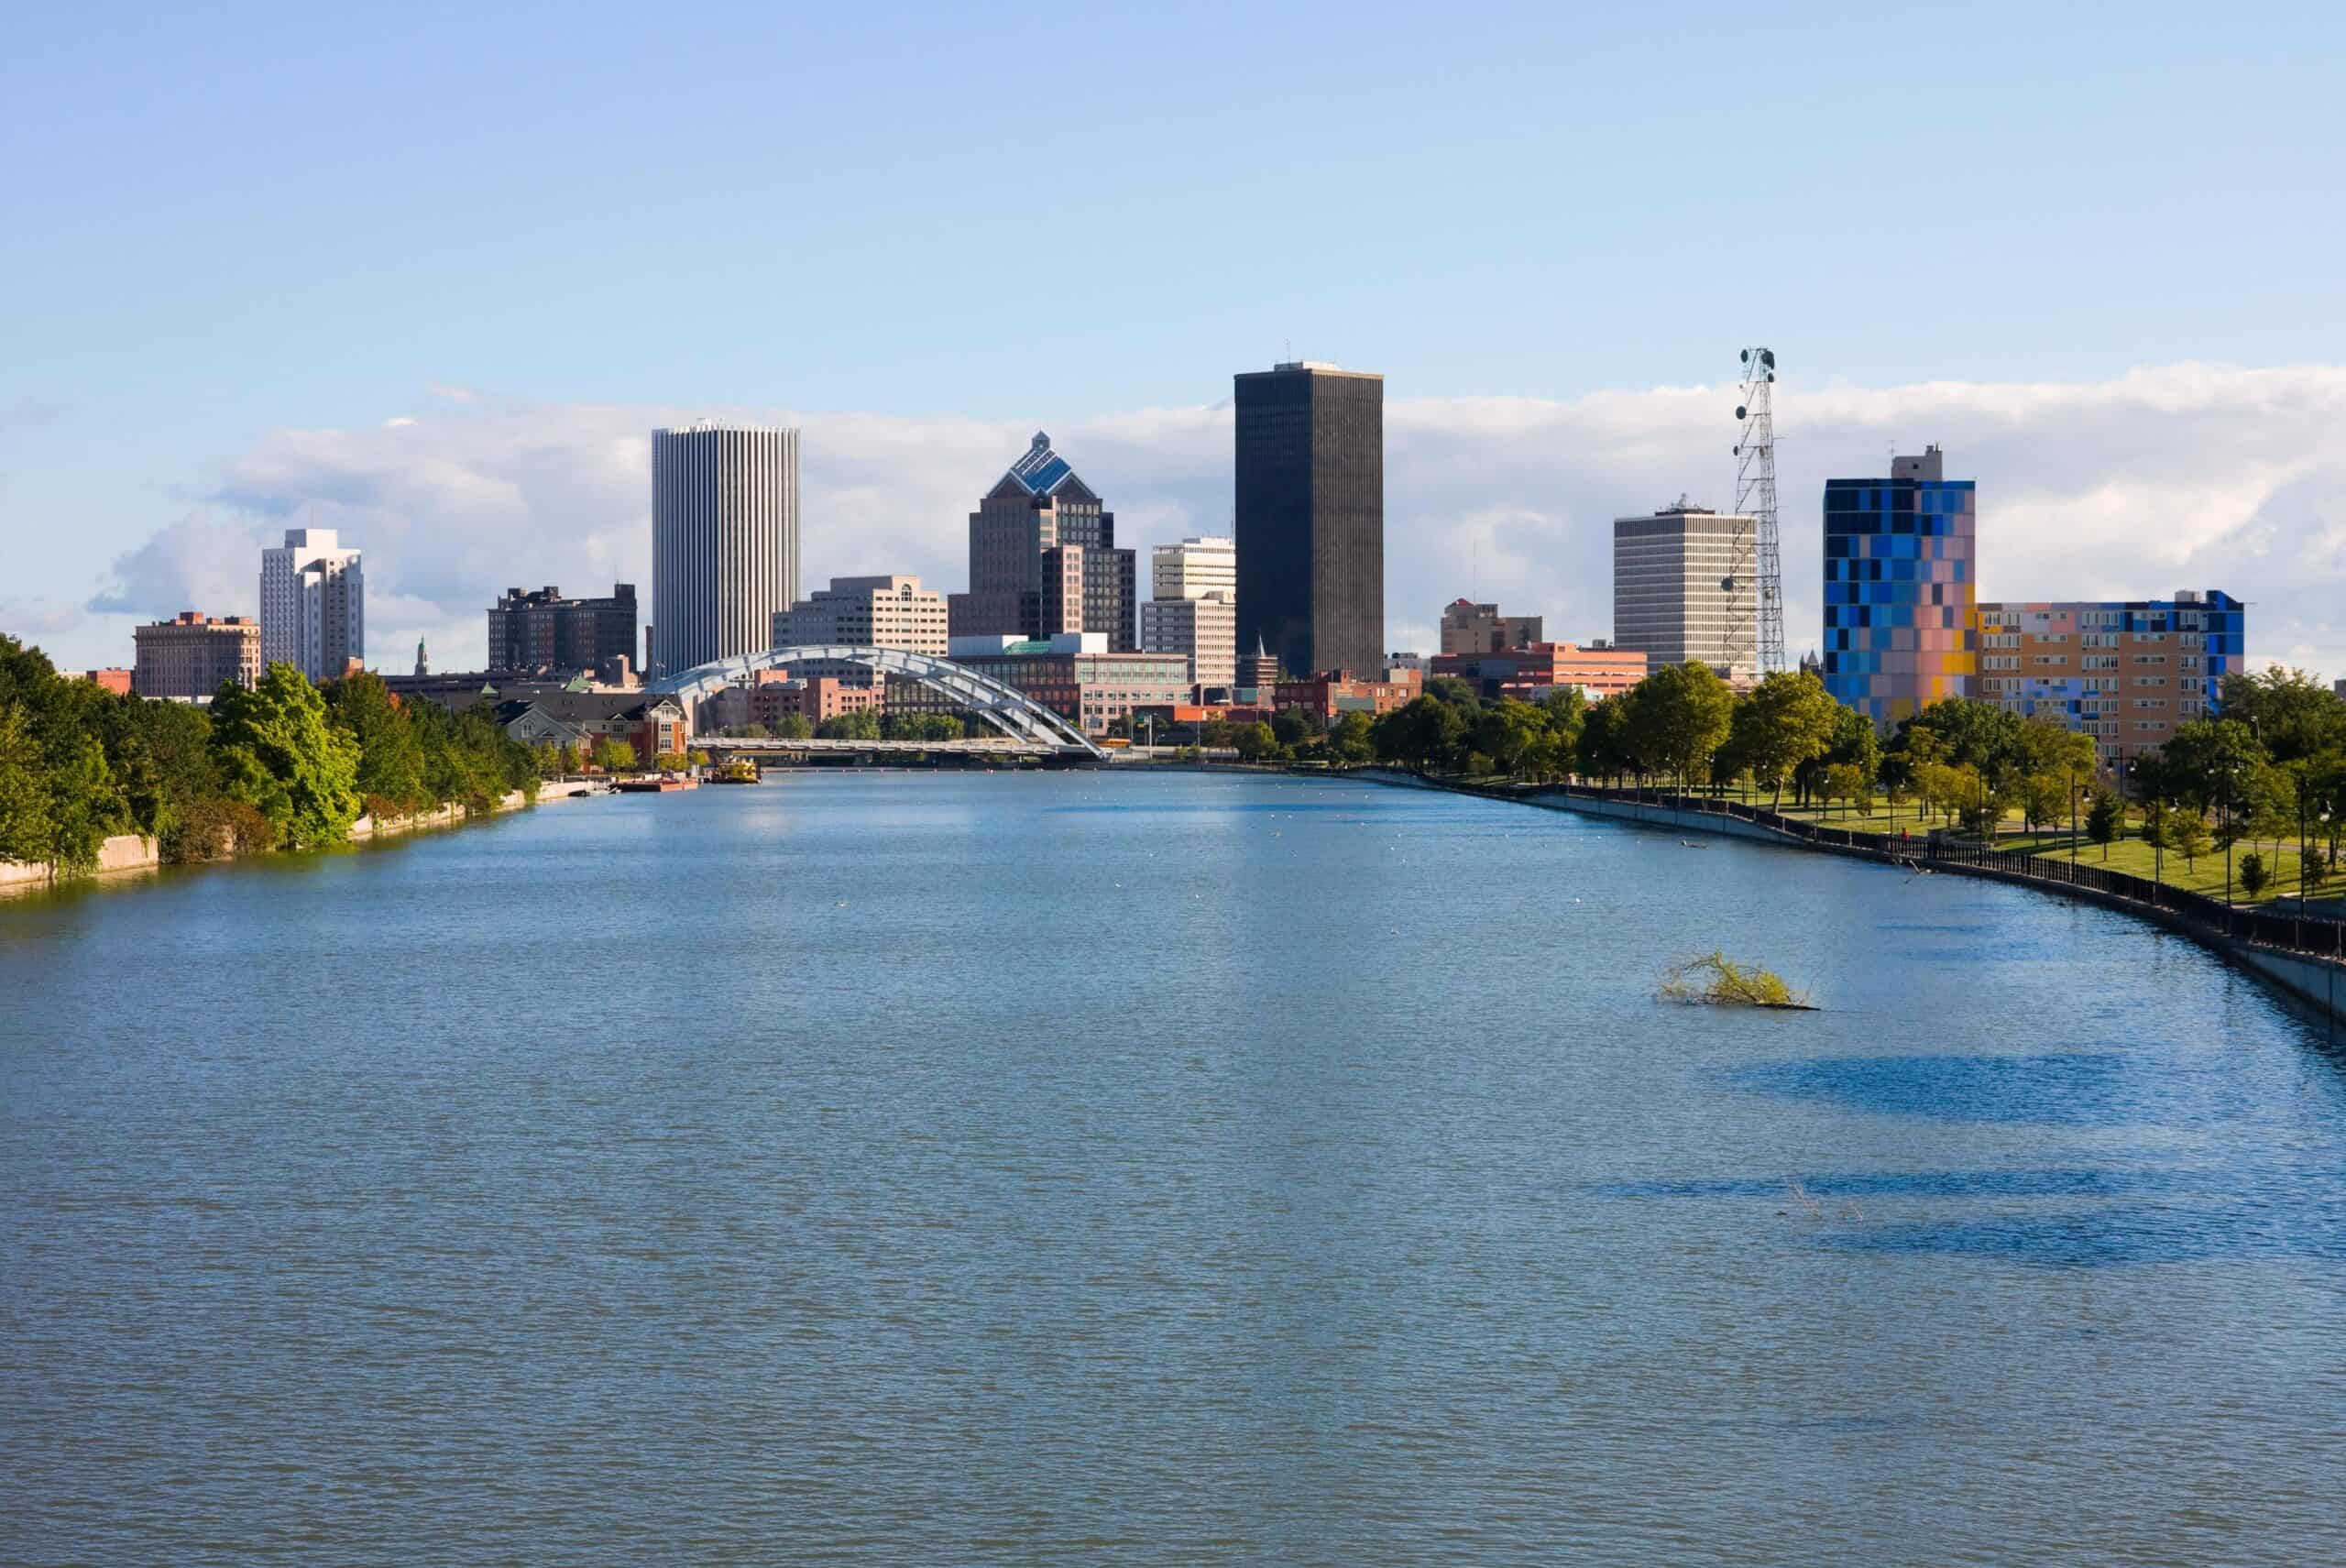
- Local poverty rate in 2023: 26.6%
- Median household income in city: $46,628 ($31,910 less than national median)
- Bachelor’s degree attainment rate in city: 29.9% (5.1 ppts. lower than comparable national rate)
- Five-year avg. unemployment rate in city: 7.9% (2.7 ppts. higher than national jobless rate)
- City population: 209,720
28. San Marcos, Texas
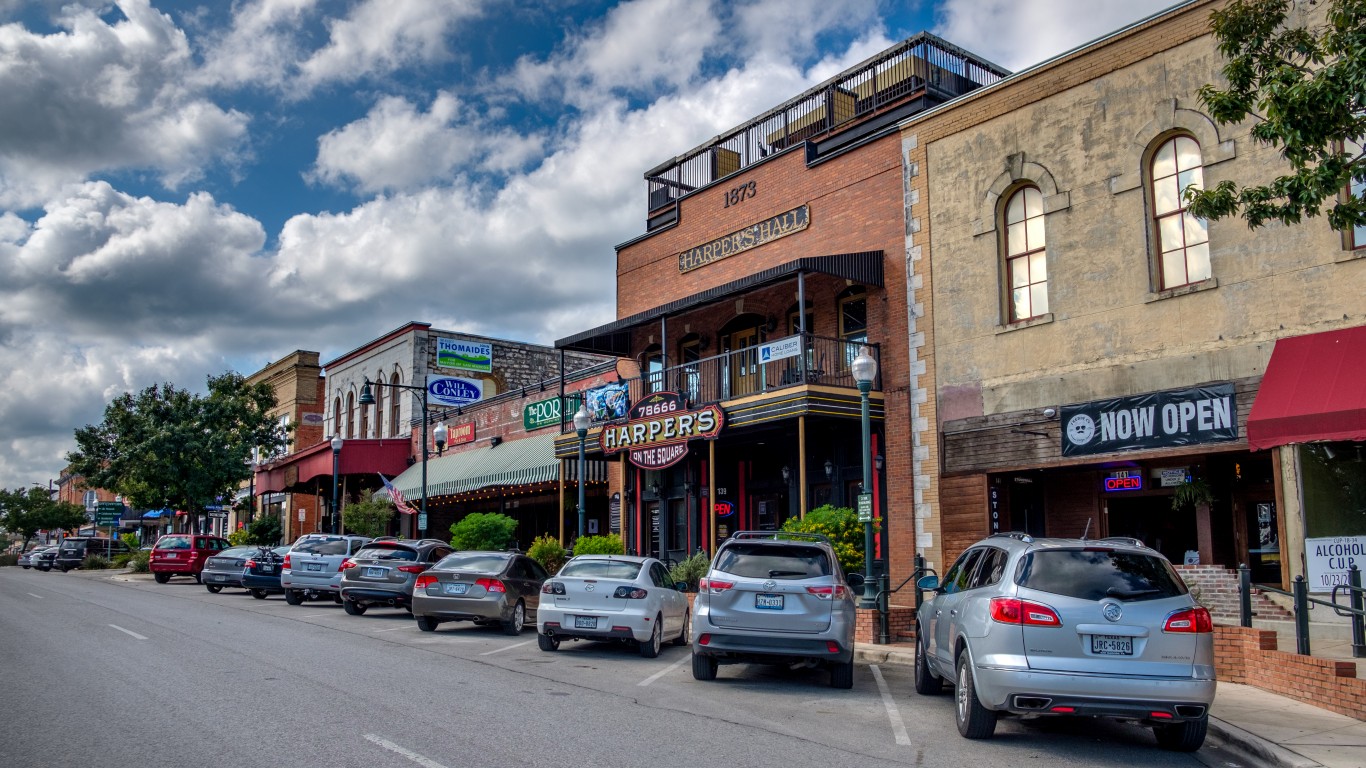
- Local poverty rate in 2023: 26.7%
- Median household income in city: $51,030 ($27,508 less than national median)
- Bachelor’s degree attainment rate in city: 37.3% (2.3 ppts. higher than comparable national rate)
- Five-year avg. unemployment rate in city: 6.1% (0.9 ppts. higher than national jobless rate)
- City population: 68,920
27. Terre Haute, Indiana
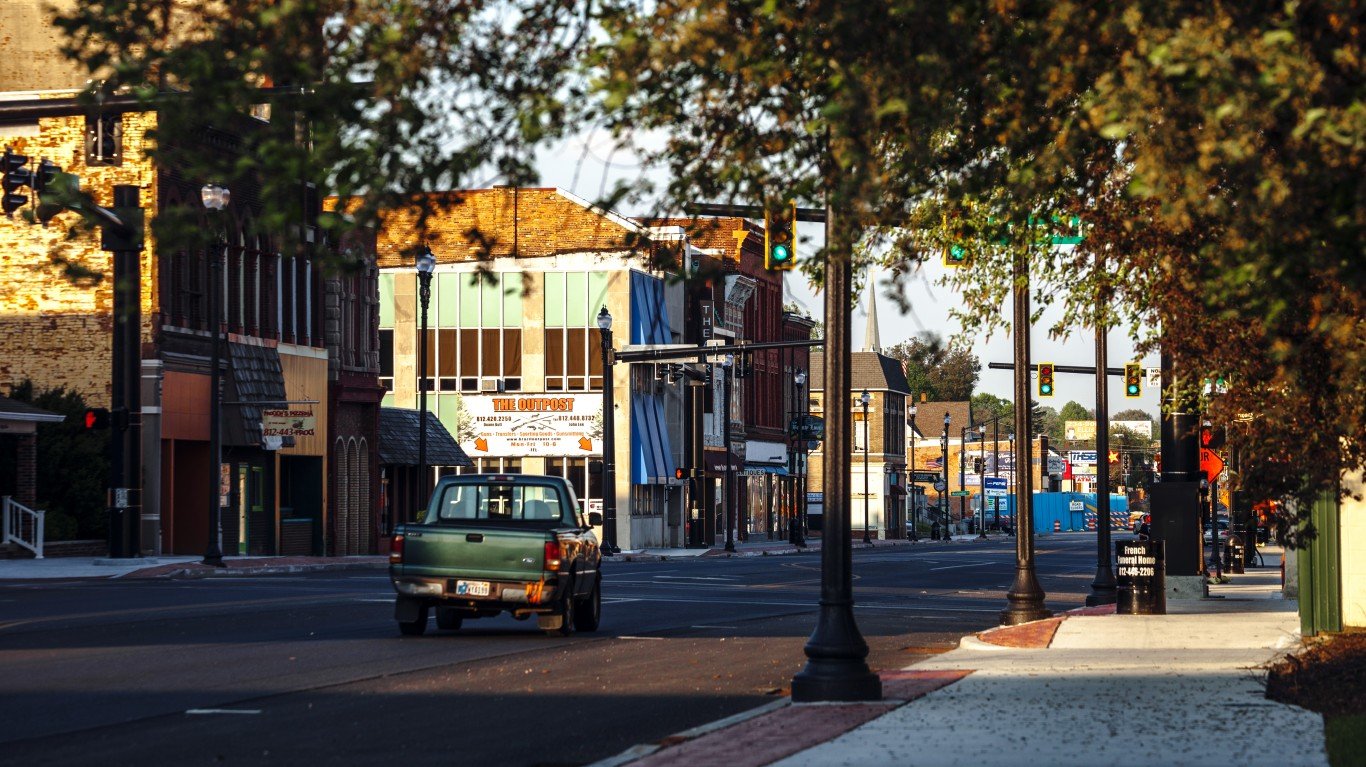
- Local poverty rate in 2023: 26.7%
- Median household income in city: $41,960 ($36,578 less than national median)
- Bachelor’s degree attainment rate in city: 23.1% (11.9 ppts. lower than comparable national rate)
- Five-year avg. unemployment rate in city: 7.7% (2.5 ppts. higher than national jobless rate)
- City population: 58,491
26. Jackson, Mississippi

- Local poverty rate in 2023: 26.8%
- Median household income in city: $43,238 ($35,300 less than national median)
- Bachelor’s degree attainment rate in city: 28.6% (6.4 ppts. lower than comparable national rate)
- Five-year avg. unemployment rate in city: 9.4% (4.2 ppts. higher than national jobless rate)
- City population: 149,827
25. Valdosta, Georgia

- Local poverty rate in 2023: 26.8%
- Median household income in city: $45,849 ($32,689 less than national median)
- Bachelor’s degree attainment rate in city: 28.1% (6.9 ppts. lower than comparable national rate)
- Five-year avg. unemployment rate in city: 6.7% (1.5 ppts. higher than national jobless rate)
- City population: 55,222
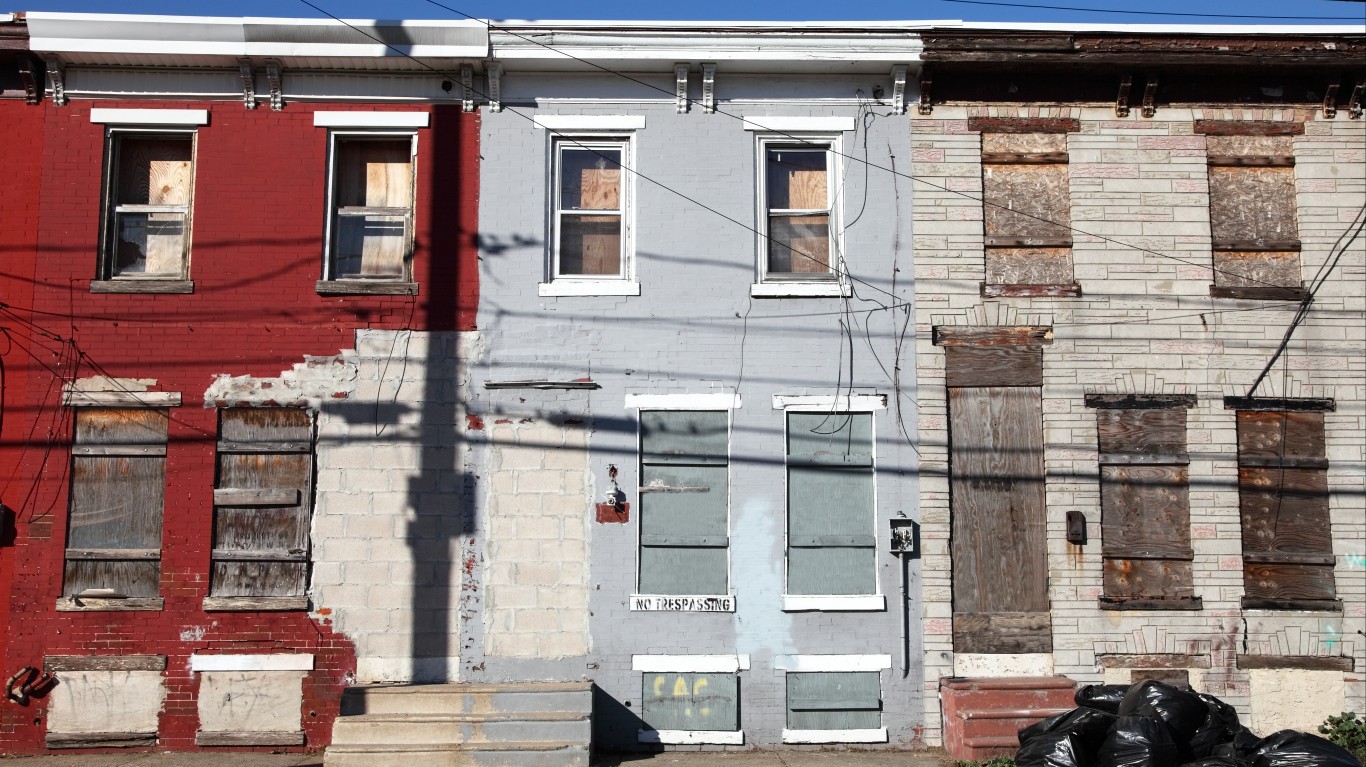
24. Reading, Pennsylvania

- Local poverty rate in 2023: 27.0%
- Median household income in city: $45,599 ($32,939 less than national median)
- Bachelor’s degree attainment rate in city: 11.7% (23.3 ppts. lower than comparable national rate)
- Five-year avg. unemployment rate in city: 12.1% (6.9 ppts. higher than national jobless rate)
- City population: 94,836
23. Kalamazoo, Michigan

- Local poverty rate in 2023: 27.0%
- Median household income in city: $48,965 ($29,573 less than national median)
- Bachelor’s degree attainment rate in city: 37.1% (2.1 ppts. higher than comparable national rate)
- Five-year avg. unemployment rate in city: 6.9% (1.7 ppts. higher than national jobless rate)
- City population: 73,132
22. Dayton, Ohio
- Local poverty rate in 2023: 27.1%
- Median household income in city: $43,454 ($35,084 less than national median)
- Bachelor’s degree attainment rate in city: 20.7% (14.3 ppts. lower than comparable national rate)
- Five-year avg. unemployment rate in city: 9.7% (4.5 ppts. higher than national jobless rate)
- City population: 136,741
21. Lorain, Ohio

- Local poverty rate in 2023: 27.4%
- Median household income in city: $45,799 ($32,739 less than national median)
- Bachelor’s degree attainment rate in city: 14.3% (20.7 ppts. lower than comparable national rate)
- Five-year avg. unemployment rate in city: 7% (1.8 ppts. higher than national jobless rate)
- City population: 65,207
20. Buffalo, New York
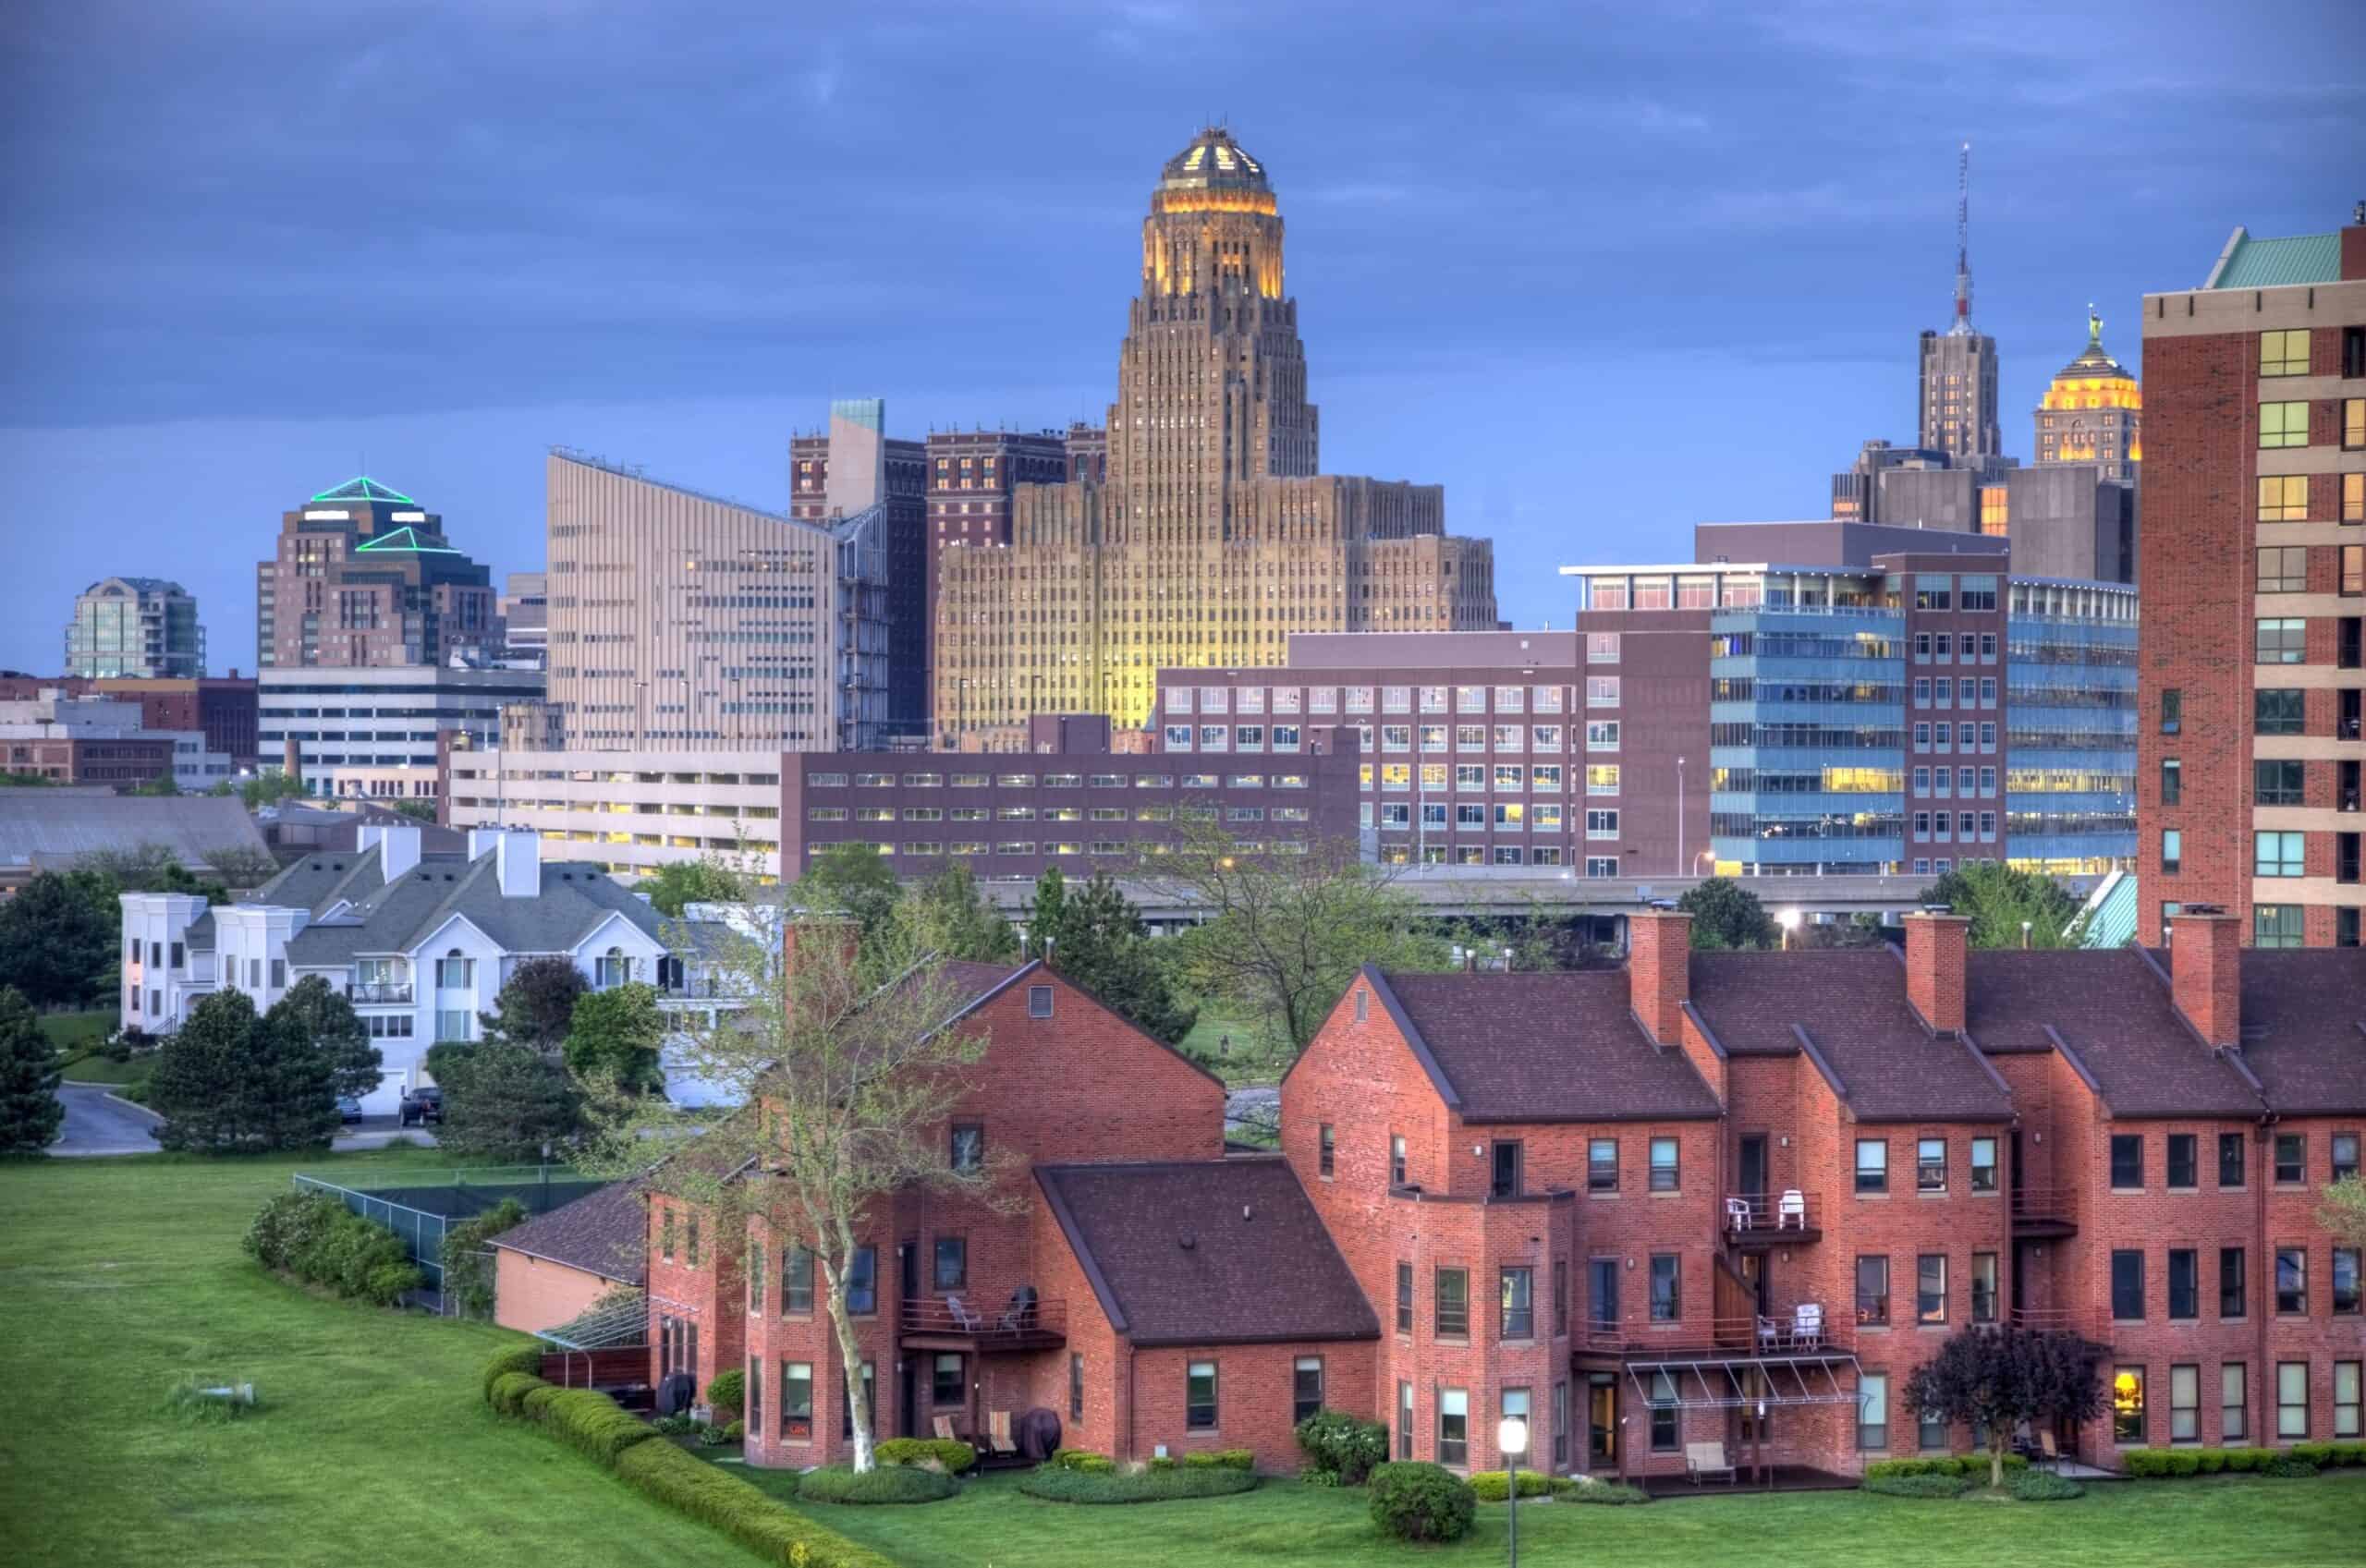
- Local poverty rate in 2023: 27.4%
- Median household income in city: $48,050 ($30,488 less than national median)
- Bachelor’s degree attainment rate in city: 30.3% (4.7 ppts. lower than comparable national rate)
- Five-year avg. unemployment rate in city: 7.2% (2 ppts. higher than national jobless rate)
- City population: 276,397
19. Utica, New York
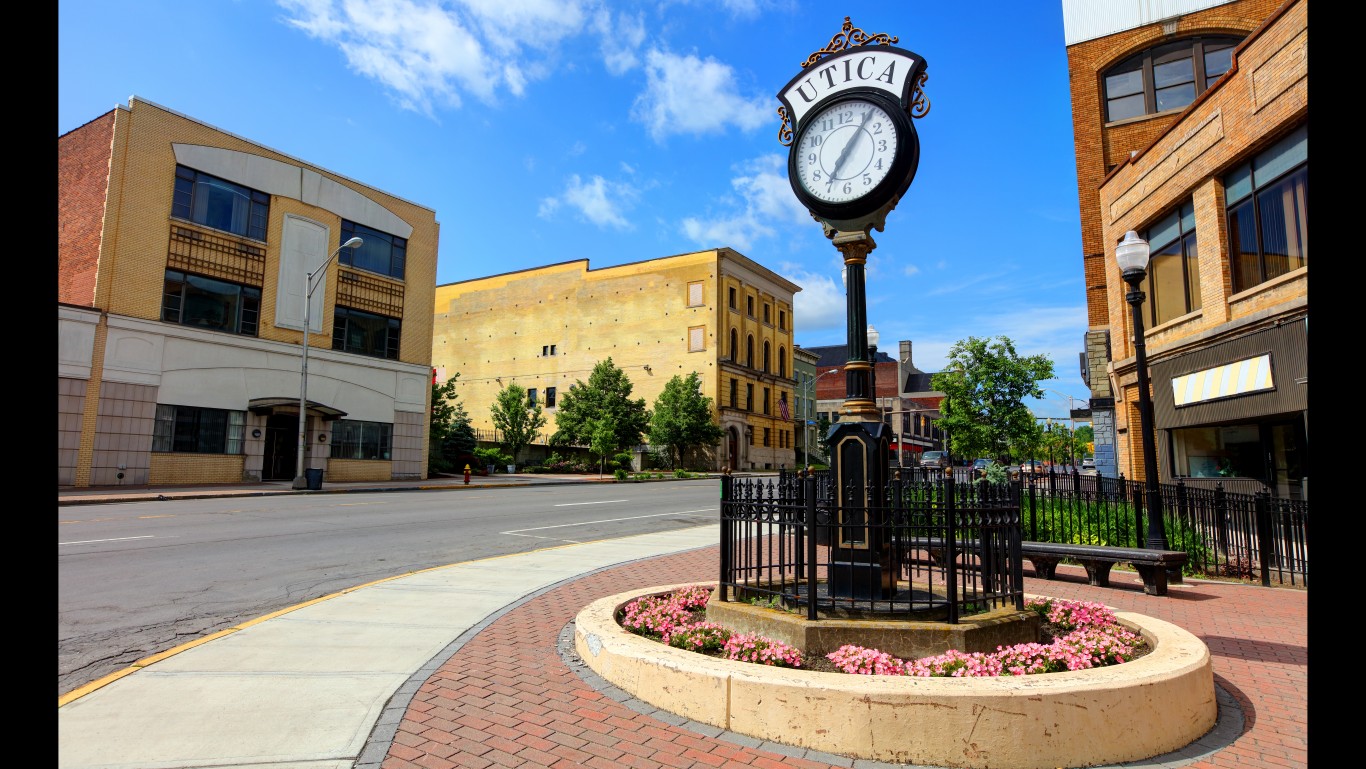
- Local poverty rate in 2023: 27.6%
- Median household income in city: $51,513 ($27,025 less than national median)
- Bachelor’s degree attainment rate in city: 21.7% (13.3 ppts. lower than comparable national rate)
- Five-year avg. unemployment rate in city: 7.2% (2 ppts. higher than national jobless rate)
- City population: 64,440
18. Gainesville, Florida

- Local poverty rate in 2023: 28.0%
- Median household income in city: $45,611 ($32,927 less than national median)
- Bachelor’s degree attainment rate in city: 51.7% (16.7 ppts. higher than comparable national rate)
- Five-year avg. unemployment rate in city: 4.8% (0.4 ppts. lower than national jobless rate)
- City population: 143,611
17. Canton, Ohio
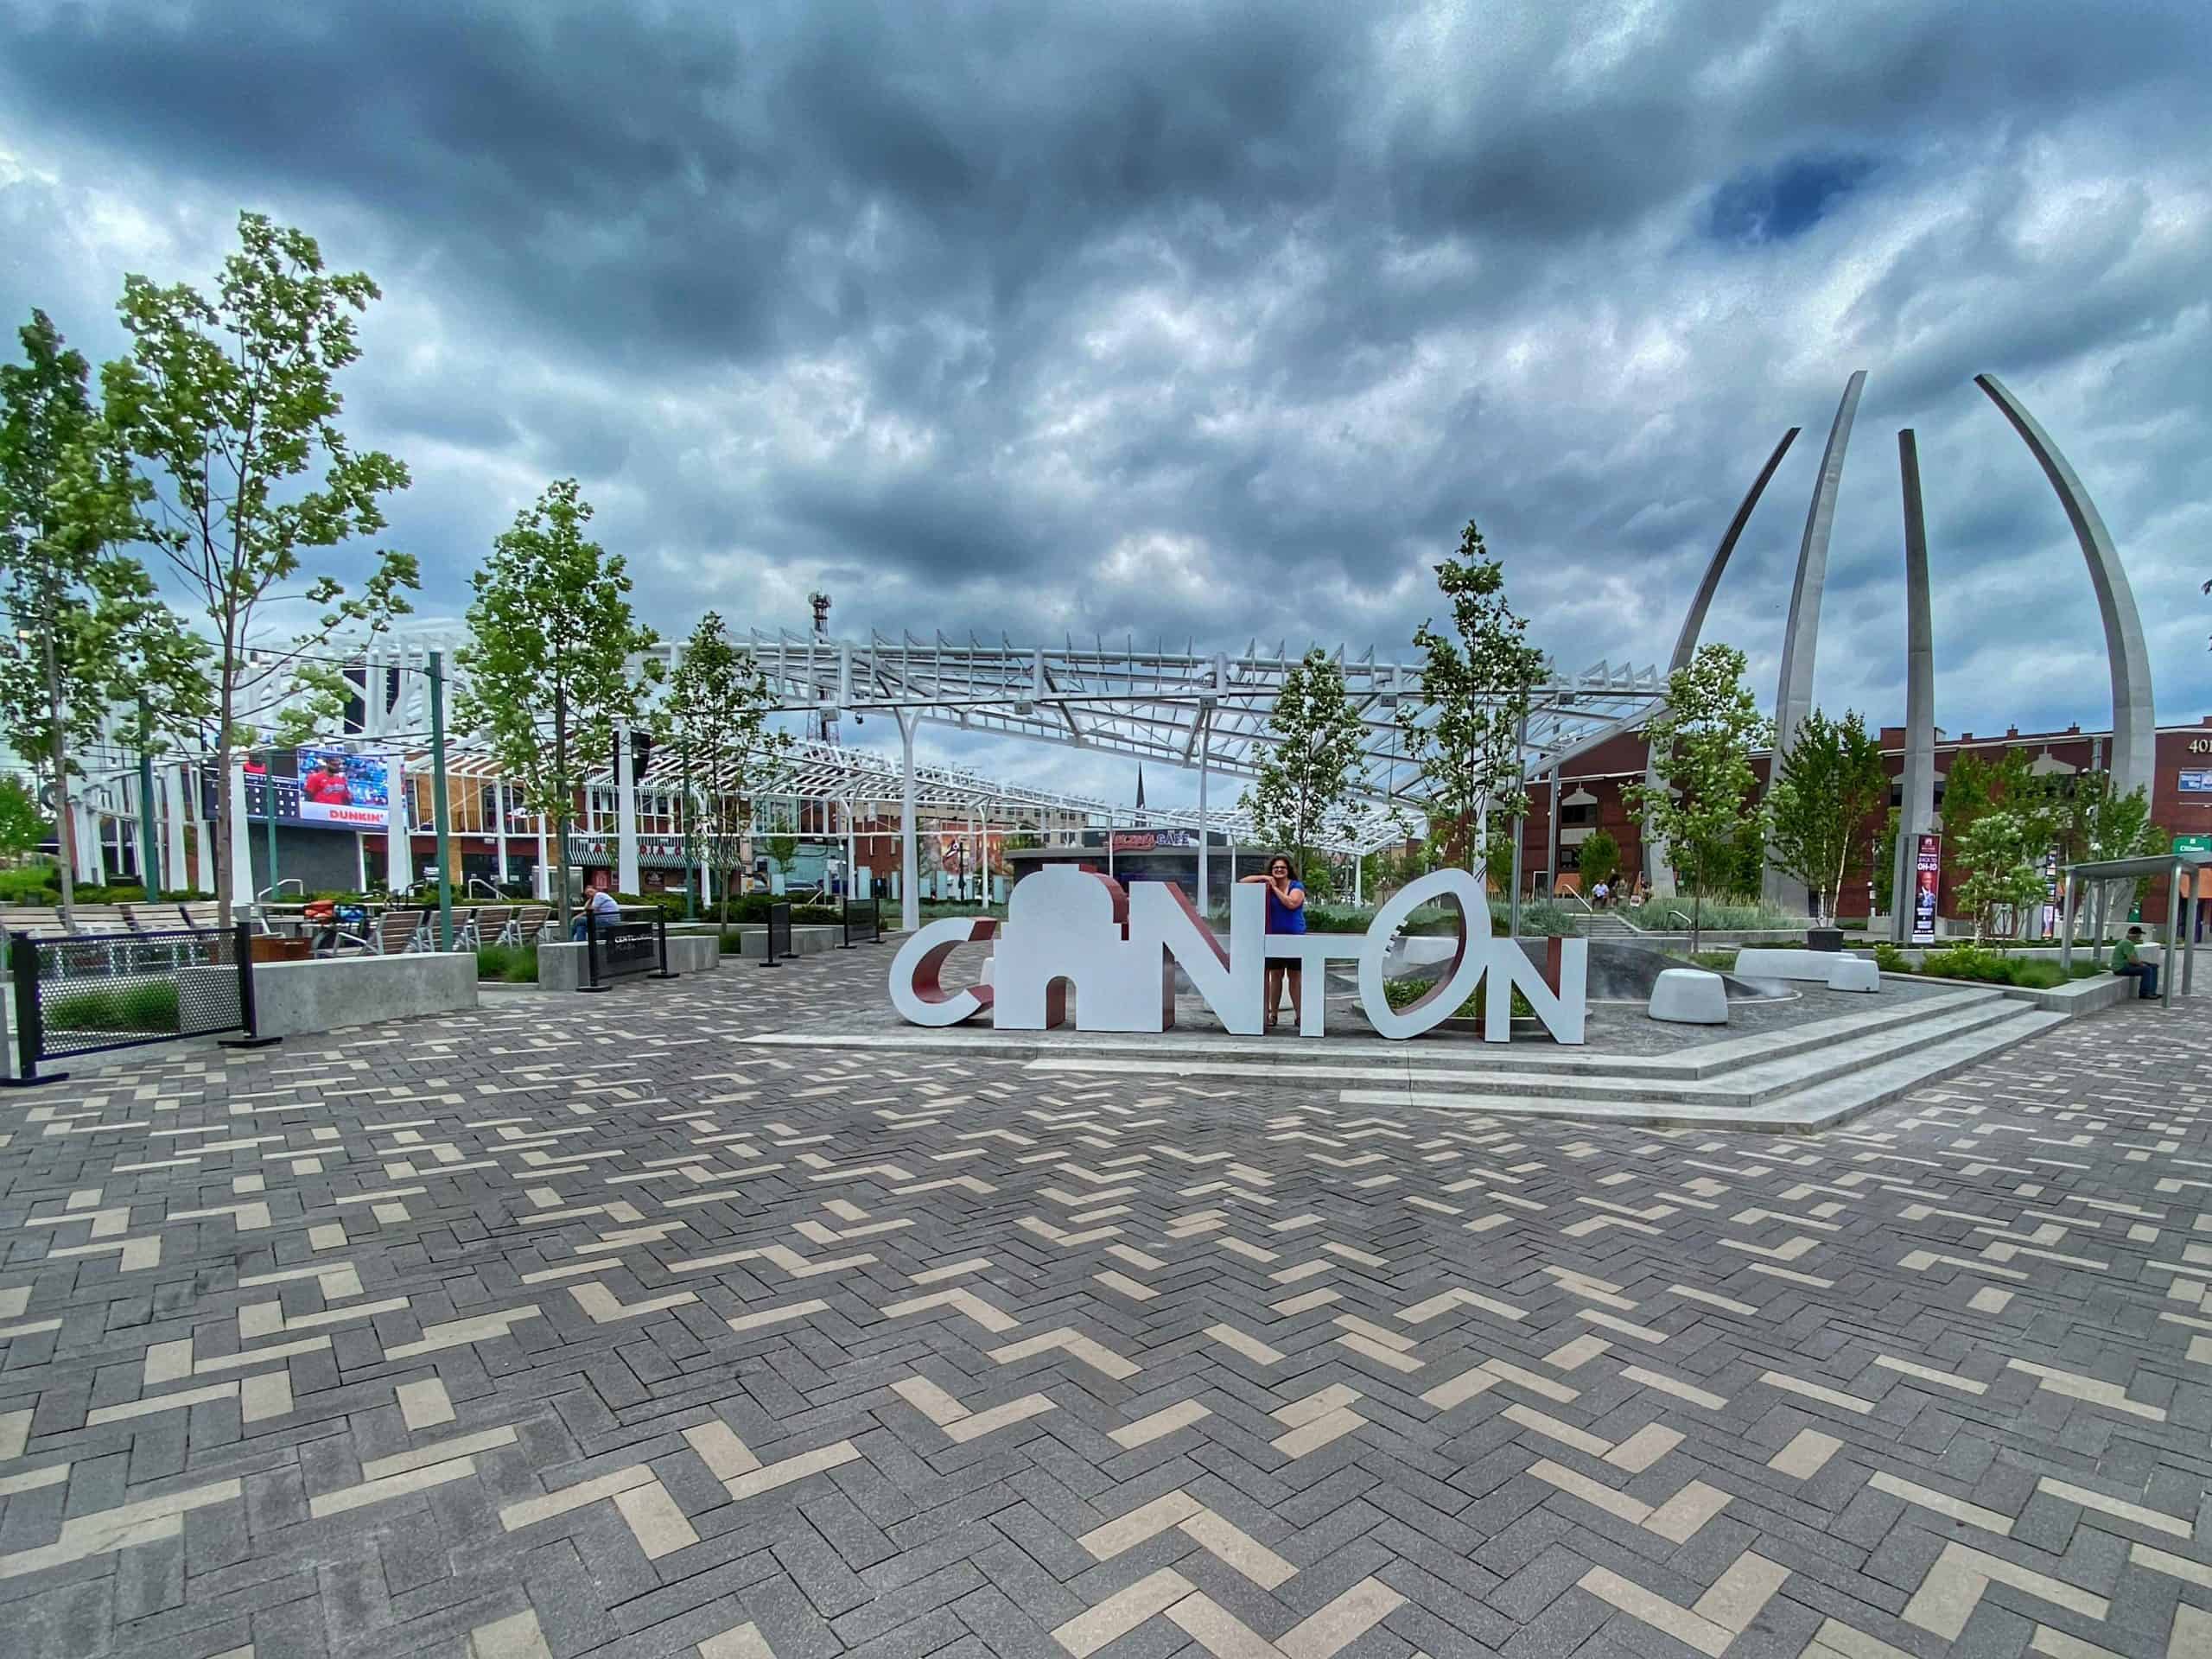
- Local poverty rate in 2023: 28.4%
- Median household income in city: $39,754 ($38,784 less than national median)
- Bachelor’s degree attainment rate in city: 15.4% (19.6 ppts. lower than comparable national rate)
- Five-year avg. unemployment rate in city: 7.7% (2.5 ppts. higher than national jobless rate)
- City population: 70,105
16. Camden, New Jersey
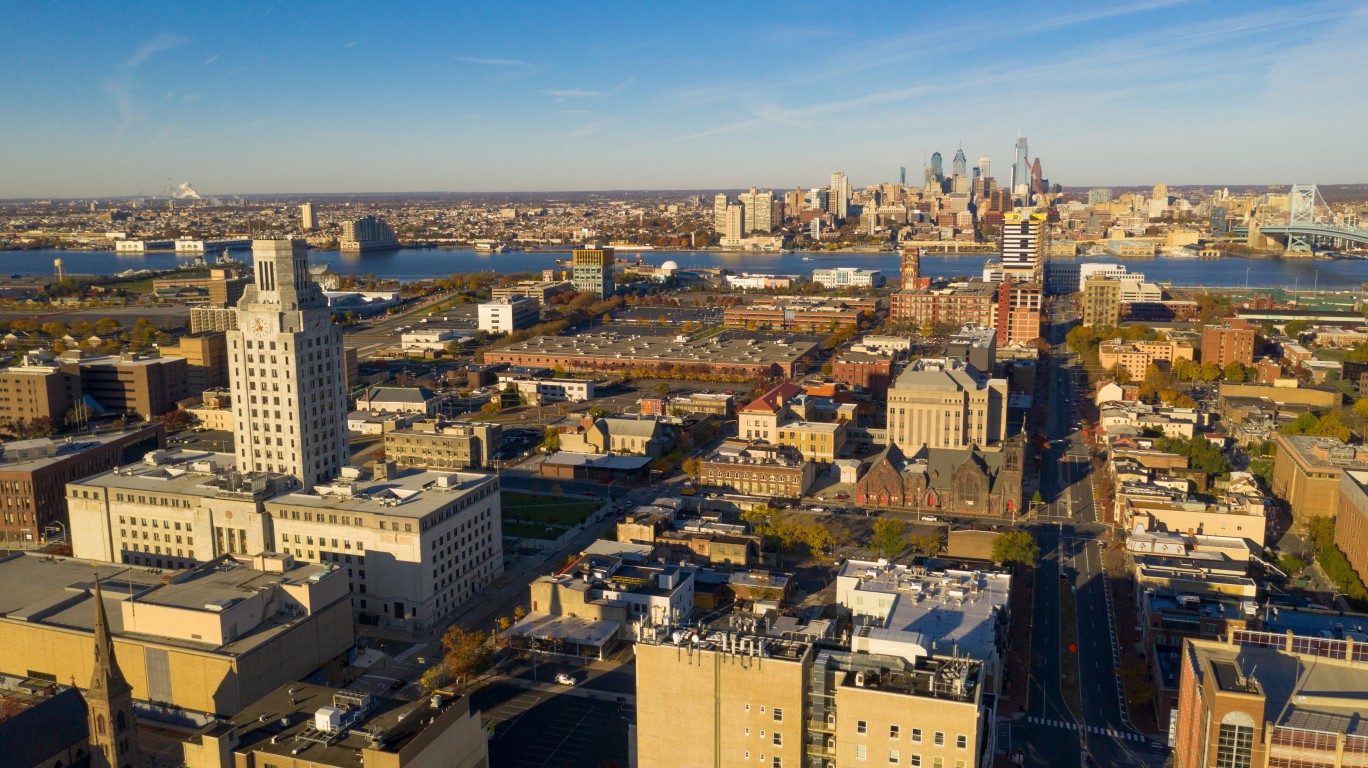
- Local poverty rate in 2023: 28.5%
- Median household income in city: $40,450 ($38,088 less than national median)
- Bachelor’s degree attainment rate in city: 9.6% (25.4 ppts. lower than comparable national rate)
- Five-year avg. unemployment rate in city: 14.1% (8.9 ppts. higher than national jobless rate)
- City population: 71,471
15. College Station, Texas
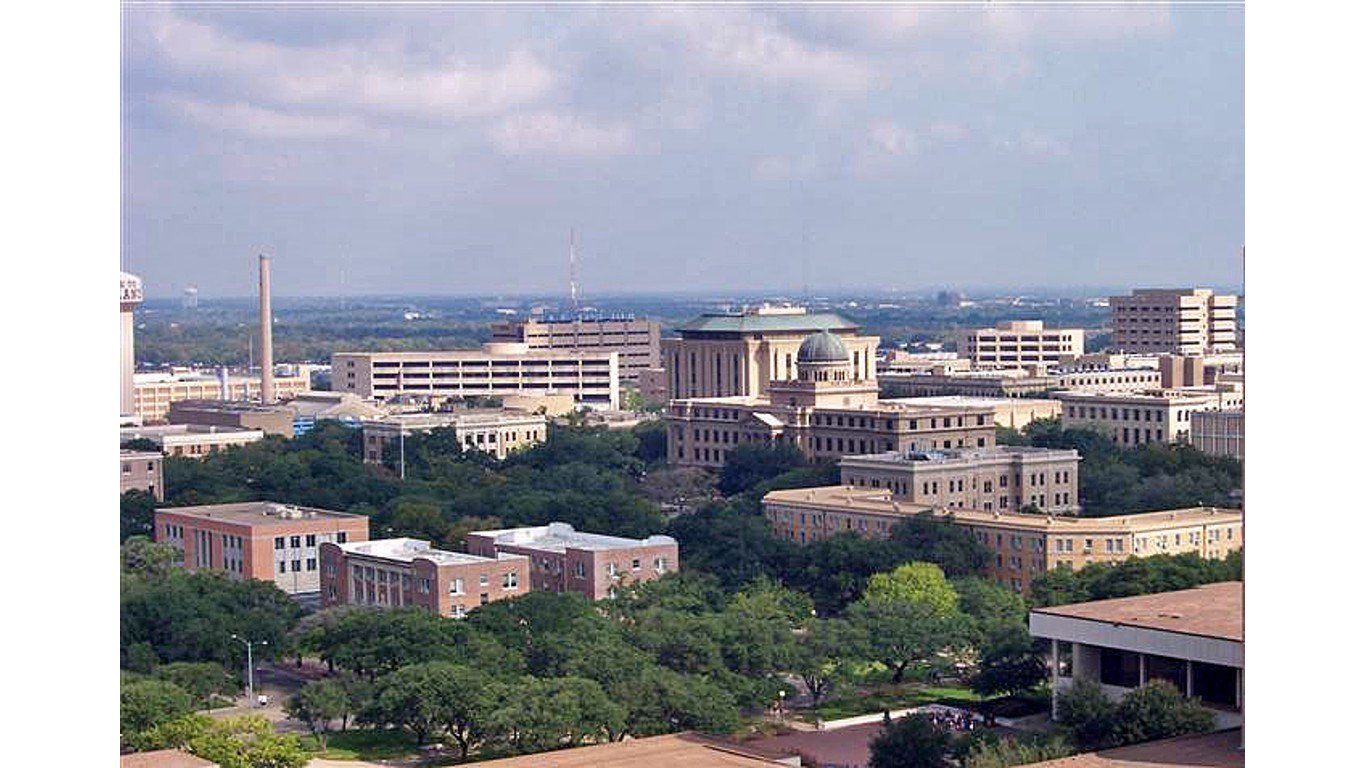
- Local poverty rate in 2023: 28.6%
- Median household income in city: $51,776 ($26,762 less than national median)
- Bachelor’s degree attainment rate in city: 57.1% (22.1 ppts. higher than comparable national rate)
- Five-year avg. unemployment rate in city: 4.8% (0.4 ppts. lower than national jobless rate)
- City population: 122,280
14. Port Arthur, Texas

- Local poverty rate in 2023: 29.1%
- Median household income in city: $45,752 ($32,786 less than national median)
- Bachelor’s degree attainment rate in city: 11.2% (23.8 ppts. lower than comparable national rate)
- Five-year avg. unemployment rate in city: 7.9% (2.7 ppts. higher than national jobless rate)
- City population: 55,779
13. Harrisburg, Pennsylvania

- Local poverty rate in 2023: 29.1%
- Median household income in city: $47,783 ($30,755 less than national median)
- Bachelor’s degree attainment rate in city: 26.3% (8.7 ppts. lower than comparable national rate)
- Five-year avg. unemployment rate in city: 9.4% (4.2 ppts. higher than national jobless rate)
- City population: 50,092
12. Albany, Georgia

- Local poverty rate in 2023: 29.2%
- Median household income in city: $45,201 ($33,337 less than national median)
- Bachelor’s degree attainment rate in city: 21.5% (13.5 ppts. lower than comparable national rate)
- Five-year avg. unemployment rate in city: 11.5% (6.3 ppts. higher than national jobless rate)
- City population: 67,939
11. Lakewood, New Jersey
- Local poverty rate in 2023: 29.3%
- Median household income in city: $57,576 ($20,962 less than national median)
- Bachelor’s degree attainment rate in city: 31.3% (3.7 ppts. lower than comparable national rate)
- Five-year avg. unemployment rate in city: 6.8% (1.6 ppts. higher than national jobless rate)
- City population: 69,884
10. Syracuse, New York

- Local poverty rate in 2023: 29.6%
- Median household income in city: $45,845 ($32,693 less than national median)
- Bachelor’s degree attainment rate in city: 30.5% (4.5 ppts. lower than comparable national rate)
- Five-year avg. unemployment rate in city: 7.4% (2.2 ppts. higher than national jobless rate)
- City population: 146,211
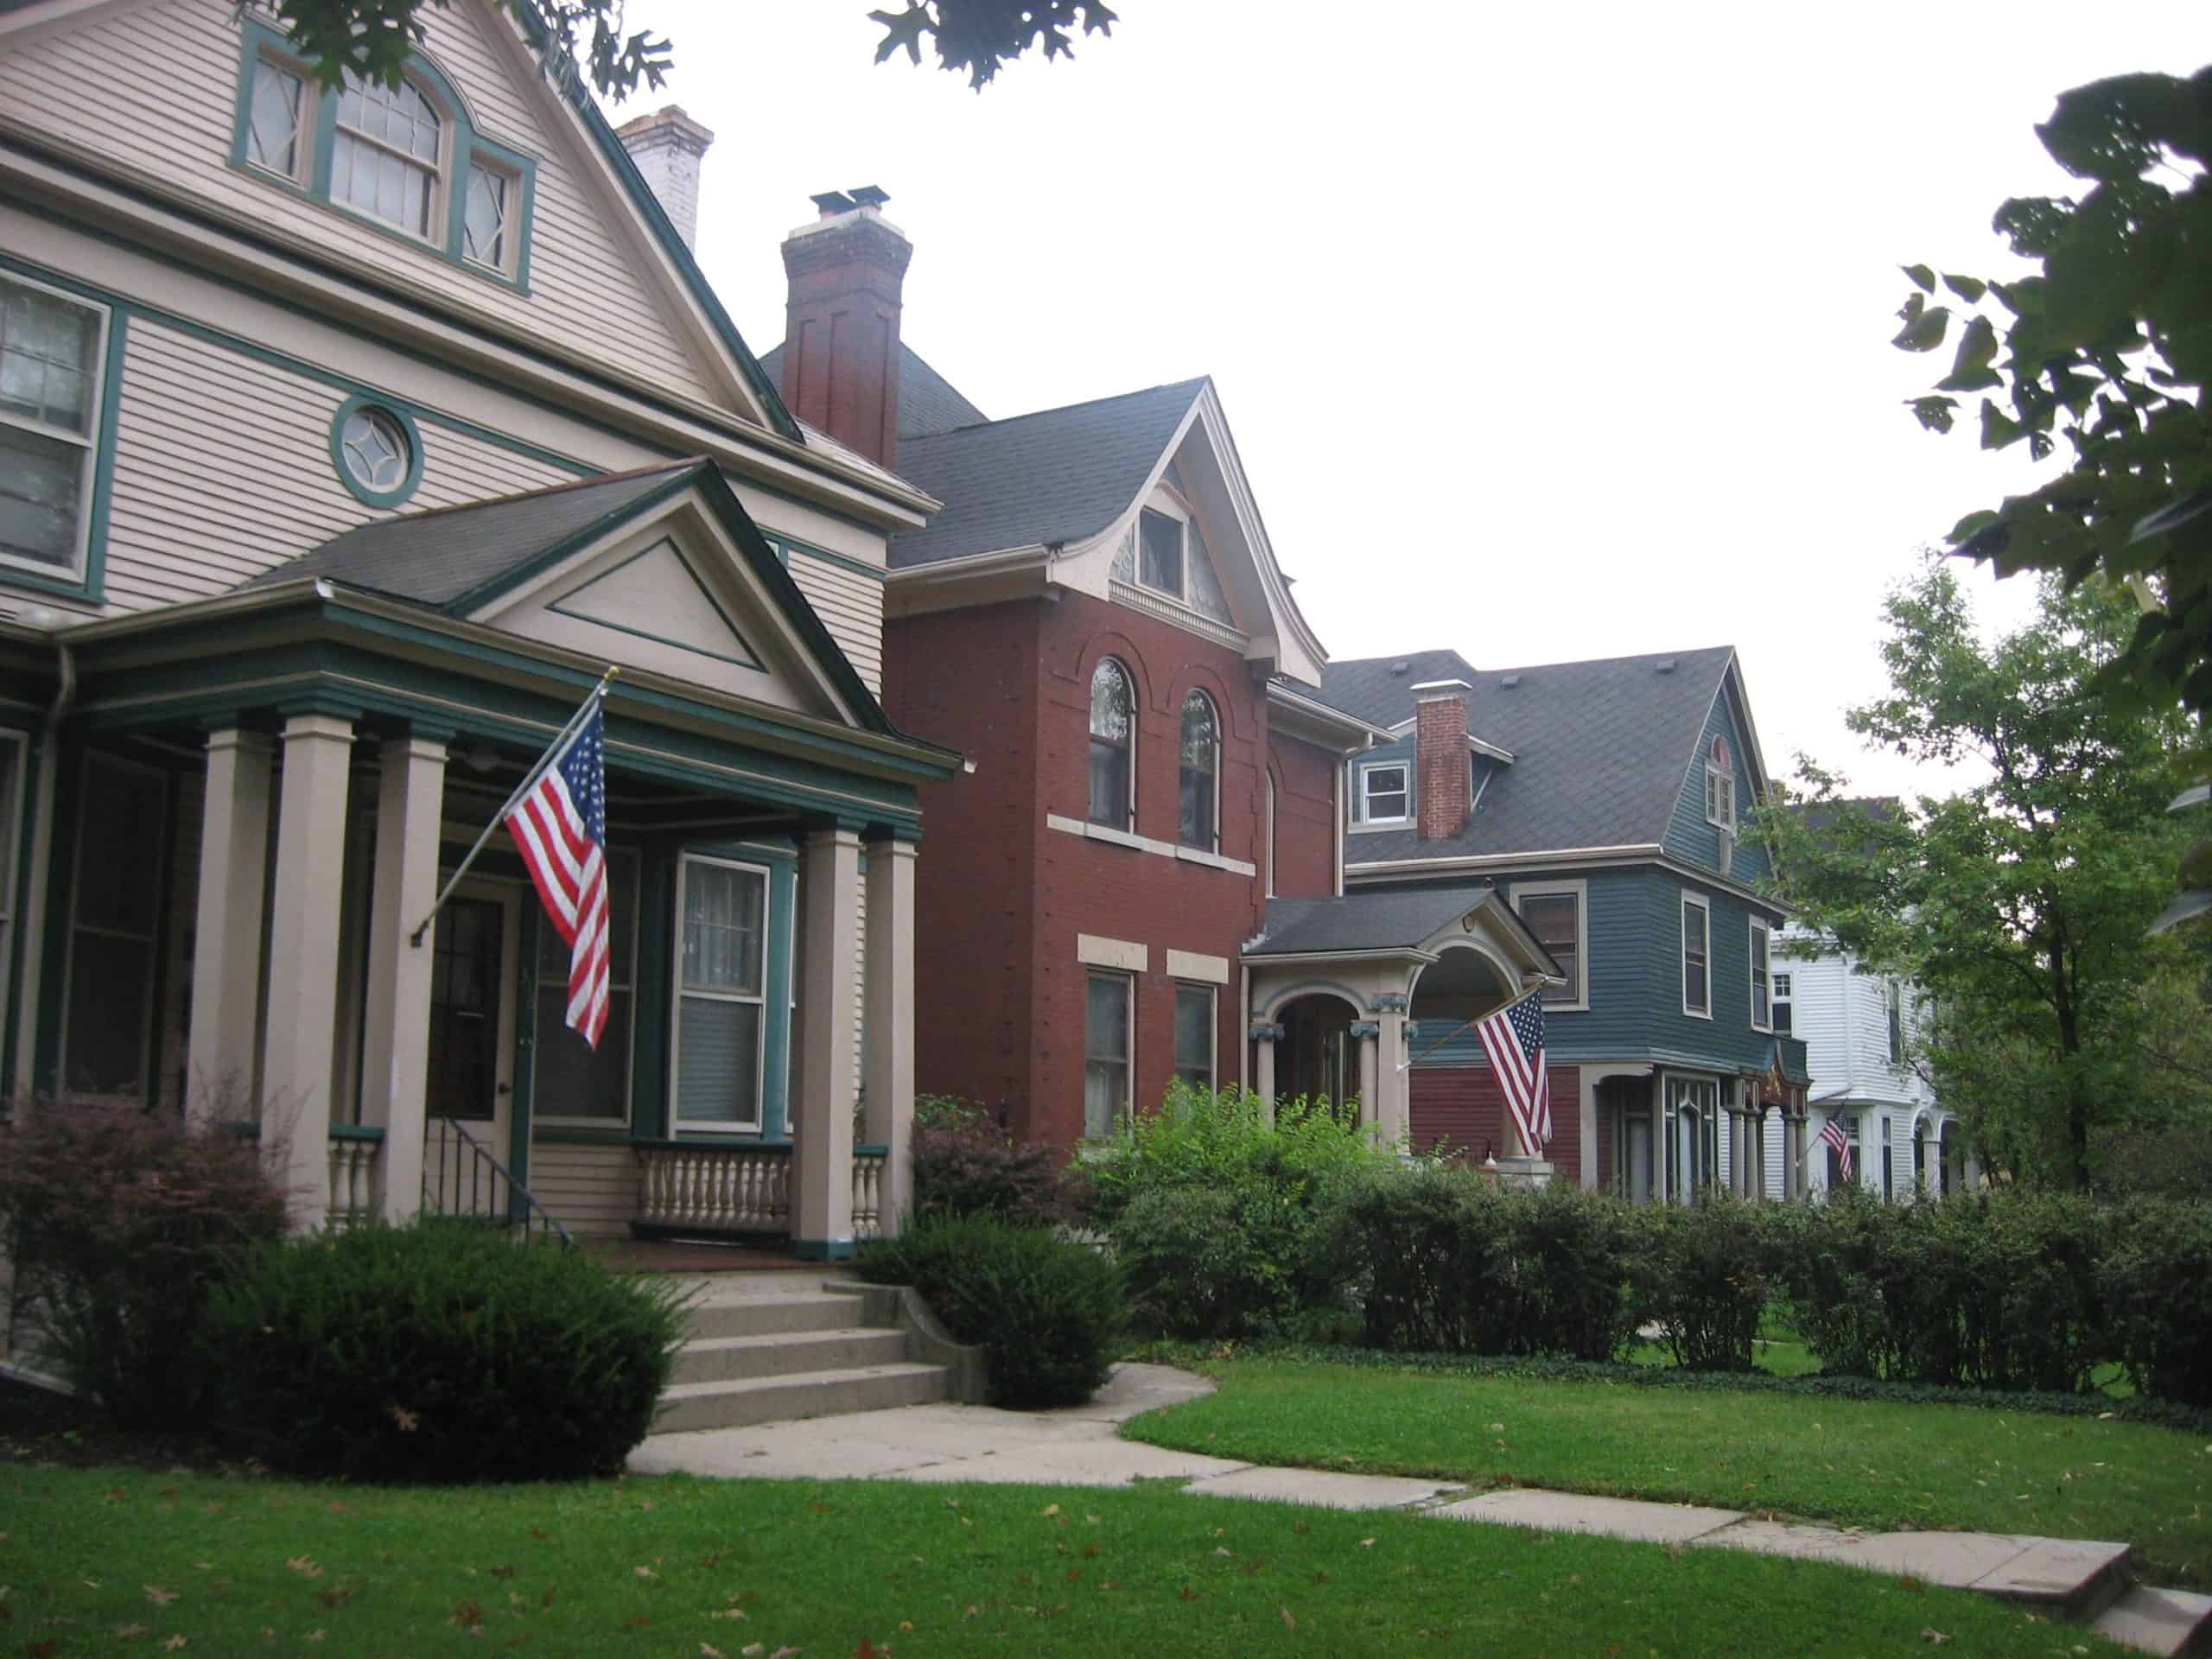
9. Muncie, Indiana
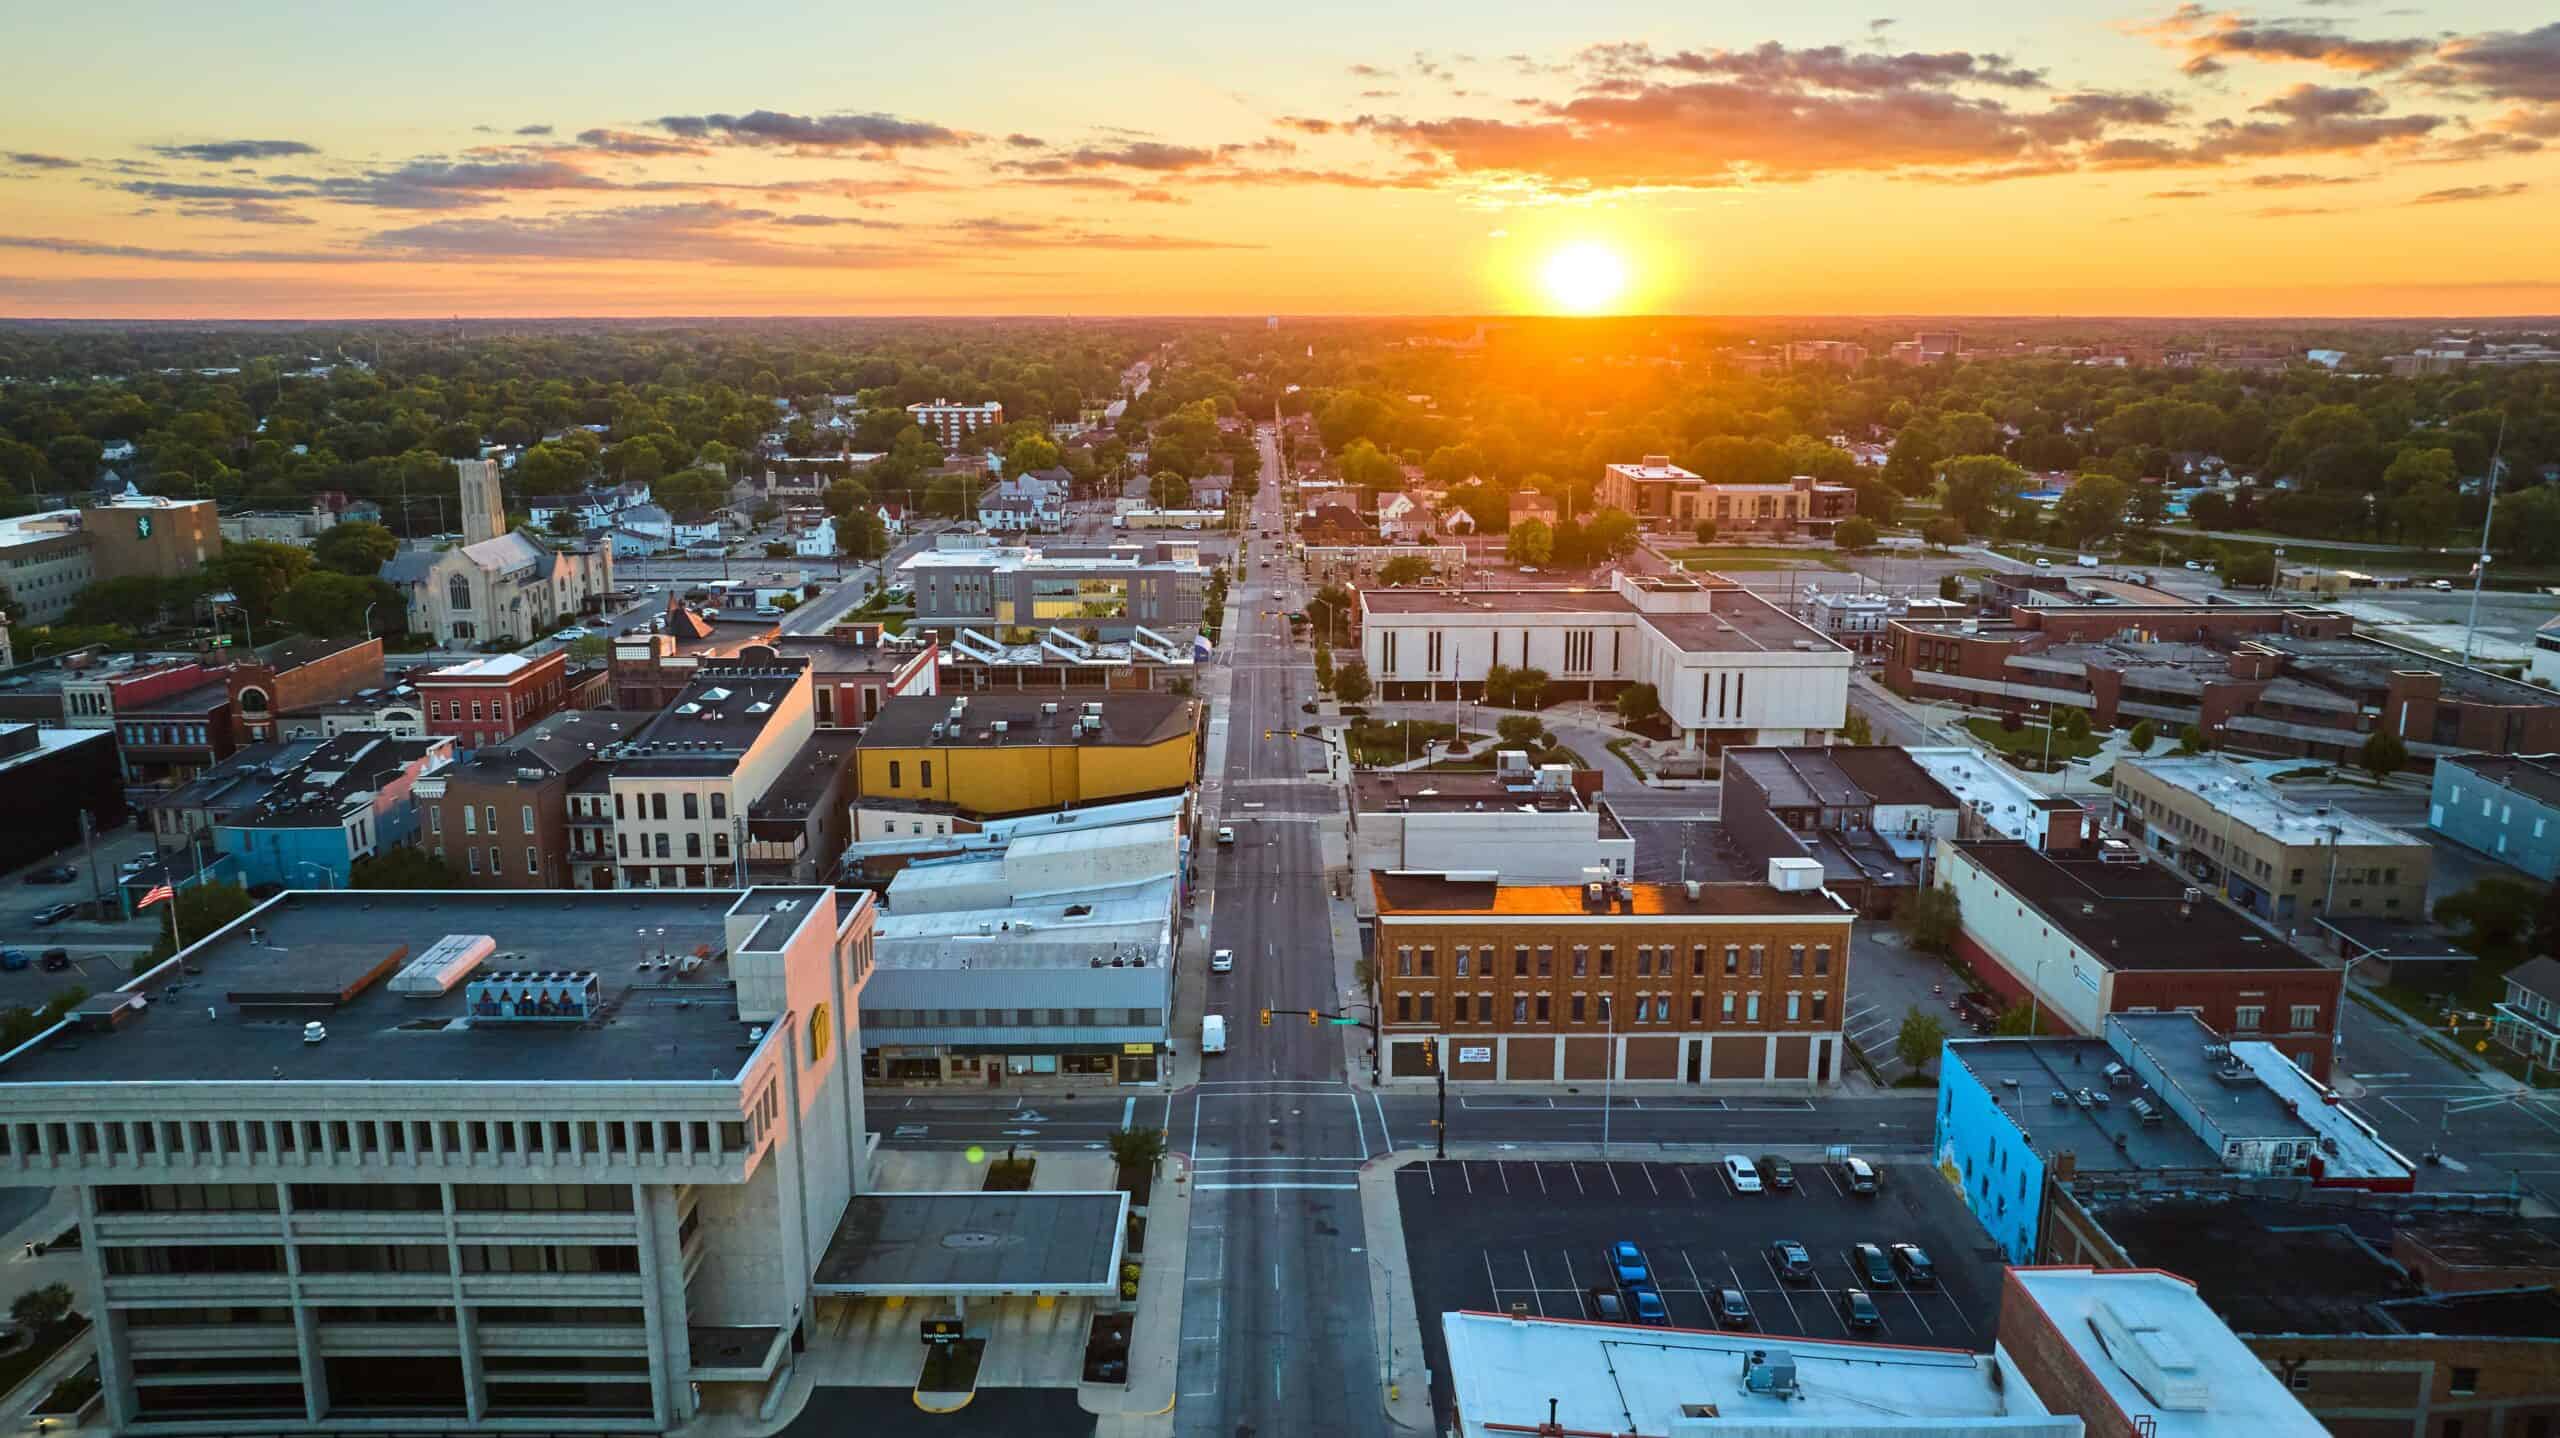
- Local poverty rate in 2023: 29.6%
- Median household income in city: $43,395 ($35,143 less than national median)
- Bachelor’s degree attainment rate in city: 25.7% (9.3 ppts. lower than comparable national rate)
- Five-year avg. unemployment rate in city: 8.6% (3.4 ppts. higher than national jobless rate)
- City population: 64,739
8. Pharr, Texas
- Local poverty rate in 2023: 29.8%
- Median household income in city: $49,884 ($28,654 less than national median)
- Bachelor’s degree attainment rate in city: 17.5% (17.5 ppts. lower than comparable national rate)
- Five-year avg. unemployment rate in city: 6.8% (1.6 ppts. higher than national jobless rate)
- City population: 79,809
7. Bloomington, Indiana
- Local poverty rate in 2023: 30.5%
- Median household income in city: $48,918 ($29,620 less than national median)
- Bachelor’s degree attainment rate in city: 60.0% (25.0 ppts. higher than comparable national rate)
- Five-year avg. unemployment rate in city: 6.2% (1 ppts. higher than national jobless rate)
- City population: 78,791
6. Cleveland, Ohio
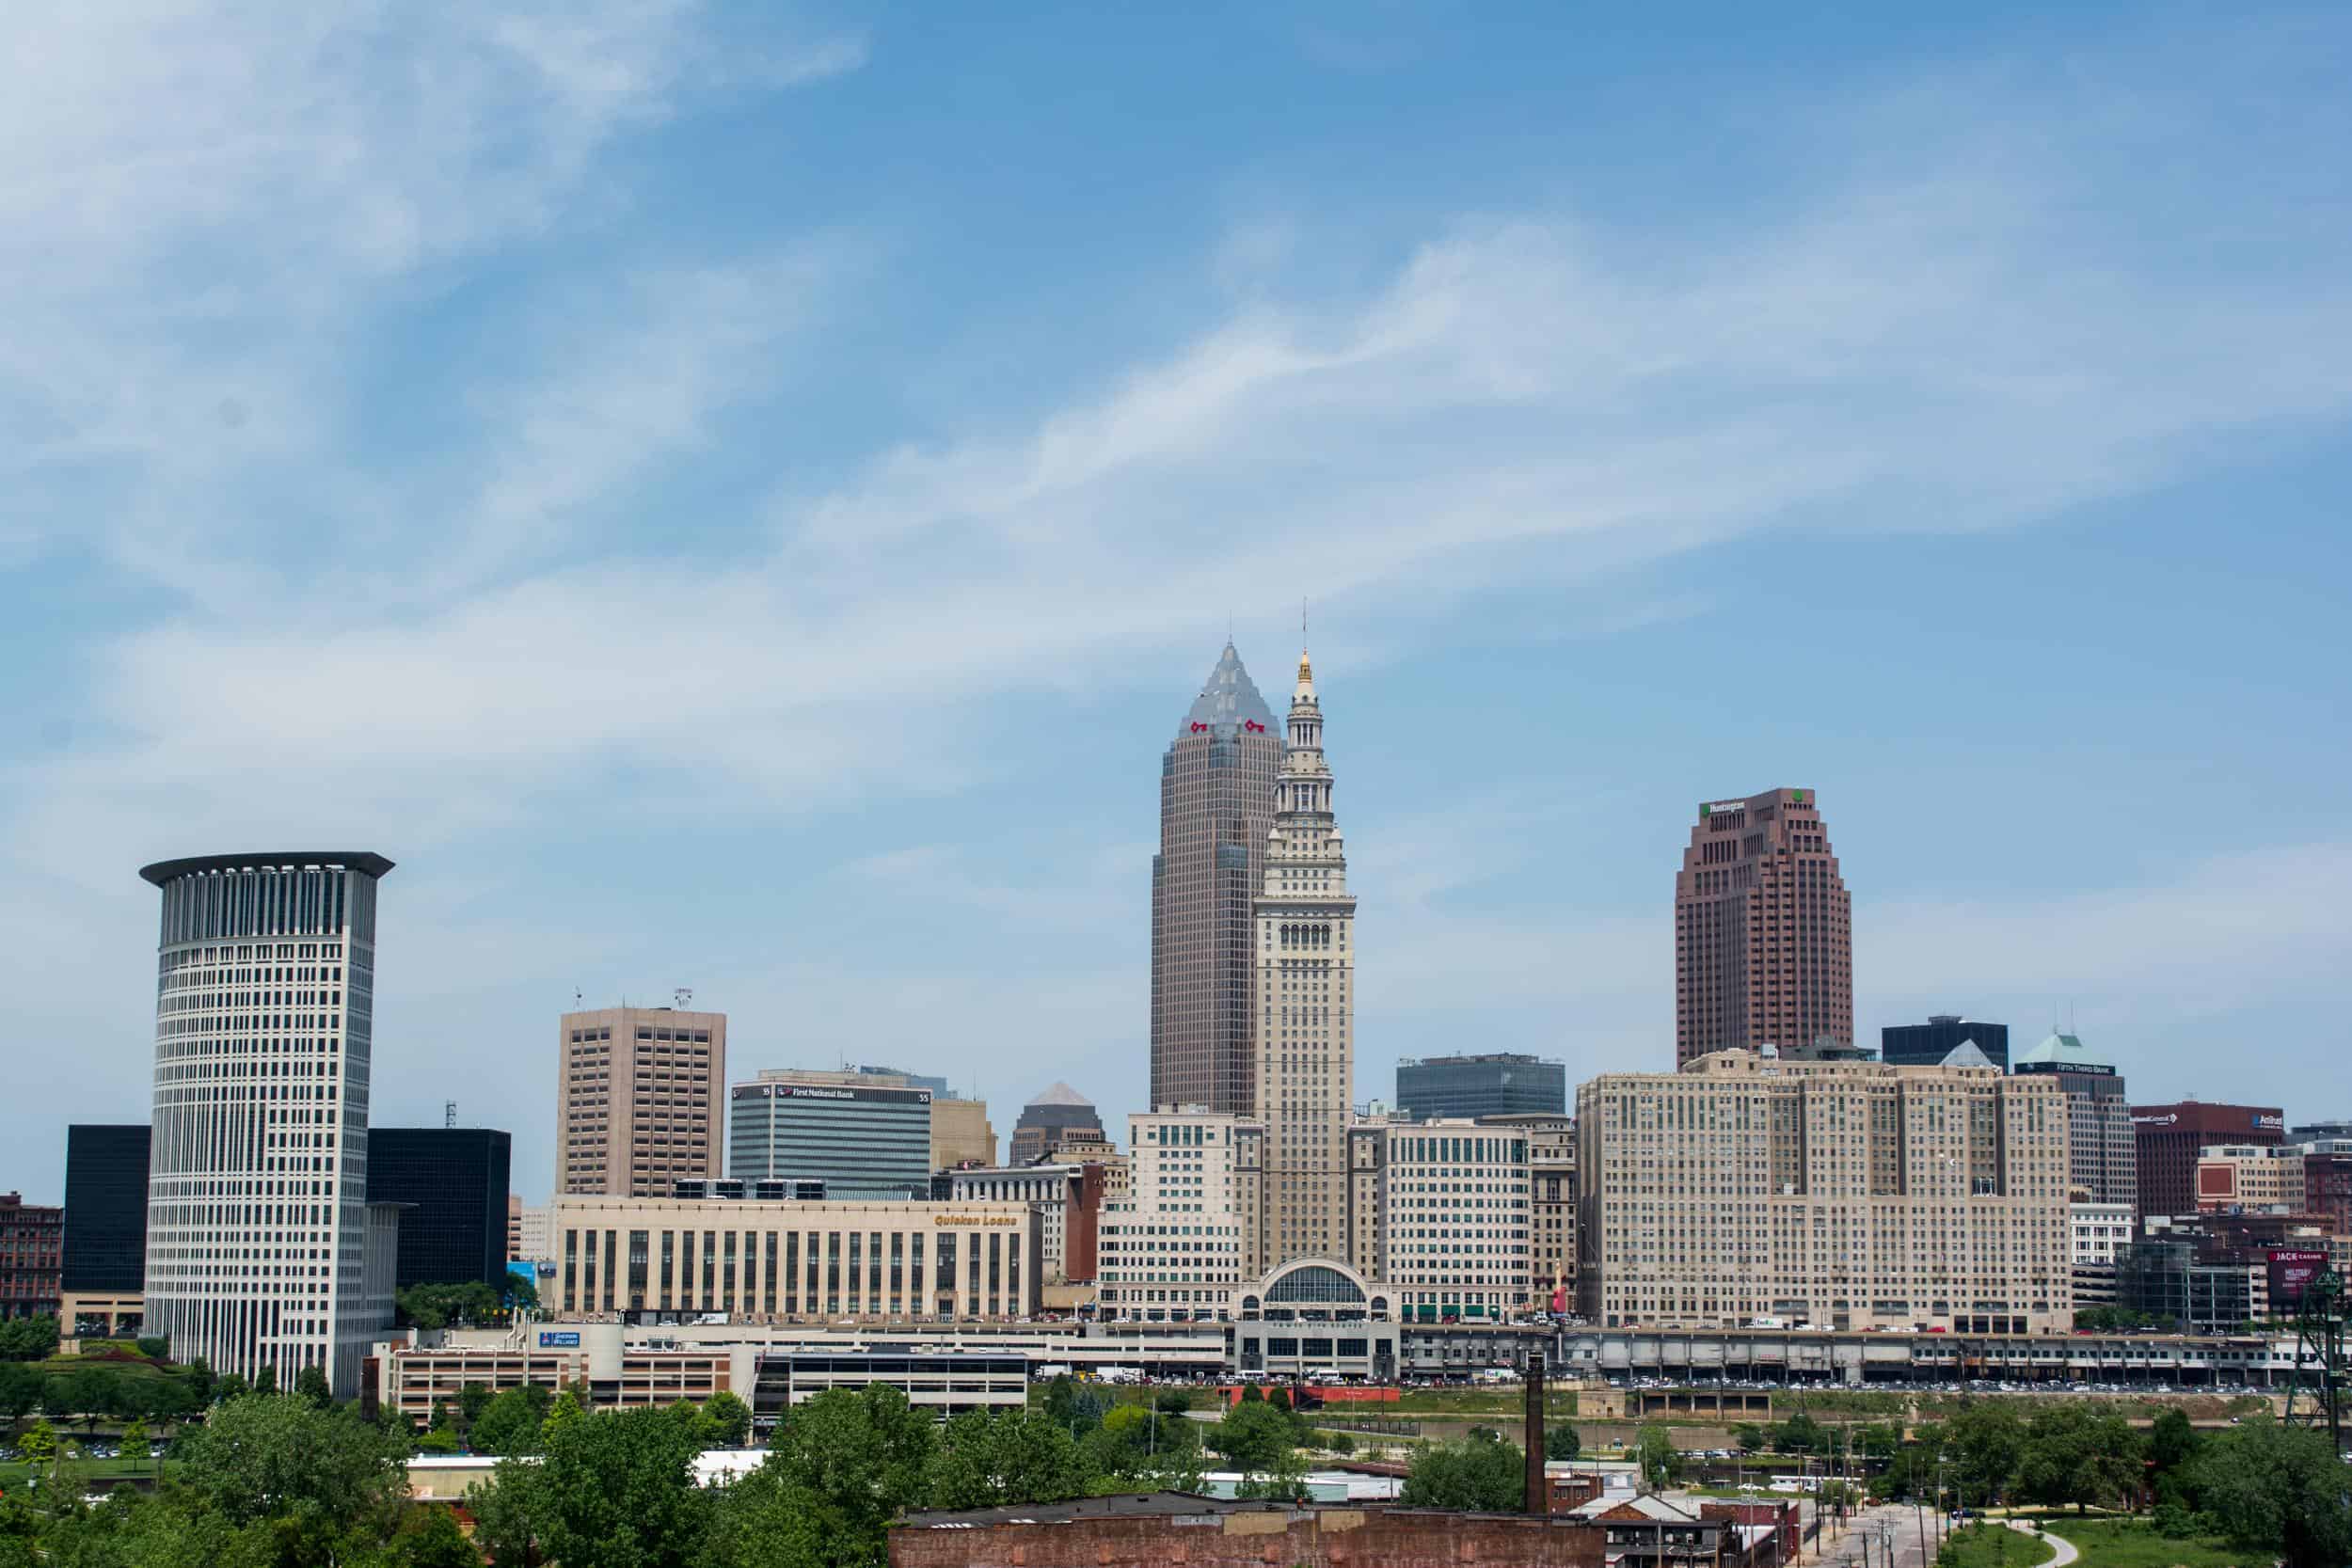
- Local poverty rate in 2023: 30.8%
- Median household income in city: $39,187 ($39,351 less than national median)
- Bachelor’s degree attainment rate in city: 21.3% (13.7 ppts. lower than comparable national rate)
- Five-year avg. unemployment rate in city: 11.5% (6.3 ppts. higher than national jobless rate)
- City population: 367,523
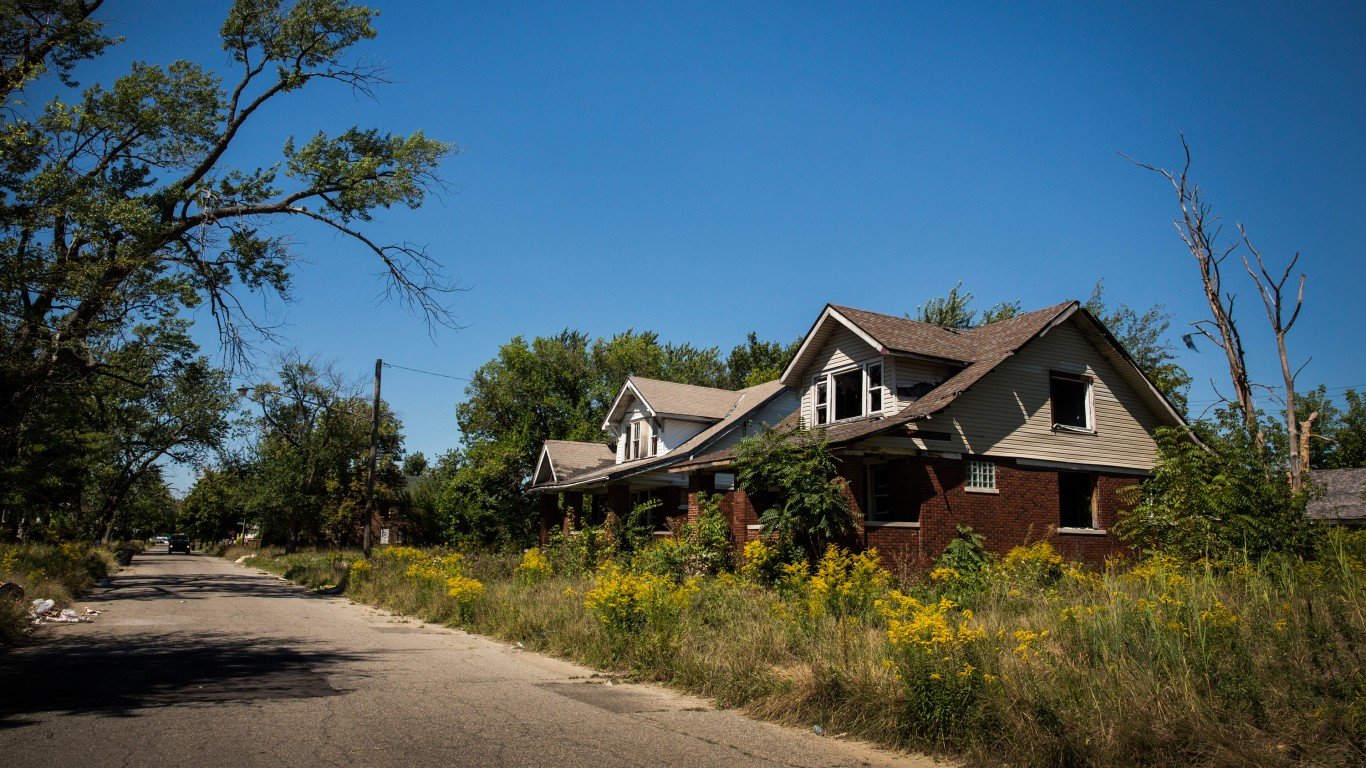
5. Detroit, Michigan
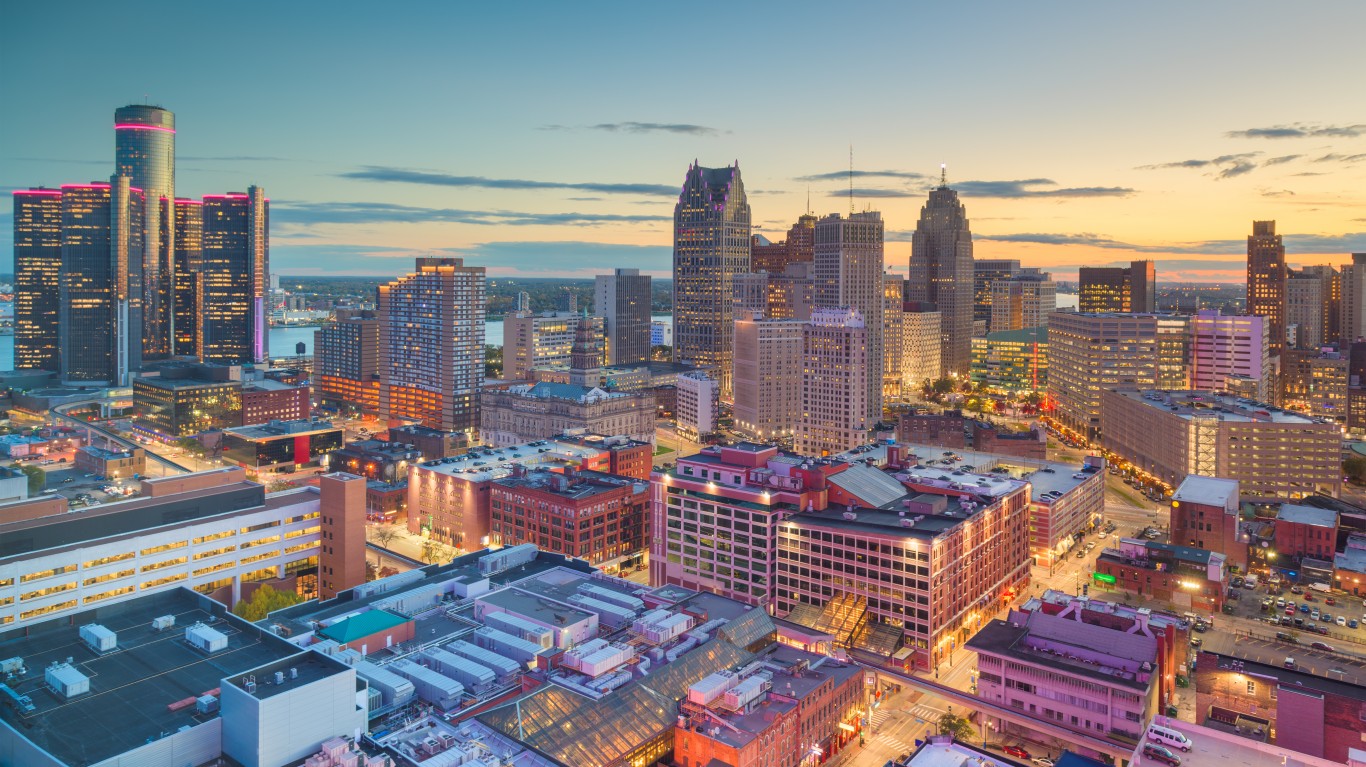
- Local poverty rate in 2023: 31.5%
- Median household income in city: $39,575 ($38,963 less than national median)
- Bachelor’s degree attainment rate in city: 17.6% (17.4 ppts. lower than comparable national rate)
- Five-year avg. unemployment rate in city: 14.1% (8.9 ppts. higher than national jobless rate)
- City population: 636,644
4. New Brunswick, New Jersey

- Local poverty rate in 2023: 31.6%
- Median household income in city: $60,248 ($18,290 less than national median)
- Bachelor’s degree attainment rate in city: 24.0% (11.0 ppts. lower than comparable national rate)
- Five-year avg. unemployment rate in city: 6.5% (1.3 ppts. higher than national jobless rate)
- City population: 55,744
3. Gary, Indiana
- Local poverty rate in 2023: 32.9%
- Median household income in city: $37,380 ($41,158 less than national median)
- Bachelor’s degree attainment rate in city: 14.3% (20.7 ppts. lower than comparable national rate)
- Five-year avg. unemployment rate in city: 13% (7.8 ppts. higher than national jobless rate)
- City population: 68,604
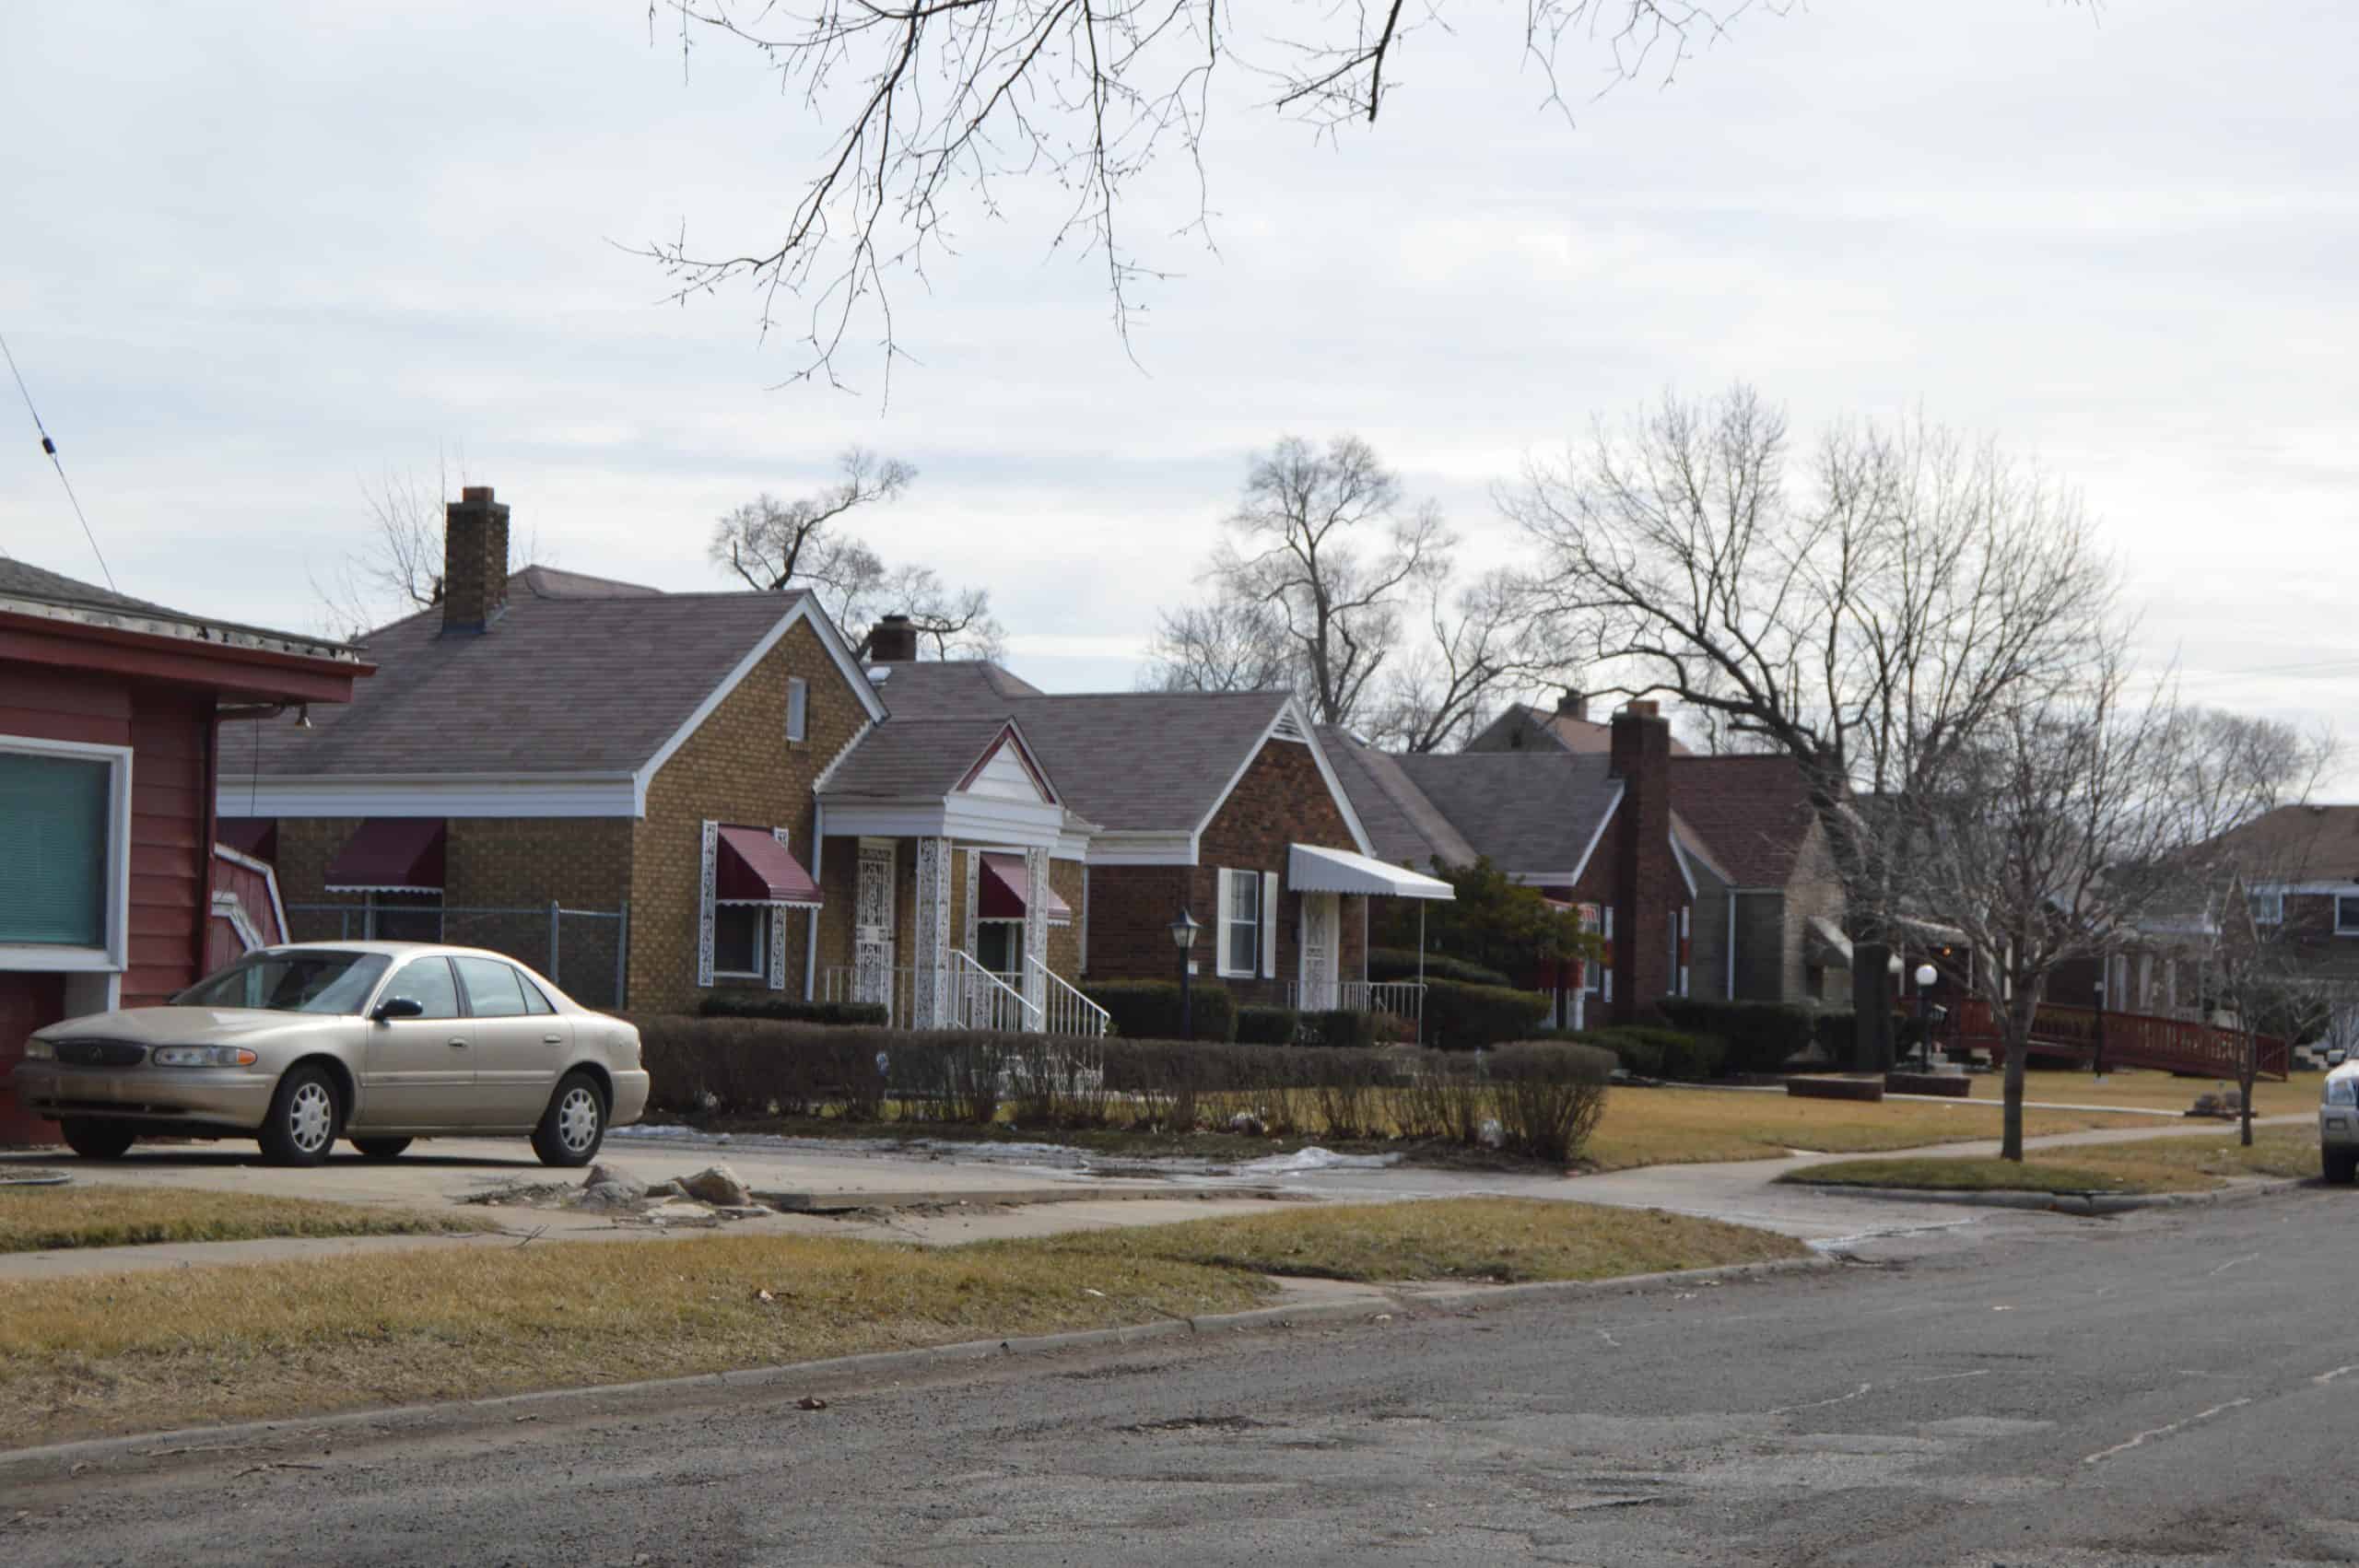
2. Flint, Michigan

- Local poverty rate in 2023: 34.4%
- Median household income in city: $36,194 ($42,344 less than national median)
- Bachelor’s degree attainment rate in city: 13.1% (21.9 ppts. lower than comparable national rate)
- Five-year avg. unemployment rate in city: 17.4% (12.2 ppts. higher than national jobless rate)
- City population: 80,835
1. Youngstown, Ohio

- Local poverty rate in 2023: 36.2%
- Median household income in city: $34,746 ($43,792 less than national median)
- Bachelor’s degree attainment rate in city: 15.2% (19.8 ppts. lower than comparable national rate)
- Five-year avg. unemployment rate in city: 11.9% (6.7 ppts. higher than national jobless rate)
- City population: 59,605
Contact [email protected] for any questions or corrections.